1. Introduction
Digital transformation has become a critical factor of global economic development, playing a key role in enhancing enterprise innovation, optimizing resource allocation, and improving economic efficiency [
1,
2,
3]. In China, digital transformation supports the national digital economy strategy by integrating advanced technologies such as data, algorithms, and computing power into various business scenarios. This integration fosters high-quality digital economic development and sustainable growth [
4,
5,
6].
However, digital transformation does not always deliver its intended benefits. Recent reports and market analyses reveal instances of underperformance. For example, “Liao Wang” Weekly News pointed out that the performance of enterprises in the digital transformation arena is uneven in 2022. It presented that some enterprises have more plans, but fewer practices “
https://lw.news.cn/2022-02/14/c_1310468941.htm (accessed on 4 May 2024)”. These anomalies not only distort market expectations but also introduce inefficiencies into corporate innovation and investment practices.
A major challenge in addressing these anomalies lies in the lack of quantitative methods to measure and evaluate their presence and impact. Current assessments of digital transformation rely heavily on qualitative analyses. These methods often fail to detect subtle but systemic issues, such as inflated digital disclosures or inefficient investment patterns. The absence of robust quantitative metrics limits the ability of stakeholders to recognize and mitigate these challenges effectively.
Developing quantitative measures for digital transformation anomalies is both necessary and meaningful. First, such measures help investors evaluate corporate performance, reducing information asymmetry and protecting their interests. Second, such measures can guide regulatory bodies and policymakers in fostering a more transparent and equitable capital market, which is essential for sustainable and high-quality economic development. This study addresses the gap by quantifying DDAs and examining their implications for corporate innovation efficiency, thereby contributing to the sustainability and high-quality growth of the digital economy.
2. Literature Review
Many scholars have explored the factors influencing digital transformation. Externally, a favorable business environment will accelerate digital transformation by attracting government subsidies [
7], and the uncertainty of climate policy will inhibit corporate digital transformation by increasing information asymmetry [
8]. Other influencing factors include local competition [
9], digital infrastructure [
10], and the clustering level of digital services [
11]. Internally, factors include technical founders [
12] and the IT experience of managers [
13].
The implementation of digital transformations by enterprises has a comprehensive self-promotion effect. These effects include improving corporate ESG performance [
14], lifting supply chain management levels [
15], reducing carbon emission intensity [
16], narrowing the gap between management and ordinary employees [
17], green innovation [
18], etc. Research on the role of digital transformation in corporate innovation has attracted the attention of many scholars, because innovation is the core driving force for enterprise development [
19,
20]. The findings indicate that firm digitalization can promote firm innovation. Furthermore, higher digital industrialization levels in a region enhance the marginal innovation efficiency of nearby firms through a “competitive effect” [
21].
The current measurement method for the digital transformation level of listed companies mainly relies on word frequency calculations of related “words” in the annual reports of listed companies [
22], and some also include digital personnel or digital-related input and output data for improvement. In fact, the digital word frequency calculation in the annual report can be considered as “what they said” while the digital personnel or digital-related inputs can be considered as “how they did” [
23]. These two behaviors are not completely consistent in reality. Text analysis is crucial for identifying inconsistencies, especially within the context of DDAs. Analyzing textual data from annual reports helps detect gaps between corporate statements and actual behavior [
24].
Many previous studies have focused on the phenomenon of “inconsistency between words and deeds” in information disclosure. Their topics include “management tone manipulation”, where the management tone deviates from corporate fundamentals [
25]. Advanced natural language processing (NLP) techniques are used to capture the identification of patterns in management tone, contextual sentiment, and even hidden biases in corporate communication [
26]. Scholars believe that financing needs [
27], earnings management [
28], and market pressure [
29] are vital reasons behind tone anomalies. Other studies have examined inconsistencies in disclosures of corporate social responsibility [
30,
31], green development [
32], and investment efficiency [
27], finding that such disclosure strategies are structurally disordered and are rejected by investors and regulators.
The relationship between corporate innovation and digital transformation has been widely studied. At the corporate level, Xue [
33] suggests that digital transformation promotes green technology innovation. At the regional level, green innovation is considered critical for improving digital infrastructure across China [
18]. Previous studies mainly explore how digital transformation influences innovation and the methods used to analyze this impact.
From the review of the literature above, it is not difficult to find that current research on corporate digital transformation primarily focuses on the influencing factors and their effects as well as the effect between digital transformation itself and innovation. However, there is a lack of enough attention being paid to the phenomenon of “inflated” digital information disclosure, namely, digital disclosure anomalies (which will be called DDAs in this paper), in the market. The following discussion will construct a measurement method for DDA, and based on the “Saying is Believing” theory, analyze the impact of listed companies’ DDA on corporate innovation efficiency and the methodology.
Therefore, the contributions of this paper include (1) developing a new way to measure the difference between what companies say about their digital transformation and what they actually do; (2) using the “Saying is Believing” theory to research the abnormal phenomenon of corporations “talking more than doing” and providing an explanation; (3) studying the impact of DDAs on corporate innovation efficiency through two mechanisms.
3. Theoretical Analysis
Symbol management theory [
34] proposes that communicators may adjust the information they convey according to the preferences of their audience. Moreover, during the communication process, the communicator’s own views and memories are also influenced. While providing biased information, communicators will begin to believe what they are conveying, even if the information-related events did not occur [
35]. This is the “Saying is Believing” (SIB) effect. Influential factors like communication goals, feedback and the relationship of the communicator will induce the SIB effect [
36]. The SIB effect has been confirmed in psychology [
37] and marketing [
38]. Psychological research has found that when people are in a positive emotional state, they tend to make optimistic decisions [
39], which may lead to managers’ overconfidence. Managers will be overconfident when they believe the digital programs have been accomplished by the SIB effect, and they will overestimate the returns of their investment projects and the costs of external financing [
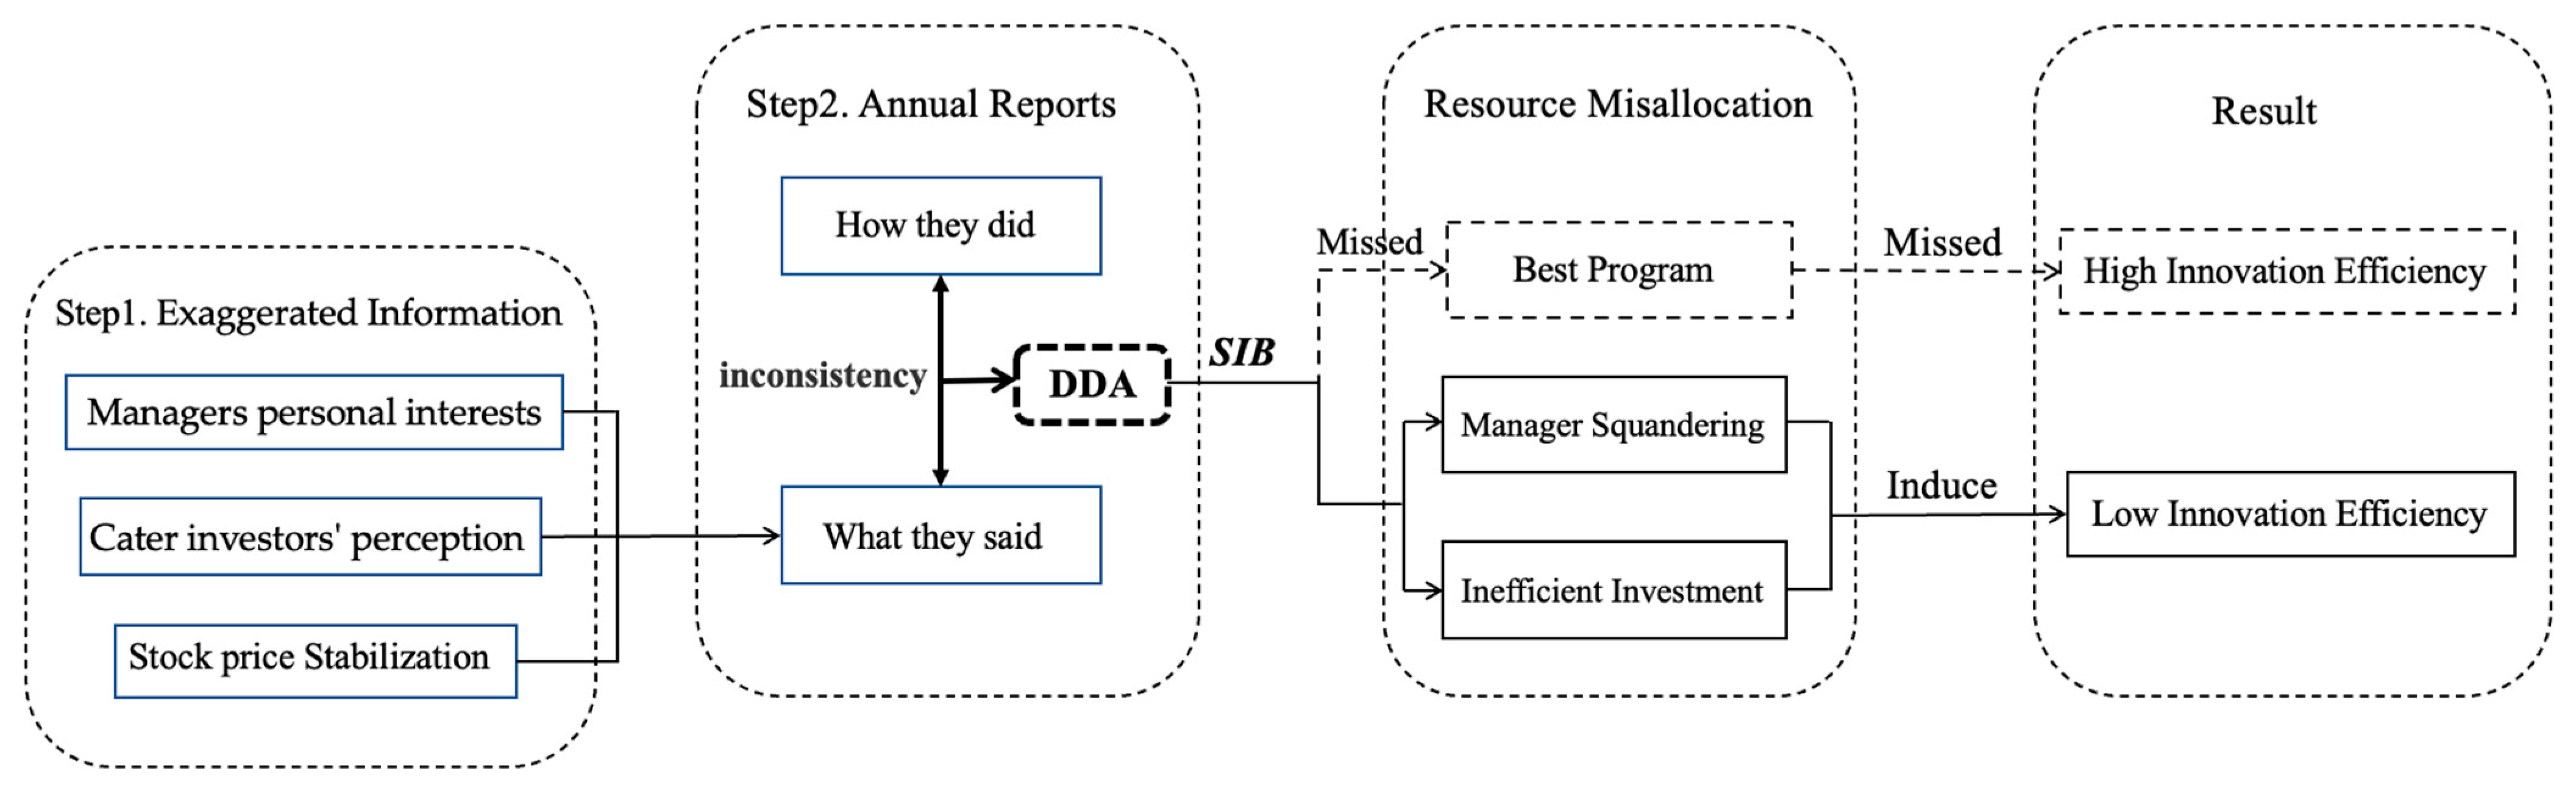
40], which may lead to resource distortions. The flow chart demonstrating how DDAs influence corporate innovation efficiency is presented in
Figure 1 below.
The stock market is essentially an “information market”. Listed companies disclose corporate operating information through annual reports and other channels. Investors predict company profitability based on the collection and analysis of this information [
41]. According to the SIB effect, public company DDA is a two-step process. First, corporations generate exaggerated information. Digital transformation is a key indicator of modern enterprise competitiveness, and the digital information disclosed by the company will affect investors’ perceptions and the company’s stock price. Companies will send positive signals to the market by emphasizing their digital achievements, trying to highlight their future growth potential and industry leadership.
Additionally, management may be driven by personal interests, cater to investors’ expectations and maybe over-promoting digital achievements to stabilize stock prices. Because of these motivations, listed companies may “hollow reputation without basis” into digital information disclosure, which creates DDA information. Second, corporations disclose overvalued digital-related information. Through information disclosure methods such as annual reports, listed companies disclose whitewashed digital information after many internal meetings about digital transformation disclosure. According to the SIB effect, managers not only believe the information they disclose [
42], but they also become overconfident. This overconfidence will lead them to overestimate the return of other programs [
43,
44].
Because of SIB effect, overconfident managers think they have achieved what they promised in their annual reports. Additionally, they overestimate the returns of other programs and move innovation resources away from the digital program they mentioned based on their beliefs. The blind spot of this decision is based on overly positive information, which may lead to resource misallocation and results in the inability of enterprises, ultimately inhibiting the innovation efficiency of enterprises and affecting their sustainable development [
45]. Thus, we propose our first hypothesis:
H1. DDA has a long-term negative effect on corporate innovation efficiency.
As shown in
Figure 1, the SIB effect contributes to resource misallocation, primarily through two channels: the executive squandering effect and the inefficient investment effect.
First, the SIB effect may intensify the executive squandering effect. On the one hand, due to the influence of the SIB effect, corporate managers believe that digital transformation projects have already been completed, leading to the premature release of digital resources and the common overconfidence among management. This exacerbates managers’ rent-seeking behavior, where resources are diverted toward unproductive activities. Such diversion manifests as the emergence of opportunistic behaviors among executives, increased management expenses, and a reduction in innovation efficiency [
46,
47]. On the other hand, the SIB effect may mislead companies to overestimate executive performance, resulting in inflated manger compensation that depletes company resources. This leads to a misallocation of scarce resources. Thus, we propose our second hypothesis:
H2. DDA triggers resource misallocation through the executive squandering effect, thereby reducing innovation efficiency.
Second, the SIB effect may also lead to inefficient investment practices. As corporate managers believe that digital transformation projects have already been completed, by the SIB effect, managers will undoubtedly be overconfident. Meanwhile, management overconfidence may lead to bad performance of the corporations. The released resources that were originally allocated to optimal digital transformation projects may remain idle or be diverted to suboptimal projects, exacerbating the resource curse and contributing to underinvestment [
46]. Thus, we propose our third hypothesis:
H3. DDA induces underinvestment through inefficient investment effects, resulting in resource misallocation and finally reduced innovation efficiency.
4. Materials and Methods
4.1. Data and Sample Selection
This paper selects data about listed Chinese companies from 2013 to 2021, resulting in 21,816 samples after excluding ST companies and financial companies. Digital word frequency is counted with the RESSET text tool from annual reports, where the digital words used for counting word frequency are collected from CSMAR. Digital transformation input data, digital transformation output data, and control variable data are collected from the CSMAR. We also cross validate control variable data from Wind for data robustness. Moreover, CNRDS provides the innovation data. Due to the high proportion of missed digital transformation data in 2022 and 2023 from CSMAR, this paper deletes the samples in 2022 and 2023 in further analyses.
4.2. Variable Selection and Definition
Dependent variable: Corporate innovation efficiency is the dependent variable of this study. Innovation efficiency is calculated using the number of patent applications per unit of R&D investment.
Independent variable: digital disclosure anomalies (DDAs) is the independent variable of this study, which is a binary variable (0 or 1). When DDA equals 1, it means that the listed company’s digital information disclosure level in a given year is much higher than its actual digital transformation efforts. To measure the DDA of companies, we refer the model construction approach suggested by Huang X. [
48] and Lin Wanfa [
49]. We calculate DDA by obtaining the residuals from a regression equation that relates digital word frequency to digital actions (Equation (1)).
where,
, meaning “what they said”, represents the log of the frequency of words about digital project-related terms in annual reports.
and
represent “how they did”.
represents enterprises’ digital investments, including MDADigJob (whether the enterprise has CDO/CTO/CIO or not), Nstinnnbasesaccumulated (whether the enterprise has technological innovation bases), and Innovqual (log of the number of digital innovation recognition projects).
represents digital output, including Iswonaward (whether the enterprise won the national digital prize or not), DigInnStan (whether the enterprise meets the digital innovation standard), Paperjour (the number of digital innovation papers), and Diginvpatautnum (the number of digital invention patent authorizations). Detailed explanations are shown in
Table 1.
The control variables consider the management level and performance of the enterprises, and the explanation of control variables are shown in
Table 1.
and
represent variable coefficients of
period and
period, respectively;
represents company,
represents year,
represents the indicators of digital investment or digital output and
represents province.
is the industry-year fixed effect,
is the province-year fixed effect. The model also handles clustered robust standard errors for companies. Considering that digital programs will last a long time and the stock market responds quickly, the regression only controls t + 1 variables.
represent year-industry fixed effects and year-province fixed effects.
Most importantly, , the residual of the regression, represents the inconsistency between “what they said” and “how they did”. Considering corporations may exaggerate their digital transformation programs, this paper marks the top 10% of residual values as 1, representing DDAs; the rest are marked as 0. In other words, if the difference between a company’s words and deeds is in the top 10%, these companies have DDAs.
After determining the DDA indicators for companies, the following models are used to regress corporate innovation efficiency or innovation levels on DDAs:
Control variables: Based on the research of Lin Wanfa [
34], our control variables contain different dimensions of corporate performance, including corporate operational performance, management performance, and stock performance.
Table 1 presents the control variables used in the model for constructing the DDA indicator and control variables used in the baseline regression. It also presents the dependent variables and independent variable in this paper.
5. Empirical Analysis
5.1. Descriptive Statistics
Table 2 presents the descriptive statistics of the main variables. The mean value of the independent variable, DDA, is 0.1 after data processing. For innovation efficiency (inveff), the median is 0.17, with a standard deviation of 0.65. The minimum value is 0, and the maximum value is 26.5, indicating significant variation among enterprises.
5.2. Baseline Regression
Considering the persistence of the SIB effect, the baseline regression includes corporate innovation efficiency for the current period as well as the subsequent two periods, as presented in Equations (2), (3), and (4), respectively. The first, second, and third columns of
Table 3 respectively present the regression outcomes for corporate innovation efficiency under the conditions of with fixed effects (Equation (2)), for the next period (Equation (3)), and for the next two period (Equation (4)). As shown in
Table 3, the results show that DDAs have a significantly negative effect on corporate innovation efficiency and the effect remains for two periods. Due to the existence of the SIB effect, management will invest more resources to the innovative project which they believe is the most optimal one (but actually is not). Thus, DDA results in a decrease in corporate innovation efficiency, supporting H1.
5.3. Robustness Test
To ensure the robustness of the regression, we use the machine learning regression method instead of the econometric regression method to re-measure the deviation of “What they said” and “How they did” and then generate new DDAs.
Considering that our data encounter the challenges of high-dimensionality and overfitting, the SVR model based on grid-search and cross-validation is chosen to be the machine learning method. On the one hand, the SVR machine learning model shows better performance dealing with high dimension data by using kernel function. On the other hand, through parameter optimization and cross-validation, SVR can avoid overfitting and perform better. It ensures the robustness of model and the reliability of the residuals.
We use the variables in
Table 1 to generate a new DDA and use the new DDA in the baseline regression. For companies above the 90th percentile, the DDA is set to 1, and for those below the 90th percentile, the DDA is set to 0. As shown in
Table 4, the first, second, and third columns of
Table 4, respectively, present the regression outcomes of innovation efficiency for the current period (Equation (2)), the next period (Equation (3)), and the next two periods (Equation (4)). As shown in
Table 4, the results remain significant.
5.4. Endogeneity Analysis
This study may have endogeneity issues. When corporate innovation capacity is unsatisfactory, they will also exaggerate their digital projects in the annual report, which will cause a reverse causality issue. To ensure the reliability of the research conclusions, this paper will use the two-stage instrumental variable method, which is shown in Column 1 and Column 2 in
Table 5.
Considering the “bellwether effect”, enterprises are influenced by the performance of neighboring leading enterprises, eventually leading to DDAs. Meanwhile, corporate innovation efficiency is not related to the leading corporate DDAs. Thus, this paper selected the average DDA level of the top 20 enterprises with the largest business scale in this province as our instrumental variable. As shown in
Table 5, with the AR Test and Wald Test, the instrumental variable used in the model is not a weak instrumental variable. The results of the Second Stage in column 2 show that the coefficient for innovation efficiency is significantly negative, which solves the reverse causality issue.
Meanwhile, it is the enterprise itself that decides to launch digital transformation or not, which may cause sample selection bias. Thus, we employ the Heckman test to ensure the result, which is shown in Columns 3 and 4 in
Table 5. In the Heckman test, the first stage will create a new variable, Inverse Mill’s Ratio (IMR), to identify sample selection bias. The coefficient of IMR indicates that the model does not actually suffer from sample selection bias.
5.5. Heterogeneity Analysis
Considering that supervision will influence corporate disclosures in annual reports, this paper also analyzes the impact of DDA on innovation efficiency under conditions of external supervision or internal supervision.
For external supervision, this paper classifies companies into state-owned and non-state-owned enterprises, where state-owned enterprises are associated with stronger external supervision by the State-Owned Assets Supervision and Administration Commission [
50]. The results in
Table 6 show that the coefficient for non-state-owned enterprises is significantly negative, while that for state-owned corporations is not. This suggests that state-owned enterprises, with stricter external supervision, are less affected by the SIB effect. In contrast, non-state-owned enterprises are more prone to resource misallocation due to weaker external oversight.
For internal supervision, the analysis uses the controlling shareholder’s shareholding proportion. A higher shareholding ratio is associated with weaker internal supervision, as the controlling shareholder possesses complete authority in decision-making [
51]. Corporations are grouped into two categories (0 or 1) based on the median shareholding ratio of the largest shareholder. Companies with a shareholding ratio above the 50th percentile are marked as 1, while those below the 50th percentile are marked as 0. The results in
Table 7 indicate that, for companies with a high shareholding ratio of the controlling shareholder, the negative effect of DDAs remains significant and persists for two periods, exacerbating resource misallocation due to weak internal supervision. In contrast, for companies with a low shareholding ratio of the controlling shareholder, the negative effect of DDA on innovation efficiency is not significant.
6. Further Analysis
This section examines the executive squandering effect and inefficient investment effect caused by DDA and their implications for corporate innovation efficiency. First, to test managerial rent-seeking behavior and compensation misallocation, this study uses the administrative expense ratio and standardized executive compensation levels as dependent variables. Additionally, to evaluate the inefficient investment effect of management, investment efficiency is measured using the absolute value of residuals derived from the Richardson [
52] investment model. For negative residuals, larger absolute values indicate stronger underinvestment. The absolute values of residuals from negative residual samples are used as dependent variables.
As shown in
Table 8, DDAs significantly increase the administrative expense ratio and executive compensation, indicating that DDA fosters managerial rent-seeking behavior and inflated executive compensation. When corporations mistakenly believe that they had already done what they said in the annual report, the managers’ compensation will be wrongly increased by the inflated performance of digital programs, and the rent-seeking behavior will expand among management because of idle resources. These findings suggest that DDAs induce the manager squandering effect, wherein limited and valuable corporate resources are misallocated to satisfy managerial interests rather than organizational goals. The misallocation not only compromises resource utilization but also reduces innovation efficiency by redirecting resources away from value-generating activities, thereby supporting H2.
Moreover, DDAs significantly exacerbate underinvestment, as digital transformation projects may be mistakenly perceived as complete. This misperception leaves company resources idle or diverted to suboptimal digital activities, leading to resource misallocation. Furthermore, resource misallocation reduces the budget and productive investments allocated to the organization’s innovation activities, affecting corporate innovation efficiency. Specifically, resource allocation may lead to underinvestment in innovation projects that should be the key factor of a company’s sustainable growth and competitiveness [
53]. Therefore, by exacerbating underinvestment of these critical innovation projects, DDAs indirectly decrease corporations’ innovation efficiency. Such misallocation diminishes the organization’s innovation activities budget and productive investments, ultimately impairing corporations’ innovation efficiency and supporting H3.
These results emphasize the need for companies undergoing digital transformation to implement robust monitoring mechanisms and strategic resource allocation frameworks. By addressing managerial rent-seeking behavior and ensuring accurate assessment of digital transformation progress, corporations may avoid resource squandering and underinvestment. Doing so may optimize resource use and enhance innovation efficiency, which is critical for sustaining a competitive advantage in a digitally-driven market environment.
7. Conclusions
This paper uses data from 2013 to 2021 to measure DDAs and analyzes the relationship between DDAs and innovation efficiency. It finds that, due to the SIB theory, companies tend to think they have accomplished what they disclosed in their annual reports. This “exaggeration” result leads to overconfident management. It also results in resource misallocation through two main channels, the manager squandering effect and the inefficient investment effect, which ultimately impairs corporate innovation efficiency. The manager squandering effect occurs when DDAs lead to a premature release of digital transformation resources, fostering rent-seeking behaviors among overconfident executives. The inefficient investment effect occurs when DDA fosters underinvestment as overconfident managers mistakenly perceive digital projects as complete by SIB theory, leaving resources idle or allocating them to inefficient projects. In our heterogeneity analysis, DDA shows a negative effect on non-stated-owned enterprises and low shareholding proportion of the controlling shareholder enterprises. Thus, DDA is detrimental to corporate innovation development and will lay a ticking time bomb that undermines innovation capabilities and sustainable development.
Based on our research, we have four suggestions for different parts of the financial market to meet the sustainable development of digital market. For investors, we suggest improving their ability to identify and analyze corporate disclosures, especially those with a cross-period nature. For market supervisors, we suggest adopting a “memorial supervision” method, which means continuously tracking and recording the disclosure of corporate digital project information over the years, to ensure that companies do not yield DDAs and to persistently safeguard the market’s sustainability. For corporations, we suggest establishing robust internal governance structures to monitor and evaluate digital transformation progress. This structure should include an independent audit department responsible for reviewing the consistency between digital transformation plans and actual investments. Such measures can help mitigate the risks of DDAs and reduce the unexpected influence of the largest shareholder. For analysts, paying more attention on the inconsistency between “what they said” and “how they did” will provide deeper insights into the corporate performance and figure out uncover potential risks related to digital transformation.
Future studies could explore deeper into refining the measurement of DDAs, considering the evolving nature of digital transformation and disclosure practices. Additionally, exploring the relationship between DDAs and broader organizational behaviors, such as corporate governance or cultural factors, could yield valuable insights. At the meantime, this study has certain limitations. First, the generalizability of findings may be constrained by focusing only on listed companies, potentially overlooking private firms or SMEs where DDA might manifest differently. Second, while this paper identifies key mechanisms such as the manager squandering effect and inefficient investment effect, there may be other underlying mechanisms through which DDA impacts corporate innovation efficiency that remain unexplored. Third, due to significant data omissions related to innovation and digital transformations from 2022 to 2024, this study excludes these years from the analysis, making the data less timely. Addressing these gaps could significantly enrich the understanding of DDA and its broader implications.
Author Contributions
Conceptualization, Z.Z., Y.F., X.L. and L.J.; methodology, Z.Z., Y.F. and X.L.; software, Z.Z.; validation, Z.Z. and Y.F.; formal analysis, Z.Z.; resources, Z.Z.; data curation, Z.Z.; writing—original draft preparation, Z.Z.; writing—review and editing, Z.Z. and Y.F.; visualization, Z.Z.; supervision, Y.F.; project administration, Y.F. All authors have read and agreed to the published version of the manuscript.
Funding
This research was funded by “the Fujian Key Laboratory of Financial Information Processing (Putian University), grant number NO. JXC202204”; and the General Project of Shanghai Philosophy and Social Science Planning (Project No. 2024BJB012).
Institutional Review Board Statement
Not applicable.
Informed Consent Statement
Not applicable.
Data Availability Statement
Dataset available on request from the corresponding authors.
Conflicts of Interest
The authors declare no conflicts of interest.
References
- Liu, H.; Wang, P.; Li, Z. Is there any difference in the impact of digital transformation on the quantity and efficiency of enterprise technological innovation? Taking China’s agricultural listed companies as an example. Sustainability 2021, 13, 12972. [Google Scholar] [CrossRef]
- Li, J.; Peng, Z. Impact of Digital Villages on Agricultural Green Growth Based on Empirical Analysis of Chinese Provincial Data. Sustainability 2024, 16, 9590. [Google Scholar] [CrossRef]
- Du, X.; Zhang, H.; Han, Y. How does new infrastructure investment affect economic growth quality? Empirical evidence from China. Sustainability 2022, 14, 3511. [Google Scholar] [CrossRef]
- Corejova, T.; Chinoracky, R. Assessing the potential for digital transformation. Sustainability 2021, 13, 11040. [Google Scholar] [CrossRef]
- Nahavandi, S. Industry 5.0—A human-centric solution. Sustainability 2019, 11, 4371. [Google Scholar] [CrossRef]
- Bican, P.M.; Brem, A. Digital business model, digital transformation, digital entrepreneurship: Is there a sustainable “digital”? Sustainability 2020, 12, 5239. [Google Scholar] [CrossRef]
- Luo, Y.; Cui, H.; Zhong, H.; Wei, C. Business environment and enterprise digital transformation. Financ. Res. Lett. 2023, 57, 104250. [Google Scholar] [CrossRef]
- Mo, Y.; Liu, X. Climate policy uncertainty and digital transformation of enterprise—Evidence from China. Econ. Lett. 2023, 233, 111377. [Google Scholar] [CrossRef]
- Hua, Z.; Yu, Y. Digital transformation and the impact of local tournament incentives: Evidence from publicly listed companies in China. Financ. Res. Lett. 2023, 57, 104204. [Google Scholar] [CrossRef]
- Tian, X.; Lu, H. Digital infrastructure and cross-regional collaborative innovation in enterprises. Financ. Res. Lett. 2023, 58, 104635. [Google Scholar] [CrossRef]
- Liu, H.; Shi, Y.; Sun, B.; Yang, X. Agglomeration of the Digital Services Industry and Digital Transformation: Evidence from China. Emerg. Mark. Financ. Trade 2024, 60, 855–869. [Google Scholar] [CrossRef]
- Li, Z.G.; Wu, Y.; Li, Y.K. Technical founders, digital transformation and corporate technological innovation: Empirical evidence from listed companies in China’s STAR market. Int. Entrep. Manag. J. 2023, 20, 3155–3180. [Google Scholar] [CrossRef]
- Pan, X.; Xu, G. The impact of managers’ IT experience on the enterprises’ digital transformation: Empirical evidence from China. Appl. Econ. 2023, 56, 3652–3668. [Google Scholar] [CrossRef]
- Zhao, X.; Cai, L. Digital transformation and corporate ESG: Evidence from China. Financ. Res. Lett. 2023, 58, 104310. [Google Scholar] [CrossRef]
- Li, Z.; Zhang, X.; Tao, Z.; Wang, B. Enterprise digital transformation and supply chain management. Financ. Res. Lett. 2024, 60, 104883. [Google Scholar] [CrossRef]
- Shang, Y.; Raza, S.A.; Huo, Z.; Shahzad, U.; Zhao, X. Does enterprise digital transformation contribute to the carbon emission reduction? Micro-level evidence from China. Int. Rev. Econ. Financ. 2023, 86, 1–3. [Google Scholar] [CrossRef]
- Li, M.; Jiang, A.; Ma, J. Digital transformation and income inequality within enterprises–Evidence from listed companies in China. Pac.-Basin Financ. J. 2023, 81, 102133. [Google Scholar] [CrossRef]
- Yang, C.; Liu, Q. Driving Green Innovation Through Digital Transformation: Empirical Insights on Regional Variations. Sustainability 2024, 16, 10716. [Google Scholar] [CrossRef]
- Heirman, A.; Clarysse, B. Which tangible and intangible assets matter for innovation speed in start-ups? J. Prod. Innov. Manag. 2007, 24, 303–315. [Google Scholar] [CrossRef]
- Kuester, S.; Konya-Baumbach, E.; Schuhmacher, M.C. Get the show on the road: Go-to-market strategies for e-innovations of start-ups. J. Bus. Res. 2018, 83, 65–81. [Google Scholar] [CrossRef]
- Li, S.; Gao, L.; Han, C.; Gupta, B.; Alhalabi, W.; Almakdi, S. Exploring the effect of digital transformation on Firms’ innovation performance. J. Innov. Knowl. 2023, 8, 100317. [Google Scholar] [CrossRef]
- Dang, M.; Puwanenthiren, P.; Nguyen, M.T.; Hoang, V.A.; Mazur, M.; Henry, D. Does managerial tone matter for stock liquidity? Evidence from textual disclosures. Financ. Res. Lett. 2022, 48, 102917. [Google Scholar] [CrossRef]
- Jiang, H.; Zhou, D.; Zhang, J.H. Analysts’ information acquisition and stock price synchronicity: A regulatory perspective from China. Account. Horiz. 2019, 33, 153–179. [Google Scholar] [CrossRef]
- Zhao, D.; Wang, M. Smart Manufacturing Promotes High-Quality Development of Enterprises in China. Sustainability 2024, 16, 10431. [Google Scholar] [CrossRef]
- Feldman, R.; Govindaraj, S.; Livnat, J.; Segal, B. Management’s tone change, post earnings announcement drift and accruals. Rev. Account. Stud. 2010, 15, 915–953. [Google Scholar] [CrossRef]
- Huang, J.; Wang, D.D.; Wang, Y. Textual Attributes of Corporate Sustainability Reports and ESG Ratings. Sustainability 2024, 16, 9270. [Google Scholar] [CrossRef]
- Zhou, W.; Li, Y.; Wang, D.; Xueqin, D.; Ke, Y. Management’s tone in MD&A disclosure and investment efficiency: Evidence from China. Financ. Res. Lett. 2024, 59, 104767. [Google Scholar]
- Li, Y.; Wang, P.; Zhang, W. Individual investors matter: The effect of investor-firm interactions on corporate earnings management. J. Corp. Financ. 2023, 83, 102492. [Google Scholar] [CrossRef]
- Luo, R.; Ye, Y. Pressure from words: The tone of investors in Chinese earnings communication conferences and managerial myopia. Account. Financ. 2024, 64, 833–868. [Google Scholar] [CrossRef]
- Wei, F.; Yan, S.; Su, D.; Zhang, M. Management Tone and Corporate Social Responsibility: Evidence from Chinese Listed Companies’ Involvement in Rural Revitalization. Financ. Res. Lett. 2024, 65, 105461. [Google Scholar] [CrossRef]
- Pucheta-Martínez, M.C.; Gallego-Álvarez, I. An international approach of the relationship between board attributes and the disclosure of corporate social responsibility issues. Corp. Soc. Responsib. Environ. Manag. 2019, 26, 612–627. [Google Scholar] [CrossRef]
- Dhar, B.K.; Sarkar, S.M.; Ayittey, F.K. Impact of social responsibility disclosure between implementation of green accounting and sustainable development: A study on heavily polluting companies in Bangladesh. Corp. Soc. Responsib. Environ. Manag. 2022, 29, 71–78. [Google Scholar] [CrossRef]
- Xue, L.; Zhang, Q.; Zhang, X.; Li, C. Can digital transformation promote green technology innovation? Sustainability 2022, 14, 7497. [Google Scholar] [CrossRef]
- Higgins, E.T.; Rholes, W.S. “Saying is believing”: Effects of message modification on memory and liking for the person described. J. Exp. Soc. Psychol. 1978, 14, 363–378. [Google Scholar] [CrossRef]
- Hausmann, L.R.M. Developing Group Perceptions Through Communication: Extensions of the Saying-Is-Believing Effect. Ph.D. Thesis, University of Pittsburgh, Pittsburgh, PA, USA, 2005. [Google Scholar]
- Ding, Y.; Zheng, Q.Q. Influencing factors and explanations of “Saying-is-Believing” effect. Adv. Psychol. Sci. 2011, 19, 1851. [Google Scholar]
- Mata, A.; Semin, G.R. Multiple shared realities: The context sensitivity of the saying-is-believing effect. Soc. Cogn. 2020, 38, 354–366. [Google Scholar] [CrossRef]
- Kim, J.; Naylor, G.; Sivadas, E.; Sugumaran, V. The unrealized value of incentivized eWOM recommendations. Mark. Lett. 2016, 27, 411–421. [Google Scholar] [CrossRef]
- Loewenstein, G.; Weber, E.; Hsee, C.; Welch, N. Risk as feelings. Psychol. Bull. 2001, 127, 267–286. [Google Scholar] [CrossRef] [PubMed]
- Malmendier, U.; Tate, G. Behavioral CEOs: The Role of Managerial Overconfidence. J. Econ. Perspect. 2015, 29, 37–60. [Google Scholar] [CrossRef]
- Kothari, S.P.; Li, X.; Short, J.E. The effect of disclosures by management, analysts, and business press on cost of capital, return volatility, and analyst forecasts: A study using content analysis. Account. Rev. 2009, 84, 1639–1670. [Google Scholar] [CrossRef]
- Higgins, E.T.; McCann, C.D. Social encoding and subsequent attitudes, impressions, and memory:" Context-driven" and motivational aspects of processing. J. Personal. Soc. Psychol. 1984, 47, 26. [Google Scholar] [CrossRef]
- Johnson DD, P.; Fowler, J.H. The evolution of overconfidence. Nature 2011, 477, 317–320. [Google Scholar] [CrossRef]
- Ahmed, A.S.; Duellman, S. Managerial overconfidence and accounting conservatism. J. Account. Res. 2013, 51, 1–30. [Google Scholar] [CrossRef]
- Zhang, G.; Du, P. The Impact of Digital Transformation on Technological Innovation of Chinese Enterprises: Incremental or Qualitative Improvement? Econ. Manag. 2022, 44, 82–96. [Google Scholar]
- Yuan, J.; Hou, Q.; Cheng, C. The Curse Effect of Political Resources in Enterprises: An Investigation Based on Political Connections and Corporate Technological Innovation. Manag. World 2015, 01, 139–155. [Google Scholar]
- Niu, X.; Qiang, H.; Lu, B.; Wang, C. Corporate Cross-Border Competition and Debt Default Risk: Based on Machine Learning and Complex Network Methods. J. Financ. Res. 2024, 03, 150–168. [Google Scholar]
- Huang, X.; Teoh, S.; Zhang, Y. Tone management. Account. Rev. 2014, 89, 1083–1113. [Google Scholar] [CrossRef]
- Lin, W.F.; Zhao, Z.K.; Song, M. The Tone Manipulation of Management Discussion and Analysis and Its Bond Market Reaction. Manag. World 2022, 38, 164–180. [Google Scholar]
- Daiser, P.; Ysa, T.; Schmitt, D. Corporate governance of state-owned enterprises: A systematic analysis of empirical literature. Int. J. Public Sect. Manag. 2017, 30, 447–466. [Google Scholar] [CrossRef]
- Li, Y.; Liu, X.; Yan, Q. Is institutional investor a supervisor or cooperator? Based on the relationship between financial restatement and management turnover. Nankai Bus. Rev. Int. 2018, 9, 2–18. [Google Scholar] [CrossRef]
- Richardson, S. Over-investment of free cash flow. Rev. Acc. Stud. 2006, 11, 159–189. [Google Scholar] [CrossRef]
- Chen, R.; Wu, L. Calculation and analysis of the efficiency of resource allocation for technological innovation in China. PLoS ONE 2024, 19, e0308960. [Google Scholar] [CrossRef]
| Disclaimer/Publisher’s Note: The statements, opinions and data contained in all publications are solely those of the individual author(s) and contributor(s) and not of MDPI and/or the editor(s). MDPI and/or the editor(s) disclaim responsibility for any injury to people or property resulting from any ideas, methods, instructions or products referred to in the content. |
© 2024 by the authors. Licensee MDPI, Basel, Switzerland. This article is an open access article distributed under the terms and conditions of the Creative Commons Attribution (CC BY) license (https://creativecommons.org/licenses/by/4.0/).


