Article

Romanian Meat Consumers’ Choices Favour Sustainability?

by
Irina-Adriana Chiurciu
1,
Ionela Mițuko Vlad
1,*,
Paula Stoicea
1,
Iuliana Zaharia
1,
Livia David
2,
Elena Soare
1,
Gina Fîntîneru
1,
Marius Mihai Micu
1,
Toma Adrian Dinu
1,
Valentina Constanța Tudor
1 and
Dragoș Ion Smedescu
1
1
Faculty of Management and Rural Development, University of Agronomic Sciences and Veterinary Medicine of Bucharest, 011464 Bucharest, Romania
2
Faculty of Land Reclamation and Environmental Engineering, University of Agronomic Sciences and Veterinary Medicine of Bucharest, 011464 Bucharest, Romania
*
Author to whom correspondence should be addressed.
Sustainability 2024, 16(24), 11193; https://doi.org/10.3390/su162411193
Submission received: 21 September 2024 / Revised: 16 December 2024 / Accepted: 17 December 2024 / Published: 20 December 2024
(This article belongs to the Special Issue Sustainable Food Marketing, Consumer Behavior and Lifestyles)

Abstract

:
The paper highlights the evolution of meat consumption in Romania between 2007 and 2022 based on statistical data retrieved from the National Institute of Statistics and also presents a recent 2024 diagnosis on Romanian meat consumption from field data acquired through a questionnaire survey to which 1002 people gave valid answers. For the average annual meat consumption in Romania it was found that it varies depending on the category: for beef it was a decreasing trend, for pork the trend was slightly increasing, and the consumption of mutton and goat meat had an insignificant variation. The central place in terms of meat consumption was occupied by poultry (34.78%), which had the most obvious increase. The questionnaire reflected that meat consumption is influenced by multiple factors including: age, income level, level of education, origin of meat etc. In the context of climate and geopolitical change, there is an increasing emphasis on finding alternatives for meat. The largest share of respondents to the questionnaire said that they will continue to consume meat, the rest preferring substitutes obtained from vegetables. Our results and the analysis, correlations and approaches done within this paper could serve as a basis for meat consumption patterns in Romania and may ground future marketing policies and sustainable development strategies in the food industry.

1. Introduction

The present study analyzes the meat consumption in Romania while considering the dynamic global trend of change in the food preferences and associated consumption habits of the population toward a higher degree of sustainability.
We assess this analysis relevant in light of the fact that meat, a staple food, contains essential nutrients that provide 11% of the global energy of food, 21% of protein and 29% of dietary fat. At the same time, meat contributes significantly to the intake of essential vitamins and minerals (24% of vitamin A, 56% of vitamin B12, 19% of zinc, 13% of iron and up to 32% of indispensable amino acids), and the high digestibility of nutrients in meat (83–100%) is an important factor in ensuring this intake [1].
Moreover, we have noticed that the number of studies on food consumption has progressively increased since the 2000s, indicating the increased academic interest in this topic that correlates with other imperative research directions—sustainability, public health, equity, animal welfare, etc. [2]. These studies highlighted the increase in meat consumption globally [3,4] which was correlated with the health status of the population, respectively with an increased incidence of chronic diseases. This fact has given the World Health Organization the opportunity to make a series of recommendations to the world population in the direction of reducing meat consumption [3].
It should also be mentioned that in the component of basic foodstuffs there are additives necessary for color, taste, preservation etc., which can be much more dangerous to human health than the meat content. Thus, there are studies on consumer awareness for information on the content of products aiming to increase population’s attention and choice to purchase products made from natural ingredients and additional substances (like antioxidants) beneficial for their health [5].
Relatively divergent and current opinions regarding meat consumption have had an impact on consumers’ choices regarding the type, quantity and quality of meat chosen in the diet. Studies have indicated that these choices are made according to age, gender, educational level, financial status, religious beliefs etc., but also on the existing legislative recommendations in different countries [6].
Some researchers place particular emphasis in their studies on the consumption of vegetables and fruits to the detriment of meat (especially red meat), with measurable consequences in changing the eating habits of the population [7]. Plant-based meat alternatives are assessed as successful substitutes for animal proteins and innovations in plant-based ‘meat’ products continue to be funded to reproduce the organoleptic properties of meat as closely as possible, with appropriate labelling of the ingredients used in such products [8]—see plant-based burgers, which retain to a good extent the specific taste of animal products [9].
Other studies have shown that plant-based or low-meat diets also have numerous benefits for the environment [10]—context in which innovative meat-like products became key components of the strategy promoting plant-based products in the medium and long term, to the detriment of meat [11,12]. It is stated that reducing meat consumption is imperative to improve the health of the population, to reduce the impact that livestock farming has on the environment [13] by minimizing the carbon footprint [14], to reduce the greenhouse gases that contribute to global warming with increasingly evident climate change [15,16,17], the primary reason invoked being the finding of alternatives or substitutes for meat [18].
Another topic often seen in studies is the consumption of insects, accepted and regulated in the EU [19,20], an alternative that has been tested for a long time in some countries, with benefits on health and longevity [21]. Research has also focused on the production of microalgae, which can also be a healthy alternative to meat production [22].
Still, even multiple plant-based products highlighted similarities with conventional meat in terms of protein content, reduced saturated fat, dietary fiber [23], there are also pointed out their major limitations/inconveniences (plant-based protein sources, such as legumes, may contain anti-nutritional components that inhibit protein digestibility and absorption of representative minerals) [23,24].
Therefore, aware of the importance and complexity of the meat consumption issue and considering to be welcome and even necessary for this topic an analysis to enrich and nuance the specialized literature with reference to meat consumption especially for our country, we proceed to the following systematic investigation of the current particularities of meat consumption in Romania, in order to put a new spin within the statistical evolution of meat consumption for the period 2007—2022 and also to analyze the results of our recent (2024) meat consumption questionnaire survey through which we aimed to achieve a pattern of meat consumption on a sample of the Romanian population—all as pieces to obtain a type of actual diagnosis useful to guide and possible ground further economic, political, administrative measures and development strategies in the food industry, conducive to the health of the population and to the protection of the environment, both pillars for authentic sustainability.

2. Materials and Methods

In brief, we opted for a statistical evolution of meat consumption in Romania in the period 2007—2022 and the analysis of the results of our recent (2024) meat consumption questionnaire survey, through which we aimed to create a pattern of meat consumption within a sample of the Romanian population. To achieve this objective, we developed a questionnaire, which was distributed electronically to potential respondents from 22 April 2024, to 23 June 2024. With the responses obtained (1002 responses, after cleaning and validating the dataset), we performed statistical analyses, including descriptive statistics and comparisons of means (using ANOVA analysis—IBM SPSS Statistics 24).

2.1. Databases of the Average Annual Consumption per Capita of Meat in Romania

The first part of the analysis focused on the annual average per capita consumption of beef, pork, sheep and goat meat, and poultry in Romania, based on statistical data available on the INS (Romanian National Institute of Statistics) website [25], for the period 2007–2022. The arithmetic mean, standard deviation, and coefficient of variation were calculated for each type of meat, as well as the coefficients of the linear regression model in all four cases.
The coefficient of variation, V, is expressed as a percentage V = s X ¯ 100 , where s represents the standard deviation and X ¯ is the arithmetic mean of the data. The closer the value of V is to zero, the weaker the variation, indicating that the population is more homogeneous and the mean has a high degree of representativeness. Conversely, the higher the value of V the more intense the variation, indicating a more heterogeneous population, and the mean has a lower level of significance. It is considered that if the coefficient exceeds 35–40%, the mean is no longer representative, and the data should be separated into component series or groups based on the variation of another grouping characteristic.
Linear regression equations y = ax + b was determined using “the least squares method”. Correlation diagrams and the graphical representation of the regression lines illustrate the evolution of meat consumption over the studied period. In the model y = ax + b, the independent variable x represents time (year), while the dependent variable y represents the annual average meat consumption (Kg). The coefficient of determination R2 indicates the percentage of the total variation in the dependent variable that is explained by the independent variable. The Fisher test [26,27] was applied for validating the mathematical models.

2.2. Methodological Aspects of the Questionnaire Survey

The study on meat consumption in Romania based on questionnaire survey requested:

2.2.1. Preliminary Observations and Making the Data Collection Instrument

We designed the instrument in the form of questionnaire, appreciating it as an optimal tool for data which would give us the possibility to identify the causal factors and further to explain the human behavior we investigated. Aware that “a survey cannot be better than its questionnaire”, to ensure the quality of the research and based on the dimensional analysis of the concept, we articulated the questionnaire paying attention to a multitude of factors, from the circumscription of the survey theme to the specific construction techniques, structuring, application, exploitation applicable to the variety of subjects’ personalities—so that we satisfactorily address the main criteria for developing a questionnaire: the content, the form of the questions, the way of application [28].
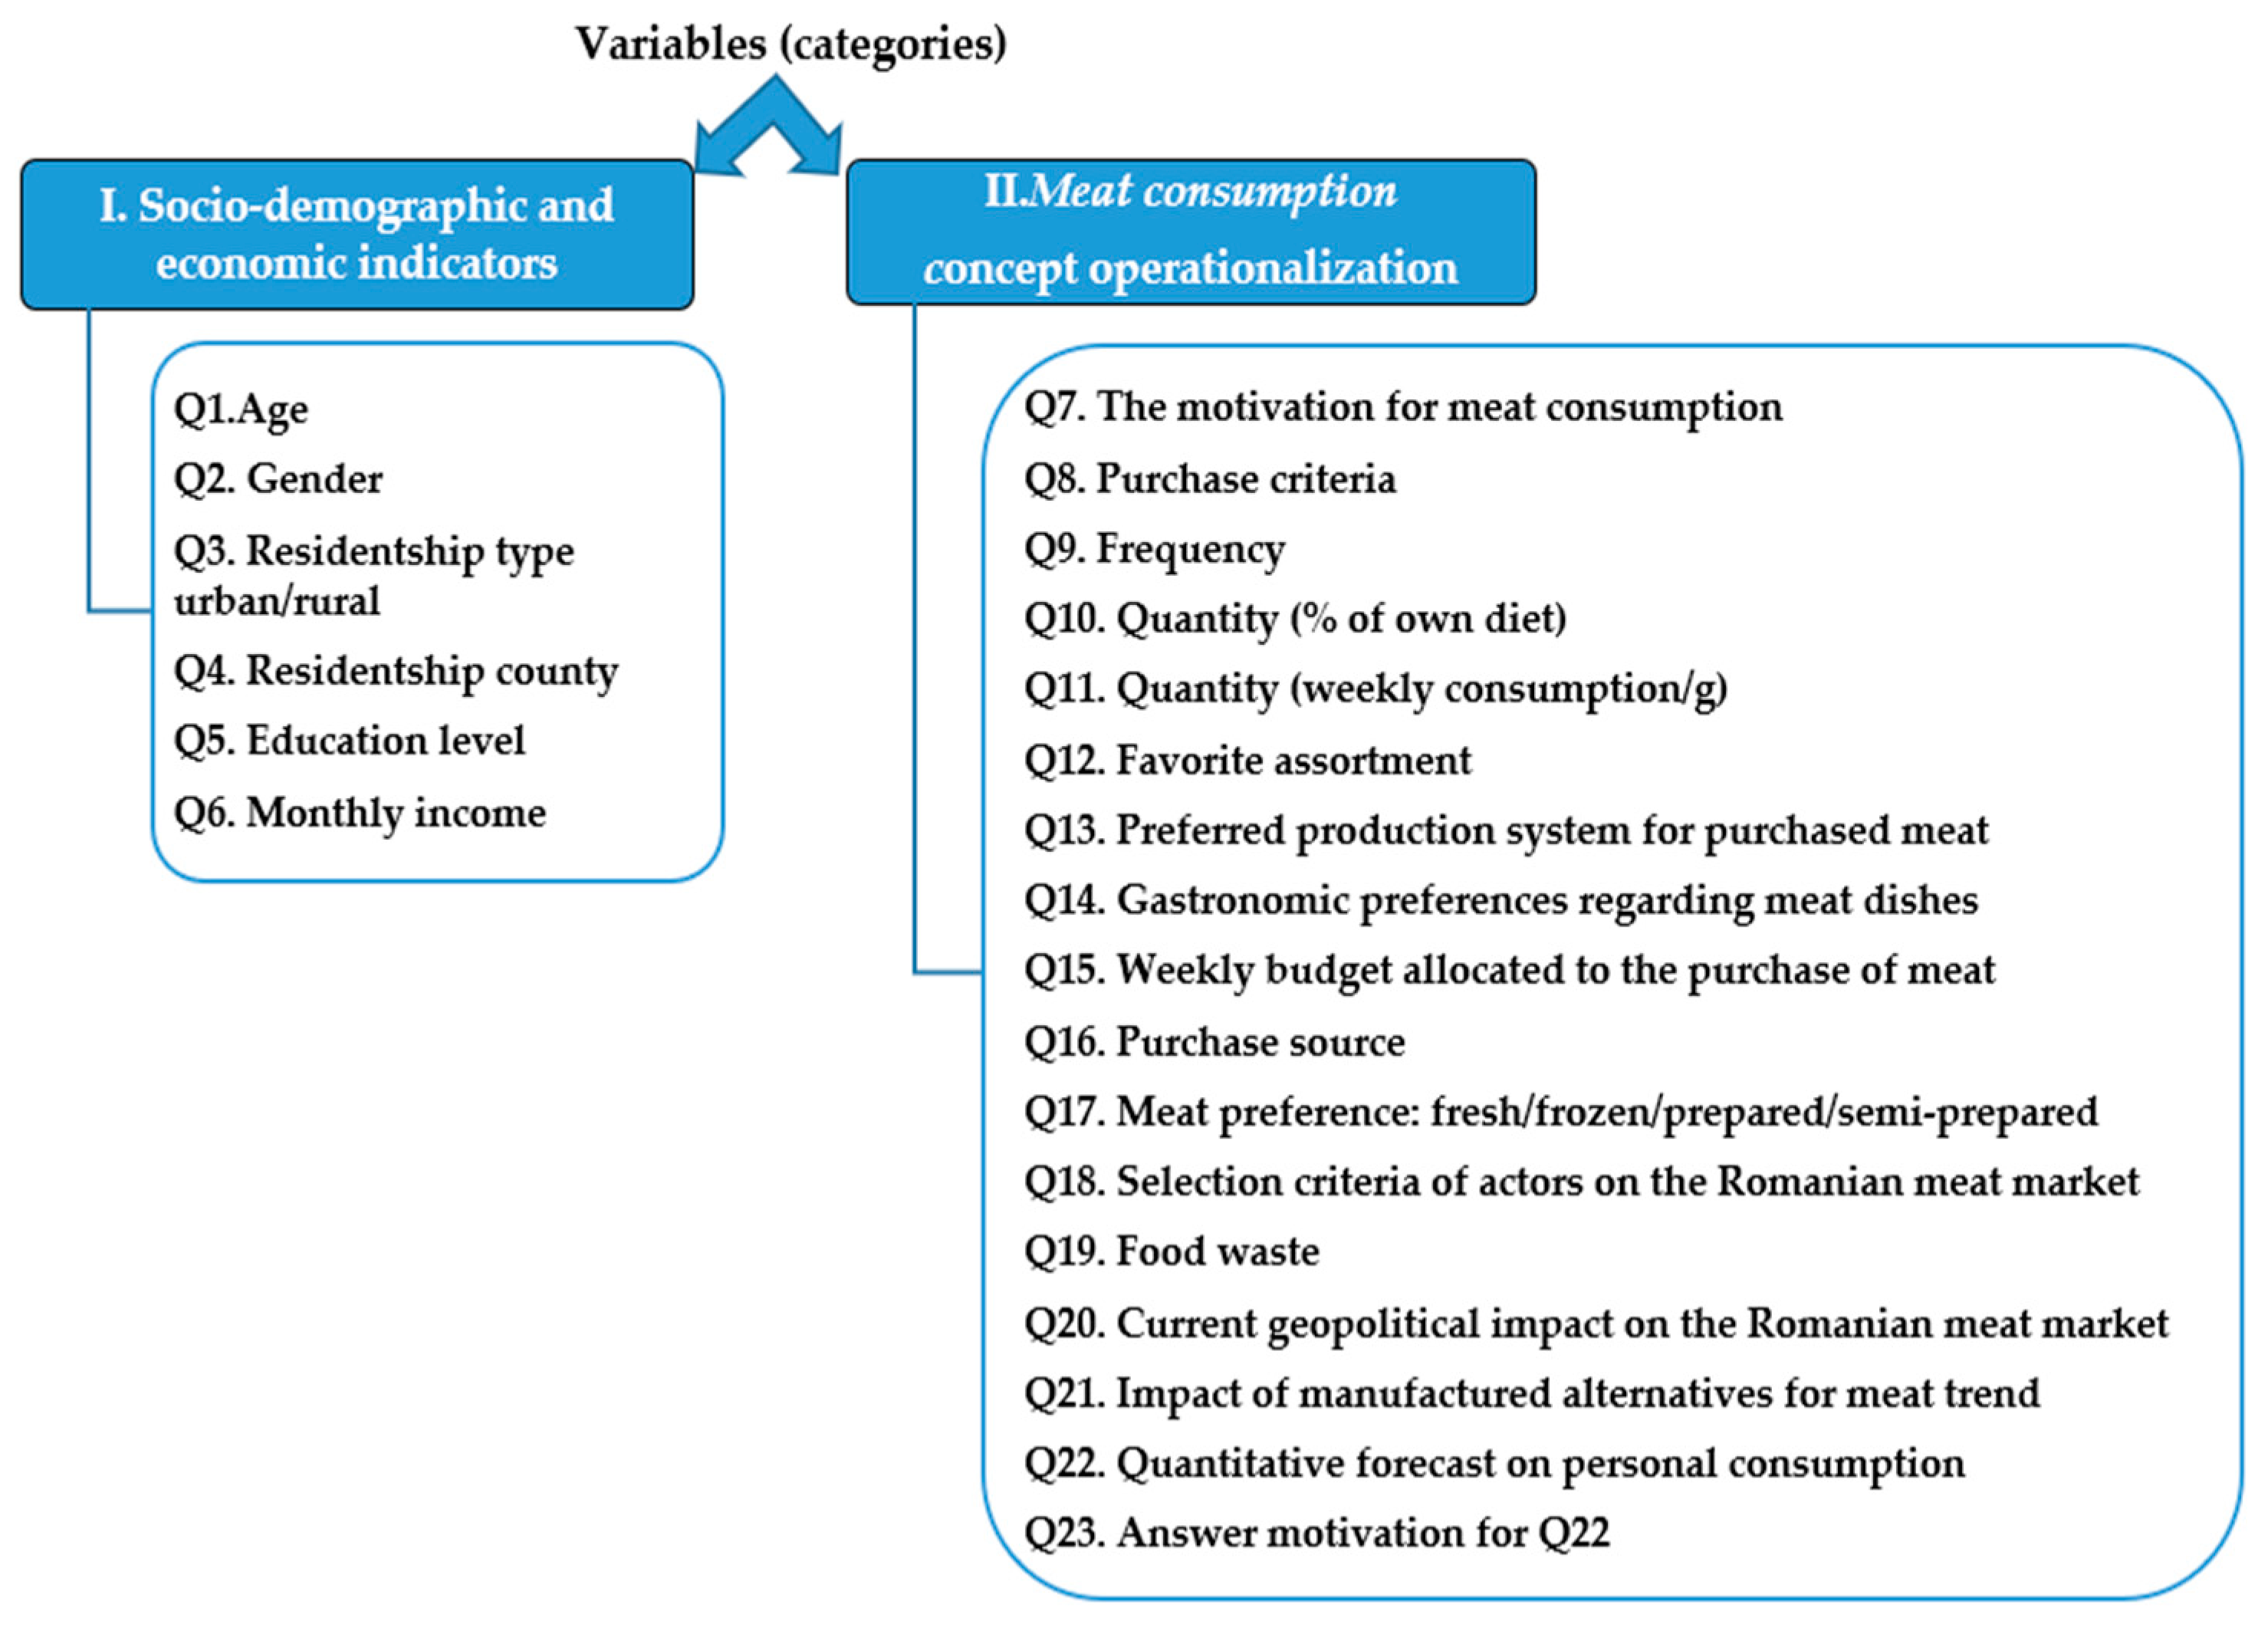
The dimensional analysis of the concept led to the formulation of multiple variables, of which those selected as representative were valued in the form of items according to Figure 1:
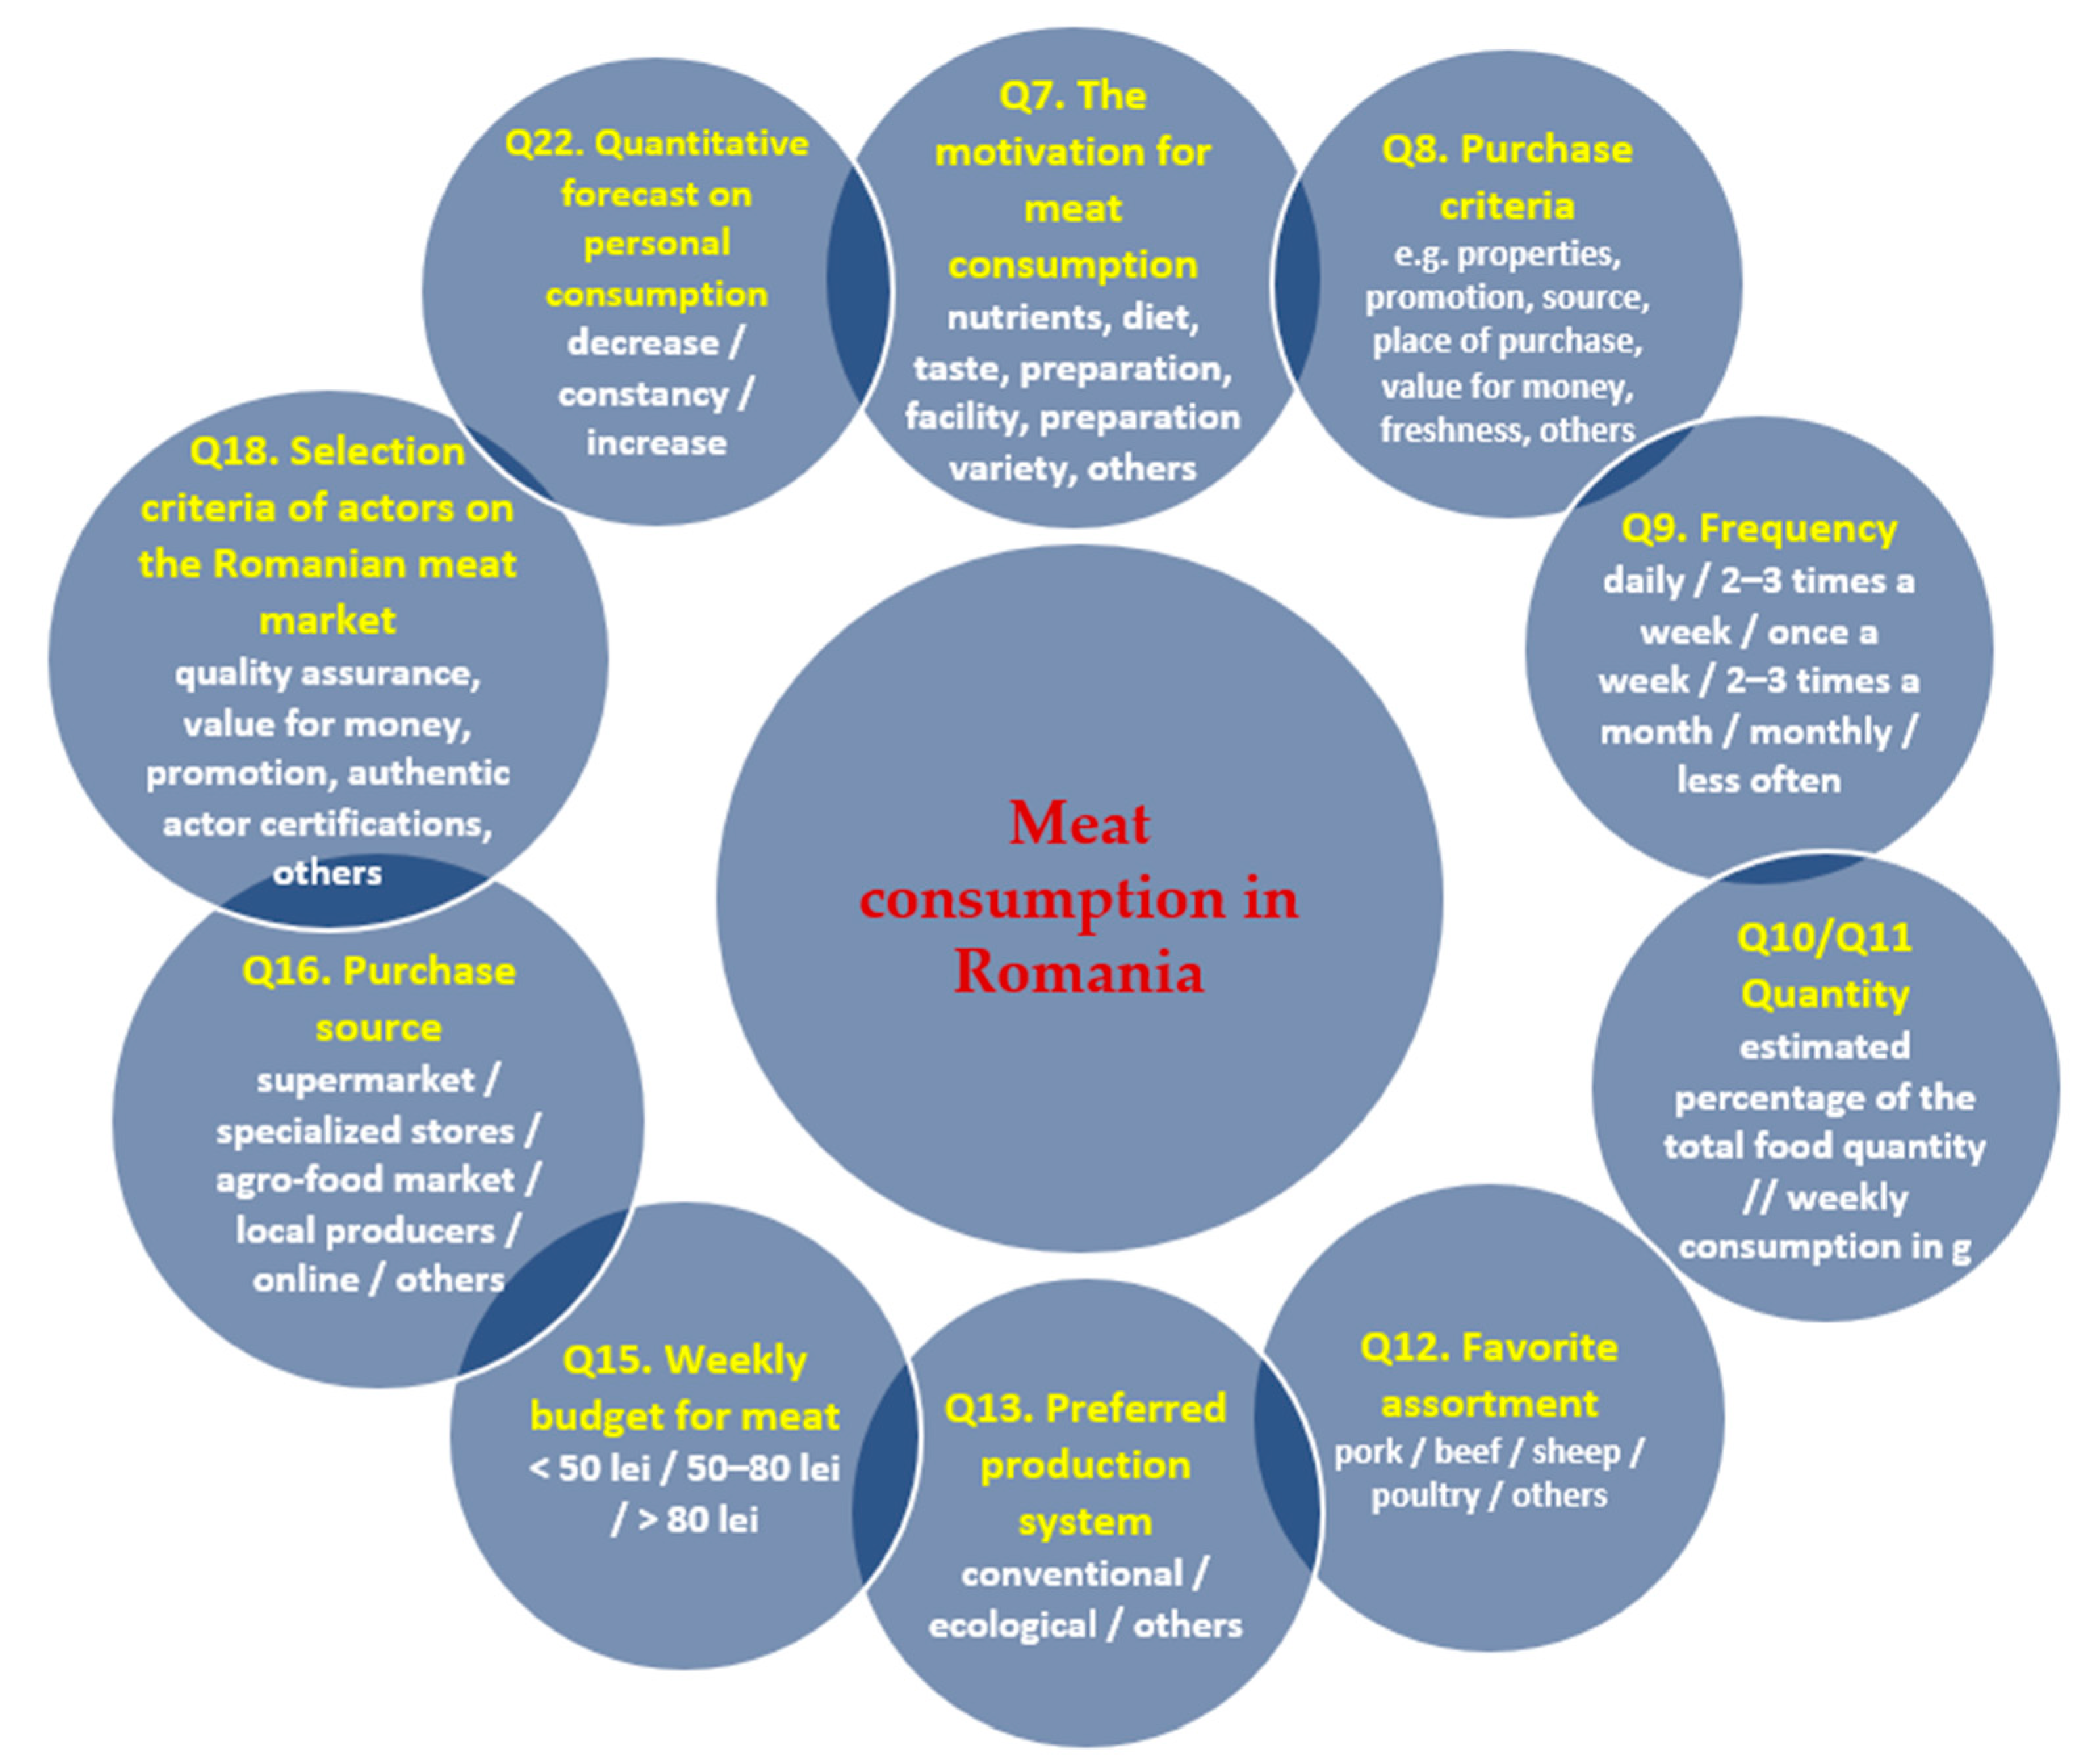
Regarding the content of the items, you can find main details in Figure 2, and regarding their form, we predominantly made closed items (with only two exceptions, Q21 & Q23, which will be presented and analyzed in a later paper), with multiple answers. Some items have a scale (with 3 or 5 steps). We also included control item for what we assessed as very relevant content.
Selection criteria of actors on the Romanian meat market

2.2.2. The Population to Be Investigated

The general statistical collective includes meat consumers from Romania, with the observation that by the collocation “from Romania” we did not condition the respondents according to ethnicity or citizenship and we did not identify such aspects through a dedicated item.
The economy of the research asked us to group the population according to socio-demographic/professional/economic criteria, as well as to opt for a sample of at least 1000 respondents—numerical objective reached, because the number of respondents/valid answers, after data cleaning, is 1002. A similar methodology was used in other scientific papers [29].
We mention that we addressed and distributed the questionnaire to subjects from all the counties of the country, considering socio-demographic and economic indicators, aiming at a representative sample (including from the perspective of socio-demographic criteria), but since the filling was voluntary, we only partially achieved this goal (the particularities of the investigated population can be found in the Section 3).

2.2.3. Method of Administration, Destinations of Administration and the Pilot Survey

In the age of digitization, with advantages and disadvantages by default, we opted for online questionnaire through Google forms with voluntary self-administration.
We add that we sent it via e-mail (not collecting e-mail addresses) and on WhatsApp groups of subjects from academia, from entrepreneurial environment, to farmers and other categories of people involved in rural activities, producer associations, managerial institutions—from both urban and rural environment, and we asked these subjects to redirect the questionnaire to their peers or to other suitable connections for our target group that they are willing to share with, so, regarding the questionnaire journey, we have information only on the beginning of its route(s).
The pilot investigation included testing the instrument on a sample of 30 subjects who did not report problems at the semantic level or resistance to the investigation in the form of non-answers or observations of any type on the items—so we did not perform subsequent tuning on the instrument, which does not mean that it is not perfectible.

2.2.4. Data Collection Period

The data collection period was between 22 April 2024 and 23 June 2024.

2.3. Research Questions and Methodological Aspects of Descriptive and Correlations’ Analysis

Based on the answers obtained to the applied questionnaire, we performed descriptive statistics and comparison of the means, through ANOVA statistical analysis.
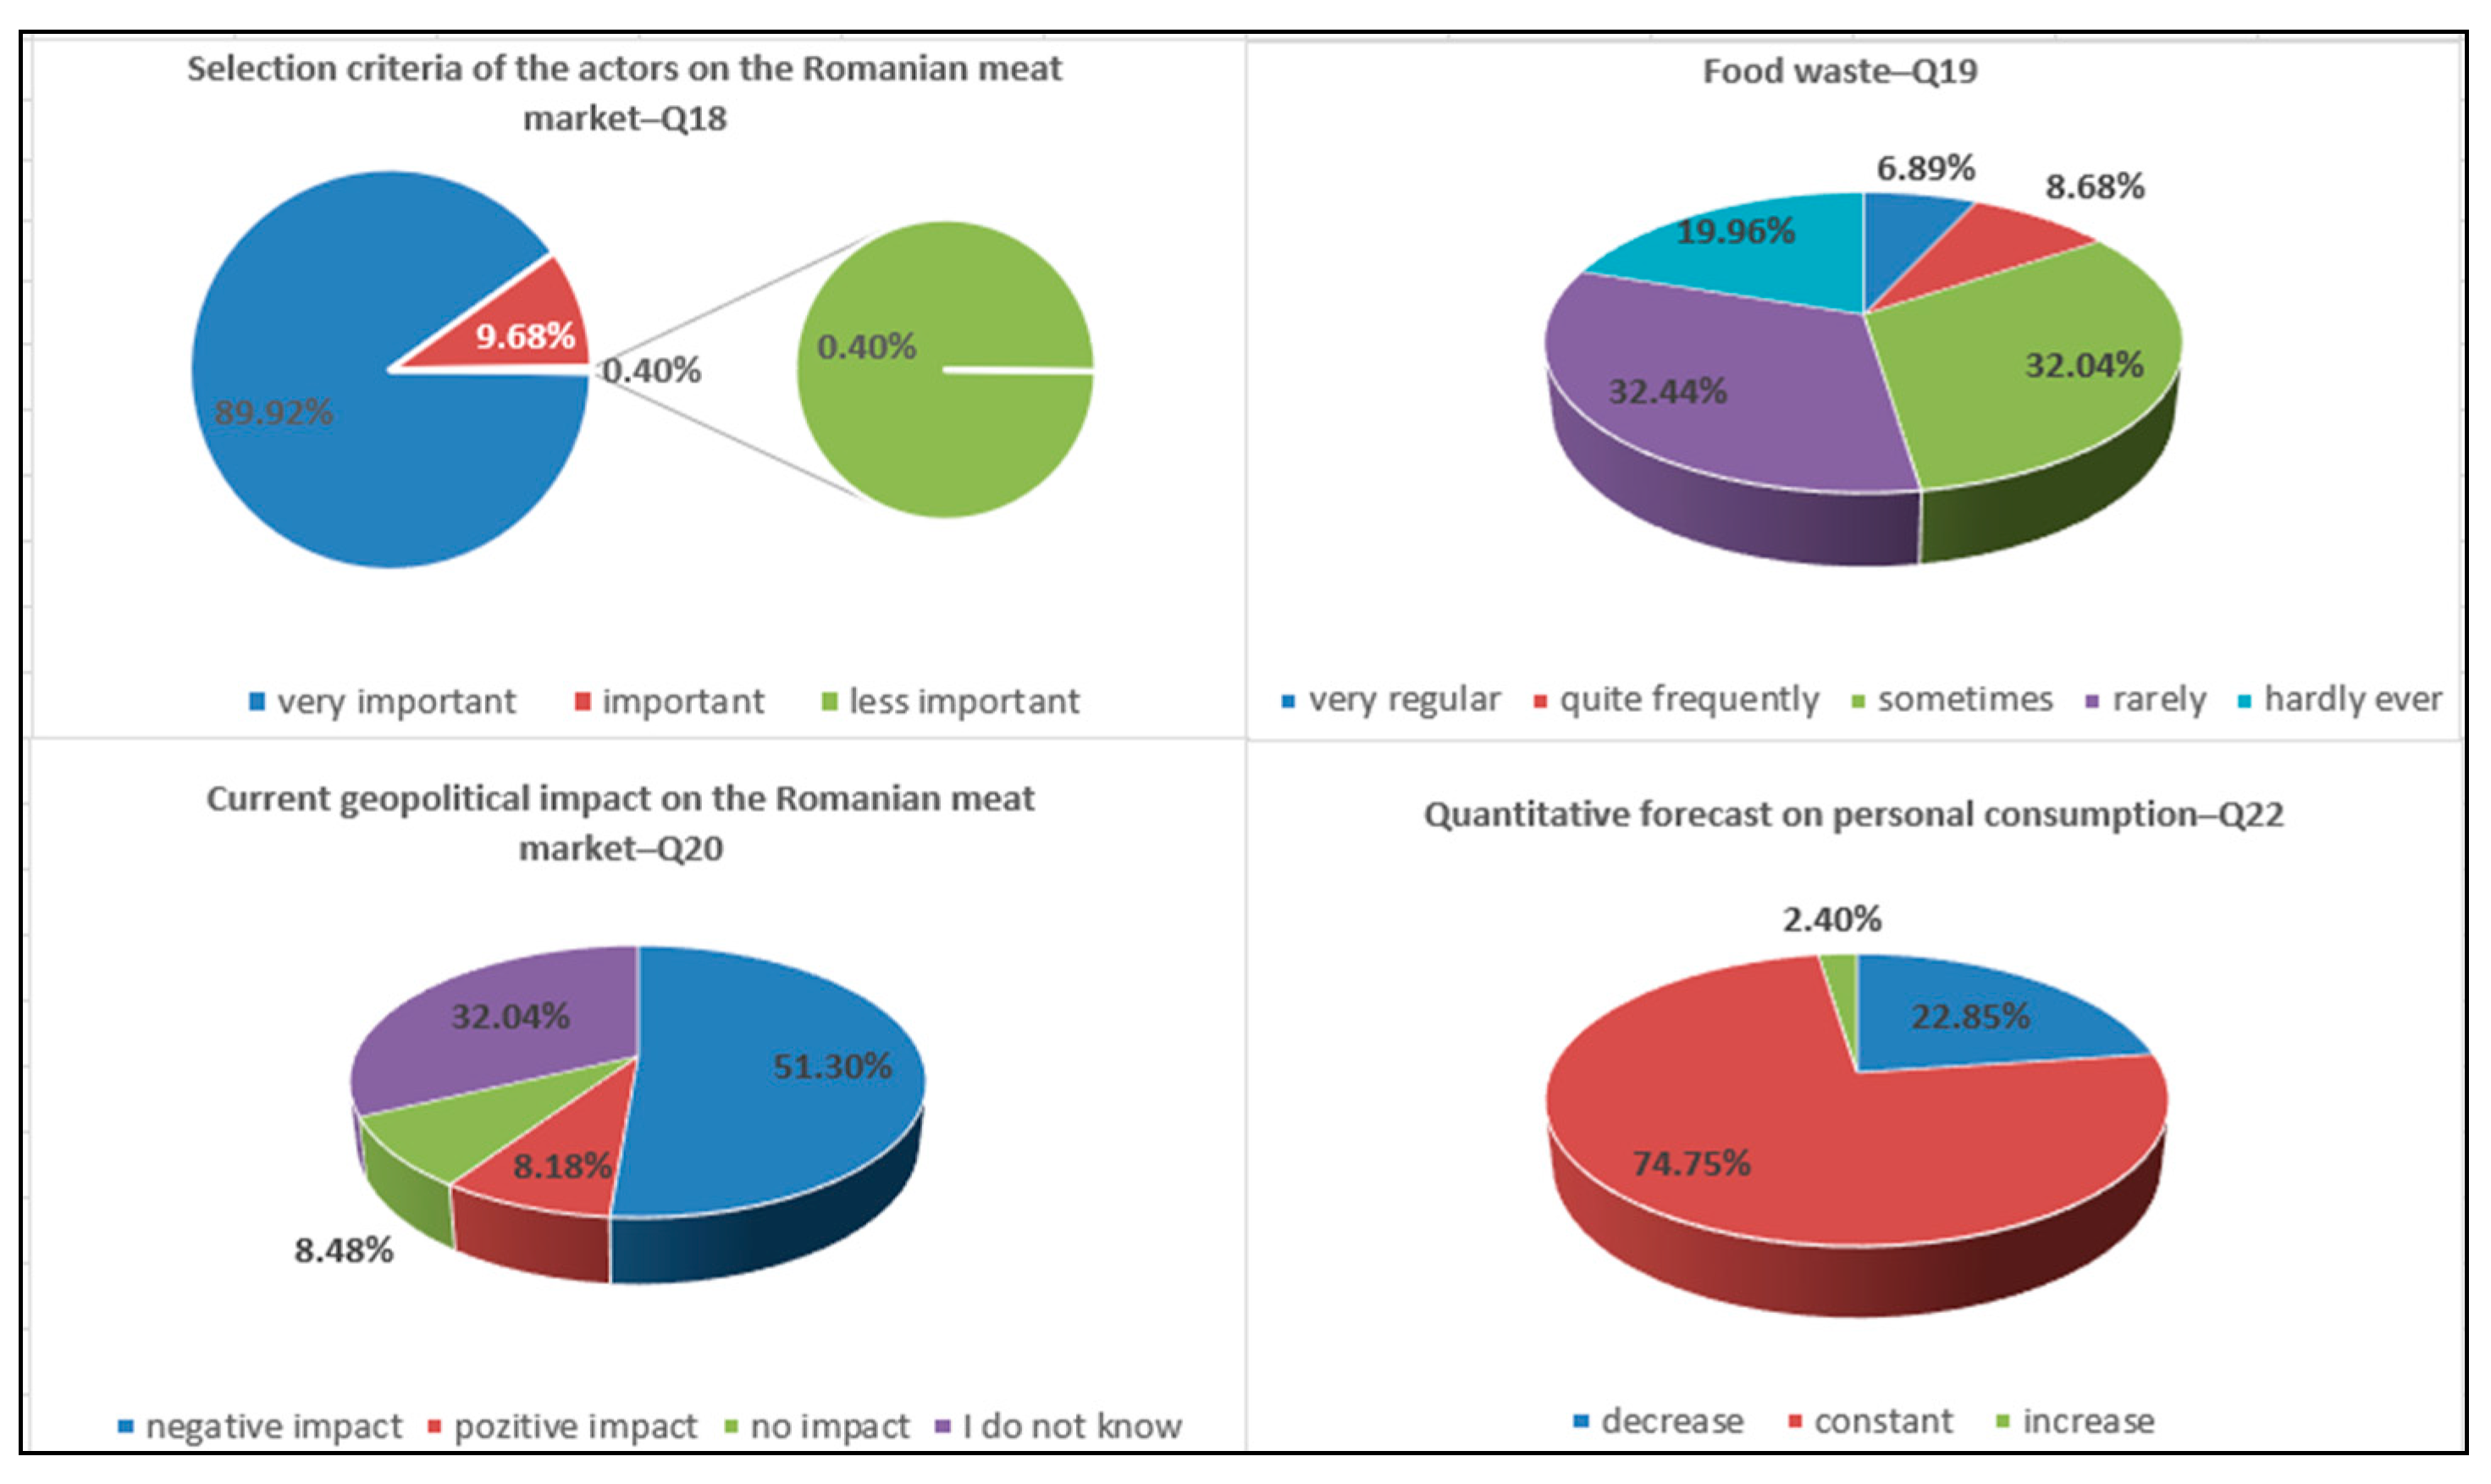
The descriptive statistics analysis was particularly used for variables with Likert-scale responses, presenting measures such as mean, confidence intervals (95% confidence interval), median, standard deviation, etc. In our questionnaire, we had four questions (Q18, Q19, Q20, and Q22) with Likert-scale responses, which allowed for response hierarchy based on expressed options, including the possibility for a neutral opinion regarding the choice. A visual representation of the frequencies obtained from the analysis of these variables is presented in Figure 3:
The research questions we sought to answer with this analysis were: Are there significant differences in meat consumption among different age categories (Q1), between men and women (Q2), across residential areas (rural versus urban—Q3), among different levels of education (Q5), or levels of income (Q6)? These questions were explored from the perspective of the following dimensions:
Criteria for selecting actors of Romanian meat market;
The types of food products commonly consumed or discarded due to expiration;
Predictions regarding the impact of geopolitical instability on consumption;
Future trends in meat consumption.
Statistical analysis of variance (ANOVA) is a method used to compare means and variances between two or more groups, providing a detailed understanding of data distribution and making it a powerful and versatile method used in various research fields.
In our analysis, we used the one-way ANOVA method, meaning we analyzed one independent variable at a time (Q1, Q2, Q3, Q5, Q6) in relation to several dependent variables (Q18, Q19, Q20, Q22) to test for significant differences between group means using SPSS software, IBM SPSS Statistics 24. The null hypothesis (H00) assumed that there are no significant differences between the means of the considered groups, which we tested against the alternative hypothesis (H1) that at least one group mean is significantly different.
ANOVA test interpretation is based on two elements: the calculated F-statistic (which measures the ratio between the variance among groups and the variance within groups) compared to the critical F-value, and the p-value (for a chosen significance level of 0.05). If the calculated F-statistic is greater than the critical F-value, the null hypothesis (H0) is rejected, concluding that there is a significant difference between the means of at least two groups. The p-value indicates the probability of obtaining a similar F-statistic if the null hypothesis (H0) is true. A small p-value (less than the significance level of 0.05) provides strong evidence against the null hypothesis, indicating a significant difference between the means of at least two groups. We also highlighted the effect size, measured by the eta-squared (η2) element, representing the proportion of total variation in the dependent variable accounted for by differences among groups (e.g., small effect η2 < 0.01, medium effect 0.01 ≤ η2 < 0.06, and large effect η2 ≥ 0.06).

3. Results and Discussions

3.1. Evolution of Meat Consumption in Romania, Between 2007 and 2022

Animal husbandry is an important sector of the Romanian economy, but its contribution to agricultural production, especially in recent years, has decreased [30]. In contrast, overall meat consumption in Romania has increased, driven by rising household incomes. However, domestic meat production is insufficient to cover the growing demand on the domestic market [31], which is significantly dependent on imports [32,33]. This affects the level of consumption [32,33,34]. In addition to imports of meat, meat substitutes may cover this shortage in the future.
Table 1 presents the descriptive statistical analysis of the average annual consumption per capita for the main types of meat, in the period 2007–2022, calculating the arithmetic mean, the standard deviation and the coefficient of variation.
It is observed that the highest variability is the average annual consumption per capita of beef and poultry, the coefficient of variation being 18.08% and 17.70%, respectively. The variation of mutton-goat meat consumption was the smallest, the coefficient of variation being 6.40%. The coefficient of variation values is less than 35% for all four types of meat, indicating a relatively low variability of the data; therefore, the arithmetic mean of meat consumption during the studied period is representative.
The results of the analysis of the average annual consumption of beef per capita showed its decreasing trend (Figure 4), possibly due to feed shortages, rising feed prices and energy costs, competition with pork and poultry etc. [35].
In 2007, the highest average amount of beef consumed was recorded, of 8.3 kg/inhabitant, and the minimum was found in 2017, 4.9 kg/inhabitant (Table 1). In the period 2007–2022, the decrease in the average annual meat consumption was of 39.76%. In 2022, the annual average per capita beef consumption in the EU was of 14.01 kg, while globally it was 9.4 kg [36]. The data presented in Figure 4 shows that the annual average beef consumption in Romania in 2022, at 5 kg per capita, was below both the EU and global averages.
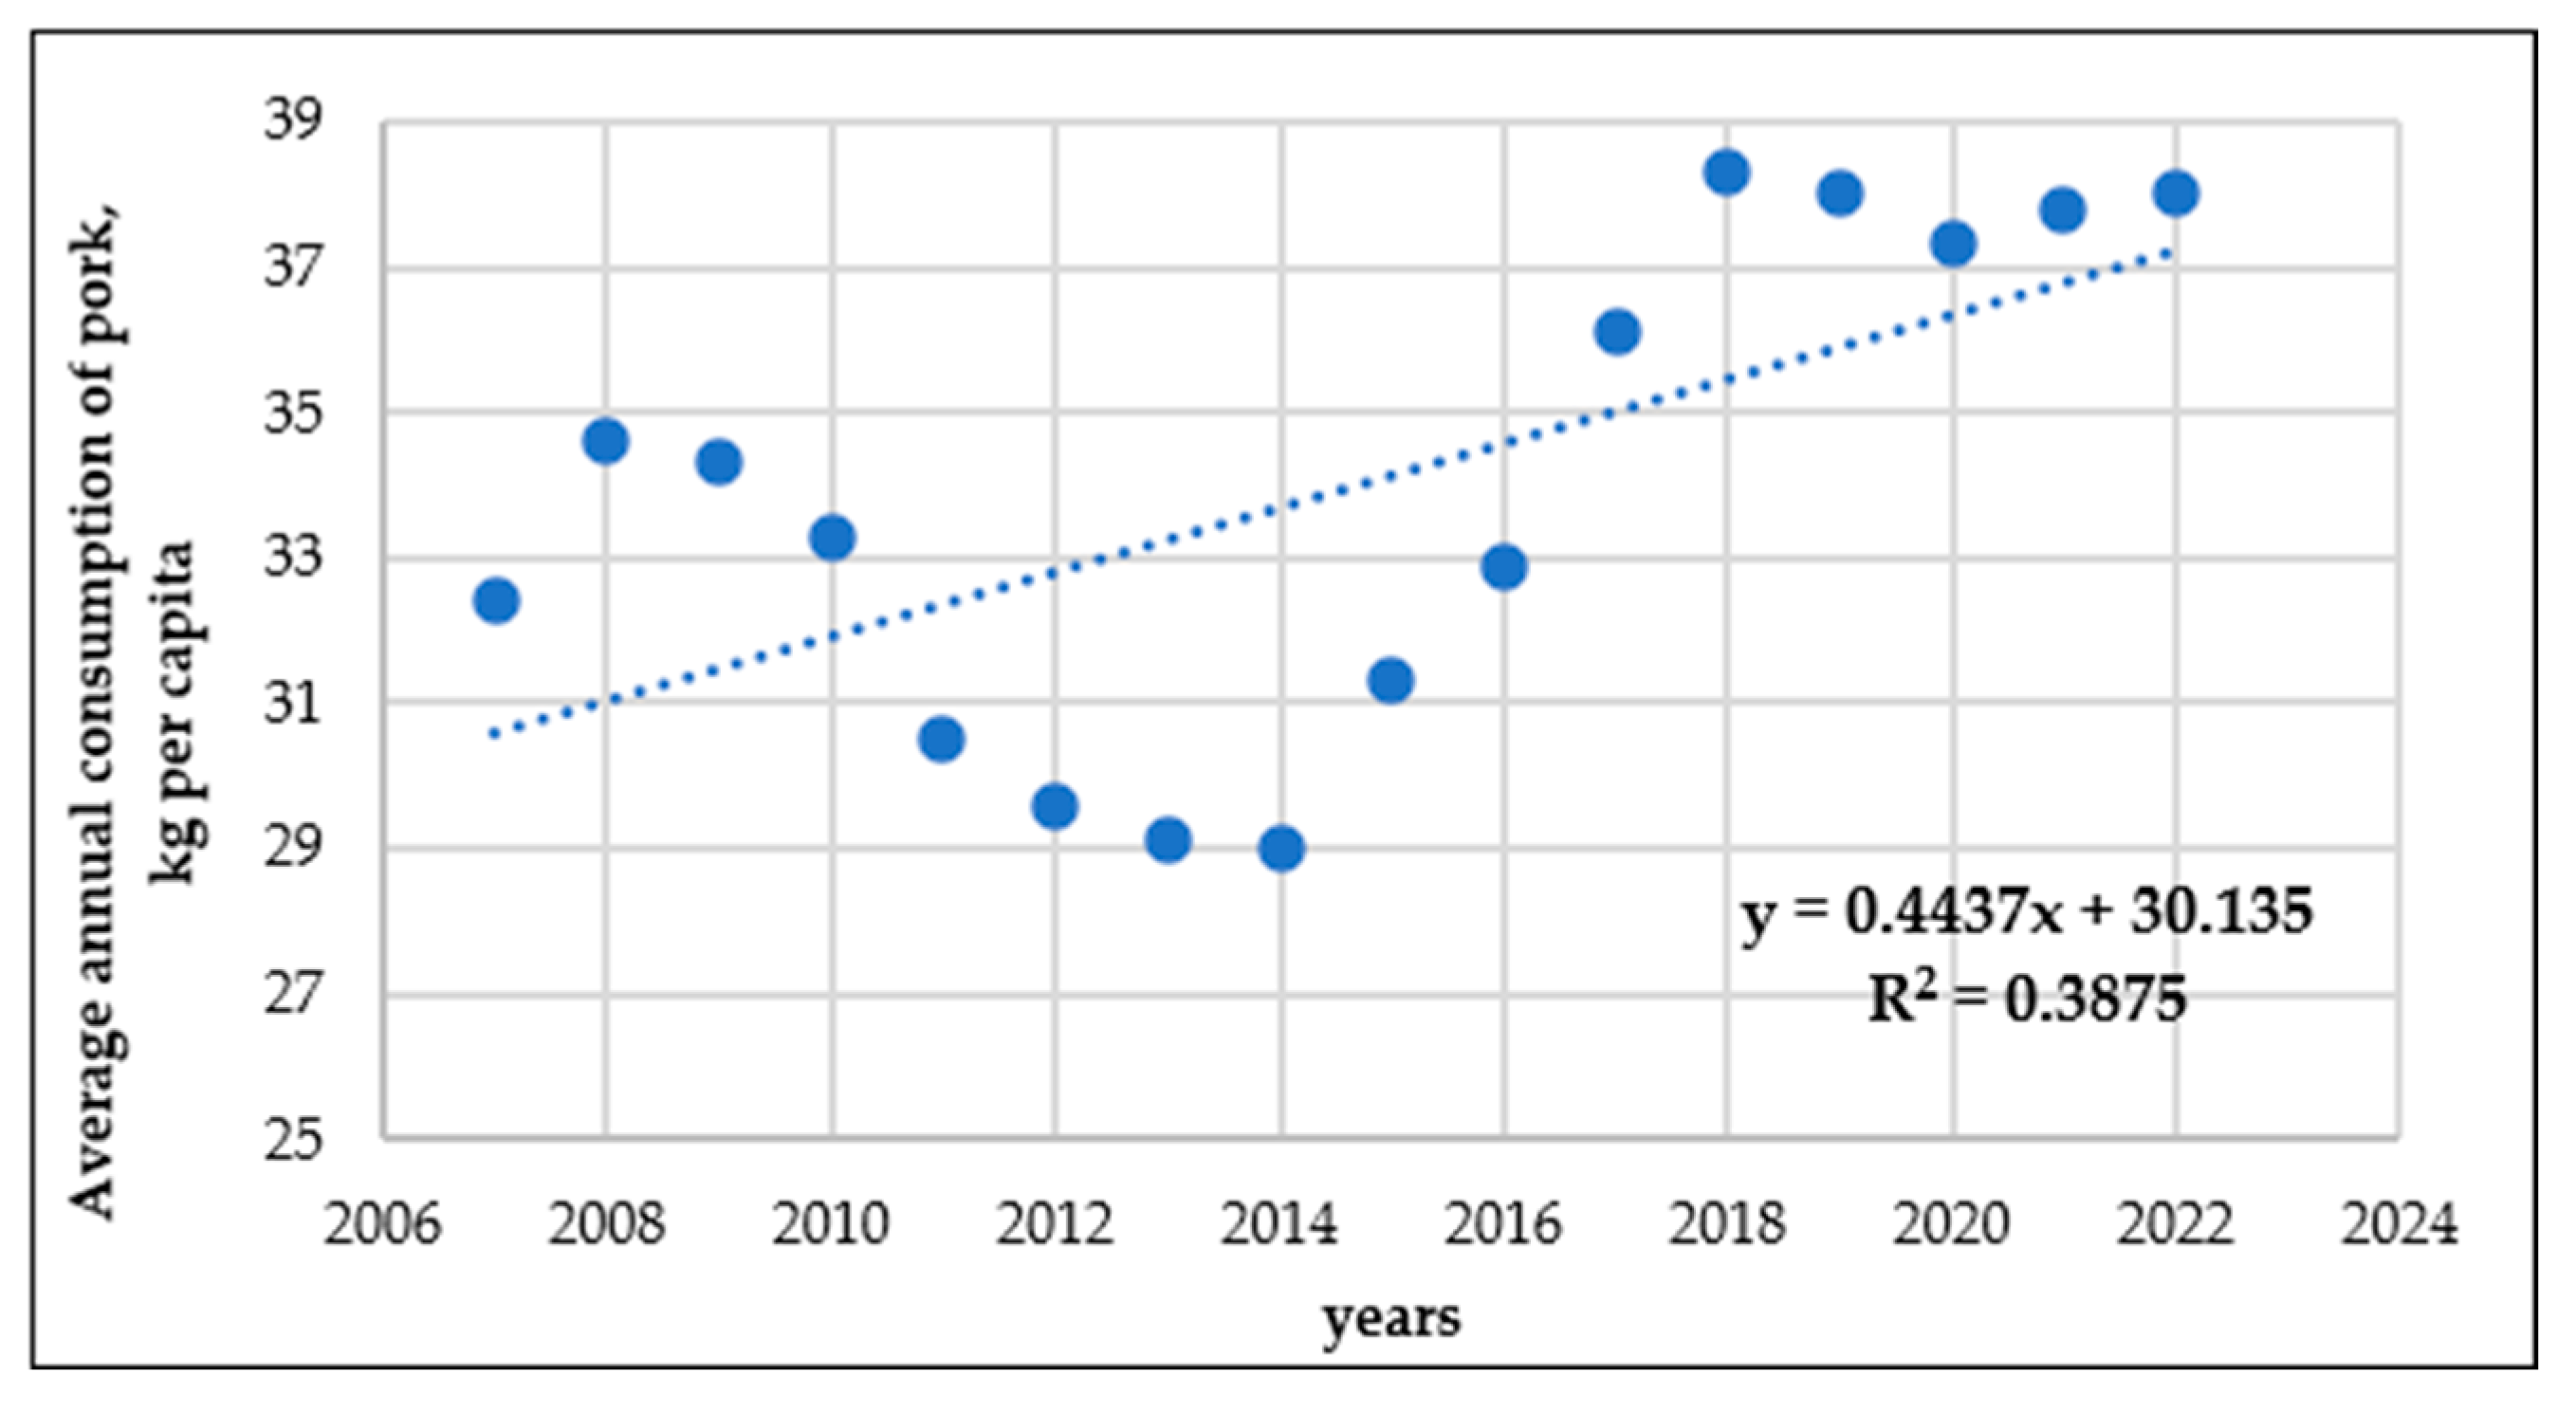
The analysis carried out for the average annual consumption of pig meat per capita highlighted its slightly increasing trend (Figure 5), which was based on the increase in incomes, fiscal measures to reduce the taxation of food products as well as food preferences.
The maximum average annual consumption was recorded in 2018, 38.3 kg of pork/inhabitant, and the minimum average consumption was in 2014, 29.0 kg of pork/capita (Table 1). In the analyzed period, the increase was of 17.28%. The annual average per capita pork consumption in the EU was 39.8 kg per capita in 2022, while globally it was of 15.3 kg [36]. According to INS data, the annual average pork consumption in Romania in 2022, at 38 kg per capita, was below the EU average but above the global average.
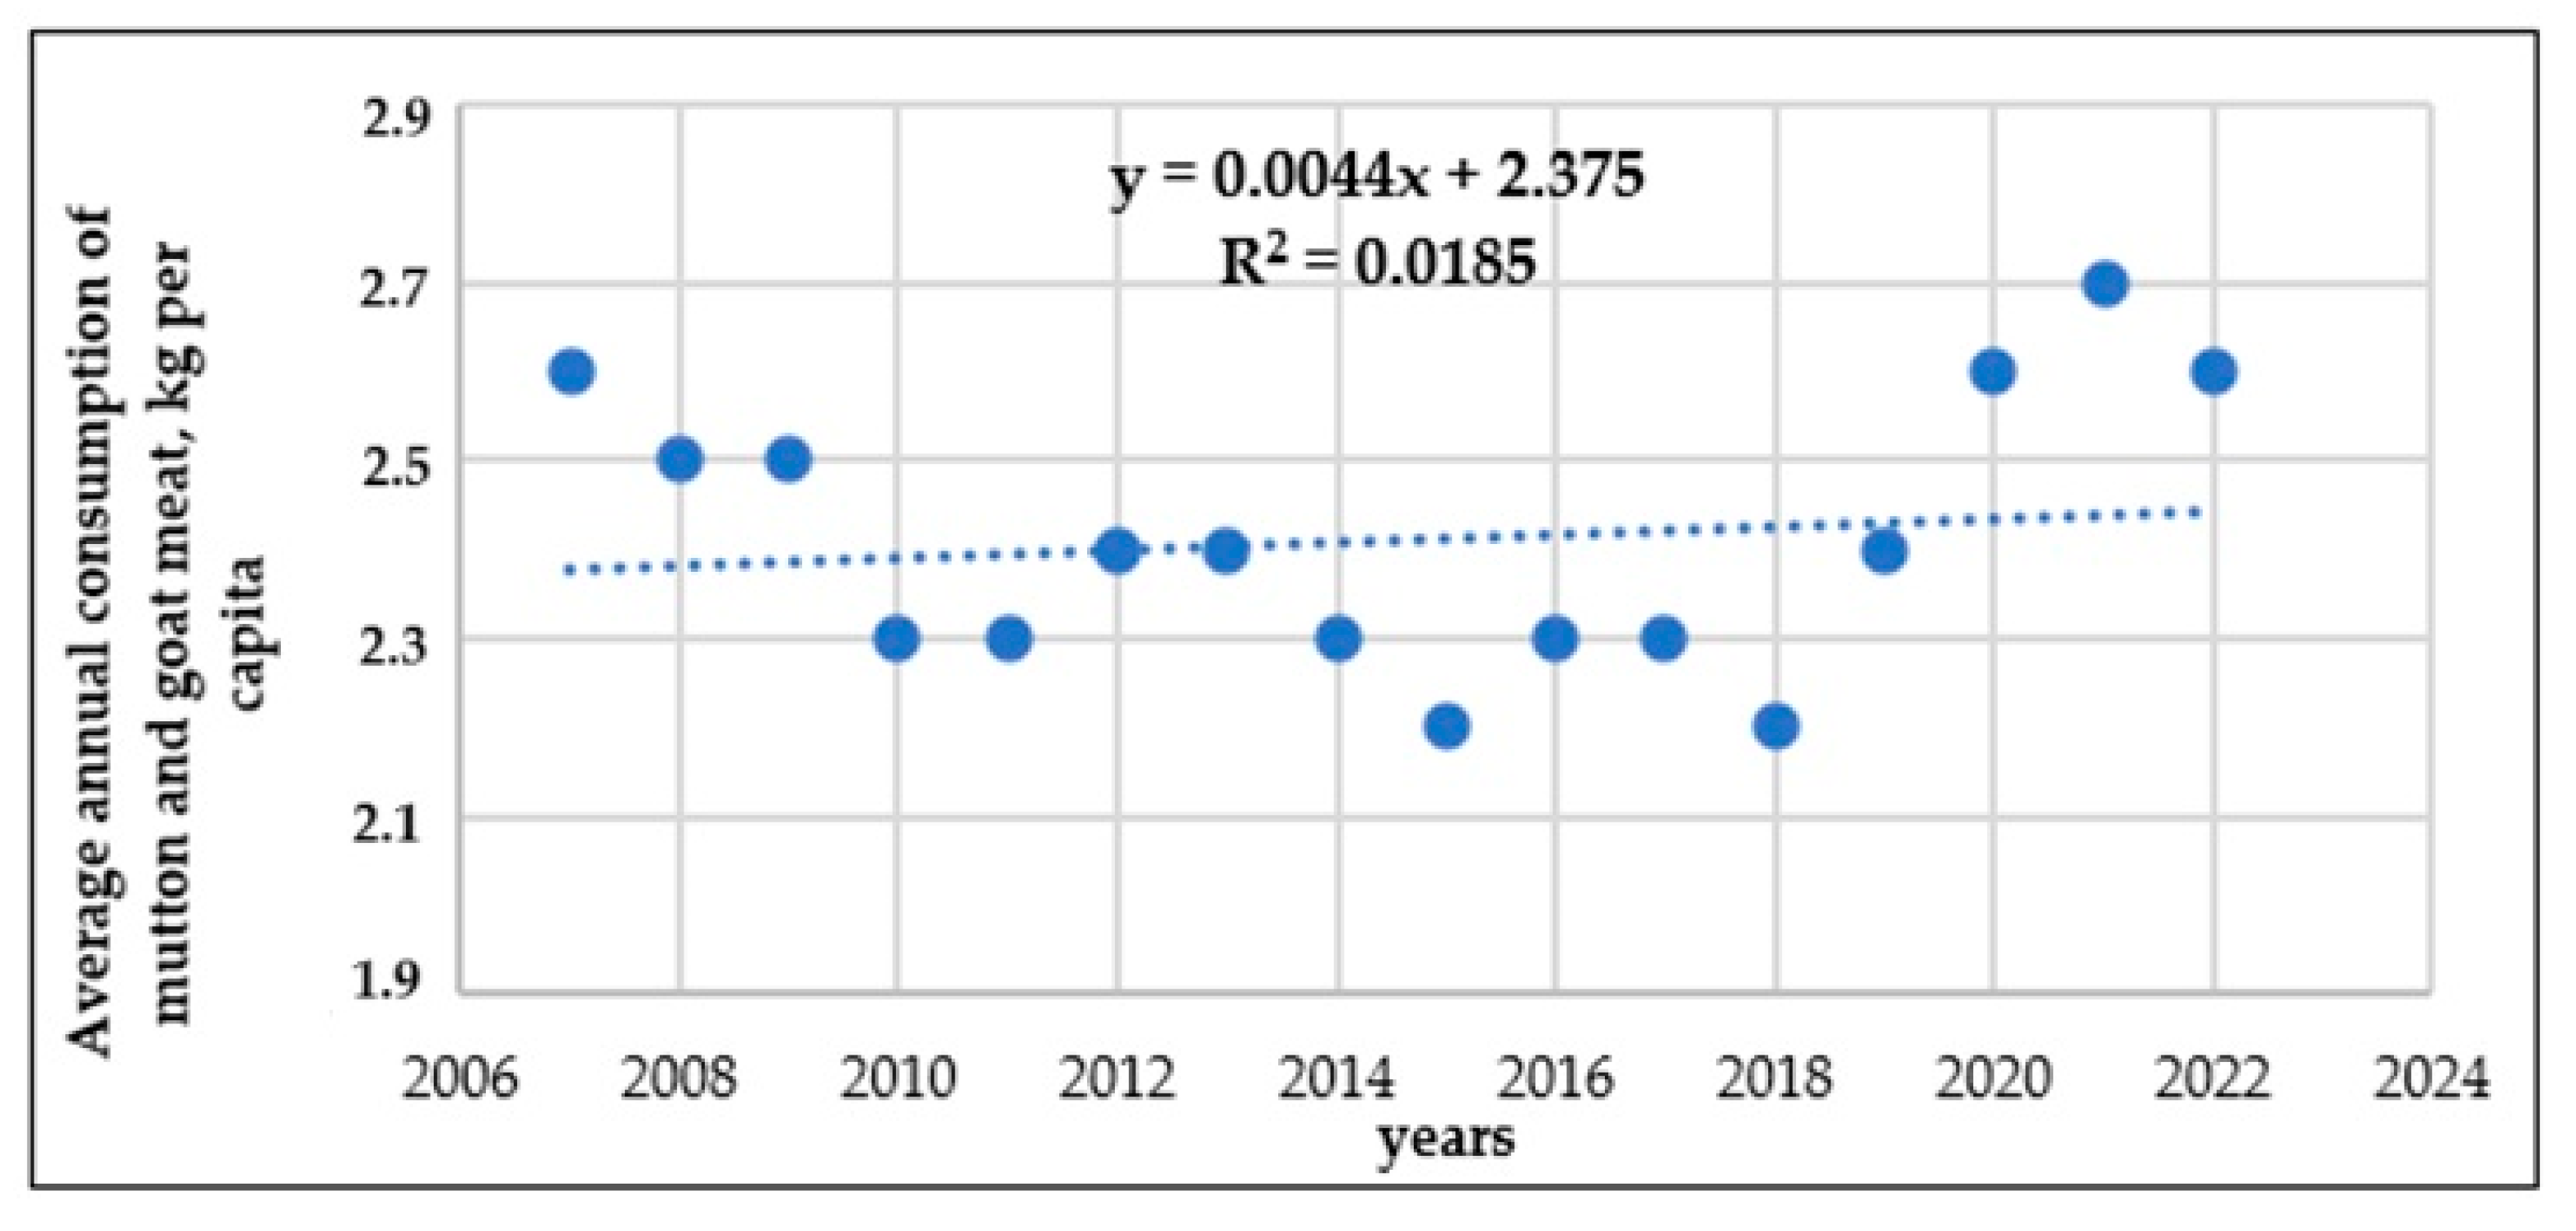
Regarding the average annual consumption of mutton and goat meat, there is an insignificant variation in the period 2007–2022 (Figure 6), as Romanians are not renowned consumers of this type of meat, which is consumed especially during the Easter holidays [37].
In 2015 and 2018, the minimum average consumption was recorded, 2.2 kg of mutton and goat meat/inhabitant, and the maximum average consumption was in 2021, 2.7 kg of mutton and goat meat/inhabitant (Table 1). The average annual consumption of mutton and goat meat in the analyzed period registered small fluctuations, and for the years 2007 and 2022 it was equal, 2.6 kg/inhabitant. In 2022, the annual average per capita consumption of sheep and goat meat in Romania, of 2.6 kg per capita, was above the EU average (1.44 kg per capita) and the global average (2.03 kg per capita) [36].
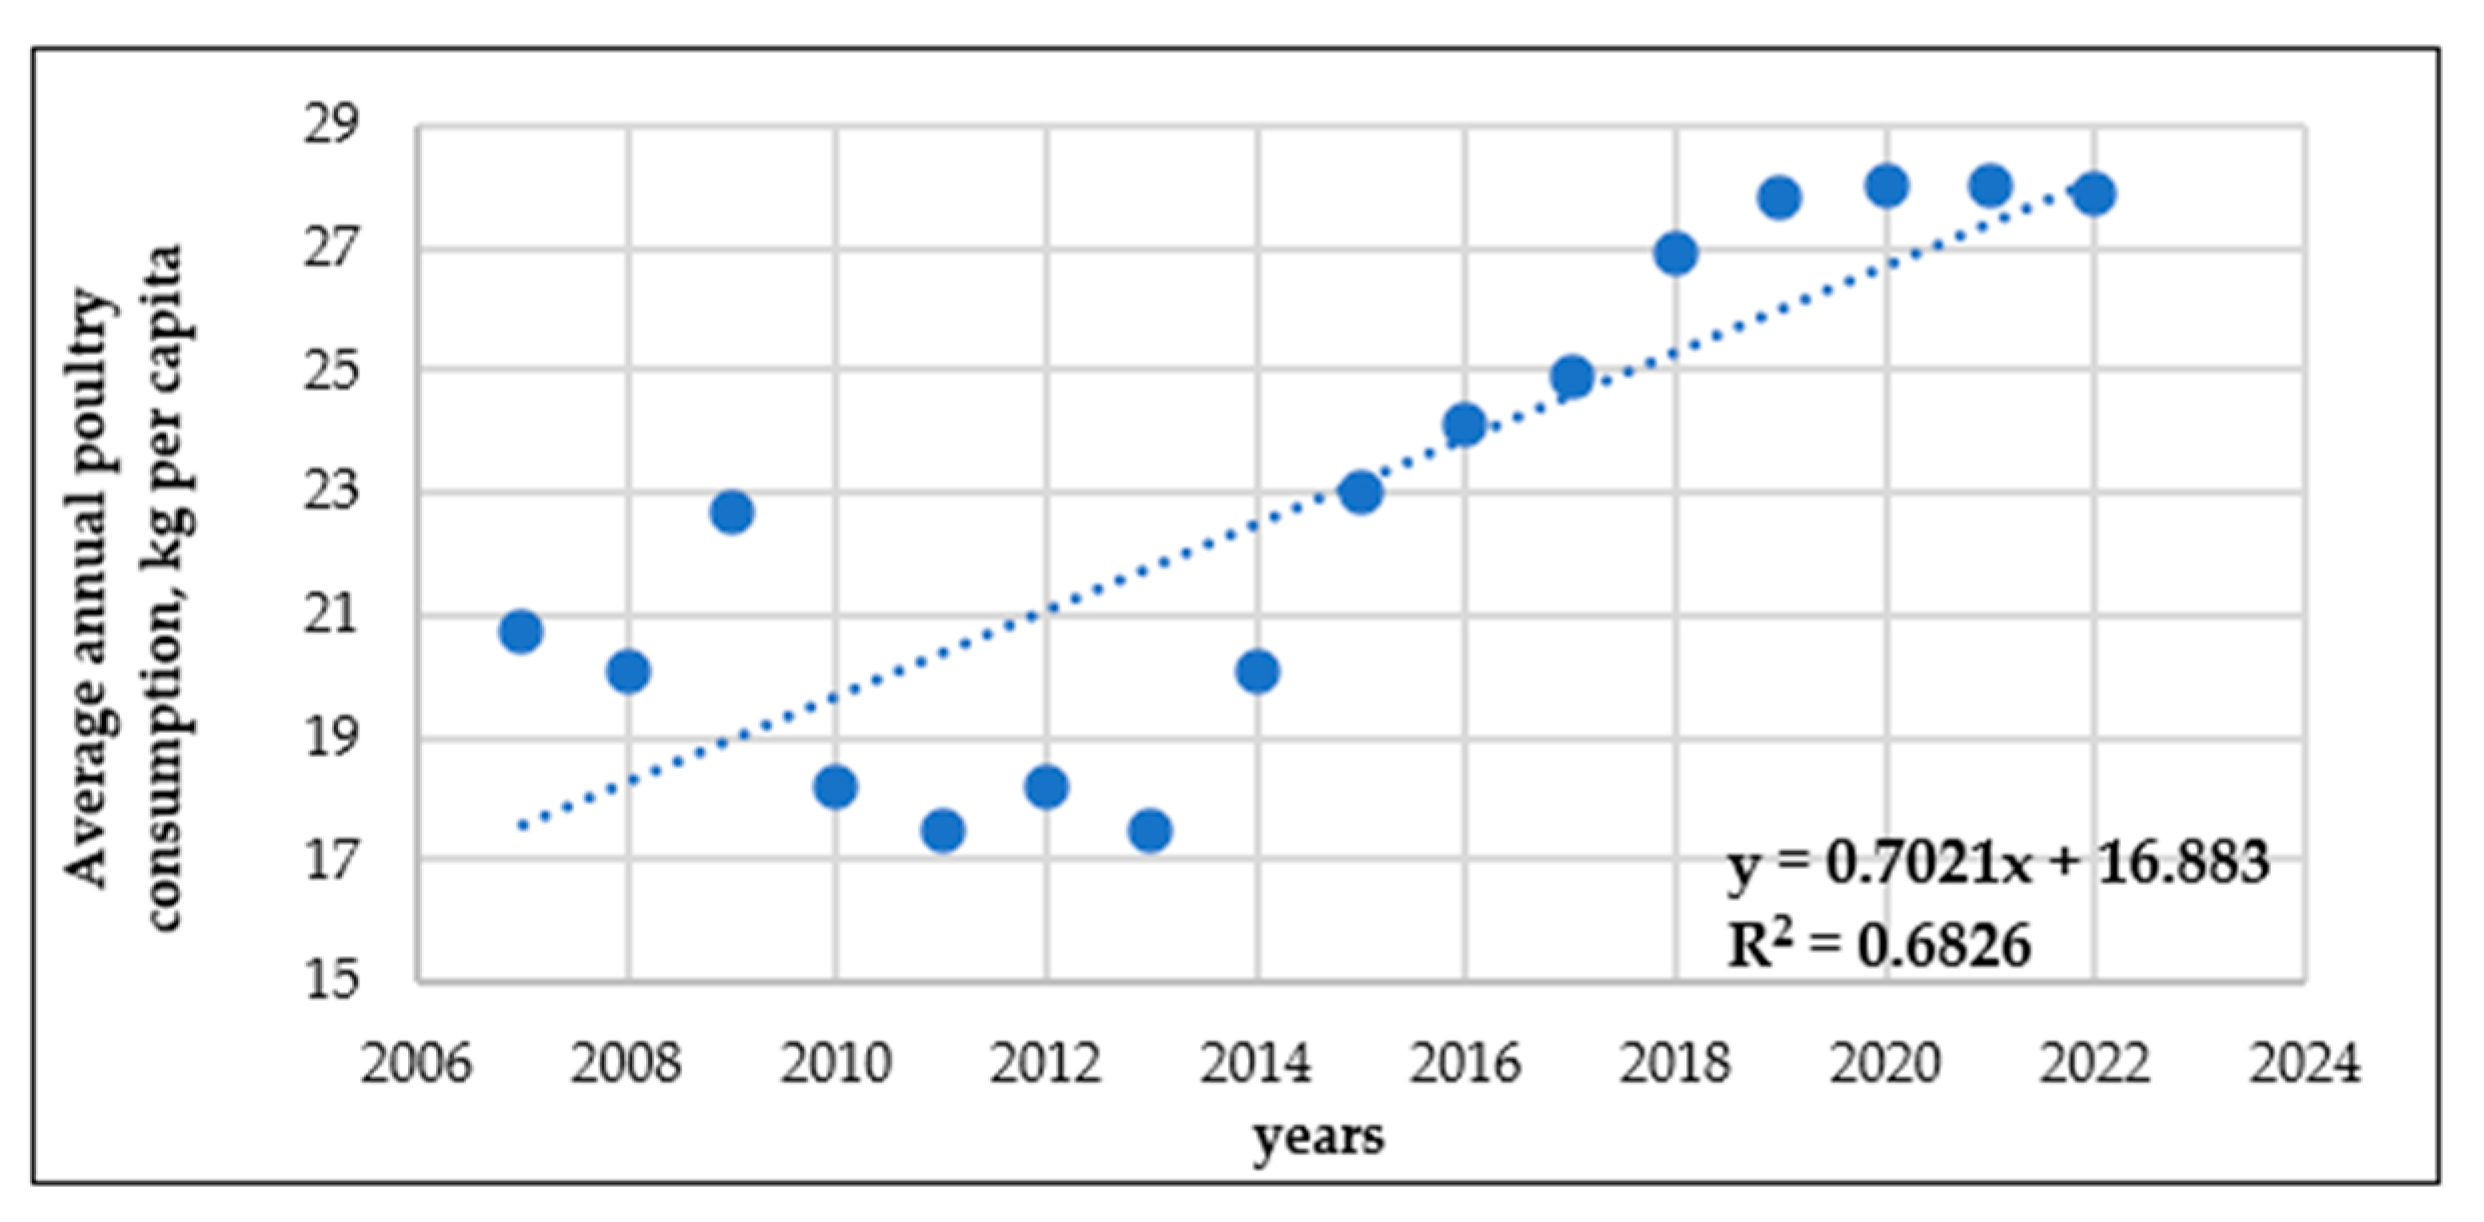
The average annual consumption of poultry had the most evident increase between 2007 and 2022, because poultry has a relatively low price, is white meat intended for consumers of all ages, is found in many diets and is easily tolerated (Figure 7).
In 2020 and 2021, the maximum average annual consumption was 28.0 kg of poultry/inhabitant, and the minimum average annual consumption was in 2011 and 2013, 17.5 kg of poultry/inhabitant (Table 1). During the analyzed period, the increase in the average annual consumption of poultry was 34.78%, the highest value among the 4 analyzed assortments. Compared to global and EU values, in 2022, the annual average per capita poultry consumption in Romania, of 27.9 kg per capita, was above the EU average (22.6 kg per capita) and the global average (17.04 kg per capita) [36].
Of the 4 mathematical models presented in Table 2, the only invalid one is the one for mutton and goat meat, since the tabulated value of the Fisher test is:
F(0.05; 1; 14) = 4.60 > 0.26 = F calculated.
Also, the same conclusion results from the calculation of the value Significance F = 0.6153, much higher than 0.05.
The values of the coefficient of determination R2 ranging from 0.0185 to 0.6826 indicate that, in the linear model, the variation in annual average meat consumption between 2007 and 2022 is largely attributable to the time factor, specifically 68.26% in the case of poultry. Beef and pork consumption is also influenced by other factors, different from time, accounting for 58.5% and 61.25%, respectively.

3.2. Analysis of Meat Consumption in Romania Based on Questionnaire Survey

3.2.1. Descriptive Statistics—Interpretations and Suggestions for Correspondence with Results from Abroad

Table 3 provide an overview of respondents’ demographics, education level and income. Thus, 39.3% of respondents fell into the “21–30 years” age range, representing the largest share; another representative sample, 27.2%, belonged to the “31–40 years” range, which indicates a considerable participation of young people; the percentage of respondents aged “over 51 years” is quite low, being only 2.0%.
65.3% of respondents were female, while 34.7% were male. This may mean a greater preference of women to participate in surveys. 71.6% of respondents came from urban areas, compared to 28.4% who said they live in rural areas.
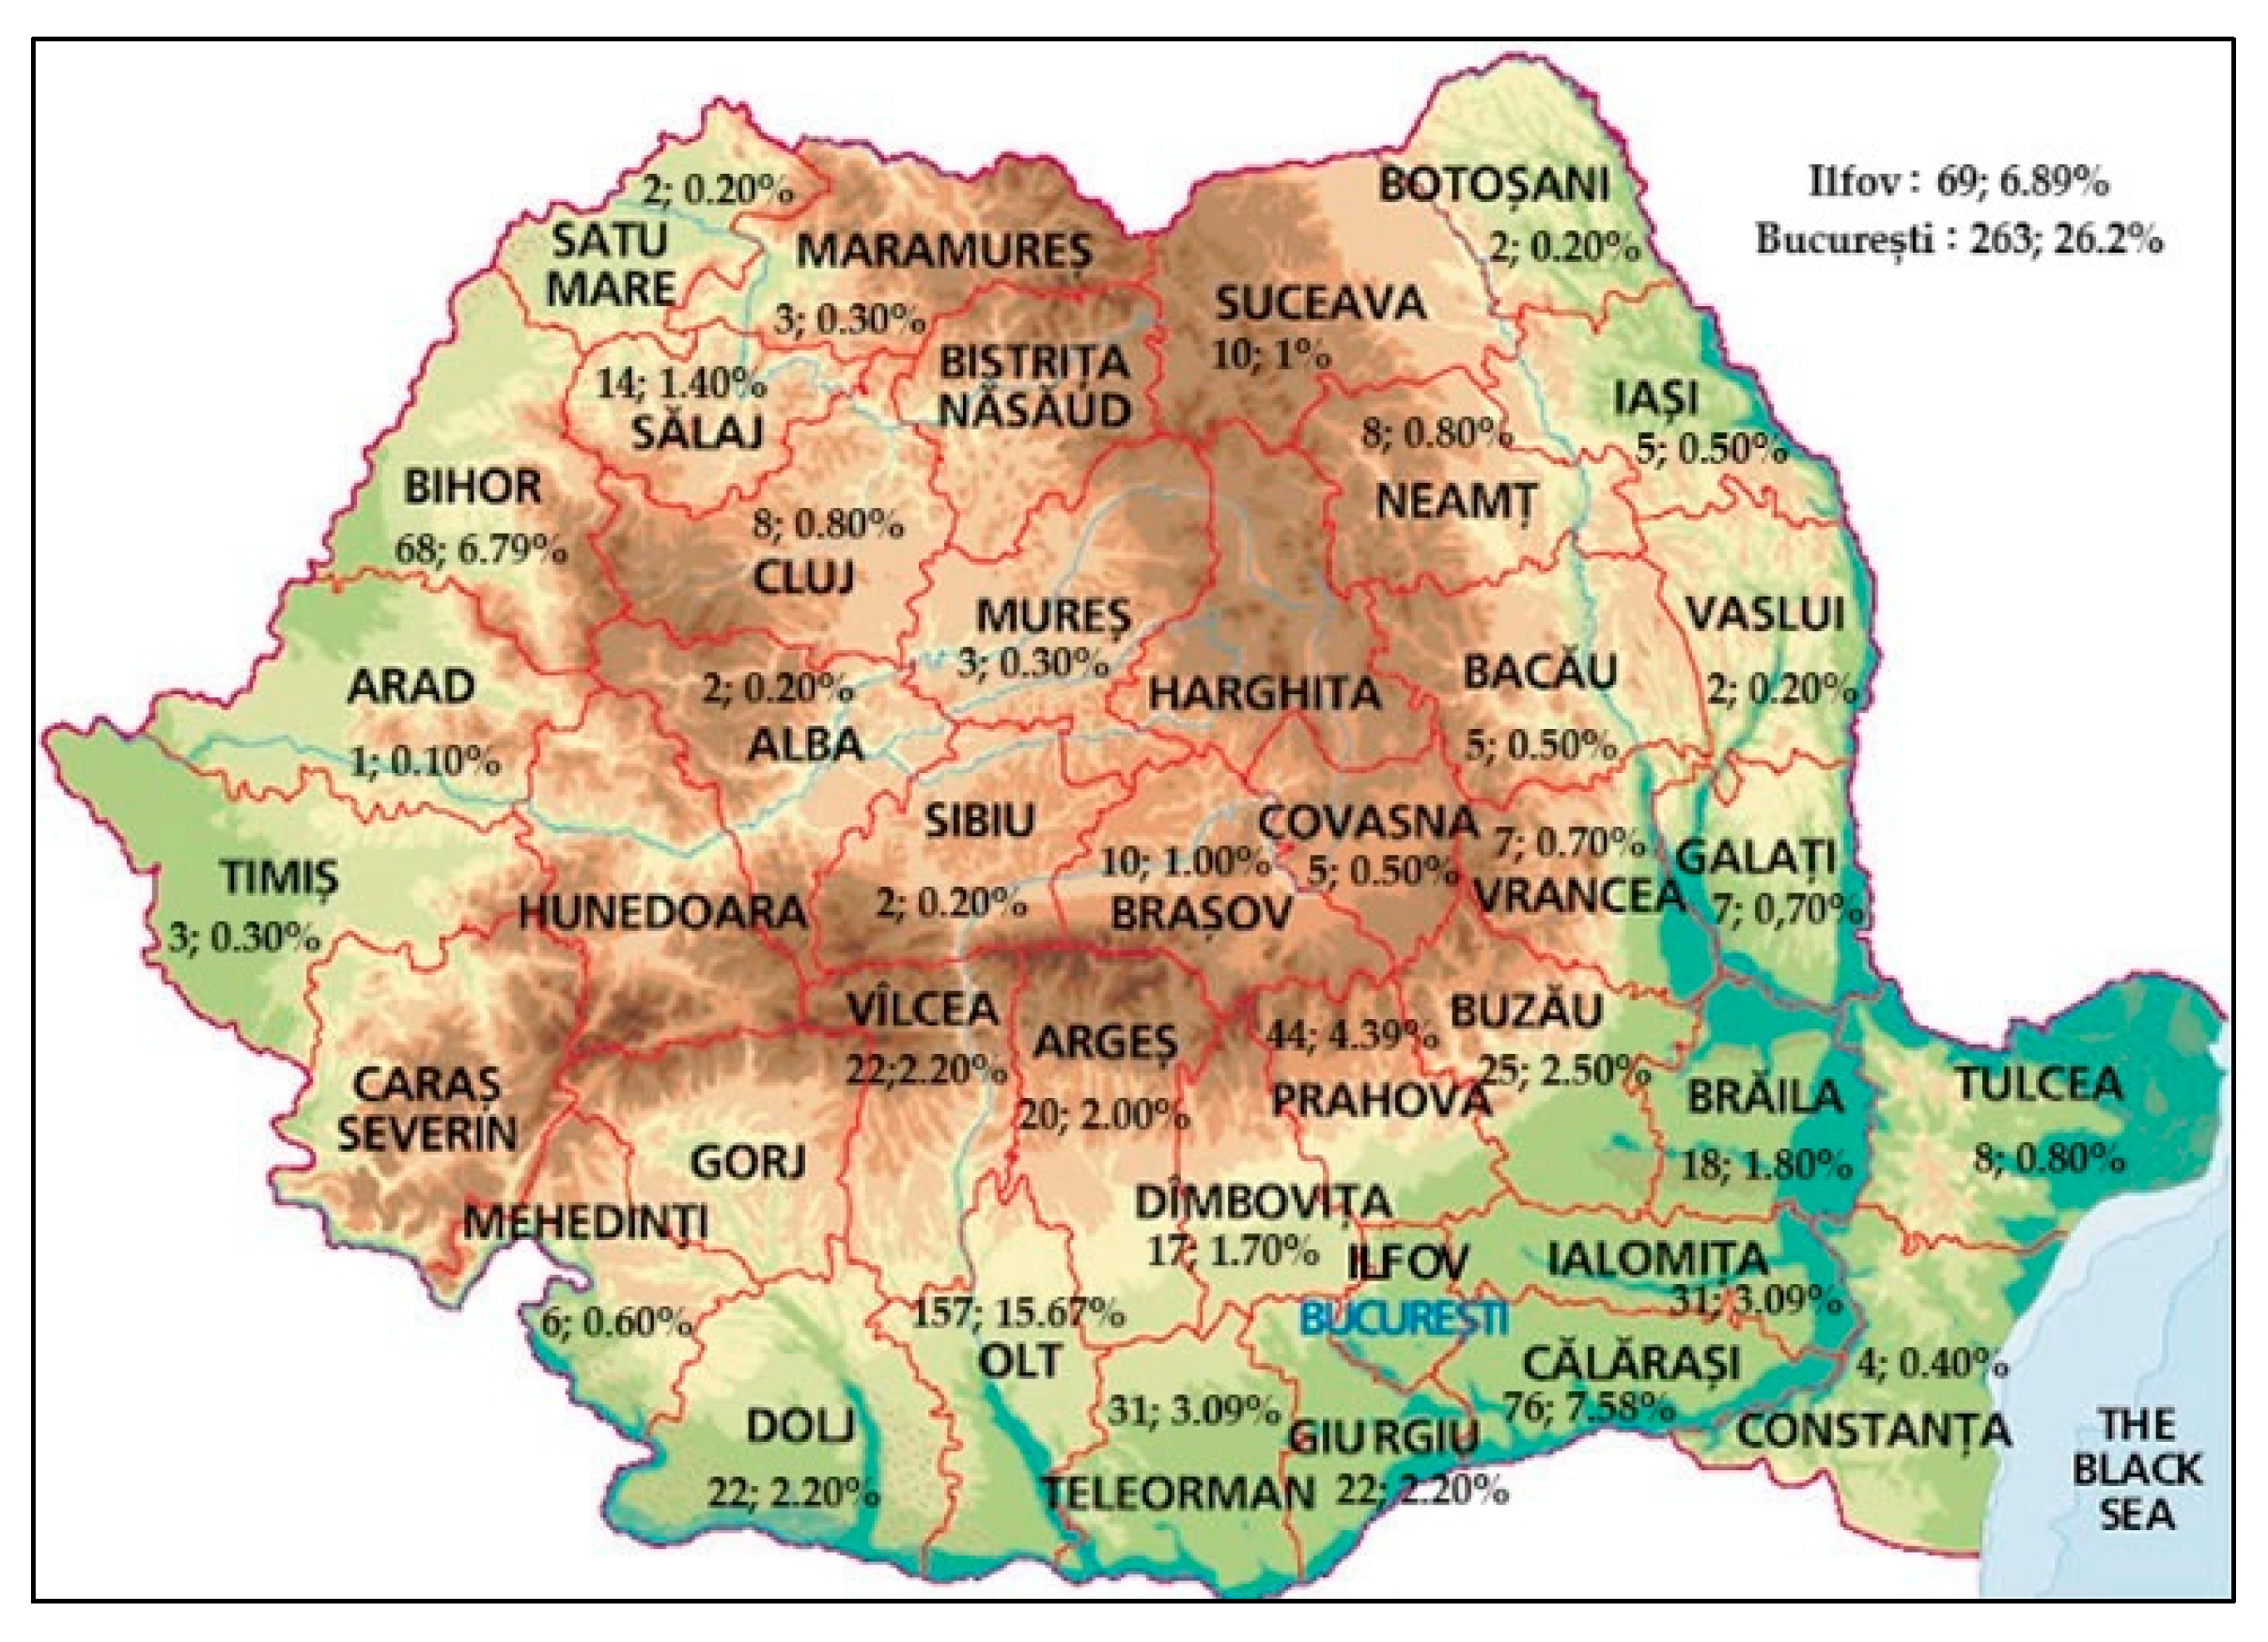
The distribution of respondents by counties shows that of the 41 counties and the capital Bucharest (according to NUTS 3 Romania), only from the counties of Harghita, Caras-Severin, Gorj, Bistrita-Nasaud and Hunedoara there were no respondents. Most questionnaires were completed in Bucharest (263) and Olt County (157)—Figure 8.
In terms of education, the highest percentage is held by respondents with high school education, 38.9%, followed by those with bachelor’s degrees, 31.4%; 20.9% have completed master’s degrees, while only 5.4% have doctoral studies (Table 3). According to studies conducted in Switzerland, it has been found that the amount of meat consumed in a household correlates with the level of education of the members who are part of it. In general, increased meat consumption is associated with people with higher education with unhealthy habits [39].
34.6% of respondents said they get over 5001 lei/month (about 1000 Euro), and 19% less than 2500 lei/month; 18.2% earned between “3001 and 4000” lei/month and 17.9% between “4001 and 5000” lei/month; the lowest percentage was held by those with incomes between “2501–3000” lei/month (Table 3).
More, our respondents stated that they prefer to eat meat especially because of the taste, nutrient content and variety of preparation (Q7). When buying meat, consumers considered as very important criteria the properties of the product, the producer, the place of purchase and the optimal quality-price ratio; important—price and less important product promotion (Q8).
More than half of the respondents consume meat “2–3 times a week” and over 30% “daily” while the lowest percentage was eating meat “once a month” (Q9). The daily or frequent consumption of meat (approximately 88.4% in total) represents an obstacle to sustainability, considering the large resources required for meat production, as well as the high greenhouse gas emissions associated with it. The fact that a significant segment of consumers (9%) consumes meat less frequently suggests that there is emerging awareness or openness to more environmentally friendly eating habits. This group represents a starting point for promoting sustainable diets, as these consumers are already inclined to reduce their reliance on meat in their diet. As a percentage of the diet, meat represented for most consumers “50%” and for about 25%—three quarters of the diet. For another important share, about 20% of respondents, meat accounted for “25%” of the diet (Q10). Most of the Romanians consumed 200–400 g of meat per week and more than 40% of these over 500 g (Q11). Increasing incomes in developing countries is helping to increase meat consumption (especially pork and chicken) by replacing traditional plant-based protein sources. This transition to animal protein is likely irreversible as incomes increase [40].
Poultry meat was preferred by 80% of those asked, followed by pork (over 60%) and beef (over 25%). Those who prefer mutton, accounted for less than 10% of respondents (Q12), according to other studies that showed that Romanian consumers’ preferences regarding types of meat are towards poultry and pork [37]. As exemple, we found research conducted in Germany, showing that meat consumption is high and exceeds the recommended levels for a healthy and sustainable diet, requiring interventions to facilitate changes in the eating behavior [41].
Meat produced in the “conventional” system was chosen by about 50%, and those who opted for meat produced in the “organic” system accounted for around 40% (Q13). These results support the idea of sustainable consumption by highlighting a significant proportion of consumers—approximately 40%—who prefer meat produced through “organic” methods. Organic products are typically associated with more sustainable farming practices, which do not use pesticides and chemical fertilizers, prioritize animal welfare, and, in many cases, production methods that reduce the impact on soil and water and support biodiversity.
Most of the respondents (70%) preferred “traditional Romanian specialties” and 40% “common dishes”. “Specialties from international cuisine” were liked by 22% of those questioned (Q14).
Around 80% of people spent more than 50 lei (about 10 euros) per week (on average/person) for the purchase of meat, but there is also the percentage of 20% who gave less than 50 lei (Q15). These aspects highlight that the environmental effects of higher meat consumption are more evident in higher-income households, according to the study in Chile [16]. It is obvious that meat consumption is closely linked to the income of the population, but also to fluctuations in global meat prices, which can influence food security [42].
According to the answers in the questionnaire, meat is most often bought from the supermarket (62.7%), specialized sellers (54%) and local producers (35.1%) (Q16). The literature has also shown that consumers’ preferences to buy meat are related to supermarkets and restaurants, compared to canteens [43]. Over 90% of those surveyed said that they predominantly buy fresh meat; a considerably small category, of 20% of respondents, stated that they mainly buy frozen meat (Q17).
In order for the players on the Romanian meat market to satisfy the interests of consumers, it is necessary to monitor the quality of the products, to ensure places and conditions of purchase that respect hygiene and food safety, to offer a fair quality-price ratio and to select and certify bidders very carefully (Q18). Meat purchases are influenced by a number of economic and socio-demographic factors: affordability, quality, and perceptions and behaviours related to meat consumption, which differ according to the social, economic and cultural context specific to each region [44].
On the other hand, it rarely happened in the households that expired products are “groceries and preserves” as well as “meat and meat products”, and sometimes bakery products, dairy products, vegetables, fruits and cooked food (Q19). For a group of 166 people, cooked food was declared as frequently expired, and for 134 people “bakery products”. The data presented support sustainable consumption by highlighting habits that contribute to reducing food waste, an essential aspect of sustainability. The analysis shows that in the studied households, expired products rarely include meat and meat products, as well as canned goods and staple foods, which reflects more efficient management of these food categories. Since meat production has a high ecological footprint, avoiding waste in this category is particularly important for reducing greenhouse gas emissions and the use of natural resources. More, a previous study conducted by the authors on food waste revealed similar results regarding expired food categories [45]. The latest estimates of food loss and waste in the meat sector in the European Union are closely linked to greenhouse gas emissions [46].
Romanian meat consumers appreciated that the geopolitical instability of the last period had a negative impact on the meat market (51%), and 32% answered with “I don’t know”. For 8% the impact was positive (Q20).
On the whole, the interviewees said that they do not like or do not consume meat alternatives, but there are also people who choose soy, mushroom, chickpea, pea dishes (Q21). So, we have identified a segment of the population that opts for dishes based on soy, mushrooms, chickpeas, and peas—reflecting their shift towards more sustainable foods, as these plant-based protein sources have a much lower ecological footprint than meat. Moreover, meat-based products combined with plant-based products as an intermediate solution for consumers who are not willing to completely give up meat represent a more sustainable food formula (“a plate”) by reducing the amount of meat used and, consequently, the negative environmental impact. Consumer preferences have been well received by meat companies, which have also introduced plant-based substitutes into production, with the consumption of these types of products expected to increase by 2028 [47]. Estimates of plant-based alternatives (in particular legumes and oilseeds) will play an increasingly important role in the diet of the EU population [48]. On the other hand, consumers who do not want to give up meat completely have the option of meat mixed with vegetable proteins, which is a more sustainable product [49]. Another consumption option is cultured meat, which can contribute to global food security, especially in the context of population growth and climate change. Through the technology used, greenhouse gas emissions will be reduced and the use of resources (land, water and energy) will be reduced [50,51]. All these aspects are in the context of ensuring global food security through protein alternatives, such as: plant-based meat substitutes (with a lower ethical risk) and cultured meat [52].
Over 70% of the survey participants estimated that meat consumption “will remain constant”, while in the opinion of 23% of respondents it will “decrease”. Only 2.5% believe that it will “increase” (Q22). However, it should be taken into account that there are a number of studies that refer to the negative effects on the health of the population generated by meat consumption. In this context, a series of social marketing actions have emerged, especially online, the objective being to reduce meat consumption [53]. Decisions about meat consumption are also considered to have numerous effects on the environment. The high consumption, but especially of red meat, represents a direct threat to the health of the population [54]. According to data provided by the Statista platform [55], an increase in meat consumption is predicted by 2032, both worldwide (28.8 kg/capita) and continental. Globally, there are intense concerns regarding meat production, and changes in consumer behavior are also desired. In Europe, concerns about environmental impacts, animal welfare and food security are projected to lead to a decrease in pork consumption by 2031 to 31 kg per capita [56]. The fact that more than 20% of our respondents believe they will reduce their meat consumption demonstrates a shift towards increasing sustainability among Romanians as well.
The motivation for answering question 22 (Q22) is due to the preference for meat or the change in the future of the meat-to-vegetable ratio in favour of the latter (Q23). For optimal nutritional status, policymakers need to be involved in the development of programmes that support healthy behaviours that drive the reduction of meat consumption in favour of fruits and vegetables [57]. There are studies that promote the intensive consumption of insects, to the detriment of meat, which are based on their ecological advantages [22]. In the future, the food industry will move towards products that will also have additional health-promoting functions, helping to prevent disease, through diet [58]. Carbon footprint labels can be a viable and low-cost policy tool in the future to encourage more sustainable food choices, to the detriment of meat consumption [59].

3.2.2. ANOVA Results and Discussions

For the ANOVA analysis in our study, we chose to report only analyses where we obtained significant results, meaning the p-value was below the significance threshold of 0.05, indicating that there are significant differences between group means, thereby leading to the rejection of the null hypothesis. We also indicated the level of the effect size measure (eta-square, η2). The results are presented in the tables below.
Thus, Table 4 shows that there are significant differences in meat consumption among different age categories (Q1), as well as in terms of satisfying consumer interests. In these conditions, it is necessary for actors in the Romanian meat market to provide a fair quality-price ratio and carefully select and certify suppliers, as unconsumed or expired food products are usually bakery products, dairy, and prepared foods. At the same time, the estimation that recent geopolitical instability has a negative impact and the expectation that future meat consumption will remain constant is also influenced by age.
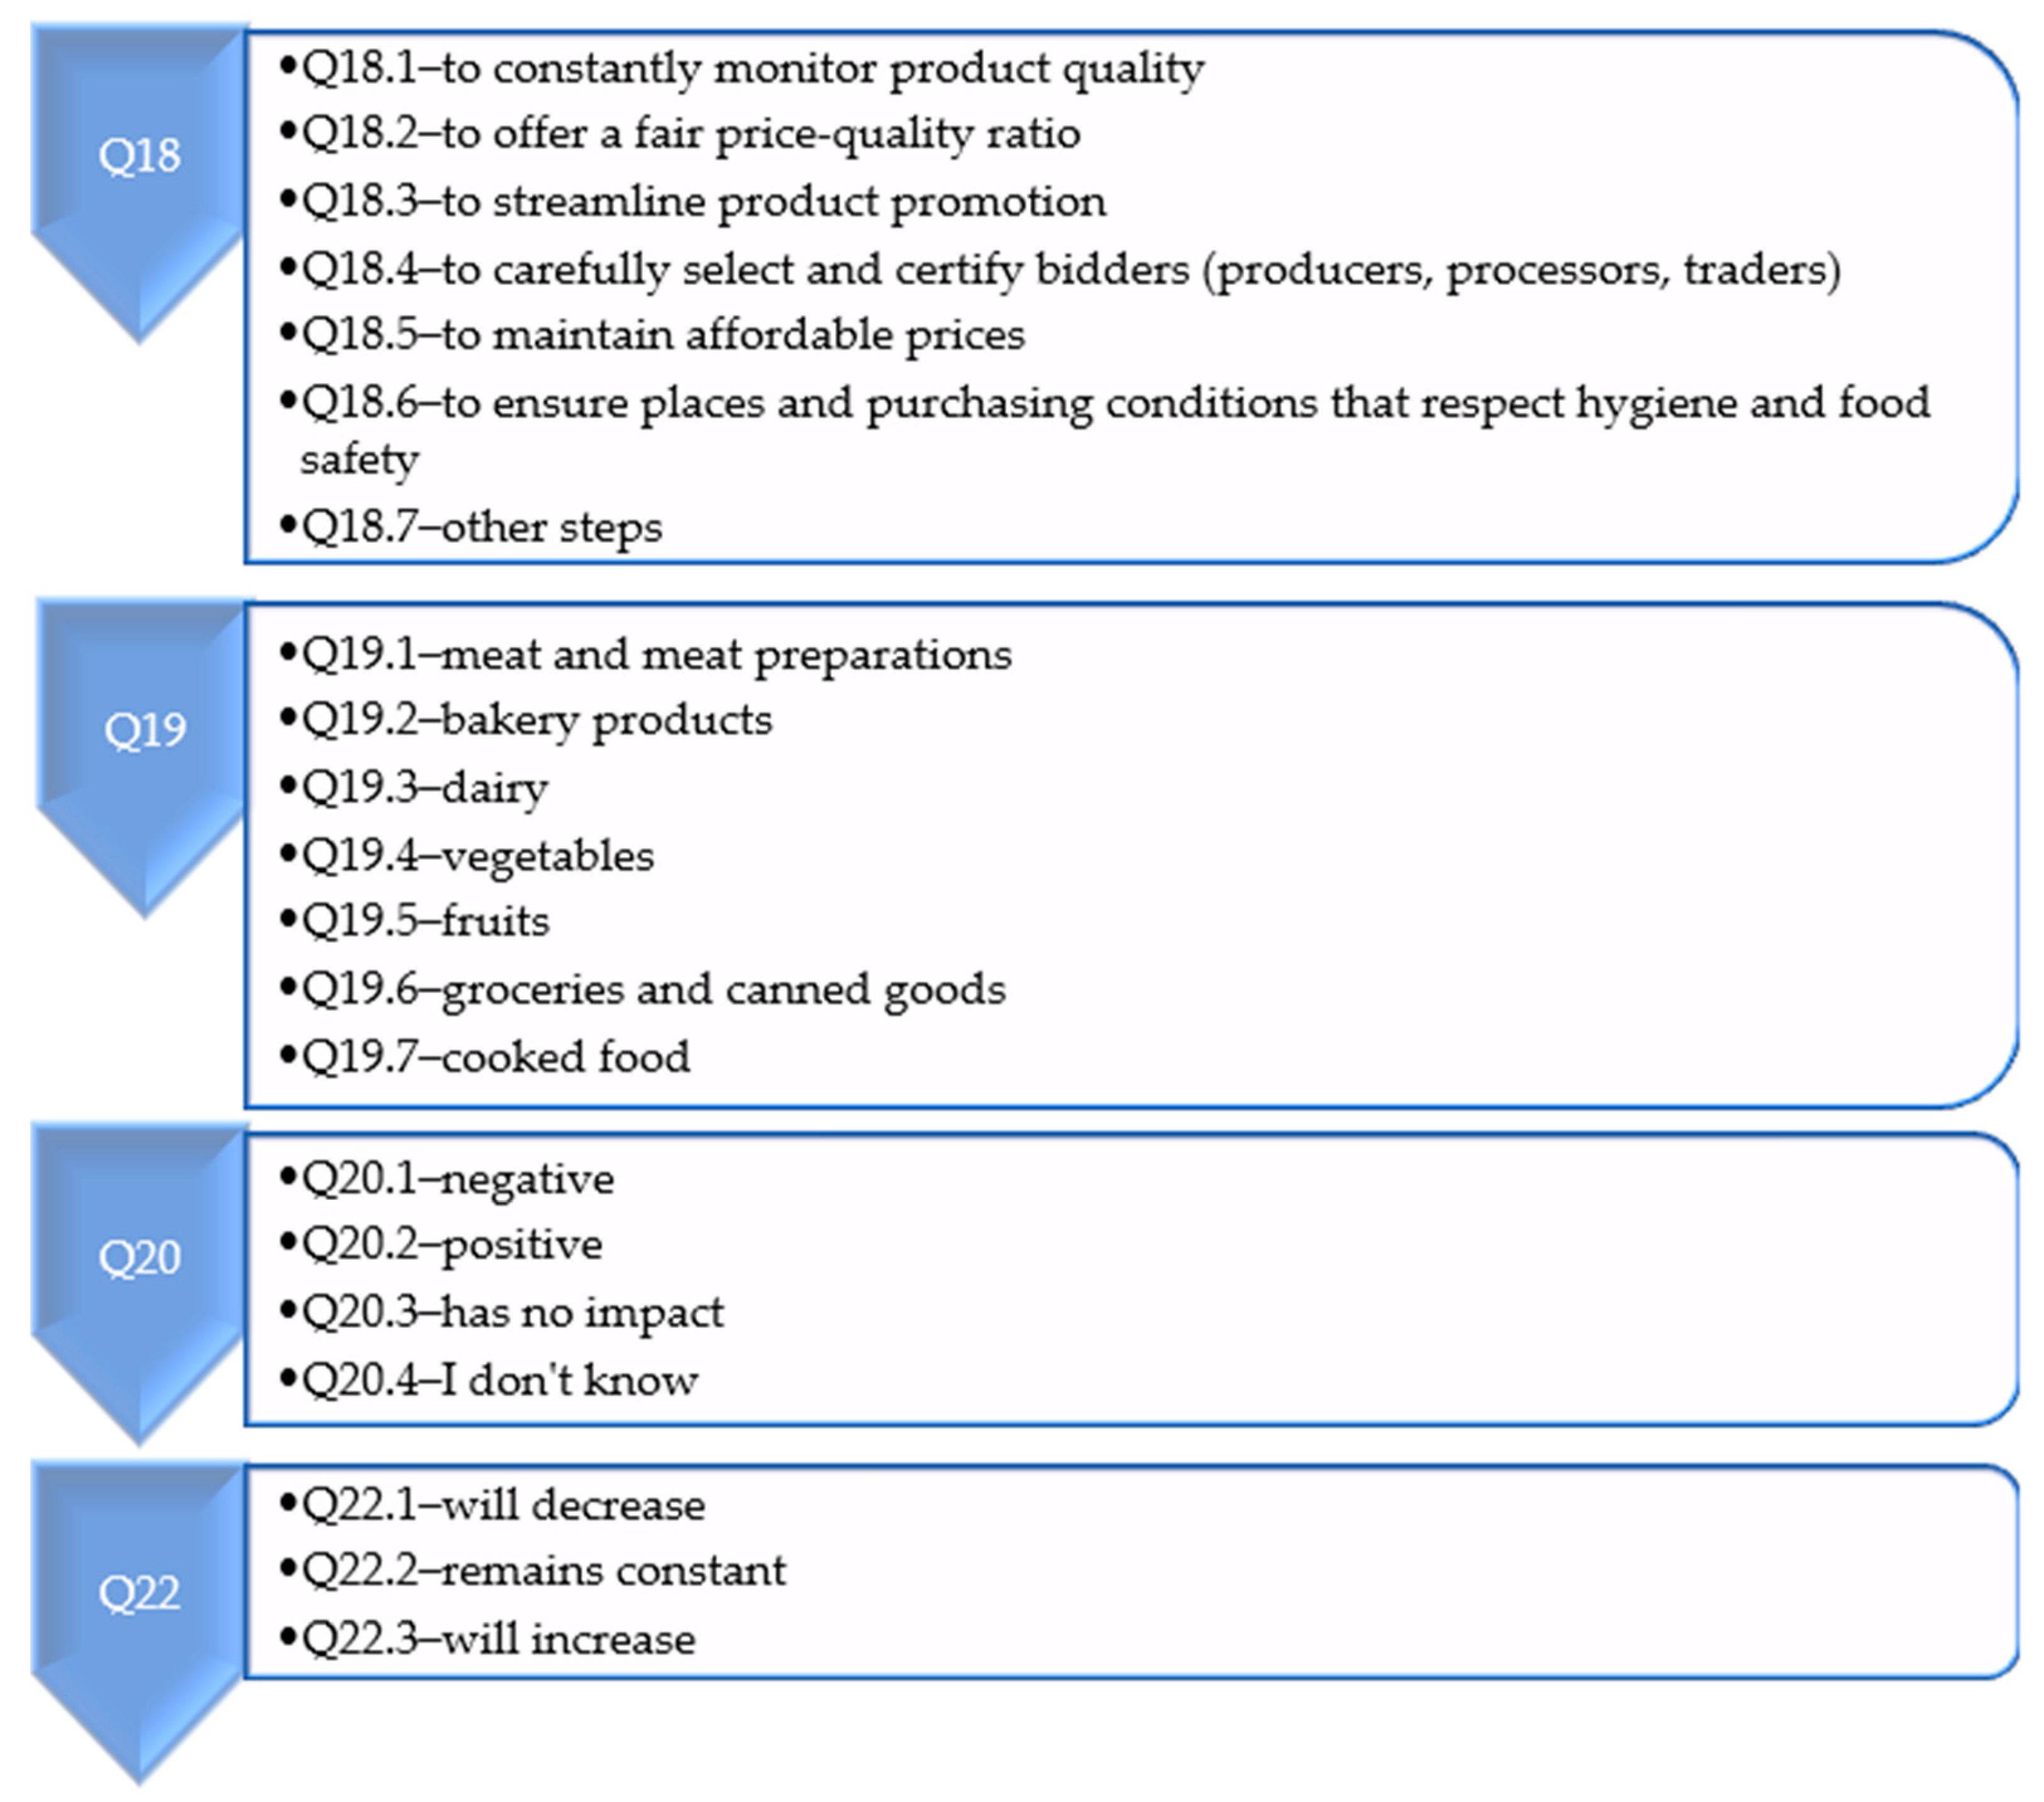
To facilitate the understanding and interpretation of the data in Table 4, we introduce additional clarifications about variables Q18–Q20, Q22 in the form of Figure 9.
In Table 5, we highlighted that meat consumption differs based on gender (Q2). In this context, to meet the interests of Romanian consumers, it is necessary for actors in the meat market to consistently focus on product quality and ensure purchasing locations and conditions that adhere to hygiene and food safety standards.
In Table 6, it was found that there are notable differences in meat consumption based on place of residence (rural versus urban, Q3), which necessitates that actors in the Romanian meat market provide a fair quality-price ratio. At the same time, it was indicated that unconsumed or expired food products are usually groceries and canned goods, and it is estimated that current meat consumption will remain constant.
The Table 7 indicates that there are significant differences in meat consumption based on different levels of education (Q5). In this regard, it is necessary for actors in the Romanian meat market to maintain affordable prices and take similar measures. It was also noted that bakery products are the main unconsumed food items, while recent geopolitical instability has a negative impact on the Romanian meat market. However, it is estimated that future meat consumption will remain constant compared to current levels.
Table 8 showed that there are significant differences in meat consumption based on monthly income level (Q6). In terms of consumer interests, these are reflected in the need for operators in the Romanian meat market to optimize product promotion along with other measures. Additionally, monthly income differentiates the types of unconsumed products, namely meat and meat preparations. Recent geopolitical instability has a negative impact on the Romanian meat market, and it is expected that future meat consumption will remain constant compared to current levels.
Summarizing the results, at a social level, it should be borne in mind that consumers’ reluctance to behavioural changes may be related to food neophobia [60,61], social norms, traditions, as well as stressors in times of crisis (e.g., the COVID-19 pandemic) [62], which may be contradictory to healthy eating habits, and thus, generating resistance to change.
4. Conclusions

Globally, there is an increase in meat consumption, despite specialists’ recommendations and the increasing availability of alternative products. These products offer various benefits to consumers and align with emerging global demands related to sustainability and health. However, although the studied literature indicates that research focuses on the development of meat substitutes to promote more sustainable consumption, statistical data from Romania and the results of the questionnaire reveal that Romanian consumers continue to predominantly prefer meat.
In the period 2007–2022 in Romania, the average annual meat consumption generated asymmetric trends, as following: poultry (+34.78%), pork (+17.28%), and for beef we witnessed a decrease of 39.76%. The consumption of mutton and goat meat had an insignificant variation, in 2007 and 2022 having equal values, of 2.6 kg/inhabitant. According to the survey results, it was found that respondents chose chicken at a rate of 80%, pork at 60%, beef over 25%, and mutton less than 10%.
The survey mainly reflected the opinions of a young population (21–30 years old), predominantly female and from urban areas. The respondents have an average level of education, and the income for about a third of those interviewed is over 5001 lei. We do not have an equal distribution of respondents in the country’s counties or in terms of age groups.
The results of the questionnaire show that Romanians prefer to consume meat mainly because of its quality, such as taste and nutrient content. Another aspect that determines the choice of this food refers to the variety of preparation. The main criteria underlying the type of meat are the properties of the product (quality, appearance, assortment range, availability, warranty), the producer, the place of purchase and the optimal quality-price ratio. A significant part of the respondents consumed meat “2–3 times a week”—this highlights the Romanians’ preference for meat and it is supported by the most consumers’ answers stating that meat represented “50%” as a percentage of the diet and quantitatively between 200–400 g of meat per week.
Regarding the type of meat preferred by Romanians, the respondents mostly said that they choose poultry. The next categories were pork and beef. In addition, most of the respondents chose meat produced in the “conventional” system and “traditional Romanian specialties”.
A considerable proportion of consumers spent weekly (on average/person) over 50 lei for the purchase of meat, especially from the supermarket and then from specialized stores. Most of the respondents preferred to stock up on fresh meat. The weekly amount spent on meat, along with income and frequency of consumption, can provide valuable insights into market segments and the purchasing power of the population.
The main motivations for meat consumption and purchasing habits reveal the aspects that the meat industry must take into account in promoting its products. In the opinion of those interviewed, operators on the meat market in Romania are required to consider the level of product quality, the rules on hygiene and food safety and last but not least to offer a fair quality-price ratio. “Meat and meat products” were rarely found among the expired products from the households of those surveyed. Here, age was correlated with the category of food eliminated predominantly from households, which in our case indicated the degree of food waste and the type of food wasted.
Due to the food consumption model in Romania, in which meat occupies a central place, respondents said that they do not generally consume meat alternatives, but nevertheless a part chose to consume soy, mushroom, chickpea, pea dishes. According to respondents, in the future meat consumption “will remain constant”. We could say that, despite the available studies promoting meat alternatives, the traditional beliefs of Romanian consumers regarding the consumption of meat versus products of plant origin are difficult to change in the absence of administrative policies to capitalize on the results of research.
The sample used as the basis for analyzing meat consumption in Romania had a relatively small size compared to the country’s total population, consisting of 1002 respondents. Although this research is not exhaustive, it successfully highlighted the meat consumption preferences of Romanian consumers, aligning with trends reflected in national statistical data. In the future, the study could be expanded to include a larger sample of respondents, with a uniform distribution at the national level. Key factors to consider for accurate data processing and interpretation include the initial testing of the questionnaire model, as well as cleaning the database of incomplete or erroneous responses.
Overall, the research results can be interpreted as supporting the orientation of Romanians towards an initial transition to sustainability, highlighted by several aspects: firstly, there is a noticeable reduction in beef consumption, accompanied by an insignificant increase in the consumption of mutton and goat meat, species associated with a significant environmental impact. Secondly, approximately 9% of consumers reported consuming meat “less frequently”, which may indicate an openness to more environmentally friendly diets. Additionally, around 40% of respondents prefer organic meat, which is correlated with sustainable agricultural practices. Furthermore, efficient food management, reflected in the reduction of meat waste, underscores a concern for the responsible use of resources. Lastly, an increased interest in plant-based alternatives, such as soy, mushrooms, and chickpeas, demonstrates a trend towards diversifying food sources in the direction of sustainability.
Meat consumption in Romania has had and seems to keep in the future an important role in nutrition, so, in order to increase sustainability, consumers should be invited, through fair information, to adopt a rational consumption in order to maintain their own health and to protect the environment.
The deep attachment to the meat diet can be impacted and diminished by the constant orientation of consumers’ interest towards environmental issues and sustainability, human and animal welfare, as the consumer of the future should be informed on the basis of extensive and thorough research and sensitized to issues related to sustainability, nutrition, social and ethical issues associated with meat and meat alternatives. Technological developments successfully facilitate the processing of large amounts of data from consumer questionnaires, helping to simplify their effort in ex-pressing their food choice regarding meat and its alternatives.
We appreciate that the results of survey and the analysis, correlations and approaches done within this paper could serve as a basis for meat consumption patterns in Romania, future marketing policies and sustainable development strategies in the food industry.

Author Contributions

Conceptualization, I.-A.C., I.M.V. and I.Z.; methodology, I.M.V., L.D. and I.Z.; software, I.M.V.; validation, I.M.V., L.D. and I.Z.; formal analysis, P.S.; investigation, I.-A.C.; resources, G.F.; data curation, V.C.T.; writing—original draft preparation, E.S. and I.Z.; writing—review and editing, P.S., I.Z. and I.-A.C.; visualization, D.I.S.; supervision, I.-A.C. and I.Z.; project administration, T.A.D.; funding acquisition, M.M.M. All authors have read and agreed to the published version of the manuscript.

Funding

This research received no external funding.

Institutional Review Board Statement

The study was conducted in accordance with the Declaration of Helsinki, and the protocol was approved by the University Ethics Committee—Subcommittee on Scientific Research Ethics of University of Agronomic Sciences and Veterinary Medicine of Bucharest (USAMV) (approval code: 1260) on 20 November 2024.

Informed Consent Statement

Informed consent was obtained from all subjects involved in the study.

Data Availability Statement

The data presented in this study are available on request from the corresponding author.

Acknowledgments

This work was supported by a grant of the University of Agronomic Sciences and Veterinary Medicine of Bucharest Project number 1060/15.06.2022, ”Propuneri de măsuri strategice în agricultura din România în contextul instabilității geopolitice/Proposals for strategic measures in Romanian agriculture in the context of geopolitical instability”, Acronym AgRoMaS, within IPC 2022; co-financier PRO-AGRO Federation.

Conflicts of Interest

The authors declare no conflicts of interest.

References

  1. Smith, N.W.; Fletcher, A.J.; Hill, J.P.; McNabb, W.C. Modeling the Contribution of Meat to Global Nutrient Availability. Front. Nutr. 2022, 9, 766796. [Google Scholar] [CrossRef] [PubMed]
  2. Beciu, S.; Arghiroiu, G.A.; Bobeică, M. From Origins to Trends: A Bibliometric Examination of Ethical Food Consumption. Foods 2024, 13, 2048. [Google Scholar] [CrossRef]
  3. Bonnet, C.; Coinon, M. Environmental co-benefits of health policies to reduce meat consumption: A narrative review. Health Policy 2024, 143, 105017. [Google Scholar] [CrossRef]
  4. Predanócyová, K.; Kubicová, Ľ.; Pindešová, D. Understanding gender differences in meat consumption with an emphasis on the perception of the quality and health aspect of meat. J. Microbiol. Biotechnol. Food Sci. 2023, 12, e9886. [Google Scholar] [CrossRef]
  5. Ghimpeteanu, O.M.; Mihai, O.D.; Badea, E.; Stanca, L.; Bujor-Nenita, O.; Pogurschi, E.N.; Petcu, C.D.; Borda, C.; Tapaloaga, D. Evaluation of consumer knowledge, attitudes and perceptions regarding antioxidants and their consumption through meat products. Sci. Pap. Ser. D Anim. Sci. 2023, LXVI, 507–511. [Google Scholar]
  6. Roozen, I.; Raedts, M. What determines omnivores’ meat consumption and their willingness to reduce the amount of meat they eat? Nutr. Health 2023, 29, 347–355. [Google Scholar] [CrossRef]
  7. Gonçalves, J.C.; Guiné, R.P.F.; Djekic, I.; Smigic, N. Consumers’ attitudes toward refrigerated ready-to-eat meat and dairy foods. Open Agric. 2023, 8, 20220155. [Google Scholar] [CrossRef]
  8. Estell, M.; Hughes, J.; Grafenauer, S. Plant Protein and Plant-Based Meat Alternatives: Consumer and Nutrition Professional Attitudes and Perceptions. Sustainability 2021, 13, 1478. [Google Scholar] [CrossRef]
  9. Li, J.; Silver, C.; Gómez, M.I.; Milstein, M.; Sogari, G. Factors influencing consumer purchase intent for meat and meat substitutes. Future Foods 2023, 7, 100236. [Google Scholar] [CrossRef]
  10. Matharu, G.K.; von der Heidt, T.; Sorwar, G. Consumer behavior toward plant-based foods: A theoretical review, synthesis and conceptual framework. Br. Food J. 2024, 126, 3372–3396. [Google Scholar] [CrossRef]
  11. Almeida, A.; Torres, J.; Rodrigues, I. The impact of meat consumption on human health, the environment and animal welfare: Perceptions and knowledge of pre-service teachers. Societies 2023, 13, 143. [Google Scholar] [CrossRef]
  12. Kopplin, C.S.; Rausch, T.M. Above and beyond meat: The role of consumers’ dietary behavior for the purchase of plant-based food substitutes. Rev. Manag. Sci. 2022, 16, 1335–1364. [Google Scholar] [CrossRef]
  13. Pechey, R.; Hollands, G.J.; Marteau, T.M. Are meat options preferred to comparable vegetarian options? An experimental study. BMC Res. Notes 2021, 14, 37. [Google Scholar] [CrossRef] [PubMed]
  14. Frank, P.; Heimann, K.; Kolbe, V.; Schuster, C. Can guided introspection help avoid rationalization of meat consumption? Mixed-methods results of a pilot experimental study. Clean. Responsible Consum. 2022, 6, 100070. [Google Scholar] [CrossRef]
  15. Yip, C.S.C.; Yip, Y.C.; Chan, W. Sustainable meat consumption: Global and regional greenhouse gas emission implications and counterfactual scenario analyses. Environ. Dev. Sustain. 2024, 26, 17431–17448. [Google Scholar] [CrossRef]
  16. Riveros, F.; López-Eccher, C.; Muñoz, E. Life cycle assessment of food consumption in different cities: Analysis of socioeconomic level and environmental hotspots. Clean. Environ. Syst. 2024, 13, 100190. [Google Scholar] [CrossRef]
  17. Milman, O. Meat Accounts for Nearly 60% of All Greenhouse Gases from Food Production, Study Finds. The Guardian, 13 September 2021. Available online: https://www.theguardian.com/environment/2021/sep/13/meat-greenhouses-gases-food-production-study (accessed on 23 August 2024).
  18. Font-i-Furnols, M. Meat Consumption, Sustainability and Alternatives: An Overview of Motives and Barriers. Foods 2023, 12, 2144. [Google Scholar] [CrossRef]
  19. Directorate-General for Health and Food Safety. Novel Food. Available online: https://food.ec.europa.eu/safety/novel-food_en (accessed on 5 September 2024).
  20. Soare, E.; Stoicea, P.; Dobre, C.A.; Iorga, A.M.; Balan, A.V.; Chiurciu, I.A. Prospects for European Union’s meat production in the context of current consumption challenges. Sci. Pap. Ser. Manag. Econ. Eng. Agric. Rural Dev. 2023, 23, 799–806. [Google Scholar]
  21. Su, Y.; Chen, J.L.; Zhao, M.; Liao, H.J.; Zhao, M.; Du, Y.Z.; Lu, M.X. Insects are a delicacy: Exploring consumer acceptance and market demand for edible insects in China. J. Insects Food Feed 2022, 9, 389–398. [Google Scholar] [CrossRef]
  22. Nichita, A.; Tylewicz, U.; Popa, M.E. Transition to the future: Meat analogues & cultured meat. AgroLife Sci. J. 2023, 12, 132–142. [Google Scholar] [CrossRef]
  23. Ishwarya Shankaran, P.; Kumari, P. Nutritional Analysis of Plant-Based Meat: Current Advances and Future Potential. Appl. Sci. 2024, 14, 4154. [Google Scholar] [CrossRef]
  24. Van Mierlo, K.; Baert, L.; Bracquené, E.; De Tavernier, J.; Geeraerd, A. Moving from pork to soy-based meat substitutes: Evaluating environmental impacts in relation to nutritional values. Future Foods 2022, 5, 100135. [Google Scholar] [CrossRef]
  25. INS—Institutul Național de Statistică (National Institute of Statistics). Consumul Mediu Anual pe Locuitor, la Principalele Produse Alimentare si Bauturi (Average Annual Consumption per Capita of the Main Food and Beverage Products). Available online: www.insse.ro (accessed on 8 August 2024).
  26. Anderson, D.R.; Sweeney, D.J.; Williams, T.A.; Camm, J.D.; Cochran, J.J.; Fry, M.J.; Ohlmann, J.W. Chapter 14: Simple Linear Regression. In Cengage Learn; Boston, MA, USA. 2019, p. 653. Available online: http://faculty.salisbury.edu/~fxsalimian/Info281/cs/SM%20SBE13E%20Chapter%2014.pdf (accessed on 10 August 2024).
  27. Salvatore, D.; Reagle, D. Chapter 6: Simple Regression Analysis. In Theory and Problems of Statistics and Econometrics, 2nd ed.; Schaum’s Outline Series; McGraw-Hill: New York, NY, USA, 2002; pp. 18–38, 50–57. Available online: https://dokumen.pub/schaums-outline-of-theory-and-problems-of-statistics-and-econometrics-2nd-ed-9780071348522-0-07-134852-2-0071395687.html (accessed on 12 August 2024).
  28. Cauc, I.; Manu, B.; Pârlea, D.; Goran, L. Chapter 2: Etapele cercetării sociologice (Stages of sociological research), Chapter 4: Ancheta pe bază de chestionar (Questionnaire-based survey). In Metodologia Cercetării Sociologice (Methodology of Sociological Research); Fundației România de Mâine: Bucharest, Romania, 2004; pp. 18–38. Available online: https://www.academia.edu/6983069/UNIVERSITATEA_SPIRU_HARET_FACULTATEA_DE_SOCIOLOGIE_PSIHOLOGIE_ION_CAUC (accessed on 18 August 2024).
  29. Vlad, I.M.; Butcaru, A.C.; Fîntîneru, G.; Bădulescu, L.; Stănică, F.; Toma, E. Mapping the Preferences of Apple Consumption in Romania. Horticulturae 2023, 9, 35. [Google Scholar] [CrossRef]
  30. Vlad, I.M.; Beciu, S.; Ladaru, G.R. Seasonality and forecasting in the Romanian trade with live animals. Conf. Agric. Life Life Agric. 2015, 6, 712–719. [Google Scholar] [CrossRef]
  31. Vlad, I.M.; Dinu, T.A.; Beciu, S. Dynamics and Romania’s Partners in Trade of Live Animals. Sci. Pap. Ser. Manag. Econ. Eng. Agric. Rural Dev. 2014, 14, 405–411. [Google Scholar]
  32. Popescu, A.; Chirciu, I.; Soare, E.; Stoicea, P.; Iorga, A. Trends in average annual food consumption per inhabitant in Romania. Sci. Pap. Ser. Manag. Econ. Eng. Agric. Rural Dev. 2022, 22, 561–580. [Google Scholar]
  33. Uliu, D.V.; Staic, L.G.; Vladu, M. Studies on production, consumption and trade balance situation of meat in Romania. Sci. Pap. Ser. Manag. Econ. Eng. Agric. Rural Dev. 2022, 22, 679–686. [Google Scholar]
  34. Panzaru, R.L.; Medelete, D.M. Some considerations regarding meat consumption in Romania (2014–2018). Sci. Pap. Ser. Manag. Econ. Eng. Agric. Rural Dev. 2021, 21, 403–408. [Google Scholar]
  35. Tenu, F.; Serban, A.; Donosa, R.E.; Alecu, C.; Maciuc, V. Study regarding the beef meat production evolution worldwide and national level. Sci. Pap. Ser. D Anim. Sci. 2023, LXVI, 352–362. [Google Scholar]
  36. FAOSTAT—Food and Agriculture Organization of the United Nations. Food Balances. Available online: https://www.fao.org/faostat/en/#data/FBS (accessed on 3 November 2024).
  37. Chiurciu, I.A.; Zaharia, I.; Fintineru, G.; Dinu, T.A.; Soare, E. Sheep and Goat breeding in Romania—Between tradition and consumption. Sci. Pap. Ser. Manag. Econ. Eng. Agric. Rural Dev. 2023, 23, 135–144. [Google Scholar]
  38. Informateca. 2023. Available online: https://informateca.ro/se-schimba-harta-romaniei-dispar-orase-se-imputineaza-judetele-dar-beneficiile-sunt-importante/ (accessed on 13 August 2024).
  39. Loginova, D.; Mann, S. Is eating meat the new smoking? Exploring the dynamics between meat consumption and education in Switzerland. Int. J. Soc. Econ. 2024; ahead-of-print. [Google Scholar] [CrossRef]
  40. Drewnowski, A. Perspective: The place of pork meat in sustainable healthy diets. Adv. Nutr. 2024, 15, 100213. [Google Scholar] [CrossRef] [PubMed]
  41. Koch, F.; Krems, C.; Heuer, T.; Claupein, E. Attitudes, perceptions and behaviours regarding meat consumption in Germany: Results of the NEMONIT study. J. Nutr. Sci. 2021, 10, e39. [Google Scholar] [CrossRef]
  42. Calvia, M. Beef, lamb, pork and poultry meat commodity prices: Historical fluctuations and synchronisation with a focus on recent global crises. Agric. Econ. Czech. 2024, 70, 24–33. [Google Scholar] [CrossRef]
  43. Wolfswinkel, S.; Raghoebar, S.; Dagevos, H.; de Vet, E.; Poelman, M.P. How perceptions of meat consumption norms differ across contexts and meat consumer groups. Appetite 2024, 195, 107227. [Google Scholar] [CrossRef] [PubMed]
  44. Liu, J.; Chriki, S.; Kombolo, M.; Santinello, M.; Bertelli, P.S.; Hocquette, É.; Ellies-Oury, M.P.; Hocquette, J.F. Consumer perception of the challenges facing livestock production and meat consumption. Meat Sci. 2023, 200, 109144. [Google Scholar] [CrossRef] [PubMed]
  45. Chereji, A.I.; Chiurciu, I.A.; Popa, A.; Chereji, I.; Iorga, A.M. Consumer Behaviour Regarding Food Waste in Romania, Rural versus Urban. Agronomy 2023, 13, 571. [Google Scholar] [CrossRef]
  46. Colombani, P.C.; Brunner, T.A. Feasibility of meat loss and waste estimates based on meat consumption and availability. Sustainability 2024, 16, 458. [Google Scholar] [CrossRef]
  47. Statista. Meat Industry in Europe—Statistics & Facts. Available online: https://www.statista.com/topics/4197/meatindustry-in-europe/#topicOverview (accessed on 7 August 2024).
  48. Pilorgé, E.; Kezeya, B.; Stauss, W.; Muel, F.; Mergenthaler, M. Pea and rapeseed acreage and land use for plant-based meat alternatives in the EU. OCL 2021, 28, 54. [Google Scholar] [CrossRef]
  49. Profeta, A.; Baune, M.C.; Smetana, S.; Broucke, K.; Van Royen, G.; Weiss, J.; Hieke, S.; Heinz, V.; Terjung, N. Consumer preferences for meat blended with plant proteins—Empirical findings from Belgium. Future Foods 2021, 4, 100088. [Google Scholar] [CrossRef]
  50. Jahir, N.R.; Ramakrishna, S.; Abdullah, A.A.A.; Vigneswari, S. Cultured meat in cellular agriculture: Advantages, applications and challenges. Food Biosci. 2023, 53, 102614. [Google Scholar] [CrossRef]
  51. Rasmussen, M.K.; Gold, J.; Kaiser, M.W.; Moritz, J.; Räty, N.; Rønning, S.B.; Ryynänen, T.; Skrivergaard, S.; Ström, A.; Therkildsen, M.; et al. Critical review of cultivated meat from a Nordic perspective. Trends Food Sci. Technol. 2024, 144, 104336. [Google Scholar] [CrossRef]
  52. Liu, W.; Hao, Z.; Florkowski, W.J.; Wu, L.; Yang, Z. Assuring food security: Consumers’ ethical risk perception of meat substitutes. Agriculture 2022, 12, 671. [Google Scholar] [CrossRef]
  53. Cismaru, M.; Edu, T. “Eat less Meat”: Beneficial for you and for the environment—Integrating theory and practice to shape communications encouraging a decrease in meat consumption. Int. Rev. Public Nonprofit Mark. 2024, 21, 915–940. [Google Scholar] [CrossRef]
  54. Laffan, K. Context counts: An exploration of the situational correlates of meat consumption in three Western European countries. Behav. Public Policy 2024, 8, 1–16. [Google Scholar] [CrossRef]
  55. Statista. Per Capita Consumption of Meat Worldwide from 2021 to 2023, with a Forecast for 2032, by Region. Available online: https://www.statista.com/statistics/1037429/per-capitaconsumption-of-meat-worldwide-by-region/ (accessed on 7 September 2023).
  56. Marcuta, A.; Popescu, A.; Tindeche, C.; Gurban, G.; Beia, S.I.; Marcuta, L. Researchers regarding the situation of the pig herds in Romania, the production obtained and the consumption of pork meat in the period 2016–2021. Sci. Pap. Ser. Manag. Econ. Eng. Agric. Rural Dev. 2023, 23, 513–520. [Google Scholar]
  57. Monroe-Lord, L.; Harrison, E.; Ardakani, A.; Duan, X.; Spechler, L.; Jeffery, T.D.; Jackson, P. Changes in Food Consumption Trends among American Adults since the COVID-19 Pandemic. Nutrients 2023, 15, 1769. [Google Scholar] [CrossRef]
  58. Li, X.; You, B.; Shum, H.C.; Chen, C.H. Future foods: Design, fabrication and production through microfluidics. Biomaterials 2022, 287, 121631. [Google Scholar] [CrossRef] [PubMed]
  59. Lohmann, P.M.; Gsottbauer, E.; Doherty, A.; Kontoleon, A. Do carbon footprint labels promote climatarian diets? Evidence from a large-scale field experiment. J. Environ. Econ. Manag. 2022, 114, 102693. [Google Scholar] [CrossRef]
  60. Jahn, S.; Furchheim, P.; Strässner, A.M. Plant-Based Meat Alternatives: Motivational Adoption Barriers and Solutions. Sustainability 2021, 13, 13271. [Google Scholar] [CrossRef]
  61. Bengtsson, J.; Wendin, K. Insects as food—The impact of information on consumer attitudes. Int. J. Gastron. Food Sci. 2023, 32, 100754. [Google Scholar] [CrossRef]
  62. Njora, B.; Yilmaz, H. The future of food systems and food security in context of lessons learned from Covid-19 pandemic as a global challenge: Insights from a qualitative perspective. AgroLife Sci. J. 2023, 12, 143–157. [Google Scholar] [CrossRef]
Figure 1. Inventory of variables, Source: own dimensional analysis of meat consumption concept, selection of variables, figure processing.
Sustainability 16 11193 g001
Figure 2. Main aspects of meat consumption items. Source: own items design and figure processing.
Sustainability 16 11193 g002
Figure 3. Frequencies obtained from the analysis of variables Q18, Q19, Q20, and Q22.
Sustainability 16 11193 g003
Figure 4. Average annual beef consumption per capita, 2007−2022.
Sustainability 16 11193 g004
Figure 5. Average annual consumption of pork per capita, 2007–2022.
Sustainability 16 11193 g005
Figure 6. Average annual consumption of mutton and goat meat per capita, 2007–2022.
Sustainability 16 11193 g006
Figure 7. Average annual poultry consumption per capita, 2007–2022.
Sustainability 16 11193 g007
Figure 8. Distribution of respondents in Romania, by counties (number; percentage), Source: own processing of data & filling in a template from online free source [38].
Sustainability 16 11193 g008
Figure 9. Variables’ indicators for Q18-Q20 and Q22.
Sustainability 16 11193 g009
Table 1. Main statistical indicators on the average annual meat consumption per capita, in the period 2007–2022.
Meat TypeArithmetic Mean (kg)Standard DeviationCoefficient of Variation (%)Minimum Consumption (kg)Maximum Consumption (kg)
Beef5.8941.06518.084.98.3
Pork33.93.39102938.3
Mutton-goat meat2.410.156.402.22.7
Poultry22.854.0517.7017.528
Table 2. Linear mathematical models associated with meat consumption and their validation.
Meat TypeThe Equation of the Regression LineCoefficient of Determination (R²)F CalculatedSignificance F
Beefy = −0.1537x + 7.20.471512.49070.00330
Porky = 0.4437x + 30.1350.38758.85790.01001
Mutton-goat meaty = 0.0044x + 2.3750.01850.26400.61537
Poultryy = 0.7021x + 16.8830.682630.11010.00000
Table 3. Respondents’ characteristics.
CategoryVariablesFrequency%
Age18–20 years 555.5
21–30 years39439.3
31–40 years27327.2
41–50 years19219.2
51–60 years686.8
Over 51 years202.1
GenderFemales65465.3
Males34834.7
ResidenceRural28528.4
Urban71771.6
Respondents’ level of educationHigh school studies39038.9
Higher undergraduate studies31531.4
Higher master’s studies20920.9
Higher doctoral studies545.4
Other studies343.4
Respondents’ income<2500 lei19019.0
2501–3000 lei10410.4
3001–4000 lei18218.2
4001–5000 lei17917.9
>5001 lei34734.6
Table 4. ANOVA Analysis results for Independent Variable Q1 (age).
ANOVASum of SquaresdfMean SquareFSig.
Q18.2 * Q1Between Groups3.40850.6822.4940.030
ŋ2 = 0.012Within Groups272.2509960.273
Total275.6581001
Q18.4 * Q1Between Groups3.30550.6612.3300.041
ŋ2 = 0.012Within Groups282.5959960.284
Total285.9001001
Q19.2 * Q1Between Groups20.89854.1803.0230.010
ŋ2 = 0.015Within Groups1376.8479961.382
Total1397.7451001
Q19.3 * Q1Between Groups21.85654.3713.3040.006
ŋ2 = 0.016Within Groups1317.6229961.323
Total1339.4781001
Q19.7 * Q1Between Groups20.14654.0292.6900.020
ŋ2 = 0.013Within Groups1492.1259961.498
Total1512.2711001
Q20 * Q1Between Groups24.28054.8562.6670.021
ŋ2 = 0.013Within Groups1813.4419961.821
Total1837.7221001
Q22 * Q1Between Groups5.73251.1465.5610.000
ŋ2 = 0.027Within Groups205.3279960.206
Total211.0591001
Legend: “*” shows the pair of variables.
Table 5. ANOVA Analysis results for Independent Variable Q2 (gender).
ANOVASum of SquaresdfMean SquareFSig.
Q18.1 * Q2Between Groups0.40010.4003.9380.047
Within Groups101.59710000.102
ŋ2 = 0.004Total101.9971001
Q18.2 * Q2Between Groups1.13311.1334.1270.042
Within Groups274.52510000.275
ŋ2 = 0.004Total275.6581001
Q18.4 * Q2Between Groups3.09813.09810.9550.001
ŋ2 = 0.011Within Groups282.80210000.283
Total285.9001001
Q18.6 * Q2Between Groups1.40811.40813.5600.000
Within Groups103.79810000.104
ŋ2 = 0.013Total105.2061001
Q20 * Q2Between Groups7.39217.3924.0390.045
Within Groups1830.32910001.830
ŋ2 = 0.004Total1837.7221001
Legend: “*” shows the pair of variables.
Table 6. ANOVA Analysis results for Independent Variable Q3 (residence).
ANOVASum of SquaresdfMean SquareFSig.
Q18.2 * Q3Between Groups1.39311.3935.0780.024
Within Groups274.26510000.274
ŋ2 = 0.005Total275.6581001
Q19.6 * Q3Between Groups5.81615.8164.8400.028
Within Groups1201.77010001.202
ŋ2 = 0.005Total1207.5861001
Q22 * Q3Between Groups0.86810.8684.1320.042
Within Groups210.19010000.210
ŋ2 = 0.004Total211.0591001
Legend: “*” shows the pair of variables.
Table 7. ANOVA Analysis results for Independent Variable Q5 (education level).
ANOVASum of SquaresdfMean SquareFSig.
Q18.5 * Q5Between Groups2.87940.7202.3870.049
Within Groups300.5909970.301
ŋ2 = 0.009Total303.4691001
Q18.7 * Q5Between Groups7.52141.8803.2120.012
Within Groups583.6259970.585
ŋ2 = 0.013Total591.1461001
Q19.2 * Q5Between Groups14.58143.6452.6280.033
Within Groups1383.1639971.387
ŋ2 = 0.010Total1397.7451001
Q20 * Q5Between Groups25.48346.3713.5050.008
Within Groups1812.2399971.818
ŋ2 = 0.014Total1837.7221001
Q22 * Q5Between Groups2.00240.5012.3870.050
Within Groups209.0579970.210
ŋ2 = 0.009Total211.0591001
Legend: “*” shows the pair of variables.
Table 8. ANOVA Analysis results for Independent Variable Q6 (Respondents’ income).
ANOVA Sum of SquaresdfMean SquareFSig.
Q18.3 * Q6Between Groups6.92941.7323.3450.010
Within Groups516.3499970.518
ŋ2 = 0.013Total523.2771001
Q18.7 * Q6Between Groups13.34243.3355.7550.000
Within Groups577.8049970.580
ŋ2 = 0.023Total591.1461001
Q19.1 * Q6Between Groups12.96243.2402.6360.033
Within Groups1225.5379971.229
ŋ2 = 0.010Total1238.4991001
Q20 * Q6Between Groups19.03244.7582.6080.034
Within Groups1818.6899971.824
ŋ2 = 0.010Total1837.7221001
Q22 * Q6Between Groups2.58840.6473.0940.015
Within Groups208.4719970.209
ŋ2 = 0.012Total211.0591001
Legend: “*” shows the pair of variables.
Disclaimer/Publisher’s Note: The statements, opinions and data contained in all publications are solely those of the individual author(s) and contributor(s) and not of MDPI and/or the editor(s). MDPI and/or the editor(s) disclaim responsibility for any injury to people or property resulting from any ideas, methods, instructions or products referred to in the content.