
Geothermal Condition Investigation and Resource Potential Evaluation of Shallow Geothermal Energy in the Yinchuan Area, Ningxia, China


 , and
, and
Abstract
1. Introduction
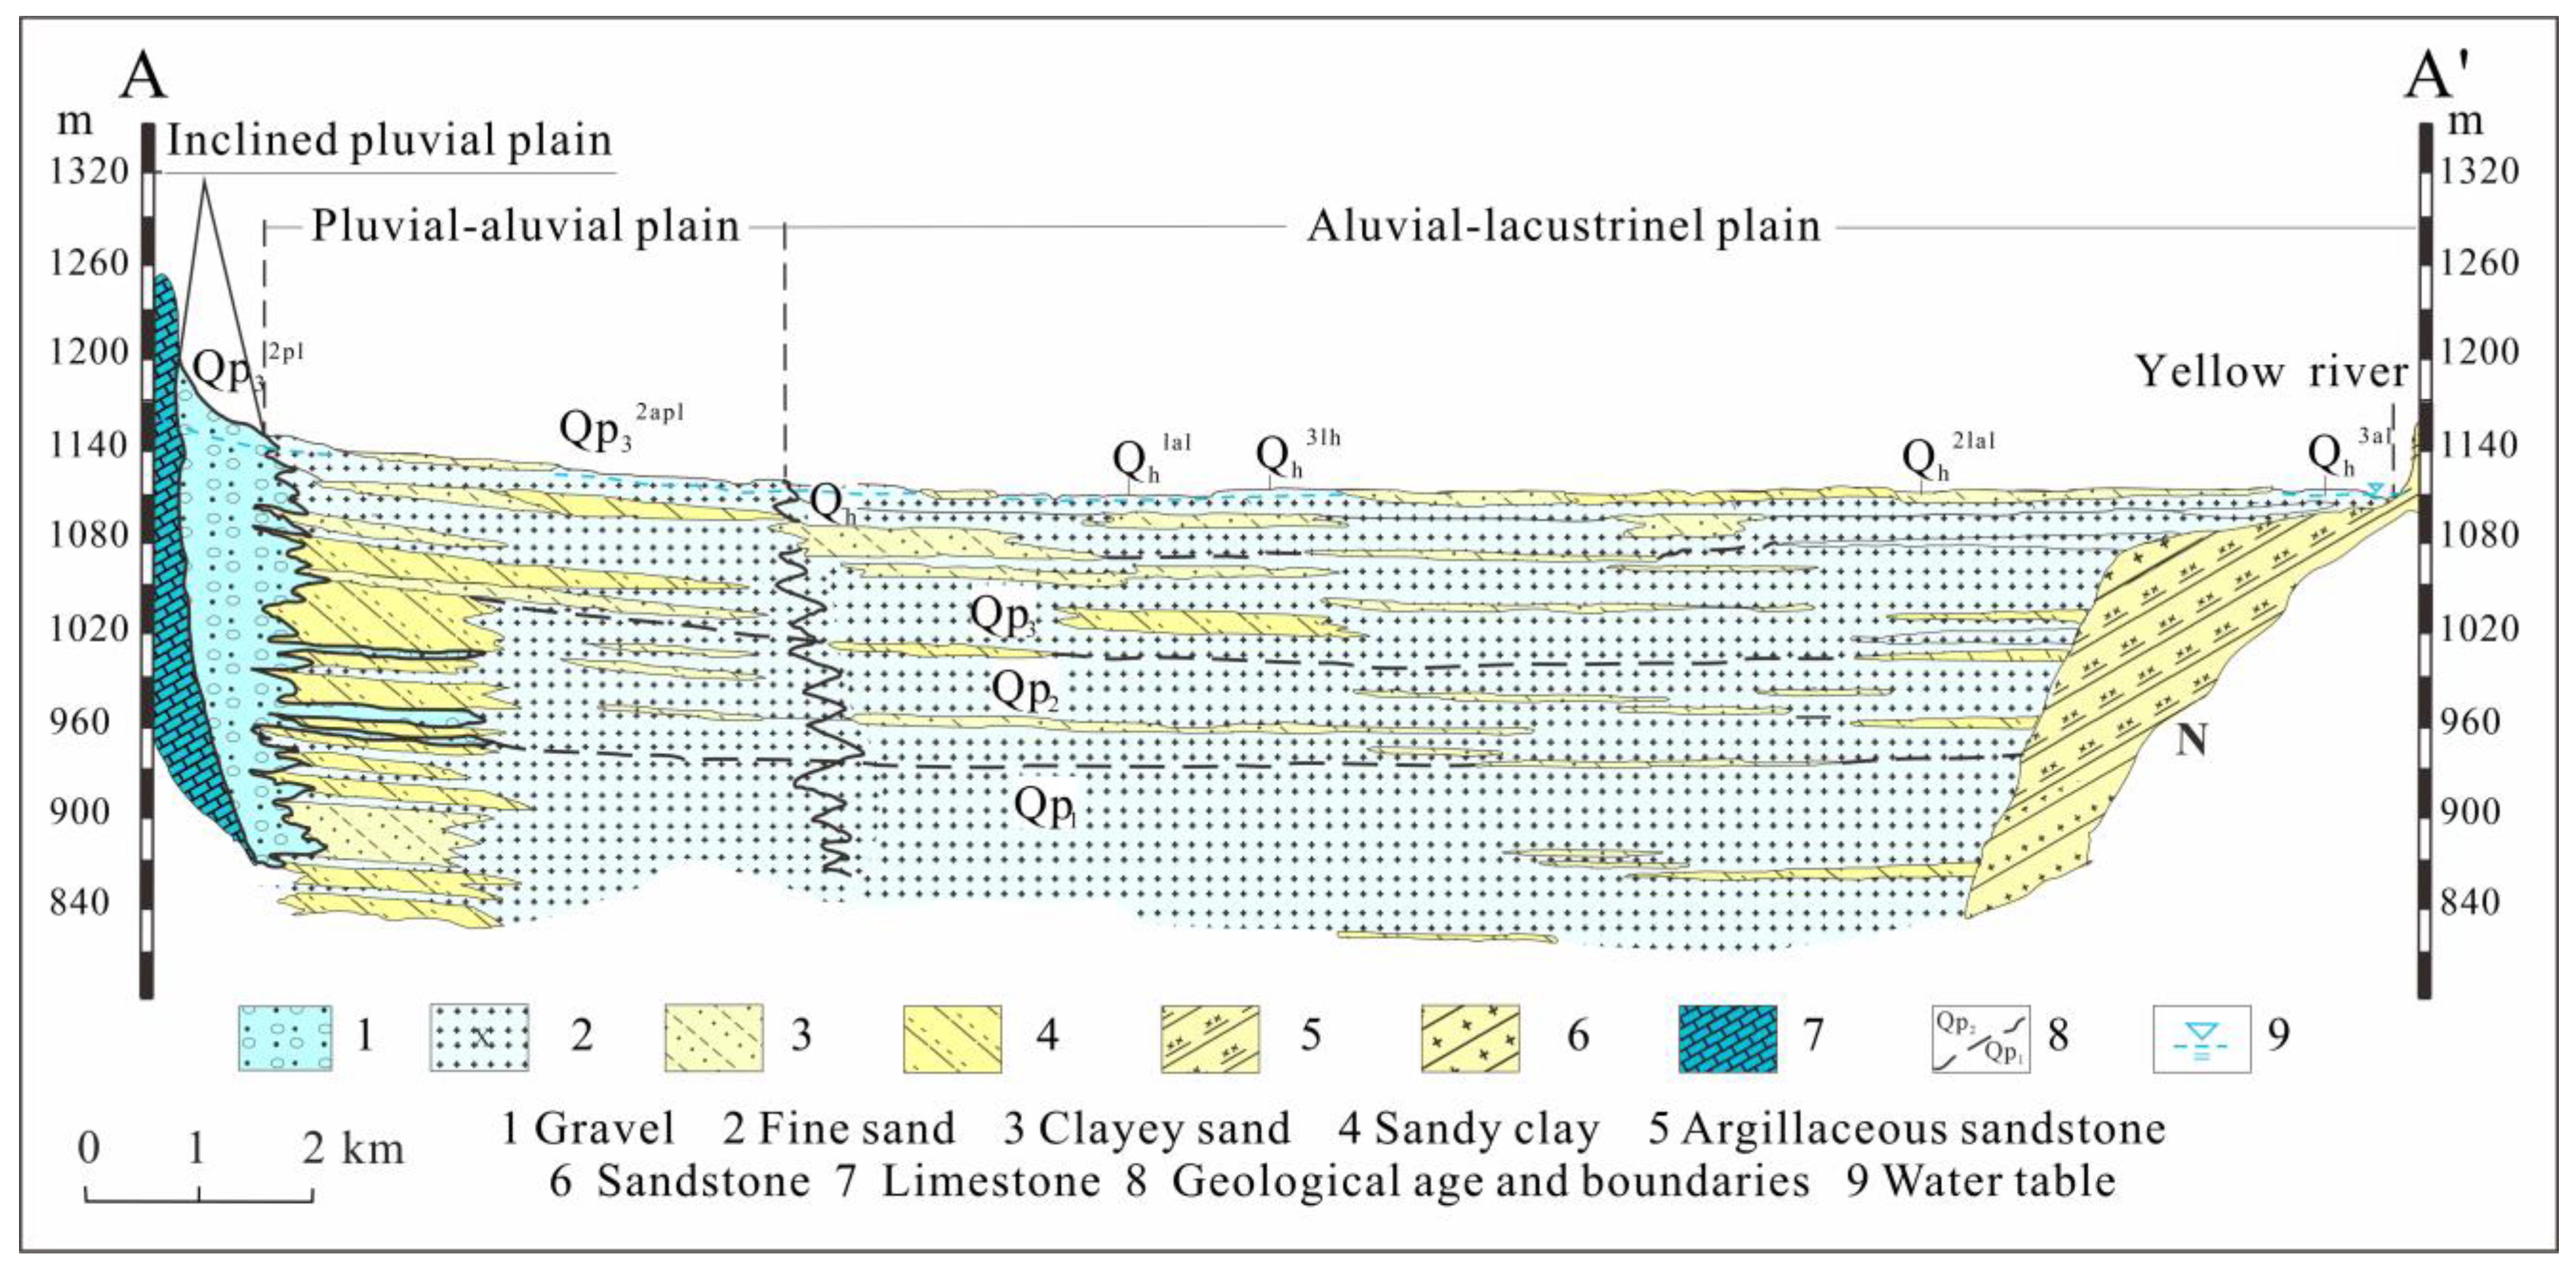
2. Study Area
3. Data and Methods
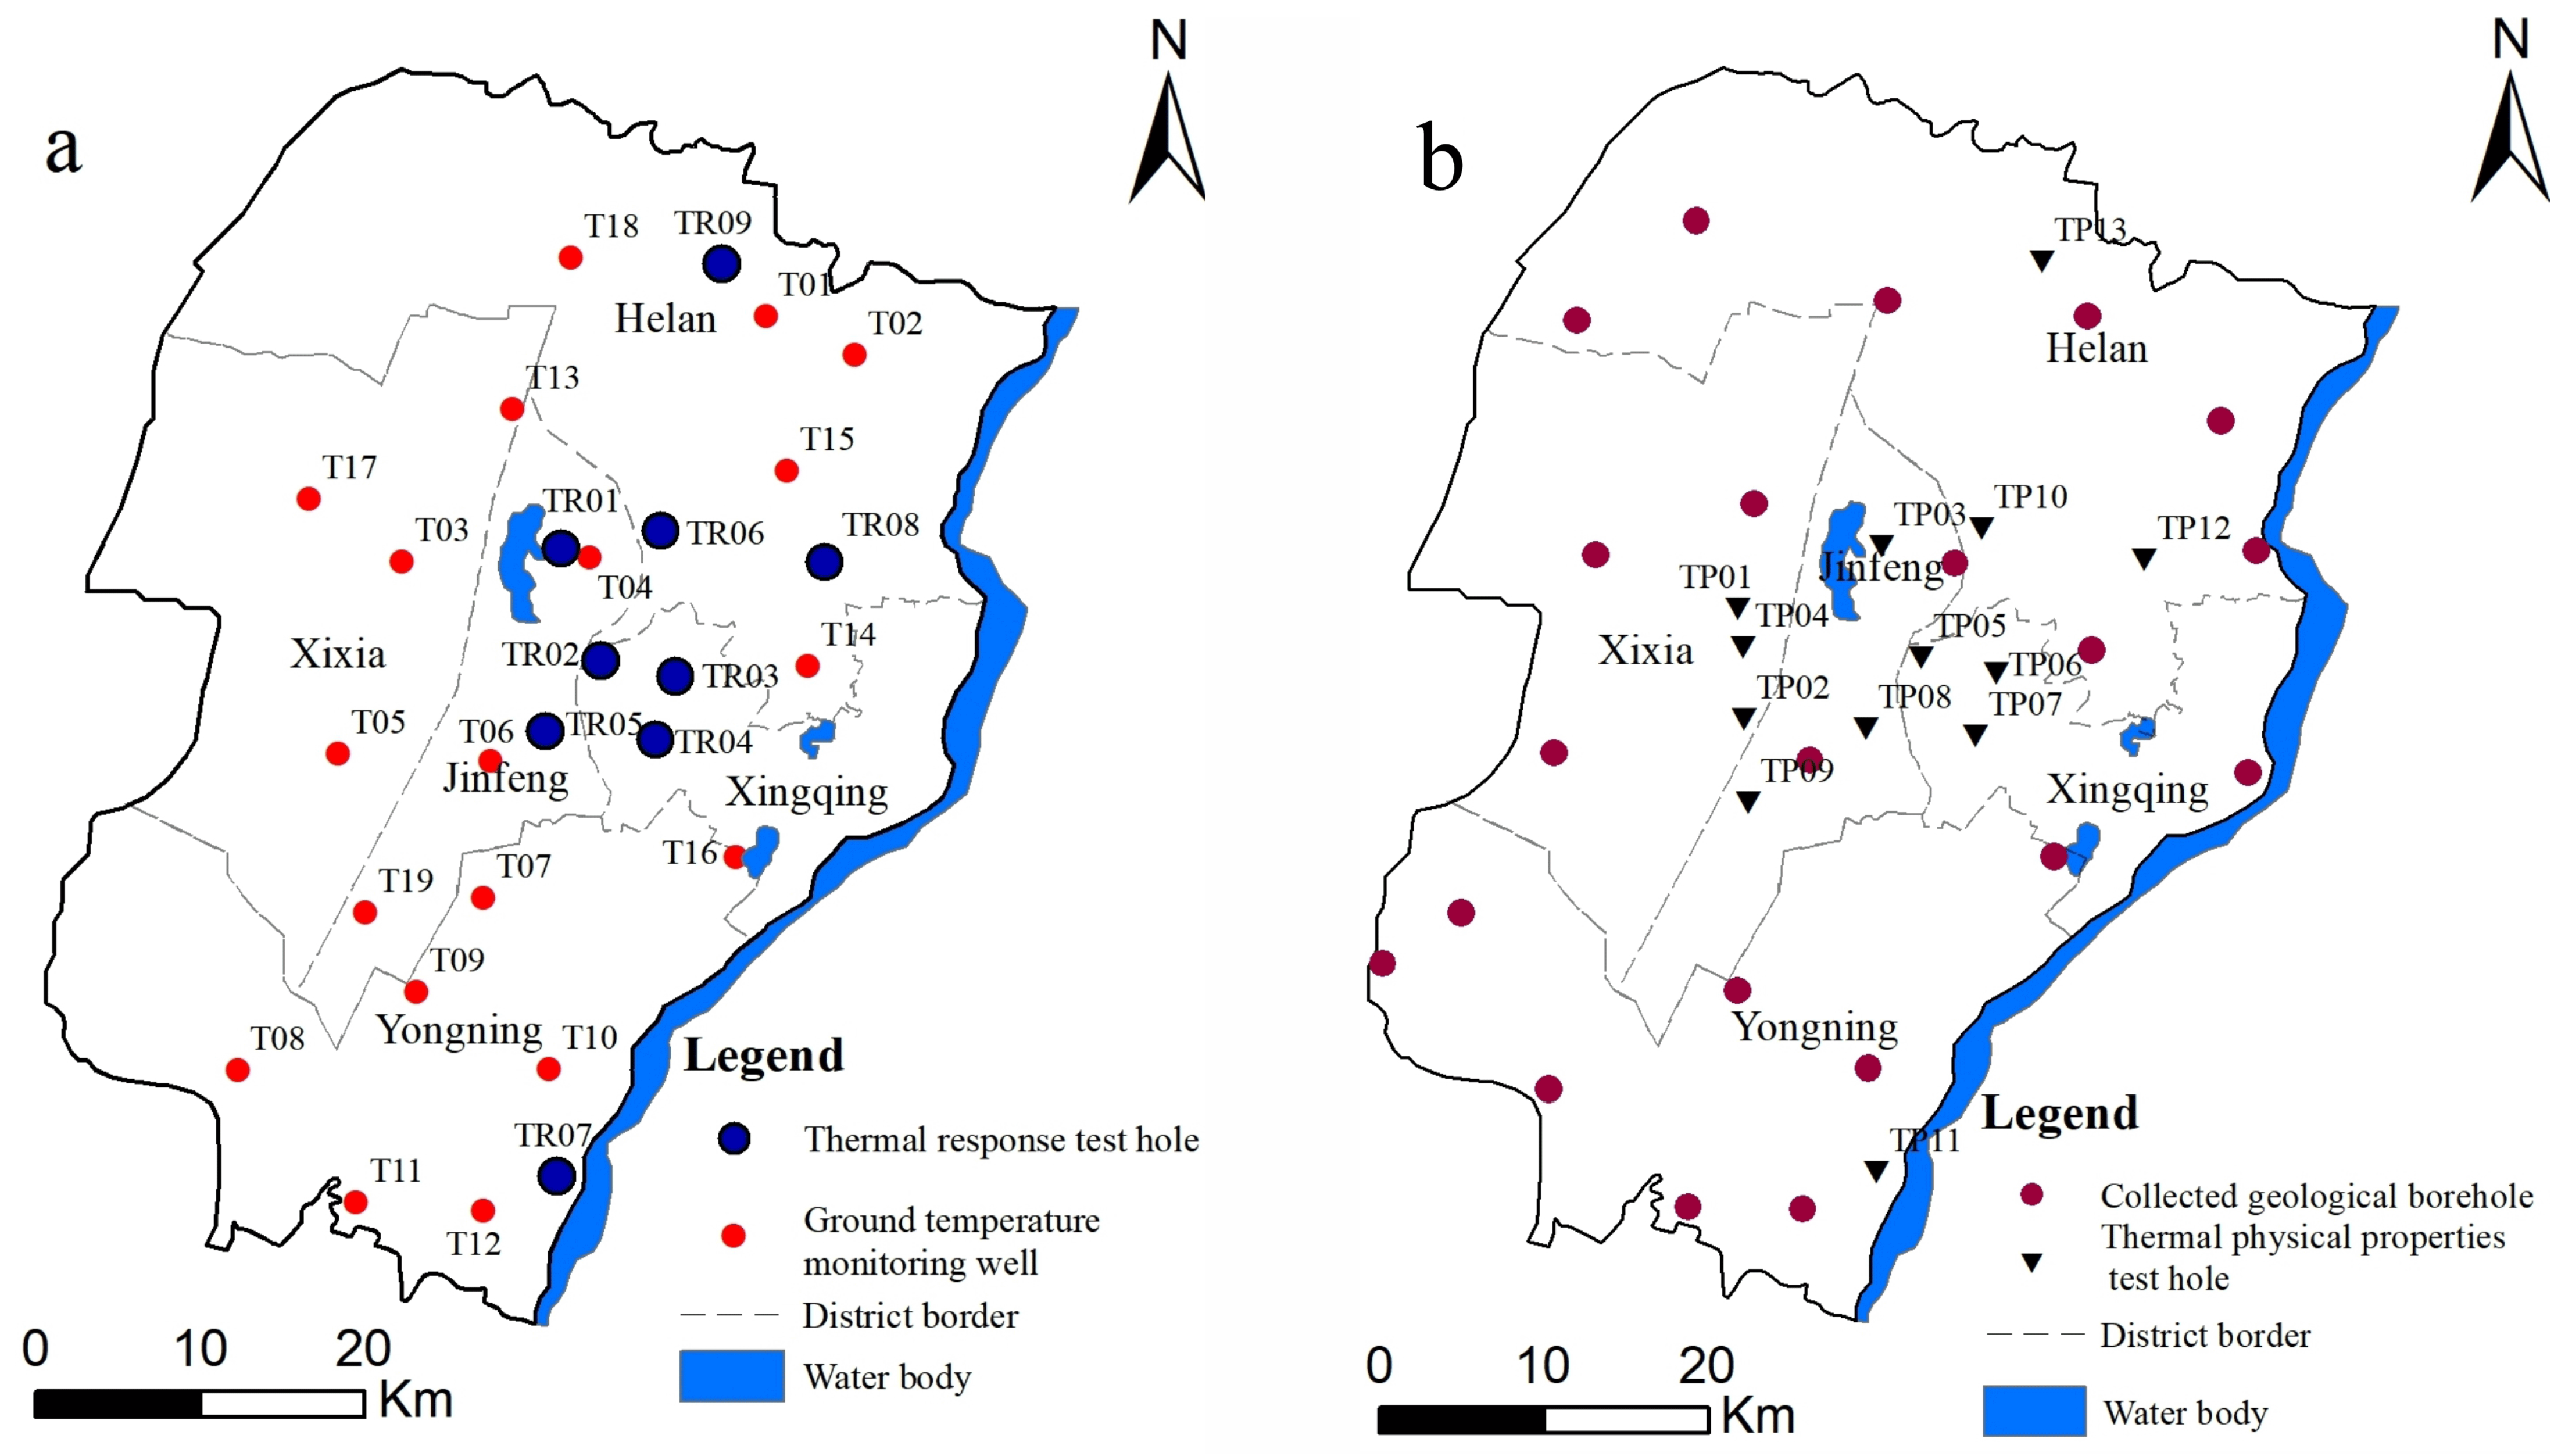
3.1. Data Acquisition
3.2. Method
3.2.1. Thermal Response Test Results Calculating Method
3.2.2. Suitability Zoning Method
- (1)
- Determining the weight of evaluation indicators in the zoning system
- (2)
- Establishing the scoring system
- (3)
- Summing the weights
3.2.3. Resource Potential Evaluation Method
- (1)
- Calculation of heat capacity
- (2)
- Heat exchange power (HEP)
- (3)
- Resource potential of the BHE
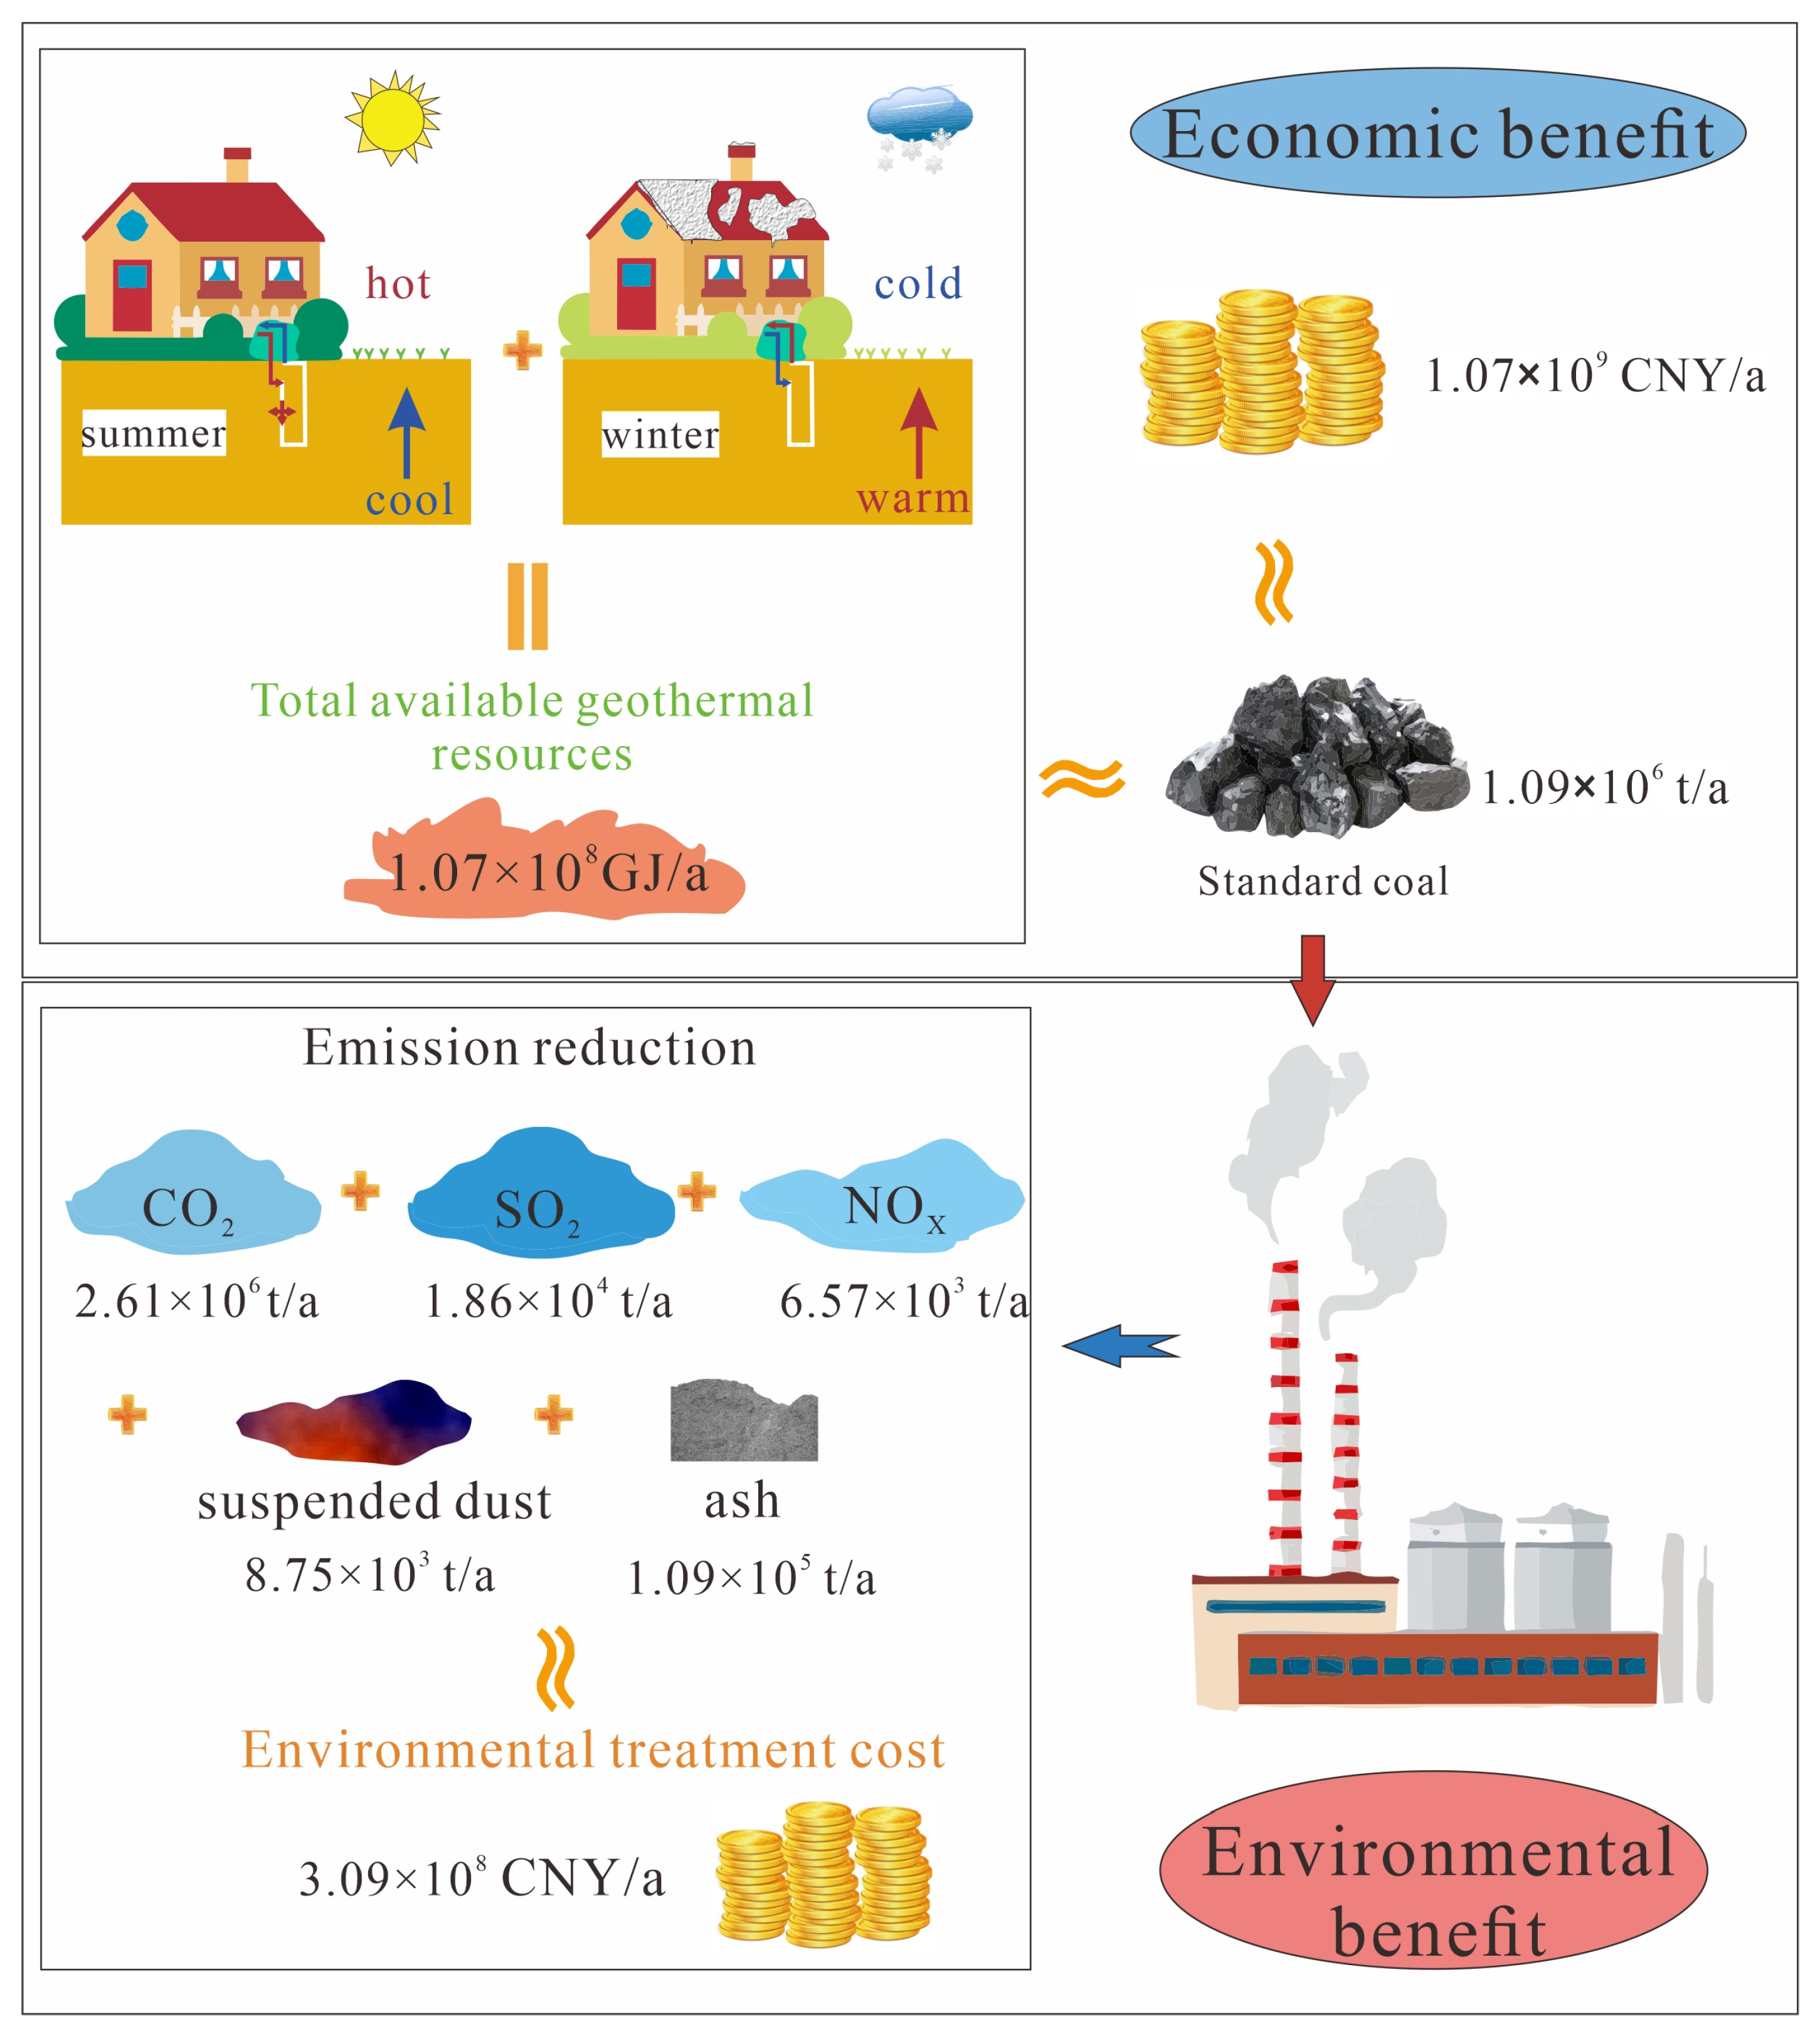
3.2.4. Economic and Environmental Benefits Evaluation
4. Results and Discussion
4.1. Evaluating Indicators
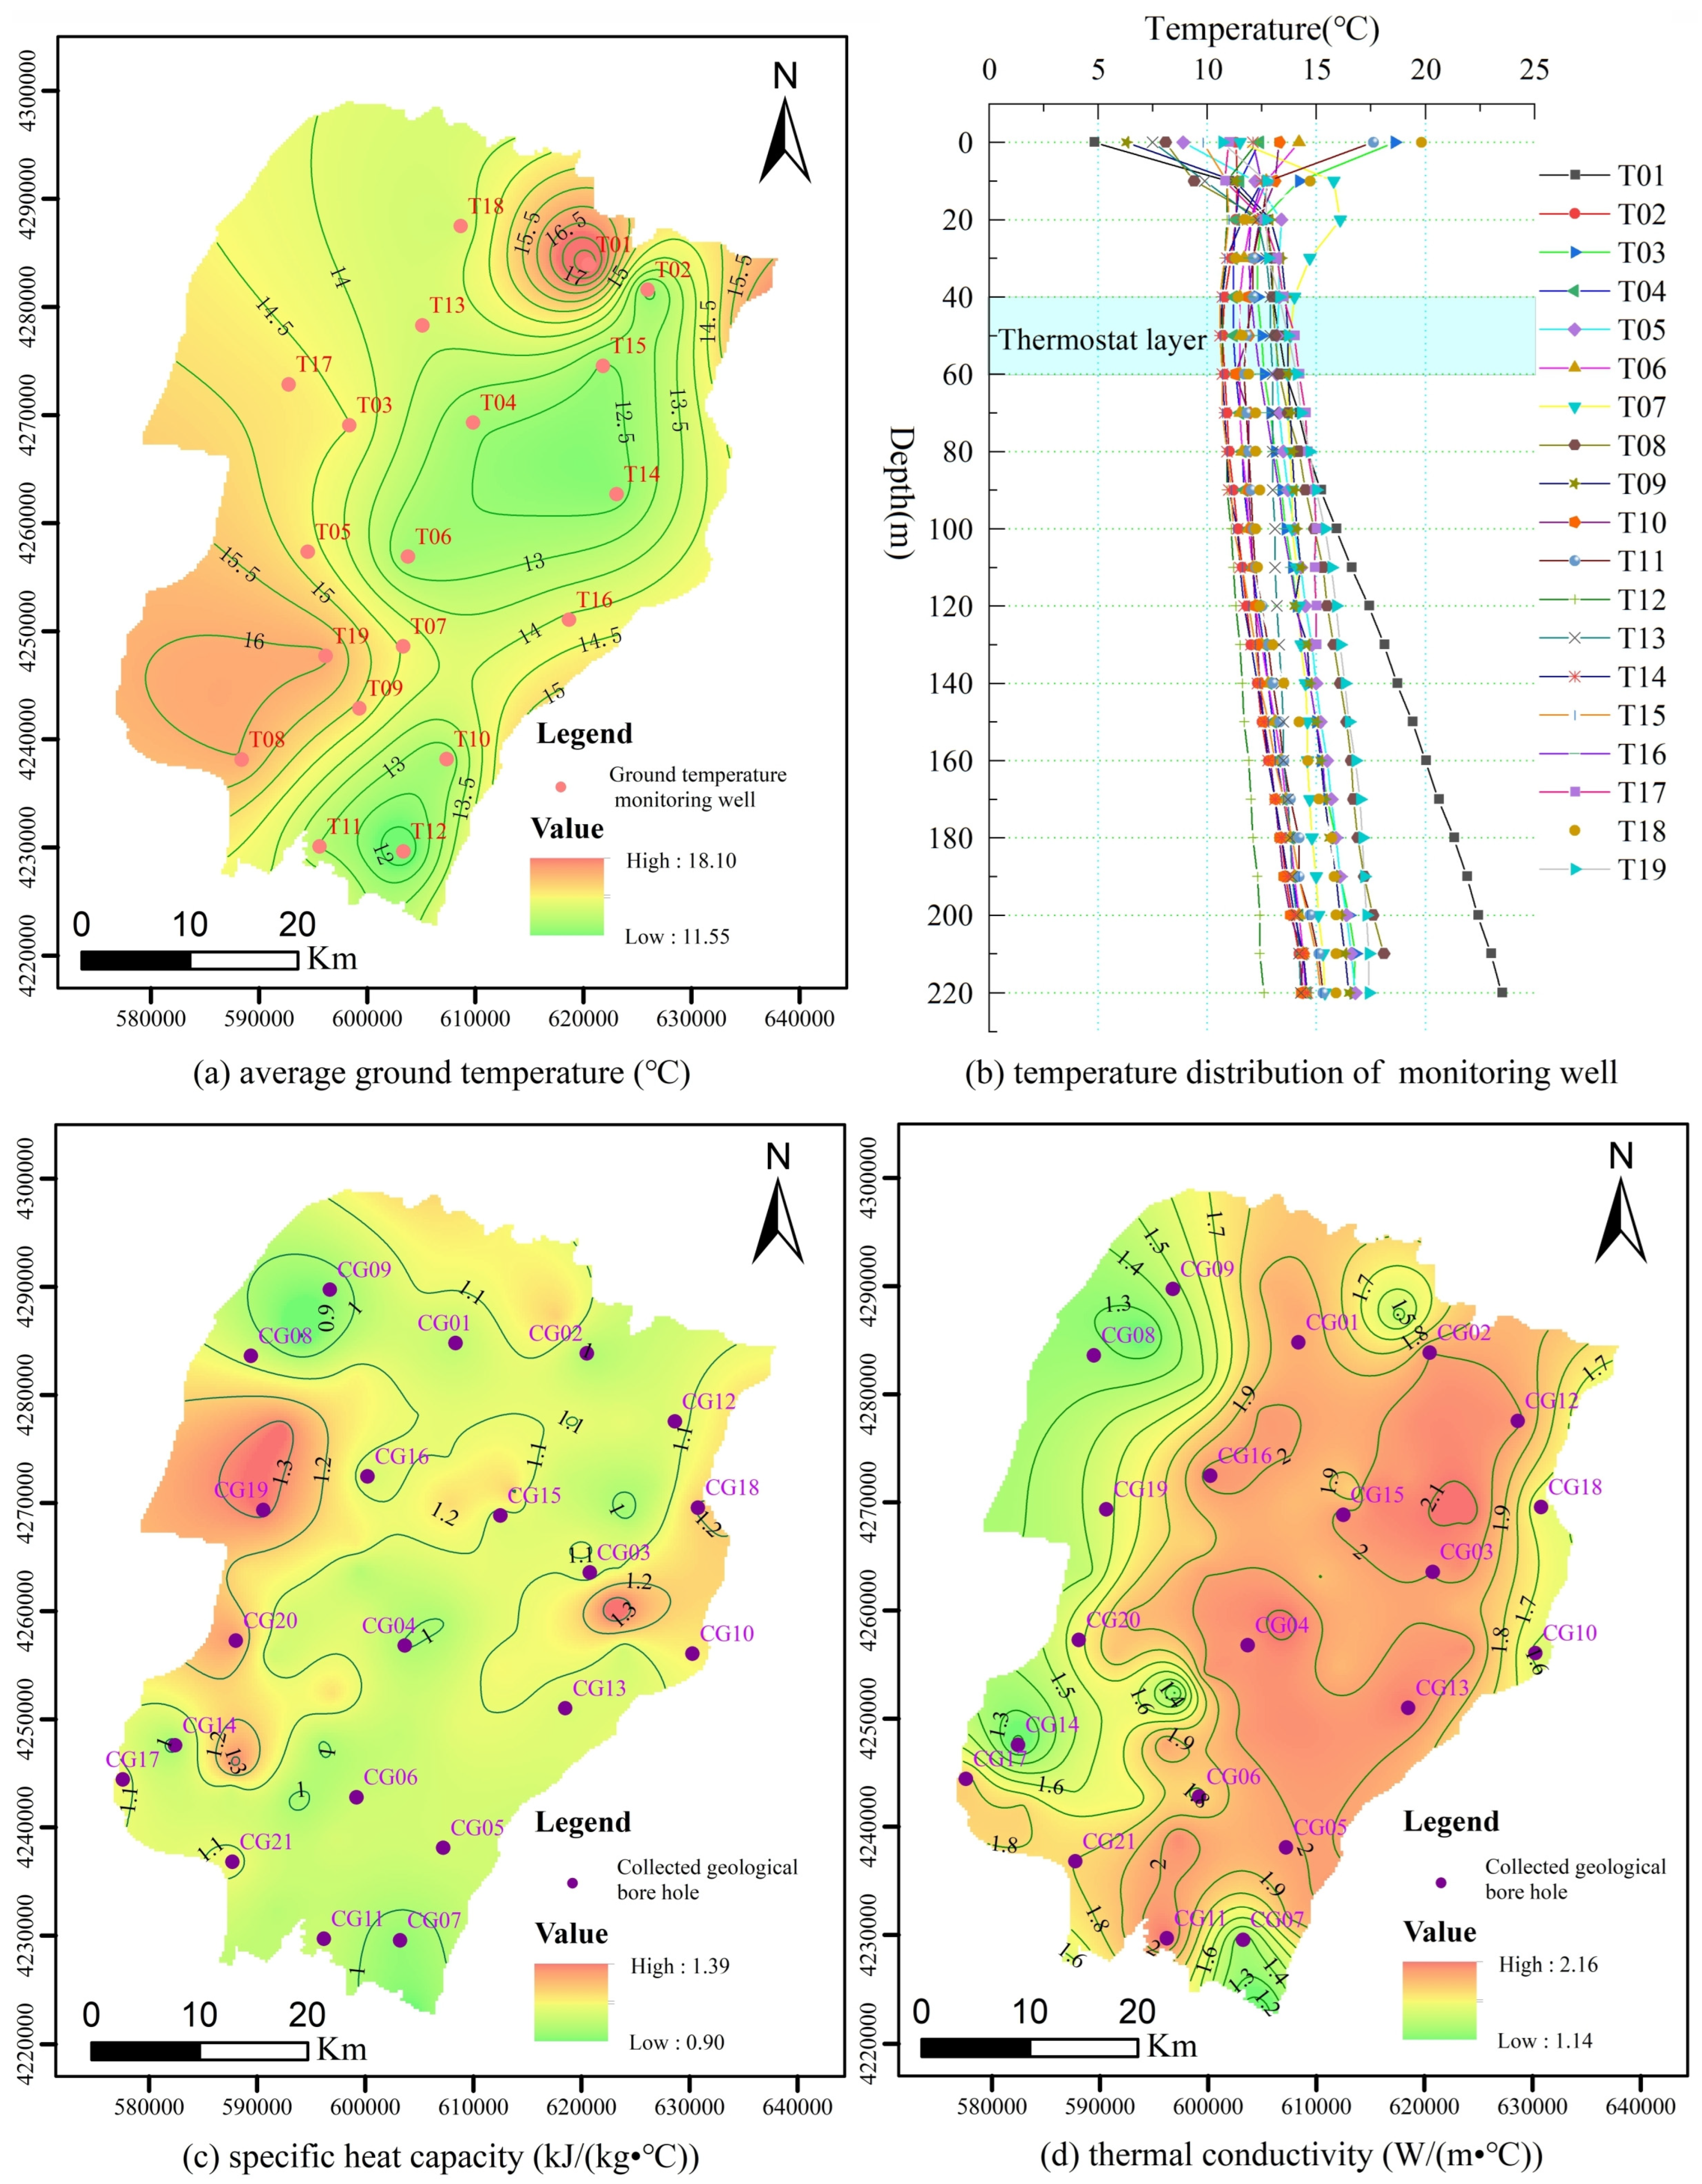
4.1.1. Geothermal Conditions

| Area | City | Deposits | Effective Thermal Conductivity [W/(m °C)] | Source |
|---|---|---|---|---|
| Yangtze River Basin | Shanghai | Quaternary deposits, material types consist of clay, silt, find sand and sand. | 1.51–2.44 | [78] |
| Hangzhou | Quaternary deposits, material types consist majorly of clay, silt, find sand and gravel. | 1.65–2.66 | ||
| Nanchang | Quaternary deposits, material types consist of clay, silt, fine sand and gravel. | 1.14–3.70 | ||
| North China Plain | Beijing | Quaternary deposits, material types consist of sand, gravel and clay. | 1.97–2.71 | [79] |
| Tianjin | Quaternary deposits, sand, sandy soil and clay interbed irregularly. | 1.55–1.89 | ||
| Zhengzhou | Quaternary deposits, material types consist of clay, silty clay, silt, coarse, medium and fine sand. | 1.68–2.07 | ||
| Dezhou | Quaternary deposits, material types consist of silt soil, silty clay, clay, silty sand and fine sand. | 1.54–1.89 | [80,86] | |
| Liaocheng | 1.32–2.07 | |||
| Linqing | 1.74–1.94 | |||
| Linqu | 1.53–2.34 | [24] | ||
| Northwest China | Yan’an, Tongchuan | Quaternary deposits, material types consist of majorly silty clay, silty sand. | 0.81–1.34 | [81] |
| Xi’an, Baoji, Xianyang, Weinan | Quaternary deposits, material types consist of different grain size sand, soil. | 1.09–1.83 | [82] | |
| Yinchuan area | Quaternary deposits, material types consist of silty sand, fine sand, sandy clay and clay. | 1.94–2.83 | this study |
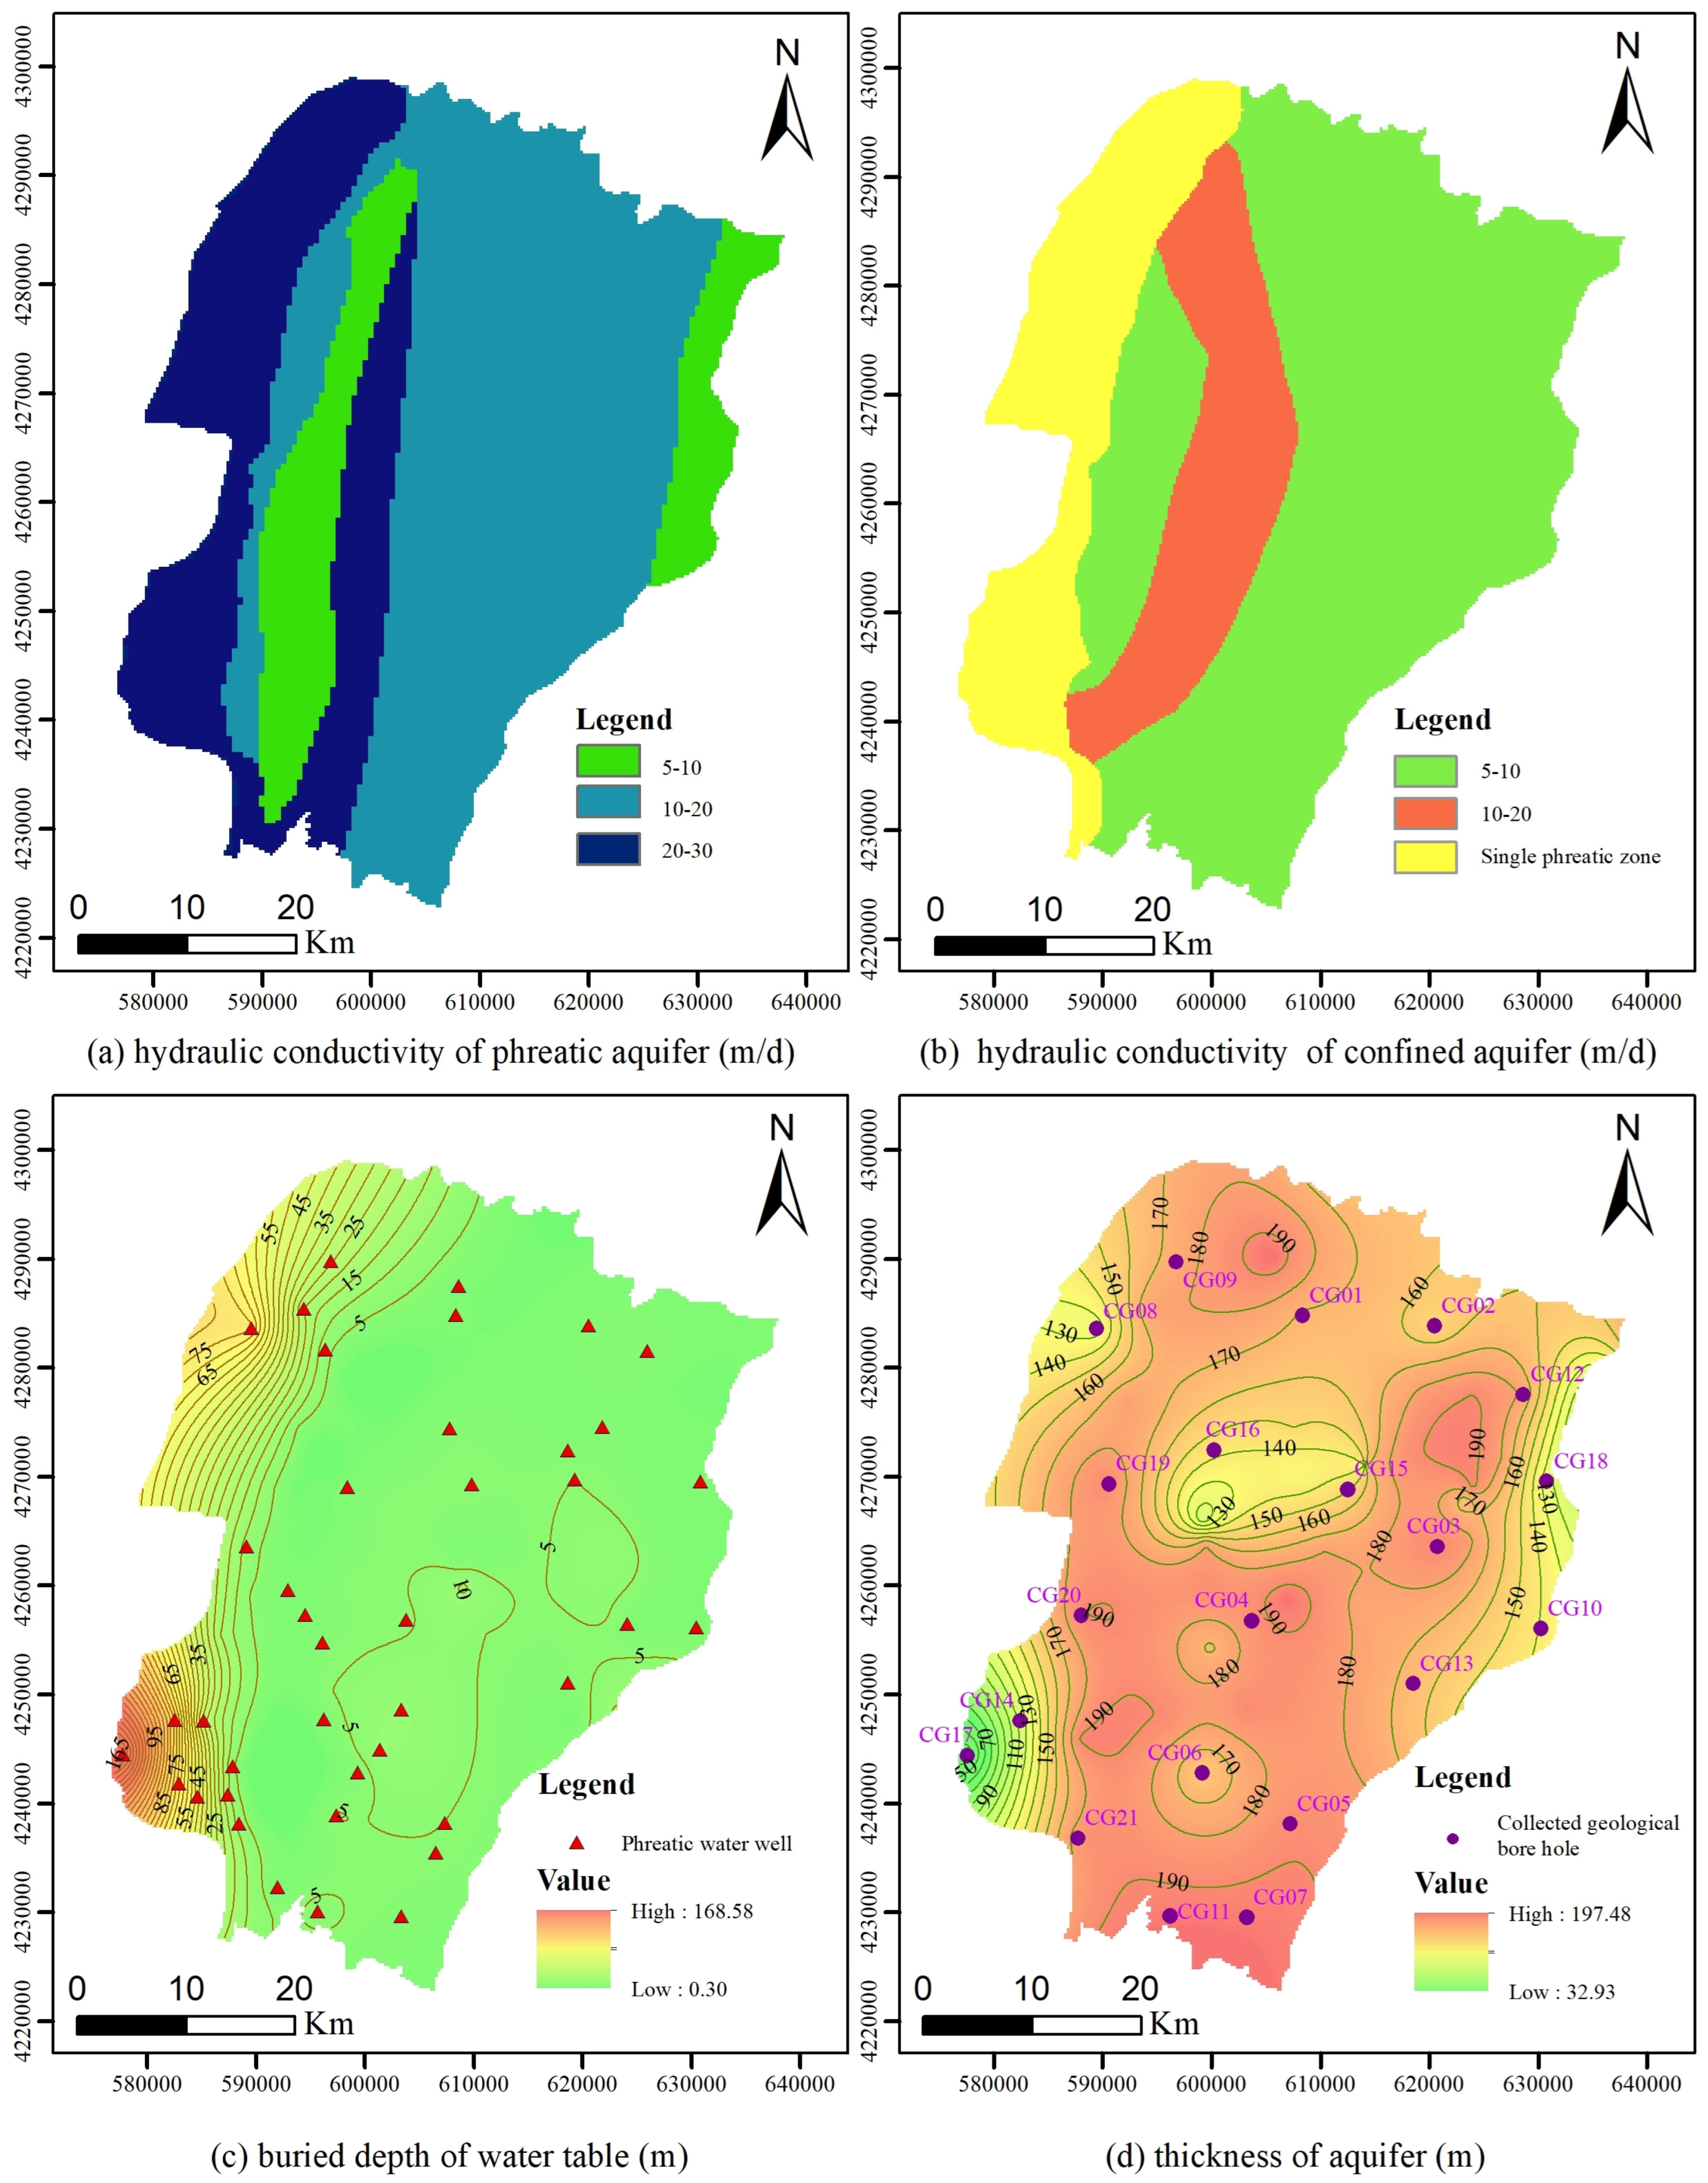
4.1.2. Hydrogeological Conditions
4.1.3. Geological Environment Conditions
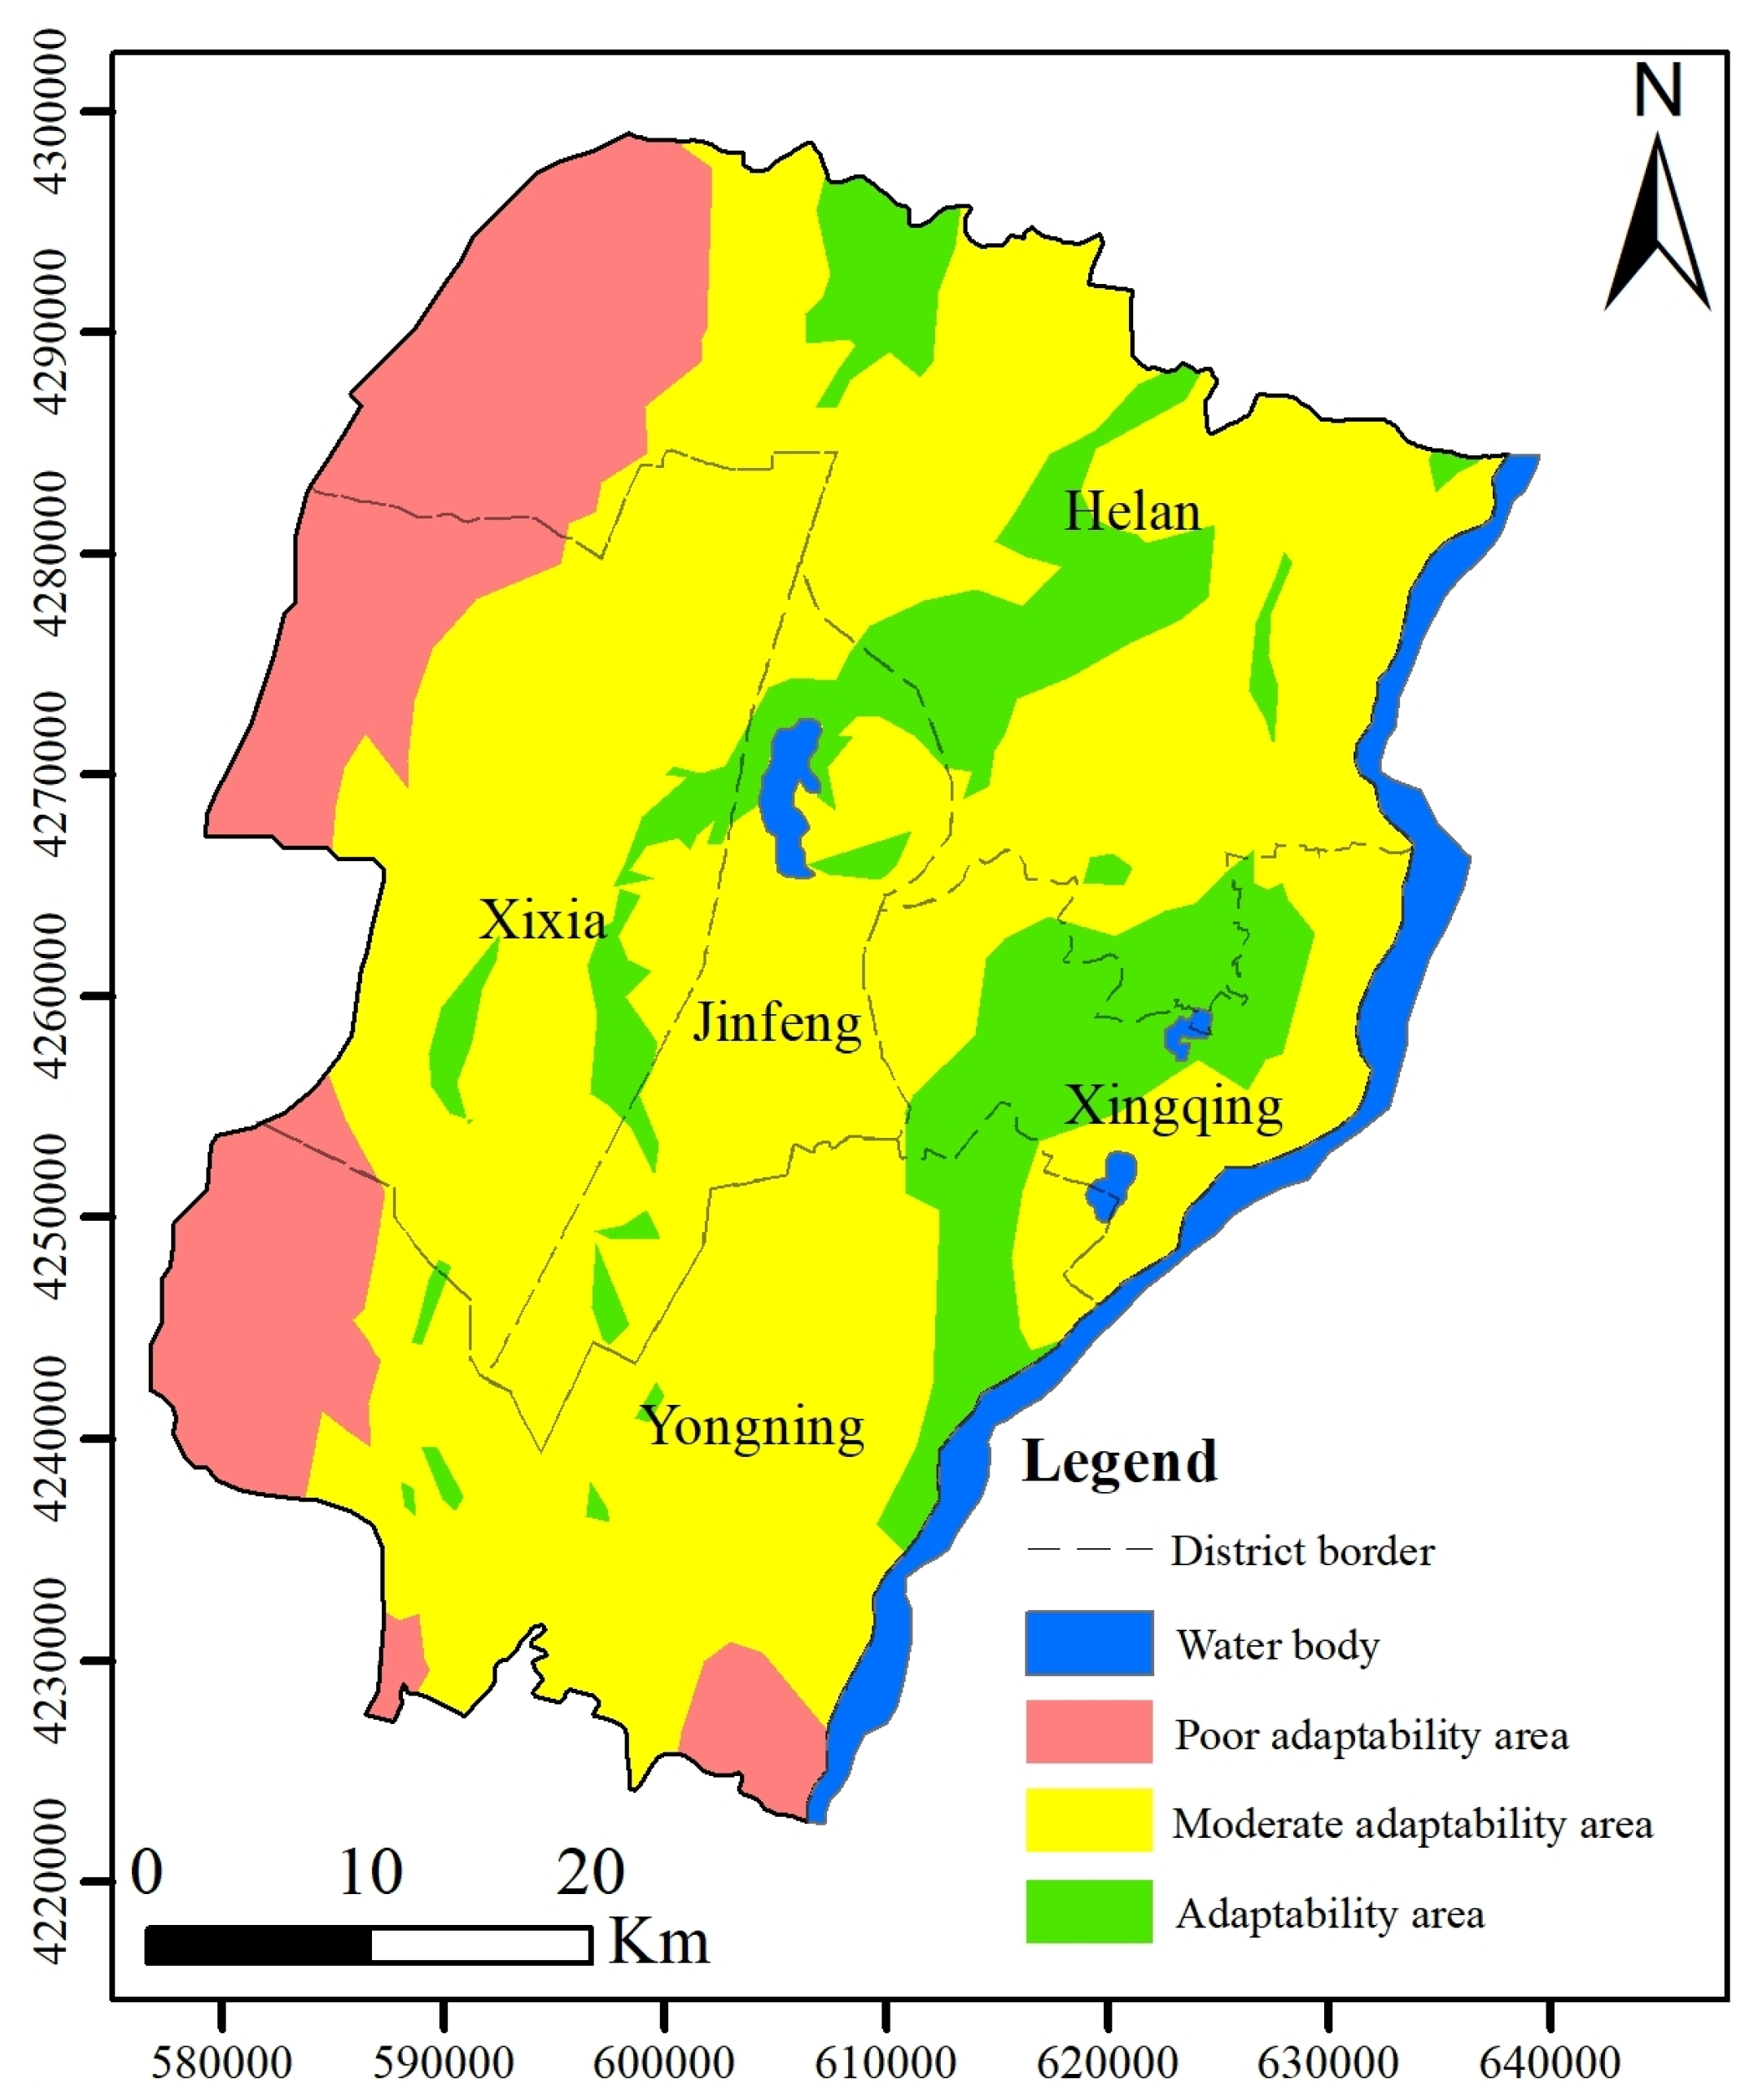
4.2. Suitability Zoning of the BHE
4.3. Evaluation of the Resource Potential of the BHE
4.3.1. Heat Capacity (HC)
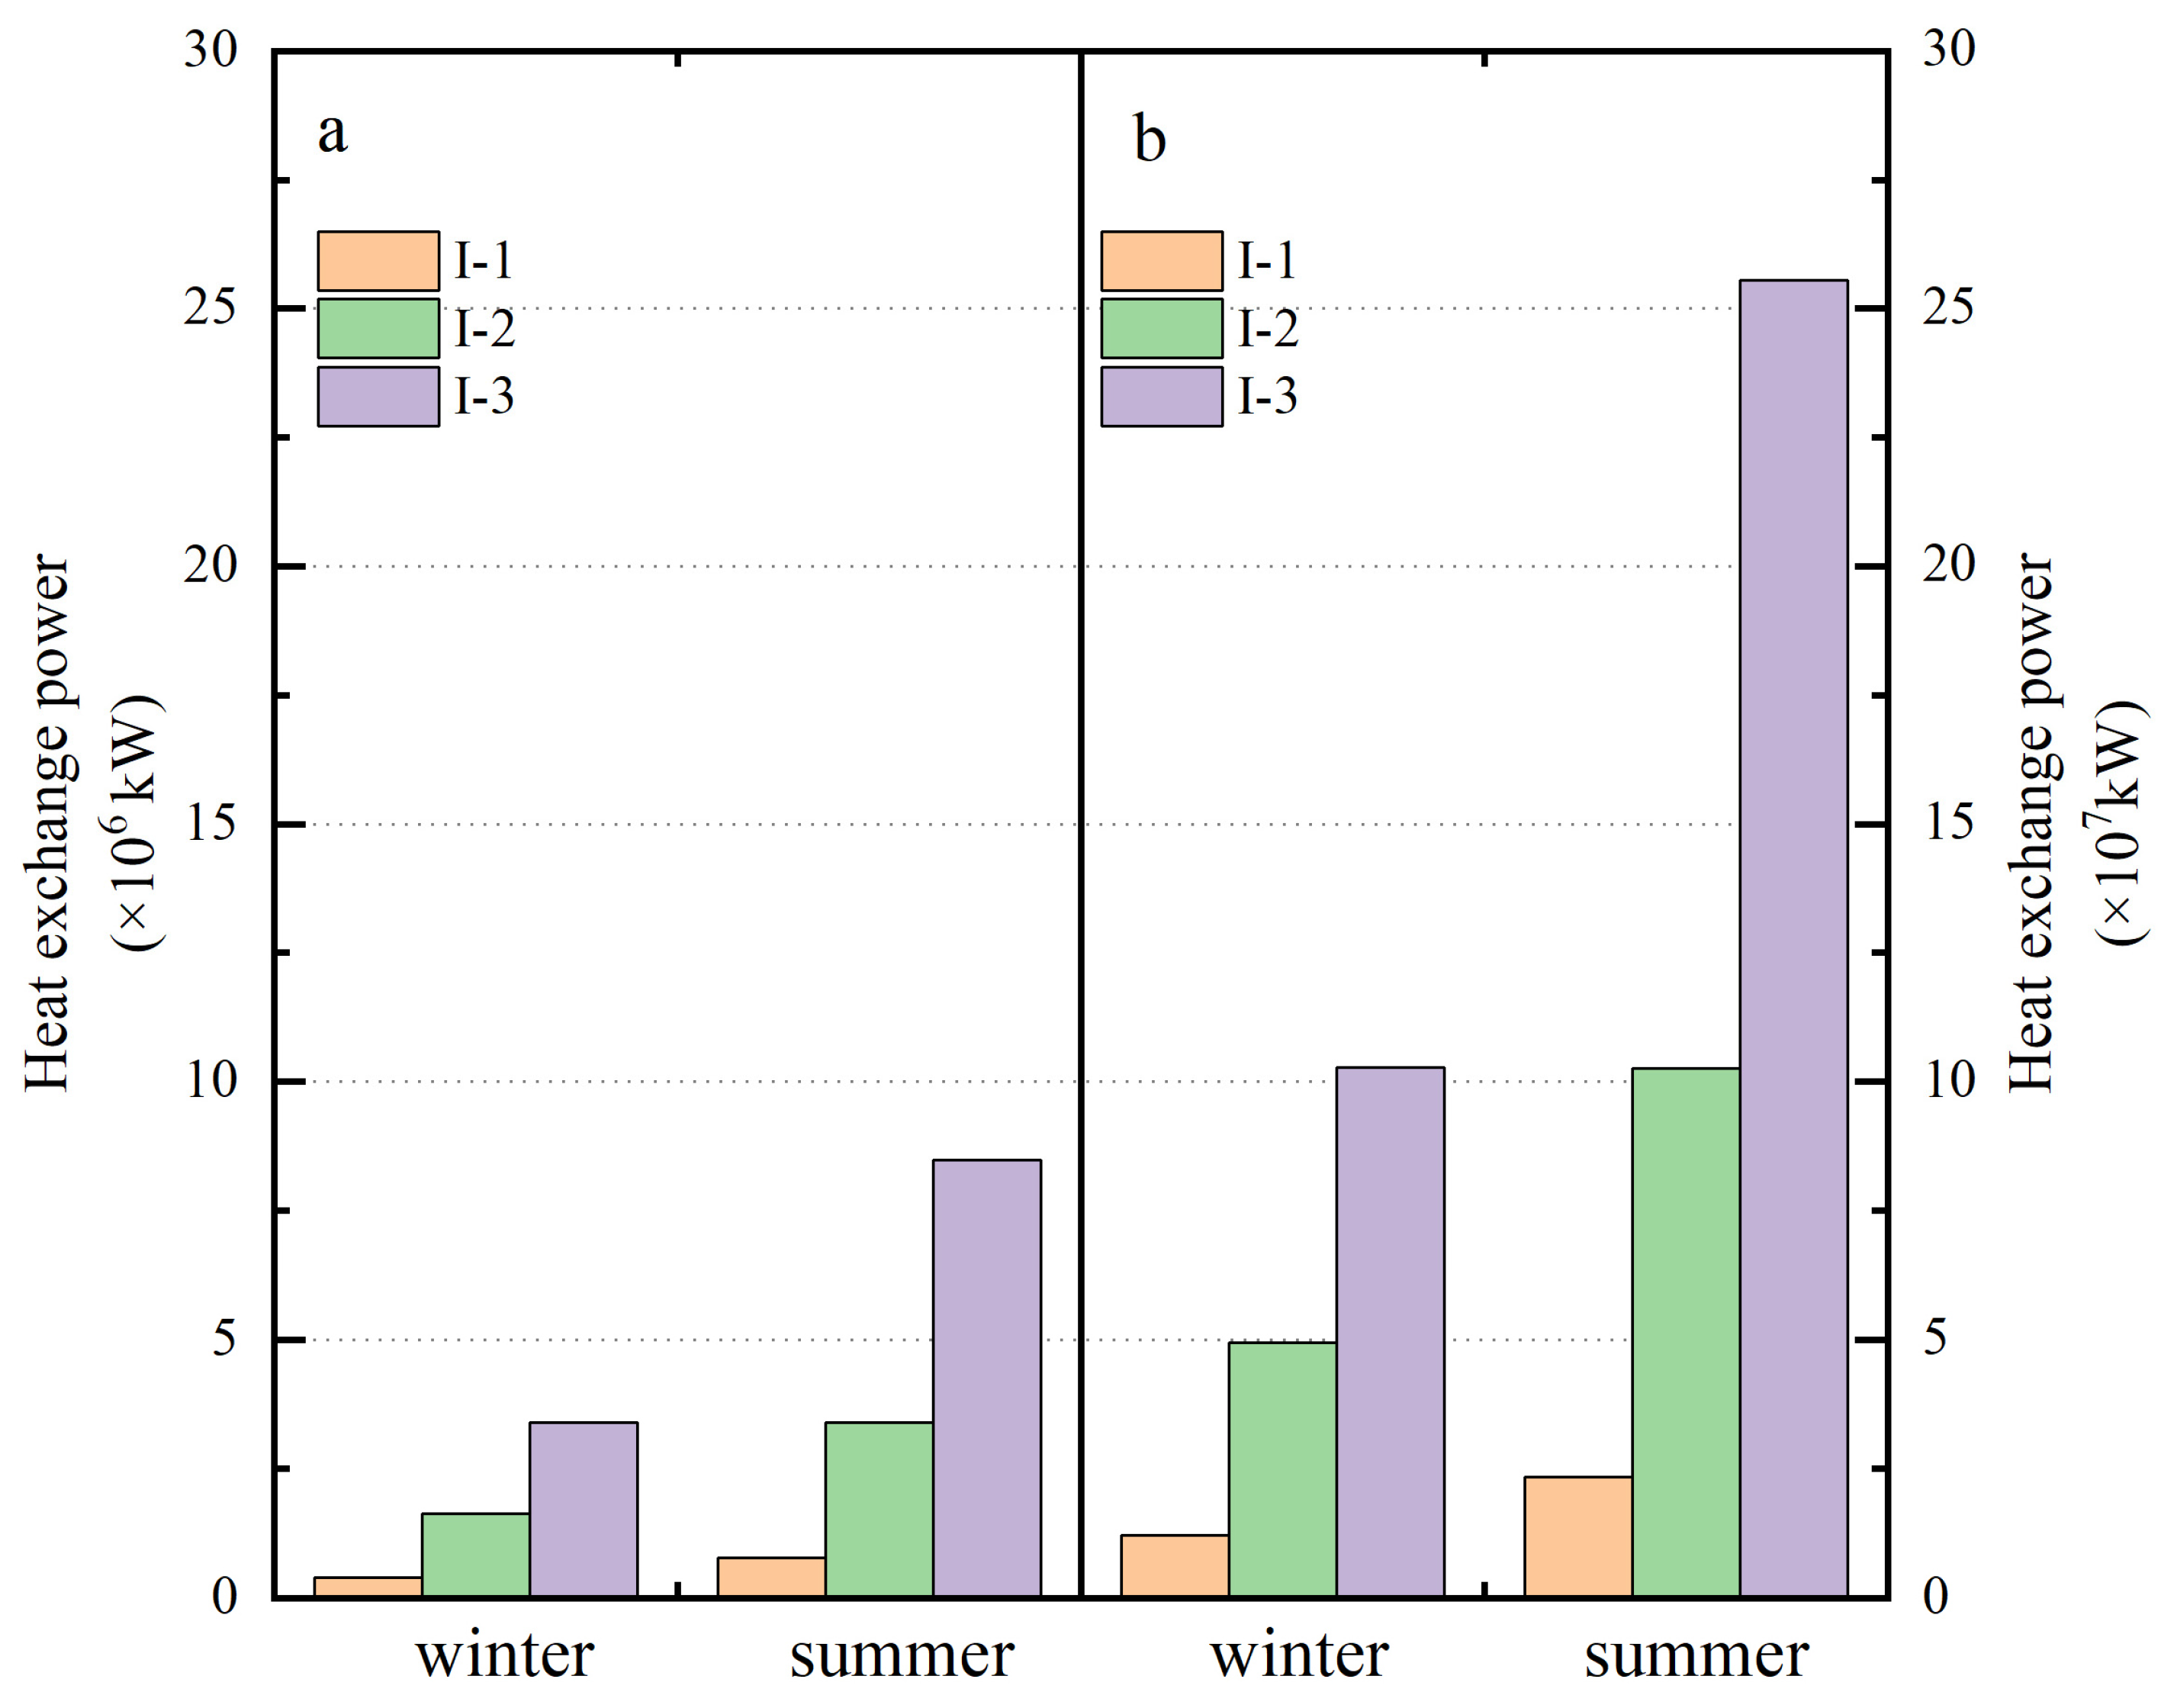
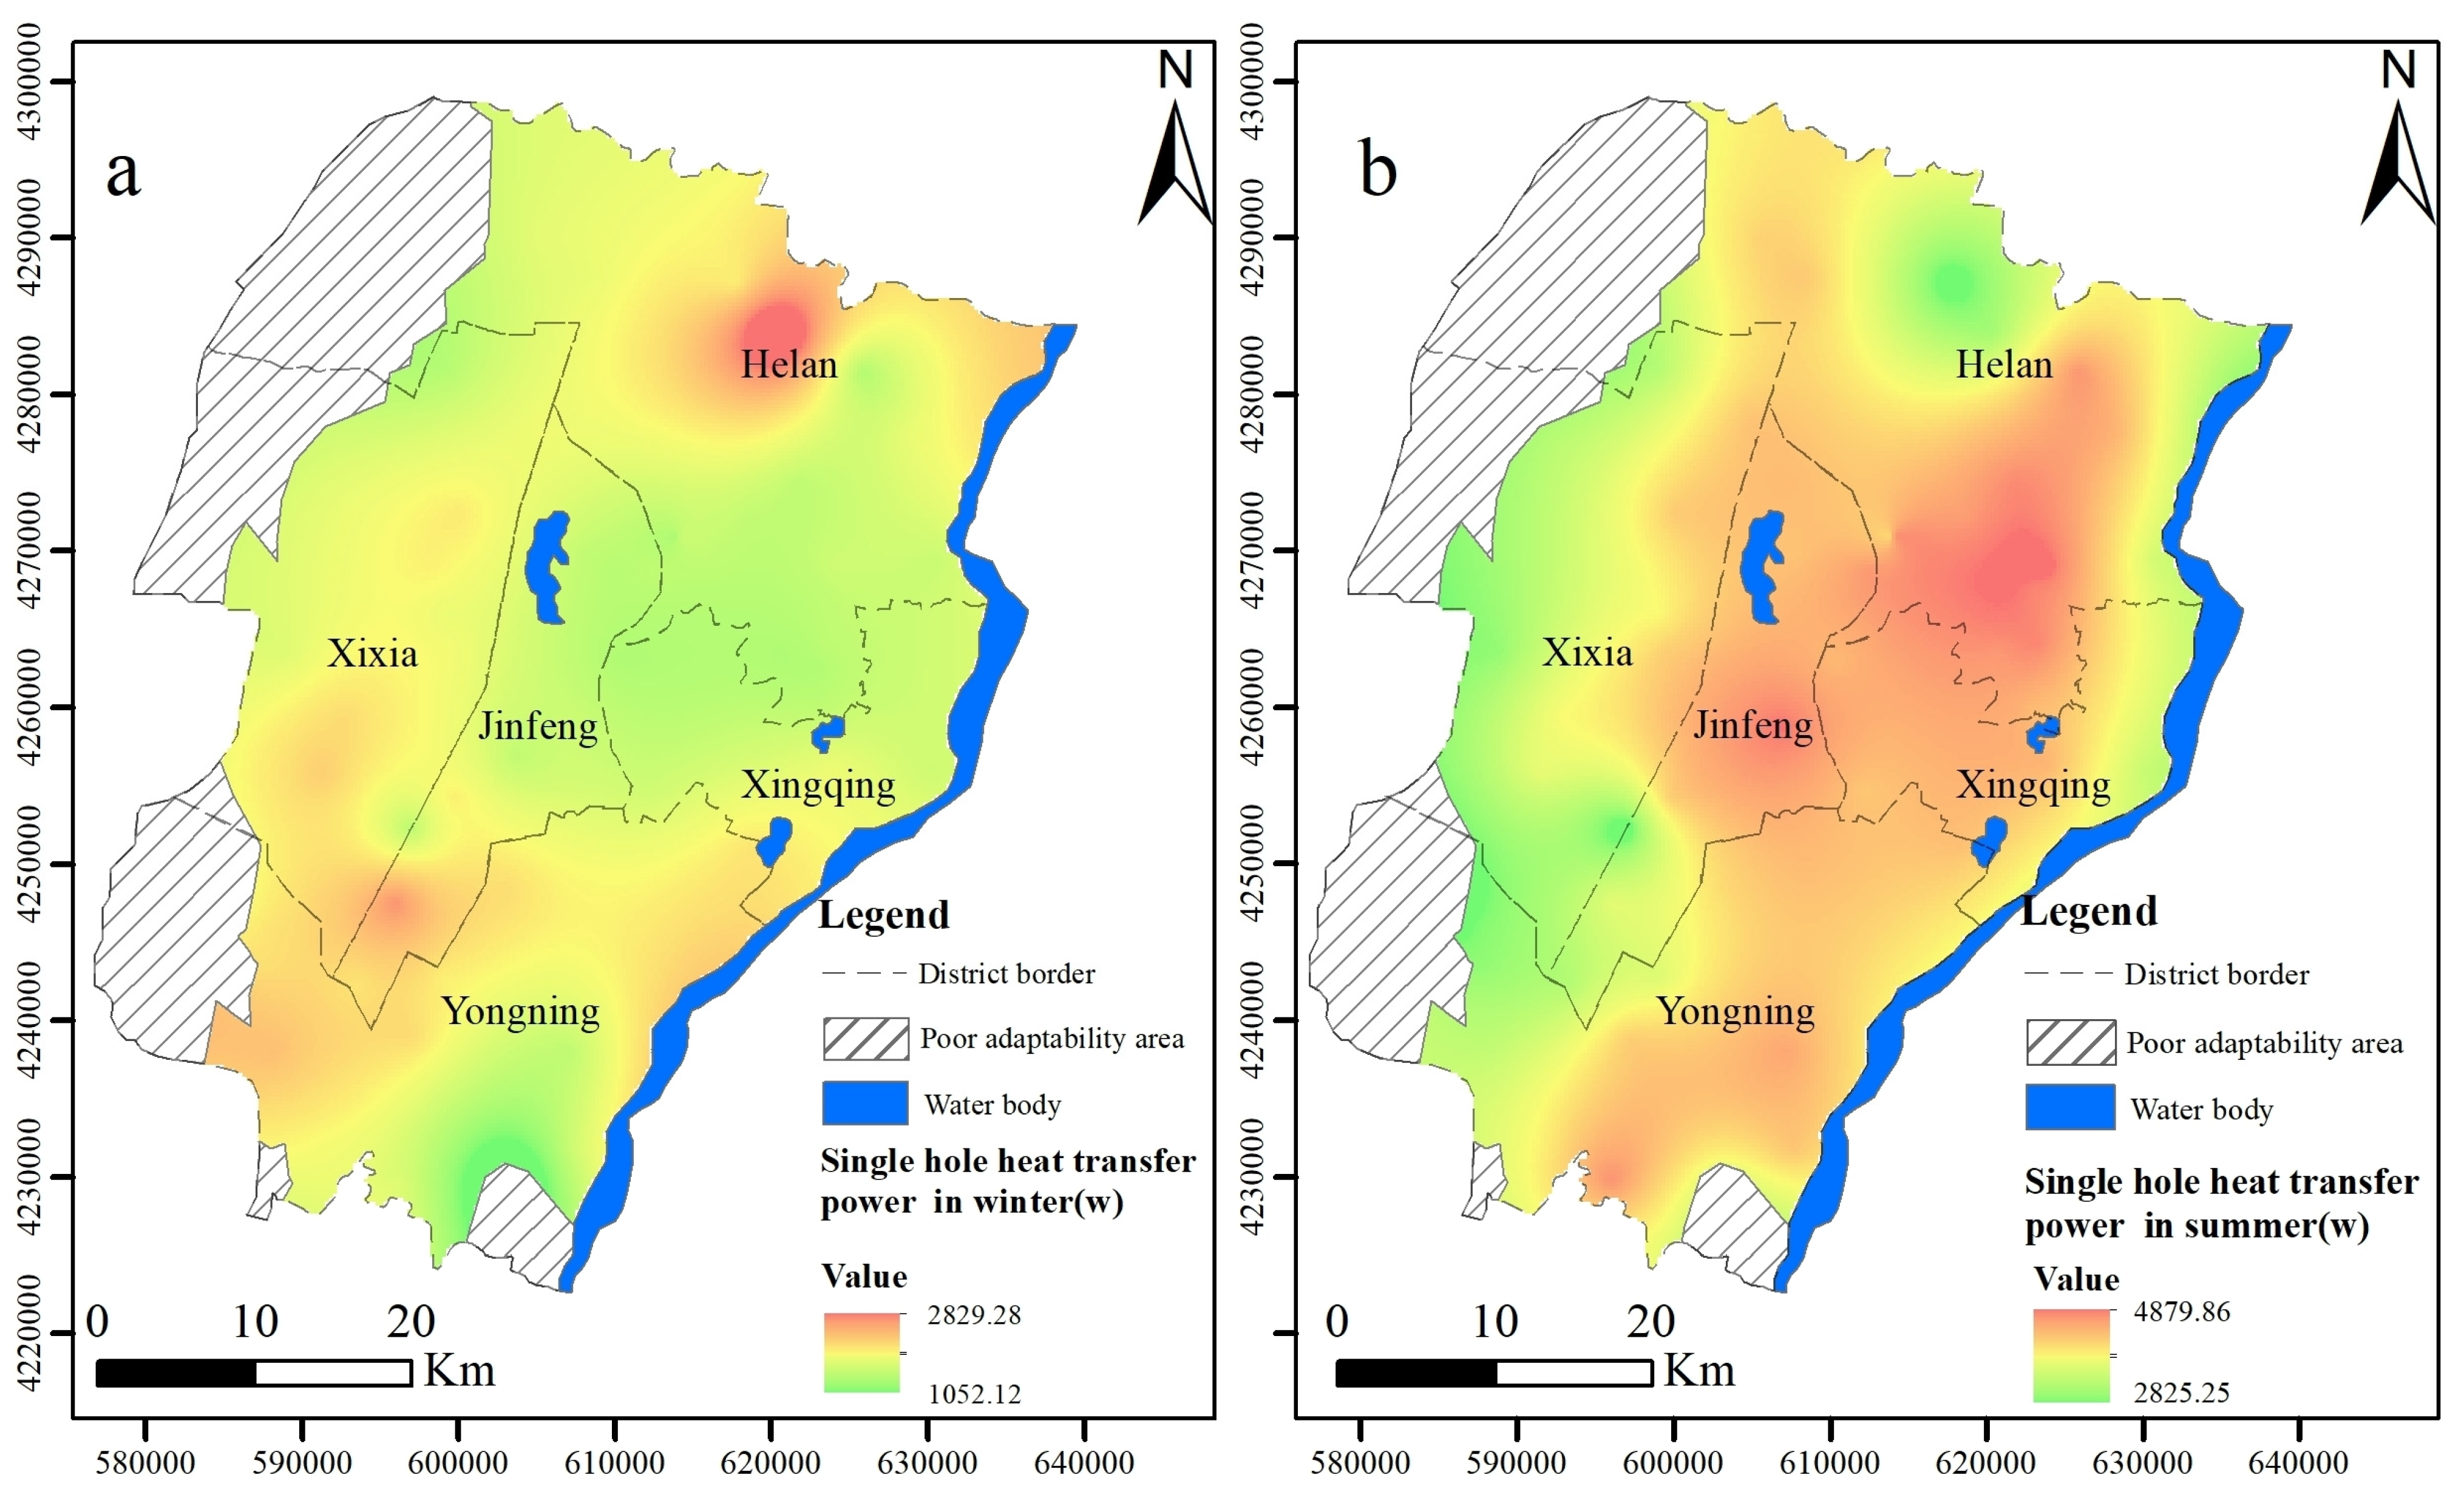
4.3.2. Heat Exchange Power (HEP)
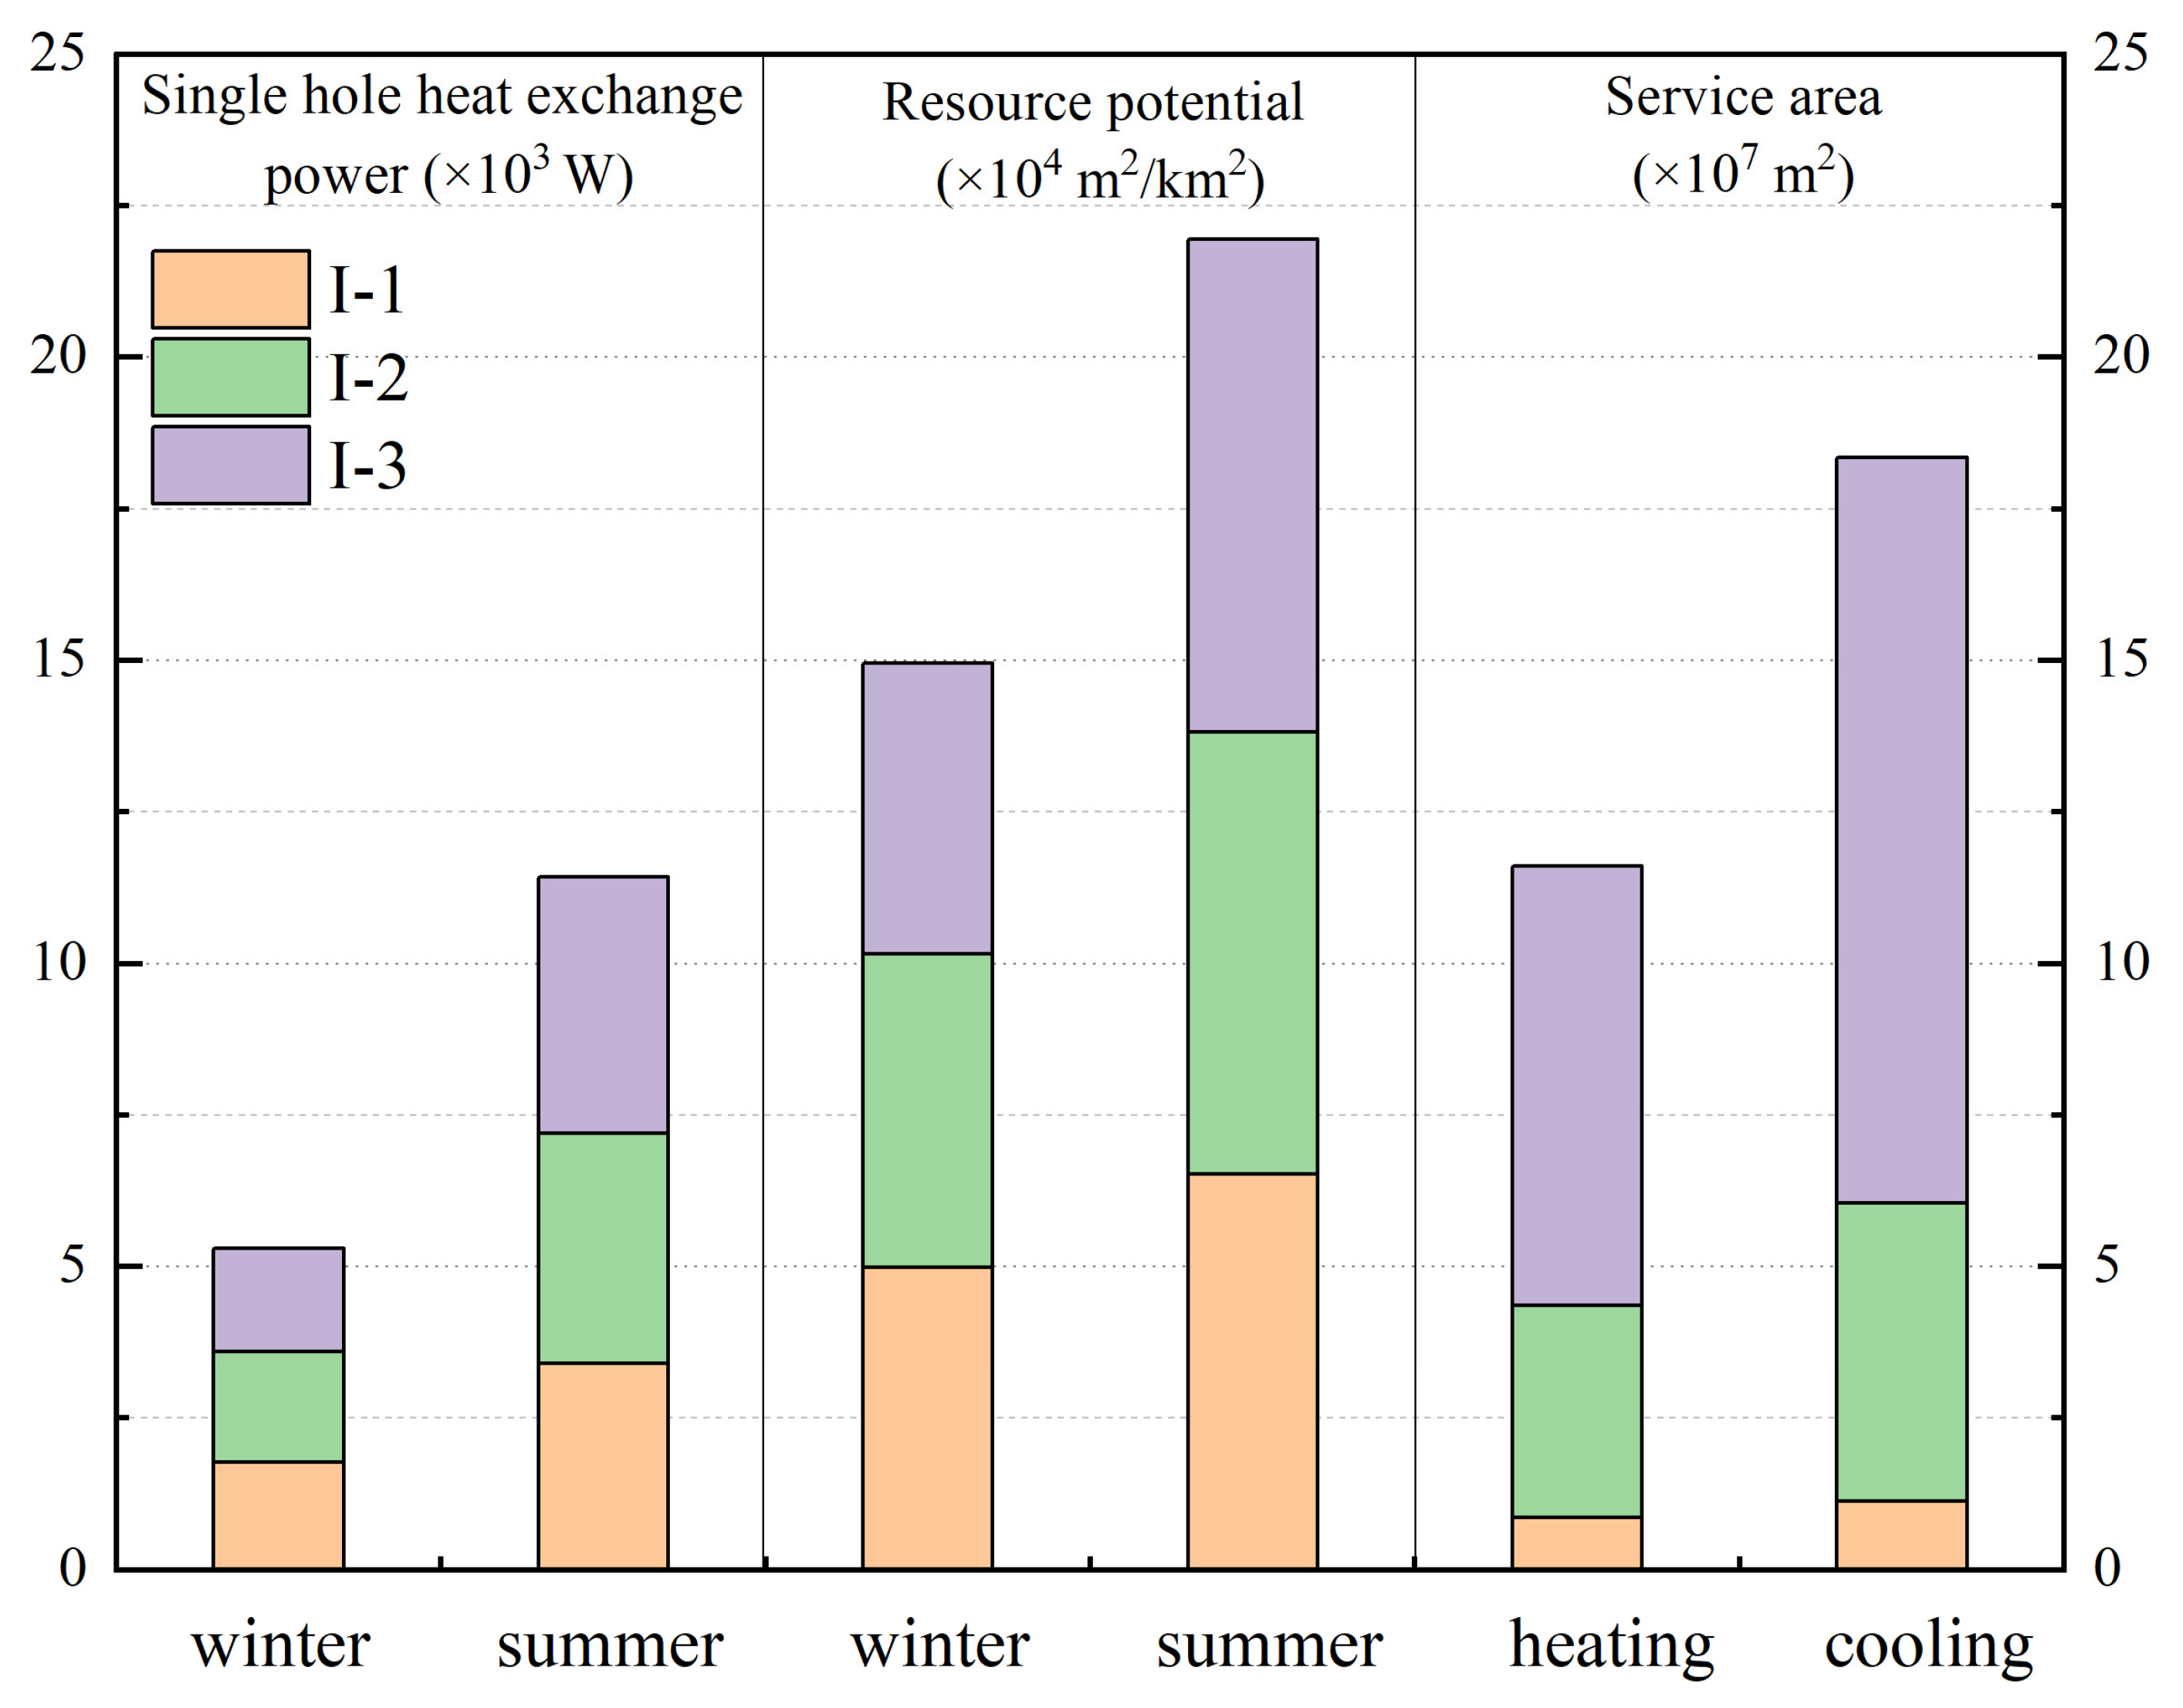
4.3.3. Resource Potential of the BHE
4.4. Evaluation of Economic and Environmental Benefits
5. Conclusions
Supplementary Materials
Author Contributions
Funding
Institutional Review Board Statement
Informed Consent Statement
Data Availability Statement
Acknowledgments
Conflicts of Interest
Appendix A
| A | B1 | B2 | B3 | ωi |
|---|---|---|---|---|
| B1 | 1.00 | 2.00 | 3.00 | 0.540 |
| B2 | 0.50 | 1.00 | 2.00 | 0.297 |
| B3 | 0.33 | 0.50 | 1.00 | 0.163 |
| CR | 0.007 < 0.1 | |||
| B1 | C1 | C2 | C3 | ωi |
|---|---|---|---|---|
| C1 | 1.00 | 1.00 | 2.00 | 0.4 |
| C2 | 1.00 | 1.00 | 2.00 | 0.4 |
| C3 | 0.50 | 0.50 | 1.00 | 0.2 |
| CR | 0 | |||
| B2 | C4 | C5 | C6 | C7 | ωi |
|---|---|---|---|---|---|
| C4 | 1.00 | 1.00 | 0.33 | 0.33 | 0.124 |
| C5 | 1 | 1.00 | 0.33 | 0.33 | 0.124 |
| C6 | 3.00 | 3.00 | 1.00 | 2.00 | 0.441 |
| C7 | 3.00 | 3.00 | 0.50 | 1.00 | 0.312 |
| CR | 0.022 < 0.1 | ||||
| B3 | C8 | C9 | ωi |
|---|---|---|---|
| C8 | 1 | 2 | 0.667 |
| C9 | 0.5 | 1 | 0.333 |
| CR | 0 | ||
| B1 | B2 | B3 | Combination Weight | |
|---|---|---|---|---|
| 0.540 | 0.297 | 0.163 | ||
| C1 | 0.4 | 0.216 | ||
| C2 | 0.4 | 0.216 | ||
| C3 | 0.2 | 0.108 | ||
| C4 | 0.124 | 0.037 | ||
| C5 | 0.124 | 0.037 | ||
| C6 | 0.441 | 0.131 | ||
| C7 | 0.312 | 0.093 | ||
| C8 | 0.667 | 0.109 | ||
| C9 | 0.333 | 0.054 | ||
| CRL | 0.010 < 0.1 | |||
References
- Adebayo, T.S. Environmental consequences of fossil fuel in Spain amidst renewable energy consumption: A new insights from the wavelet-based Granger causality approach. Int. J. Sustain. Dev. World Ecol. 2022, 29, 579–592. [Google Scholar] [CrossRef]
- Karmaker, A.K.; Rahman, M.M.; Hossain, M.A.; Ahmed, M.R. Exploration and corrective measures of greenhouse gas emission from fossil fuel power stations for Bangladesh. J. Clean. Prod. 2020, 244, 118645. [Google Scholar] [CrossRef]
- Lamb, W.F.; Wiedmann, T.; Pongratz, J.; Andrew, R.; Crippa, M.; Olivier, J.G.; Wiedenhofer, D.; Mattioli, G.; Al Khourdajie, A.; House, J. A review of trends and drivers of greenhouse gas emissions by sector from 1990 to 2018. Environ. Res. Lett. 2021, 16, 073005. [Google Scholar] [CrossRef]
- Zheng, X.; Streimikiene, D.; Balezentis, T.; Mardani, A.; Cavallaro, F.; Liao, H. A review of greenhouse gas emission profiles, dynamics, and climate change mitigation efforts across the key climate change players. J. Clean. Prod. 2019, 234, 1113–1133. [Google Scholar] [CrossRef]
- Nieto, J.; Carpintero, Ó.; Lobejón, L.F.; Miguel, L.J. An ecological macroeconomics model: The energy transition in the EU. Energy Policy 2020, 145, 111726. [Google Scholar] [CrossRef]
- Langevin, J.; Harris, C.B.; Reyna, J.L. Assessing the potential to reduce US building CO2 emissions 80% by 2050. Joule 2019, 3, 2403–2424. [Google Scholar] [CrossRef]
- Fragkos, P.; Laura van Soest, H.; Schaeffer, R.; Reedman, L.; Köberle, A.C.; Macaluso, N.; Evangelopoulou, S.; De Vita, A.; Sha, F.; Qimin, C.; et al. Energy system transitions and low-carbon pathways in Australia, Brazil, Canada, China, EU-28, India, Indonesia, Japan, Republic of Korea, Russia and the United States. Energy 2021, 216, 119385. [Google Scholar] [CrossRef]
- Chen, M.; Ma, M.; Lin, Y.; Ma, Z.; Li, K. Carbon Kuznets curve in China’s building operations: Retrospective and prospective trajectories. Sci. Total Environ. 2022, 803, 150104. [Google Scholar] [CrossRef] [PubMed]
- Ang, T.-Z.; Salem, M.; Kamarol, M.; Das, H.S.; Nazari, M.A.; Prabaharan, N. A comprehensive study of renewable energy sources: Classifications, challenges and suggestions. Energy Strategy Rev. 2022, 43, 100939. [Google Scholar] [CrossRef]
- Omri, E.; Chtourou, N.; Bazin, D. Technological, economic, institutional, and psychosocial aspects of the transition to renewable energies: A critical literature review of a multidimensional process. Renew. Energy Focus 2022, 43, 37–49. [Google Scholar] [CrossRef]
- Meraj, S.T.; Yu, S.S.; Rahman, M.S.; Hasan, K.; Hossain Lipu, M.S.; Trinh, H. Energy management schemes, challenges and impacts of emerging inverter technology for renewable energy integration towards grid decarbonization. J. Clean. Prod. 2023, 405, 137002. [Google Scholar] [CrossRef]
- Walch, A.; Li, X.; Chambers, J.; Mohajeri, N.; Yilmaz, S.; Patel, M.; Scartezzini, J.-L. Shallow geothermal energy potential for heating and cooling of buildings with regeneration under climate change scenarios. Energy 2022, 244, 123086. [Google Scholar] [CrossRef]
- Romanov, D.; Leiss, B. Geothermal energy at different depths for district heating and cooling of existing and future building stock. Renew. Sustain. Energy Rev. 2022, 167, 112727. [Google Scholar] [CrossRef]
- Caliskan, H.; Açıkkalp, E.; Rostamnejad Takleh, H.; Zare, V. Advanced, extended and combined extended-advanced exergy analyses of a novel geothermal powered combined cooling, heating and power (CCHP) system. Renew. Energy 2023, 206, 125–134. [Google Scholar] [CrossRef]
- Mao, R.; Zhao, Z.; Tian, L.; Fang, T.; Wang, X. Generation of gridded temperature map of constant-temperature layer based on meteorological data for shallow geothermal applications. Geothermics 2023, 113, 102770. [Google Scholar] [CrossRef]
- Yang, H.; Cui, P.; Fang, Z. Vertical-borehole ground-coupled heat pumps: A review of models and systems. Appl. Energy 2010, 87, 16–27. [Google Scholar] [CrossRef]
- Han, Z.; Ran, W.; Tong, H.; Liu, Z. Exploration and evaluation of shallow geothermal energy. Geol. China 2007, 34, 1115–1121. [Google Scholar]
- Zhang, L.; Chen, S.; Zhang, C. Geothermal power generation in China: Status and prospects. Energy Sci. Eng. 2019, 7, 1428–1450. [Google Scholar] [CrossRef]
- Eidesgaard, Ó.R.; Schovsbo, N.H.; Boldreel, L.O.; Ólavsdóttir, J. Shallow geothermal energy system in fractured basalt: A case study from Kollafjørður, Faroe Islands, NE-Atlantic Ocean. Geothermics 2019, 82, 296–314. [Google Scholar] [CrossRef]
- Chiasson, A.D. Geothermal Heat Pump and Heat Engine Systems: Theory and Practice; John Wiley & Sons: Hoboken, NJ, USA, 2016. [Google Scholar]
- Luo, J.; Luo, Z.; Xie, J.; Xia, D.; Huang, W.; Shao, H.; Xiang, W.; Rohn, J. Investigation of shallow geothermal potentials for different types of ground source heat pump systems (GSHP) of Wuhan city in China. Renew. Energy 2018, 118, 230–244. [Google Scholar] [CrossRef]
- Xu, Y.-S.; Wang, X.-W.; Shen, S.-L.; Zhou, A. Distribution characteristics and utilization of shallow geothermal energy in China. Energy Build. 2020, 229, 110479. [Google Scholar] [CrossRef]
- Li, Z.; Luo, Z.; Wang, Y.; Fan, G.; Zhang, J. Suitability evaluation system for the shallow geothermal energy implementation in region by Entropy Weight Method and TOPSIS method. Renew. Energy 2022, 184, 564–576. [Google Scholar] [CrossRef]
- Hu, Z.; Gao, Z.; Xu, X.; Fang, S.; Zhou, L.; Ji, D.; Li, F.; Feng, J.; Wang, M. Suitability zoning of buried pipe ground source heat pump and shallow geothermal resource evaluation of Linqu County, Shandong Province, China. Renew. Energy 2022, 198, 1430–1439. [Google Scholar] [CrossRef]
- Majorowicz, J.; Grasby, S.E.; Skinner, W.R. Estimation of shallow geothermal energy resource in Canada: Heat gain and heat sink. Nat. Resour. Res. 2009, 18, 95–108. [Google Scholar] [CrossRef]
- Majorowicz, J.A.; Grasby, S.E. Heat transition for major communities supported by geothermal energy development of the Alberta Basin, Canada. Geothermics 2020, 88, 101883. [Google Scholar] [CrossRef]
- Galgaro, A.; Di Sipio, E.; Teza, G.; Destro, E.; De Carli, M.; Chiesa, S.; Zarrella, A.; Emmi, G.; Manzella, A. Empirical modeling of maps of geo-exchange potential for shallow geothermal energy at regional scale. Geothermics 2015, 57, 173–184. [Google Scholar] [CrossRef]
- Blázquez, C.S.; Maté-González, M.Á.; Nieto, I.M.; Martín, A.F.; Gonzalez-Aguilera, D. Assessment of the geothermal potential in the region of Ávila (Spain): An integrated and interactive thermal approach. Geothermics 2022, 98, 102294. [Google Scholar] [CrossRef]
- Meng, B.; Vienken, T.; Kolditz, O.; Shao, H. Evaluating the thermal impacts and sustainability of intensive shallow geothermal utilization on a neighborhood scale: Lessons learned from a case study. Energy Convers. Manag. 2019, 199, 111913. [Google Scholar] [CrossRef]
- Blázquez, C.S.; Nieto, I.M.; Maté González, M.Á.; García, P.C.; Martín, A.F.; González-Aguilera, D. Geophysical exploration for shallow geothermal applications: A case study in Artà, (Balearic Islands, Spain). Geothermics 2022, 105, 102517. [Google Scholar] [CrossRef]
- Luo, J.; Rohn, J.; Xiang, W.; Bertermann, D.; Blum, P. A review of ground investigations for ground source heat pump (GSHP) systems. Energy Build. 2016, 117, 160–175. [Google Scholar] [CrossRef]
- Sarbu, I.; Sebarchievici, C. General review of ground-source heat pump systems for heating and cooling of buildings. Energy Build. 2014, 70, 441–454. [Google Scholar] [CrossRef]
- Karytsas, S.; Theodoropoulou, H. Public awareness and willingness to adopt ground source heat pumps for domestic heating and cooling. Renew. Sustain. Energy Rev. 2014, 34, 49–57. [Google Scholar] [CrossRef]
- Bose, J.E.; Smith, M.D.; Spitler, J.D. Advances in Ground Source Heat Pump Systems—An International Overview; China Architecture & Building Press: Beijing, China, 2002; pp. 313–324. [Google Scholar]
- Focaccia, S.; Tinti, F.; Monti, F.; Amidei, S.; Bruno, R. Shallow geothermal energy for industrial applications: A case study. Sustain. Energy Technol. Assess. 2016, 16, 93–105. [Google Scholar] [CrossRef]
- Florides, G.; Kalogirou, S. Ground heat exchangers—A review of systems, models and applications. Renew. Energy 2007, 32, 2461–2478. [Google Scholar] [CrossRef]
- Omer, A.M. Ground-source heat pumps systems and applications. Renew. Sustain. Energy Rev. 2008, 12, 344–371. [Google Scholar] [CrossRef]
- Halilovic, S.; Böttcher, F.; Kramer, S.C.; Piggott, M.D.; Zosseder, K.; Hamacher, T. Well layout optimization for groundwater heat pump systems using the adjoint approach. Energy Convers. Manag. 2022, 268, 116033. [Google Scholar] [CrossRef]
- Bernier, M.A. Closed-loop ground-coupled heat pump systems. Ashrae J. 2006, 48, 12–25. [Google Scholar]
- Tang, F.; Nowamooz, H. Factors influencing the performance of shallow Borehole Heat Exchanger. Energy Convers. Manag. 2019, 181, 571–583. [Google Scholar] [CrossRef]
- Chandio, I.A.; Matori, A.N.B.; WanYusof, K.B.; Talpur, M.A.H.; Balogun, A.-L.; Lawal, D.U. GIS-based analytic hierarchy process as a multicriteria decision analysis instrument: A review. Arab. J. Geosci. 2013, 6, 3059–3066. [Google Scholar] [CrossRef]
- Casasso, A.; Sethi, R.G. POT: A quantitative method for the assessment and mapping of the shallow geothermal potential. Energy 2016, 106, 765–773. [Google Scholar] [CrossRef]
- Casasso, A.; Sethi, R. Assessment and mapping of the shallow geothermal potential in the province of Cuneo (Piedmont, NW Italy). Renew. Energy 2017, 102, 306–315. [Google Scholar] [CrossRef]
- Amrani, S.-E.; Merrouni, A.A.; Touili, S.; Dekhissi, H. A multi-scenario site suitability analysis to assess the installation of large scale photovoltaic-hydrogen production units. Case study: Eastern Morocco. Energy Convers. Manag. 2023, 295, 117615. [Google Scholar] [CrossRef]
- Zhang, H.; Li, W.; Miao, P.; Sun, B.; Kong, F. Risk grade assessment of sudden water pollution based on analytic hierarchy process and fuzzy comprehensive evaluation. Environ. Sci. Pollut. Res. 2020, 27, 469–481. [Google Scholar] [CrossRef] [PubMed]
- Xu, S.; Xu, D.; Liu, L. Construction of regional informatization ecological environment based on the entropy weight modified AHP hierarchy model. Sustain. Comput. Inform. Syst. 2019, 22, 26–31. [Google Scholar] [CrossRef]
- Pautz, C.; Santos, A.R.d.; Ferrari, J.L.; Guerra Filho, P.A.; Kunz, S.H.; Dias, H.M.; Moreira, T.R.; Carvalho, R.d.C.F.; Mardeni, V.D.N.; Santos, E.C.d. Mapping the Environmental Vulnerability of a Lagoon Using Fuzzy Logic and the AHP Method. Water 2023, 15, 2102. [Google Scholar] [CrossRef]
- Jovanović, B.; Filipović, J.; Bakić, V. Prioritization of manufacturing sectors in Serbia for energy management improvement–AHP method. Energy Convers. Manag. 2015, 98, 225–235. [Google Scholar] [CrossRef]
- Xie, X.; Yi, Y.; Zhang, H.; Jiang, Y. Theoretical model of absorption heat pump from ideal solution to real solution: Temperature lift factor model. Energy Convers. Manag. 2022, 271, 116328. [Google Scholar] [CrossRef]
- Cherkose, B.A.; Issa, S.; Saibi, H.; ElHaj, K. Building a geospatial model to identify potential geothermal sites in Ayrobera: Afar depression, NE Ethiopia. Geothermics 2023, 110, 102689. [Google Scholar] [CrossRef]
- Dong, J.; He, P.; Liu, H.; Guan, Y.; Liu, H.; Xia, W.; Dong, J. AHP-Based Evaluation of the Suitability of Shallow Geothermal Energy Utilization in GSHP System. Front. Energy Res. 2022, 10, 183. [Google Scholar] [CrossRef]
- Hou, J.; Luo, X.; Zhang, L. Establishment of Evaluation Model for Shallow Geothermal Energy Resource Development Potential Based on Characteristic of Geotemperature. Earth Sci. Res. J. 2020, 24, 317–325. [Google Scholar] [CrossRef]
- Elbarbary, S.; Abdel Zaher, M.; Saibi, H.; Fowler, A.-R.; Saibi, K. Geothermal renewable energy prospects of the African continent using GIS. Geotherm. Energy 2022, 10, 8. [Google Scholar] [CrossRef]
- Li, P.; He, S.; He, X.; Tian, R. Seasonal hydrochemical characterization and groundwater quality delineation based on matter element extension analysis in a paper wastewater irrigation area, northwest China. Expo. Health 2018, 10, 241–258. [Google Scholar] [CrossRef]
- Qian, H.; Li, P. Hydrochemical characteristics of groundwater in Yinchuan plain and their control factors. Asian J. Chem. 2011, 23, 2927. [Google Scholar]
- Yang, C. Research on Comprehensive Evaluation of Shallow Geothermal Energy Resources in Yinchuan Area. Ph.D. Thesis, Chang’an University, Xi’an, China, 2017. [Google Scholar]
- Ningxia Statistical Yearbook; China Statistics Press: Beijing, China, 2022.
- Zhang, Y.T.; Hou, K.; Qian, H.; Gao, Y.Y.; Fang, Y.; Tang, S.Q.; Xiao, S.; Ren, W.H.; Qu, W.G.; Zhang, Q.Y. Natural-human driving factors of groundwater salinization in a long-term irrigation area. Environ. Res. 2023, 220, 115178. [Google Scholar] [CrossRef] [PubMed]
- Chen, J.; Qian, H.; Gao, Y.Y.; Li, X.Y. Human Health Risk Assessment of Contaminants in Drinking Water Based on Triangular Fuzzy Numbers Approach in Yinchuan City, Northwest China. Expo. Health 2018, 10, 155–166. [Google Scholar] [CrossRef]
- Chen, J.; Qian, H.; Wu, H. Nitrogen contamination in groundwater in an agricultural region along the New Silk Road, northwest China: Distribution and factors controlling its fate. Environ. Sci. Pollut. Res. 2017, 24, 13154–13167. [Google Scholar] [CrossRef]
- Qian, H.; Li, P.; Howard, K.W.F.; Yang, C.; Zhang, X. Assessment of groundwater vulnerability in the Yinchuan Plain, Northwest China using OREADIC. Environ. Monit. Assess. 2012, 184, 3613–3628. [Google Scholar] [CrossRef]
- Qian, H.; Chen, J.; Howard, K.W.F. Assessing groundwater pollution and potential remediation processes in a multi-layer aquifer system. Environ. Pollut. 2020, 263, 114669. [Google Scholar] [CrossRef] [PubMed]
- Qian, H.; Li, P.; Wu, J.; Zhou, Y. Isotopic characteristics of precipitation, surface and ground waters in the Yinchuan plain, Northwest China. Environ. Earth Sci. 2013, 70, 57–70. [Google Scholar] [CrossRef]
- Zhang, Y.T.; Hou, K.; Qian, H.; Gao, Y.Y.; Fang, Y.; Xiao, S.; Tang, S.Q.; Zhang, Q.Y.; Qu, W.A.; Ren, W.H. Characterization of soil salinization and its driving factors in a typical irrigation area of Northwest China. Sci. Total Environ. 2022, 837, 155808. [Google Scholar] [CrossRef]
- Zhang, G. Is spring the shortest season? China Meteorological News, 24 April 2020; p. 4. [Google Scholar]
- Chen, J.; Wu, H.; Qian, H.; Li, X.Y. Challenges and prospects of sustainable groundwater management in an agricultural plain along the Silk Road Economic Belt, north-west China. Int. J. Water Resour. Dev. 2018, 34, 354–368. [Google Scholar] [CrossRef]
- Qian, H.; Wu, J.; Zhou, Y.; Li, P. Stable oxygen and hydrogen isotopes as indicators of lake water recharge and evaporation in the lakes of the Yinchuan Plain. Hydrol. Process. 2014, 28, 3554–3562. [Google Scholar] [CrossRef]
- Carslaw, H.S.; Jaeger, J.C.; Feshbach, H. Conduction of heat in solids. Phys. Today 1962, 15, 74–76. [Google Scholar] [CrossRef]
- Esen, H.; Inalli, M. In-situ thermal response test for ground source heat pump system in Elazığ, Turkey. Energy Build. 2009, 41, 395–401. [Google Scholar] [CrossRef]
- Gehlin, S. Thermal Response Test: Method Development and Evaluation. Ph.D. Thesis, Luleå Tekniska Universitet, Luleå, Sweden, 2002. [Google Scholar]
- Popov, Y.; Tertychnyi, V.; Romushkevich, R.; Korobkov, D.; Pohl, J. Interrelations between thermal conductivity and other physical properties of rocks: Experimental data. In Thermo-Hydro-Mechanical Coupling in Fractured Rock; Birkhäuser: Basel, Switzerland, 2003; pp. 1137–1161. [Google Scholar]
- Gustafsson, S.E. Transient plane source techniques for thermal conductivity and thermal diffusivity measurements of solid materials. Rev. Sci. Instrum. 1991, 62, 797–804. [Google Scholar] [CrossRef]
- Boumaza, T.; Redgrove, J. Use of the transient plane source technique for rapid multiple thermal property measurements. Int. J. Thermophys. 2003, 24, 501–512. [Google Scholar] [CrossRef]
- Wu, X.H.; Qian, H.; Yu, D.M.; Zhang, Q.; Yan, Z.; Wang, W.; Ji, Y.D.; Liu, H.M.; Mao, Z.L.; Zhao, Q. Investigation and Assessment of Rational Allocation of Groundwater Resources in the Yinchuan Plain; Geology Publish House: Beijing, China, 2008; pp. 171–173. [Google Scholar]
- Wang, T. Suitability Evaluation on the Shallow Geothermal Energy in Major Cities Along the Yellow River, Ningxia Section. Master’s Thesis, Chang’an University, Xi’an, China, 2011. [Google Scholar]
- Saaty, T.L. How to make a decision: The analytic hierarchy process. Eur. J. Oper. Res. 1990, 48, 9–26. [Google Scholar] [CrossRef]
- DZ/T0225-2009; Specification for Shallow Geothermal Energy Investigation and Evaluation. Ministry of Land and Resources of the People’s Republic of China: Beijing, China, 2009.
- Wang, G.; Wang, W.; Luo, J.; Zhang, Y. Assessment of three types of shallow geothermal resources and ground-source heat-pump applications in provincial capitals in the Yangtze River Basin, China. Renew. Sustain. Energy Rev. 2019, 111, 392–421. [Google Scholar] [CrossRef]
- Wang, W.; Wang, G.; Liu, C.; Li, J. Research on the comprehensive thermal conductivity of shallow rock and soil in major cities in the North China Plain. Acta Geol. Sin. 2020, 94, 2089–2095. [Google Scholar]
- Bai, X.; Li, Z.; Liu, S.; Song, J. Study on comprehensive thermal conductivity of shallow rock and soil in alluvial plain of the Yellow River(Northwest Shandong)—Taking Linqing City as an example. Urban Geol. 2021, 16, 66–74. [Google Scholar]
- Zhou, Y.; Mu, G.; Liu, J.; Zhang, H.; Zhang, L.; Jing, G. Shallow Geothermal Energy Resources Occurrence Regularity of Typical Geomorphological Units. Bull. Geol. Sci. Technol. 2018, 37, 232–238+268. [Google Scholar]
- Zhang, L.; Zhou, Y.; Liu, J.; Jin, G.; Zhang, Y. Analysis on thermal conductivity of typical geomorphological units in Shaanxi Province based on superposition method. Geol. Surv. China 2020, 7, 91–96. [Google Scholar]
- Schön, J.H. Thermal Properties. In Developments in Petroleum Science; Elsevier: Amsterdam, The Netherlands, 2015; Volume 65, pp. 369–414. [Google Scholar]
- Zhang, N.; Wang, Z. Review of soil thermal conductivity and predictive models. Int. J. Therm. Sci. 2017, 117, 172–183. [Google Scholar] [CrossRef]
- Ambreen, T.; Kim, M.-H. Influence of particle size on the effective thermal conductivity of nanofluids: A critical review. Appl. Energy 2020, 264, 114684. [Google Scholar] [CrossRef]
- Zhou, Y.; Dai, L.; Tian, Z.; Yu, C.; Zhang, Z.; Liu, W.; PeI, L. Core characteristics and Quaternary stratigraphic division of borehole QK4 in southern Lubei Plain. Geophys. Geochem. Explor. 2023, 47, 55–64. [Google Scholar]
- Li, J.; Zheng, J.; Lei, X.; Du, J.; Li, F.; Jia, z.; Liu, A. Analysis of quaternary thermal properties and influencing factorson shallow geothermal energy exploitation in Beijing plain. Geol. China 2022, 49, 1543–1554. [Google Scholar]
- Ruan, C.; Feng, S.; Mou, S.; Cheng, W.; Zhao, S. Evaluation of Shallow Geothermal Energy Resources and Analysis of Development and Utilization Conditions in Tianjin. Hydrogeol. Eng. Geol. 2017, 44, 158–163. [Google Scholar]
- Zhao, L.; Sun, X.; Zhan, Y.; Han, J.; Yang, H.; Wang, P.; Liu, X. Characteristics of the three-dimensional deep electrical structure in the Helan Mountains-Yinchuan Basin and its geodynamic implications. Sci. China Earth Sci. 2023, 66, 505–520. [Google Scholar] [CrossRef]
- Walch, A.; Mohajeri, N.; Gudmundsson, A.; Scartezzini, J.-L. Quantifying the technical geothermal potential from shallow borehole heat exchangers at regional scale. Renew. Energy 2021, 165, 369–380. [Google Scholar] [CrossRef]
- Wang, W.; Wang, G.; Zhu, X.; Liu, Z. Characteristics and potential of shallow geothermal resources in provincial capital cities of China. Geol. China 2017, 44, 1062–1073. [Google Scholar]
- Shen, J.; Zhou, C.; Luo, Y.; Tian, Z.; Zhang, S.; Fan, J.; Ling, Z. Comprehensive thermal performance analysis and optimization study on U-type deep borehole ground source heat pump systems based on a new analytical model. Energy 2023, 274, 127367. [Google Scholar] [CrossRef]
- Dehkordi, S.E.; Schincariol, R.A. Effect of thermal-hydrogeological and borehole heat exchanger properties on performance and impact of vertical closed-loop geothermal heat pump systems. Hydrogeol. J. 2014, 22, 189. [Google Scholar] [CrossRef]
- GB/T 2589—2020; State Administration for Market Regulation of China; General Principles for Calculation of the Comprehensive Energy Consumption. China Standard Press: Beijing, China, 2020.
- DZT 0331-2020; Estimation and Evaluation Method of Geothermal Resources. Ministry of Natural Resources of the People’s Republic of China: Beijing, China, 2020.
- Feng, B.; Ma, Y.; Qi, Y.; Zhong, Y.; Sha, X. Health risk assessment of groundwater nitrogen pollution in Yinchuan plain. J. Contam. Hydrol. 2022, 249, 104031. [Google Scholar] [CrossRef]


| Item | Classification | Score | Item | Classification | Score |
|---|---|---|---|---|---|
| Thermal conductivity [w/(m·°C)] | >1.75 | 9 | Thickness of aquifer (m) | >172 | 9 |
| 1.5–1.75 | 5 | 152–172 | 7 | ||
| 1.25–1.5 | 3 | 132–152 | 5 | ||
| <1.25 | 1 | <132 | 3 | ||
| Specific heat capacity [kJ/(kg·°C)] | >1.15 | 9 | Geomorphology | Pluvial–alluvial plain | 7 |
| 1.10–1.15 | 7 | Alluvial–lacustrinel plain | 9 | ||
| 1.05–1.10 | 5 | Inclined pluvial plain | 3 | ||
| 1.00–1.05 | 3 | Aeolian dunes | 1 | ||
| <1 | 1 | Lake | 0 | ||
| Buried depth of water table (m) | <2 | 5 | Thickness ratio of sand/clay | 30–100 | 3 |
| 2–10 | 9 | 10–30 | 9 | ||
| 10–50 | 7 | 5–10 | 7 | ||
| 50–100 | 3 | 3–5 | 5 | ||
| >100 | 1 | <3 | 3 | ||
| Average ground temperature (°C) | >17 | 9 | Hydrulic conductivity of phreatic aquifer (m/d) | 5–10 | 5 |
| 15–17 | 7 | 10–20 | 7 | ||
| 13–15 | 5 | 20–30 | 9 | ||
| <13 | 3 | Hydrulic conductivity of confined aquifer (m/d) | 5–10 | 5 | |
| 10–20 | 7 | ||||
| single phreatic zone | 0 |
| Number | U-Type | Depth (m) | Effective Thermal Conductivity [W/(m·°C)] | Heat Transfer Rate (W/m) |
|---|---|---|---|---|
| TR01 | Double | 90 | 2.30 | 53.33 |
| TR02 | Double | 125 | 2.10 | 56.01 |
| TR03 | Double | 90 | 2.32 | 76.95 |
| TR04 | Double | 90 | 2.00 | 65.11 |
| TR05 | Double | 90 | 1.94 | 74.84 |
| TR06 | Double | 100 | 2.27 | 62.40 |
| TR07 | Double | 100 | 2.83 | 64.80 |
| TR08 | Double | 100 | 2.58 | 64.80 |
| TR09 | Double | 70 | 2.05 | 57.10 |
| Deposit | Silty Sand | Fine Sand | Sandy Clay | Clay |
|---|---|---|---|---|
| Num. | 62 | 113 | 44 | 9 |
| Moisture content ω (%) | 19.492 ± 3.779 * | 19.850 ± 3.607 | 23.323 ± 3.570 | 23.211 ± 4.738 |
| Porosity n (%) | 36.274 ± 3.577 | 35.740 ± 4.180 | 39.973 ± 3.874 | 38.911 ± 4.038 |
| Thermal diffusivity α (mm2/s) | 0.0032 ± 0.0007 | 0.0034 ± 0.0007 | 0.0023 ± 0.0006 | 0.0020 ± 0.0003 |
| Thermal conductivity λ [W/(m·°C)] | 1.931 ± 0.276 | 2.032 ± 0.308 | 1.452 ± 0.263 | 1.399 ± 0.206 |
| Specific heat capacity C [kJ/(kg·°C)] | 1.084 ± 0.118 | 1.074 ± 0.119 | 1.155 ± 0.127 | 1.234 ± 0.131 |
| City | Source | Thermal Conductivity λ [W/(m·°C)] | Specific Heat C [kJ/(kg·°C)] | Thermal Diffusivity α (mm2/s) | ||||||
|---|---|---|---|---|---|---|---|---|---|---|
| Min | Max | Mean | Min | Max | Mean | Min | Max | Mean | ||
| Shanghai | [78] | 1.03 | 2.77 | 1.75 | 0.6 | 1.99 | 1.31 | 0.33 | 1.79 | 0.72 |
| Hangzhou | same as above | 1.22 | 2.72 | 1.87 | 0.51 | 2.33 | 1.3 | 0.38 | 1.33 | 0.78 |
| Nanchang | same as above | 1.44 | 3.63 | 1.94 | 0.59 | 1.45 | 0.96 | 0.5 | 1.88 | 0.95 |
| Beijing | [87] | 1.47 | 2.02 | - | 2.32 | 3.08 | - | 0.45 | 0.84 | - |
| Tianjin | [88] | 1.26 | 1.62 | - | 1.90 | 2.20 | - | 0.44 | 0.74 | - |
| Linqu | [24] | 1.25 | 1.9 | - | 0.85 | 1.24 | - | 0.42 | 1.02 | - |
| Yinchuan | this study | 1.45 | 2.17 | 1.95 | 0.97 | 1.20 | 1.08 | 0.59 | 1.09 | 0.91 |
| Sub-Region | I | II | III | Total | |
|---|---|---|---|---|---|
| Area (km2) | 629.93 | 682.19 | 1544.07 | 2856.19 | |
| Aeration zone (kJ/°C) | QW | 4.56 × 10¹³ | 4.32 × 10¹² | 7.78 × 10¹² | 5.77 × 10¹³ |
| QS | 5.26 × 10¹³ | 5.50 × 10¹² | 1.03 × 10¹³ | 6.84 × 10¹³ | |
| QA | 6.06 × 10⁹ | 6.48 × 10⁸ | 1.30 × 10⁹ | 8.00 × 10⁹ | |
| Saturated zone within 100 m (kJ/°C) | QW | 5.84 × 10¹³ | 9.99 × 10¹³ | 2.23 × 10¹⁴ | 3.81 × 10¹⁴ |
| QS | 6.44 × 10¹³ | 1.17 × 10¹⁴ | 2.77 × 10¹⁴ | 4.58 × 10¹⁴ | |
| QR | 3.19 × 10¹⁴ | 2.37 × 10¹⁴ | 5.36 × 10¹⁴ | 1.09 × 10¹⁵ | |
| Heat capacity per unit area within 100 m (kJ/°C/km2) | 5.07 × 10¹¹ | 3.47 × 10¹¹ | 3.47 × 10¹¹ | 3.82 × 10¹¹ | |
| Saturated zone within 200 m (kJ/°C) | QW | 1.64 × 10¹⁴ | 2.09 × 10¹⁴ | 4.53 × 10¹⁴ | 8.26 × 10¹⁴ |
| QS | 1.79 × 10¹⁴ | 2.46 × 10¹⁴ | 5.63 × 10¹⁴ | 9.88 × 10¹⁴ | |
| QR | 4.41 × 10¹⁴ | 4.65 × 10¹⁴ | 1.03 × 10¹⁵ | 1.94 × 10¹⁵ | |
| Heat capacity per unit area within 200 m (kJ/°C/km2) | 7.01 × 10¹¹ | 6.81 × 10¹¹ | 6.70 × 10¹¹ | 6.79 × 10¹¹ |
| Emission Reduction Substances | CO2 | SO2 | NOx | Suspended Dust | Ash |
|---|---|---|---|---|---|
| Emission reduction coefficient | 2.386 | 1.7% | 0.6% | 0.8% | 10% |
| Treatment cost (CNY/kg) | 0.1 | 1.1 | 2.4 | 0.8 | 0.04 |
Disclaimer/Publisher’s Note: The statements, opinions and data contained in all publications are solely those of the individual author(s) and contributor(s) and not of MDPI and/or the editor(s). MDPI and/or the editor(s) disclaim responsibility for any injury to people or property resulting from any ideas, methods, instructions or products referred to in the content. |
© 2024 by the authors. Licensee MDPI, Basel, Switzerland. This article is an open access article distributed under the terms and conditions of the Creative Commons Attribution (CC BY) license (https://creativecommons.org/licenses/by/4.0/).
Share and Cite
Qu, W.; Yang, C.; Qian, H.; Xu, P.; Gao, Y.; Wei, L.; Long, Q. Geothermal Condition Investigation and Resource Potential Evaluation of Shallow Geothermal Energy in the Yinchuan Area, Ningxia, China. Sustainability 2024, 16, 10962. https://doi.org/10.3390/su162410962
Qu W, Yang C, Qian H, Xu P, Gao Y, Wei L, Long Q. Geothermal Condition Investigation and Resource Potential Evaluation of Shallow Geothermal Energy in the Yinchuan Area, Ningxia, China. Sustainability. 2024; 16(24):10962. https://doi.org/10.3390/su162410962
Chicago/Turabian StyleQu, Wengang, Chao Yang, Hui Qian, Panpan Xu, Yanyan Gao, Leiqiang Wei, and Qi Long. 2024. "Geothermal Condition Investigation and Resource Potential Evaluation of Shallow Geothermal Energy in the Yinchuan Area, Ningxia, China" Sustainability 16, no. 24: 10962. https://doi.org/10.3390/su162410962
APA StyleQu, W., Yang, C., Qian, H., Xu, P., Gao, Y., Wei, L., & Long, Q. (2024). Geothermal Condition Investigation and Resource Potential Evaluation of Shallow Geothermal Energy in the Yinchuan Area, Ningxia, China. Sustainability, 16(24), 10962. https://doi.org/10.3390/su162410962