Article

Promoting and Prioritizing the Sustainable Development Goals in Young People

1
Department of Mining, Industrial and ICT Engineering, Universitat Politècnica de Catalunya, 08242 Manresa, Barcelona, Spain
2
Department of Electric Engineering, Universitat Politècnica de Catalunya, 08242 Manresa, Barcelona, Spain
3
Department of Mathematics, Universitat Politècnica de Catalunya, 08242 Manresa, Barcelona, Spain
*
Author to whom correspondence should be addressed.
Sustainability 2024, 16(24), 10813; https://doi.org/10.3390/su162410813
Submission received: 22 October 2024 / Revised: 2 December 2024 / Accepted: 5 December 2024 / Published: 10 December 2024

Abstract

:
This project studies how to raise awareness of the environment and sustainability among secondary school students. The goal is for them to become aware of their role in transforming the world, in order to integrate the Sustainable Development Goals (SDGs) into students’ daily educational environment. The goal is to attain the highest possible level of diversity in terms of age, possible knowledge of the SDGs, and environmental awareness. Another important factor is geographical distribution, with the inclusion of students from rural and urban schools. The study was developed within the framework of Forest and Sustainability, a project designed for secondary schools in Catalonia, using interactive learning tools. Survey participants (a total of 1106) are asked to choose and prioritize five SDGs. To obtain information on the trends in the responses, the program Minitab Statistical Software (v.22) was used. The SDGs with the highest score are SDG 1 (No Poverty), SDG 2 (Zero Hunger), SDG 3 (Good Health and Well-Being), SDG 5 (Gender Equality), and SDG 16 (Peace, Justice, and Strong Institutions). The humanitarian and health factors concern members of the sample group most, with very interesting results when comparing the responses by gender, educational level, and rural or urban schools’ participants.

1. Introduction

“Humanity has the ability to make development sustainable to ensure that it meets the needs of the present without compromising the ability of future generations to meet their own needs. The concept of sustainable development does imply limits—not absolute limits, but limitations imposed by the present state of technology and social organization on environmental resources and by the ability of the biosphere to absorb the effects of human activities” [1]. This was how the most commonly used definition of the concept of “sustainable development” was first presented in the Brundtland Report, published by the World Commission on Environment and Development in 1987. After the Brundtland Report, the UN Conference on Environment and Development (the 1992 Rio Earth Summit), the Millennium Declaration—from which the Millennium Sustainable Development Goals were derived—(2000), and the UN Conference on Sustainable Development (the 2012 Rio+20 Conference) were three of the most important milestones in the international pursuit of sustainable development. They helped to pave the way for the 2030 Agenda [2]. The framework within which councils had to operate had begun to change significantly before the Rio Earth Summit [3]. Rio+20 was based on an analysis showing that the objectives of sustainable development from the 1992 Rio conference had not been achieved. In early June 2012, the 5th Global Environmental Conference concluded that significant progress had been made on only four of the ninety assessed, internationally agreed-upon goals associated with sustainable development [4]. After acknowledging the limitations of the Millennium Development Goals (MDGs), the United Nations initiated seventeen Sustainable Development Goals (SDGs) as more integrated and inclusive solutions to end poverty, protect the planet, and ensure that all people enjoy peace and prosperity [5]. In September 2015, the UN General Assembly adopted the “Transforming our World: the 2030 Agenda for Sustainable Development” document. The 2030 Agenda for Sustainable Development is a plan of action for people, the planet, and prosperity. The 17 Sustainable Development Goals and 169 targets involve the entire world:
SDG1: No poverty—End poverty in all its forms everywhere.
SDG2: No hunger—End hunger, achieve food security, improve nutrition, and promote sustainable agriculture.
SDG3: Good Health and Well-being—Ensure healthy lives and promote well-being for all ages.
SDG4: Quality education—Ensure inclusive and equitable quality education and promote lifelong learning opportunities for all.
SDG5: Gender equality—Achieve gender equality and empower all women and girls.
SDG6: Clean water and sanitation—Ensure availability and sustainable management of water and sanitation for all.
SDG7: Affordable and Clean Energy—Ensure access to affordable, reliable, sustainable, and modern energy for all.
SDG8: Decent Work and Economic Growth—Promote sustained, inclusive, and sustainable economic growth, full and productive employment, and decent work for all.
SDG9: Industry, Innovation, and Infrastructure—Build resilient infrastructure, promote inclusive and sustainable industrialization, and foster innovation.
SDG10: Reduced Inequalities—Reduce inequality within and among countries.
SDG11: Sustainable Cities and Communities—Make cities and human settlements inclusive, safe, resilient, and sustainable.
SDG12: Responsible Consumption and Production—Ensure sustainable consumption and production patterns.
SDG13: Climate Action—Take urgent action to combat climate change and its impacts.
SDG14: Life Below Water—Conserve and sustainably use the oceans, seas, and marine resources.
SDG15: Life on Land—Protect, restore, and promote sustainable use of terrestrial ecosystems.
SDG16: Peace, Justice, and Strong Institutions—Promote peaceful and inclusive societies, provide access to justice for all, and build effective, accountable institutions.
SDG17: Partnerships for the Goals—Strengthen global partnerships to achieve sustainable development.
Despite recognizing that the SDGs are essential to humanity, their implementation in different countries is progressing at different rates [6]. Furthermore, there are still critical challenges regarding the potential conflicts associated with the implementation of the SDGs [7].
The 2030 Agenda clearly reflects the importance of an appropriate educational response. Education is explicitly formulated as a stand-alone goal: SDG 4. Furthermore, education is both a goal in itself and a means of attaining the other SDGs [8]. This goal emphasizes education as a fundamental right and a cornerstone for personal, social, and economic development. SDG 4 is central to achieving sustainable development because it empowers individuals and communities to address challenges in health, gender equality, economic growth, and environmental sustainability. Education is not just a goal but also a driver of progress across all other SDGs, making it foundational to building a better future for all.
Education for Sustainable Development (ESD) is a concept that evolves in line with emerging sustainability issues. EDS promotes sustainability in curricula worldwide and supports young leaders in implementing localized SDG solutions. In the 2030 Agenda for Sustainable Development, Education for Sustainable Development (ESD) is explicitly recognized as part of SDG 4. It is part of Target 4.7 along with Global Citizenship Education (GCED), which UNESCO promotes as a complementary approach [9]. Therefore, there is a high demand for research to better understand ESD interactions with the 2030 Agenda framework in specific contexts [10]. Not only is it an integral part of sustainable development, it is also a key enabler; this is why education is an essential strategy in the pursuit of the SDGs [8]. The “Green Paper on Citizen Science: Citizen Science for Europe” describes Citizen Science [11] as follows: “Citizen Science refers to the general public’s engagement in scientific research activities when citizens actively contribute to science either with their intellectual effort or surrounding knowledge or with their tools and resources. Participants provide experimental data and facilities for researchers, raise new questions and co-create a new scientific culture. While adding value, volunteers acquire new learning and skills, and a deeper understanding of the scientific work in an appealing way”.
Universities, with their dual roles of furthering scientific knowledge and providing high-quality education to students, are well placed to contribute to sustainable development [12]. The problem we face today is that our current Western culture is both ecologically unsustainable and undesirable, in that it no longer contributes to the net improvement of overall human well-being [13]. The involvement of local people in the projects and their delivery is essential, and the “Community Development” strand of the project includes gaining trust and building local relationships [14]. On an individual level, developing a positive vision of a better life is often the most effective therapy. This is the scenario planning and envisioning can provide at a societal level. In cultural and evolutionary terms, we can produce positive hypothetical symbotypes to speed up and direct the process [15]. There are clear trade-offs and synergies across and within the goals, especially in how the environmental, social, and economic targets interact with one another [16]. Several studies on interactions among the SDGs have been completed [17,18,19,20,21], as have the prioritizations of the SDGs according to different criteria [22,23,24,25].
The European Union has launched the Youth Action Plan in EU External Action for 2022–2027, recognizing that young people are key to achieving the Sustainable Development Goals [26]. In 2016, the Stockholm Resilience Centre presented the so called SDG Wedding Cake (Figure 1). It is a visual representation of the SDGs and represents a tiered cake, with each layer representing a different earth system [27]. The ecology, society, and economics are the three systems that are represented, and each is nested (or embedded) within the others.
Nevertheless, few studies focus directly on a particular sector of the population such as students. Several studies are primarily aimed at higher education students [28,29]. Some of these conduct an exhaustive review of different questionnaires about the awareness of these students on a global scale [30]. However, there are few studies aimed at students in lower educational levels, such as secondary school students.
To fill the current research gap, this study has conducted a questionnaire survey that can be regarded as an effective tool to determine which SDGs are a higher priority. This study is focused on a very specific sector of the population: secondary school students, particularly those between 12 and 18 years of age. The aim of the study is to understand students’ opinions on the importance of the SDGs, based on their participation in educational projects that address these goals. The objectives are as follows: (A) to get to know the opinion of secondary school students on the prioritization of the SDGs; (B) to associate the prioritizations with the level of initial familiarity with the SDGs and the context in which they are worked on; and (C) to associate the prioritizations with the characteristics that define each sample.
To achieve the objectives, two groups of students were involved: a pilot test with students participating in the Young Talent FORUM of Catalonia and a larger group of students participating in the Forest and Sustainability Project. In the first case, the participants worked in detail on all the SDGs, with a particular focus on the sustainable use of natural resources. In the second case, the focus was primarily on SDG 15, SDG 6, SDG 7, SDG 12, and SDG 13, with indirect work on SDG 3, SDG 1, SDG 5, SDG 10, and SDG 11. Figure 2 outlines a framework of how the study has been structured.
In both cases, these educational projects aim to raise awareness and educate young people on issues related to the 2030 Agenda and the SDGs. For this reason, once the students have completed their participation in the project, they are asked to prioritize the five SDGs they consider most important. Understanding how students prioritize Sustainable Development Goals (SDGs) offers several benefits and has implications for a variety of stakeholders. In summary, understanding students’ SDG priorities provides actionable insights that benefit education, policy, and sustainability initiatives, helping align efforts with the aspirations and values of the next generation.

2. Materials and Methods
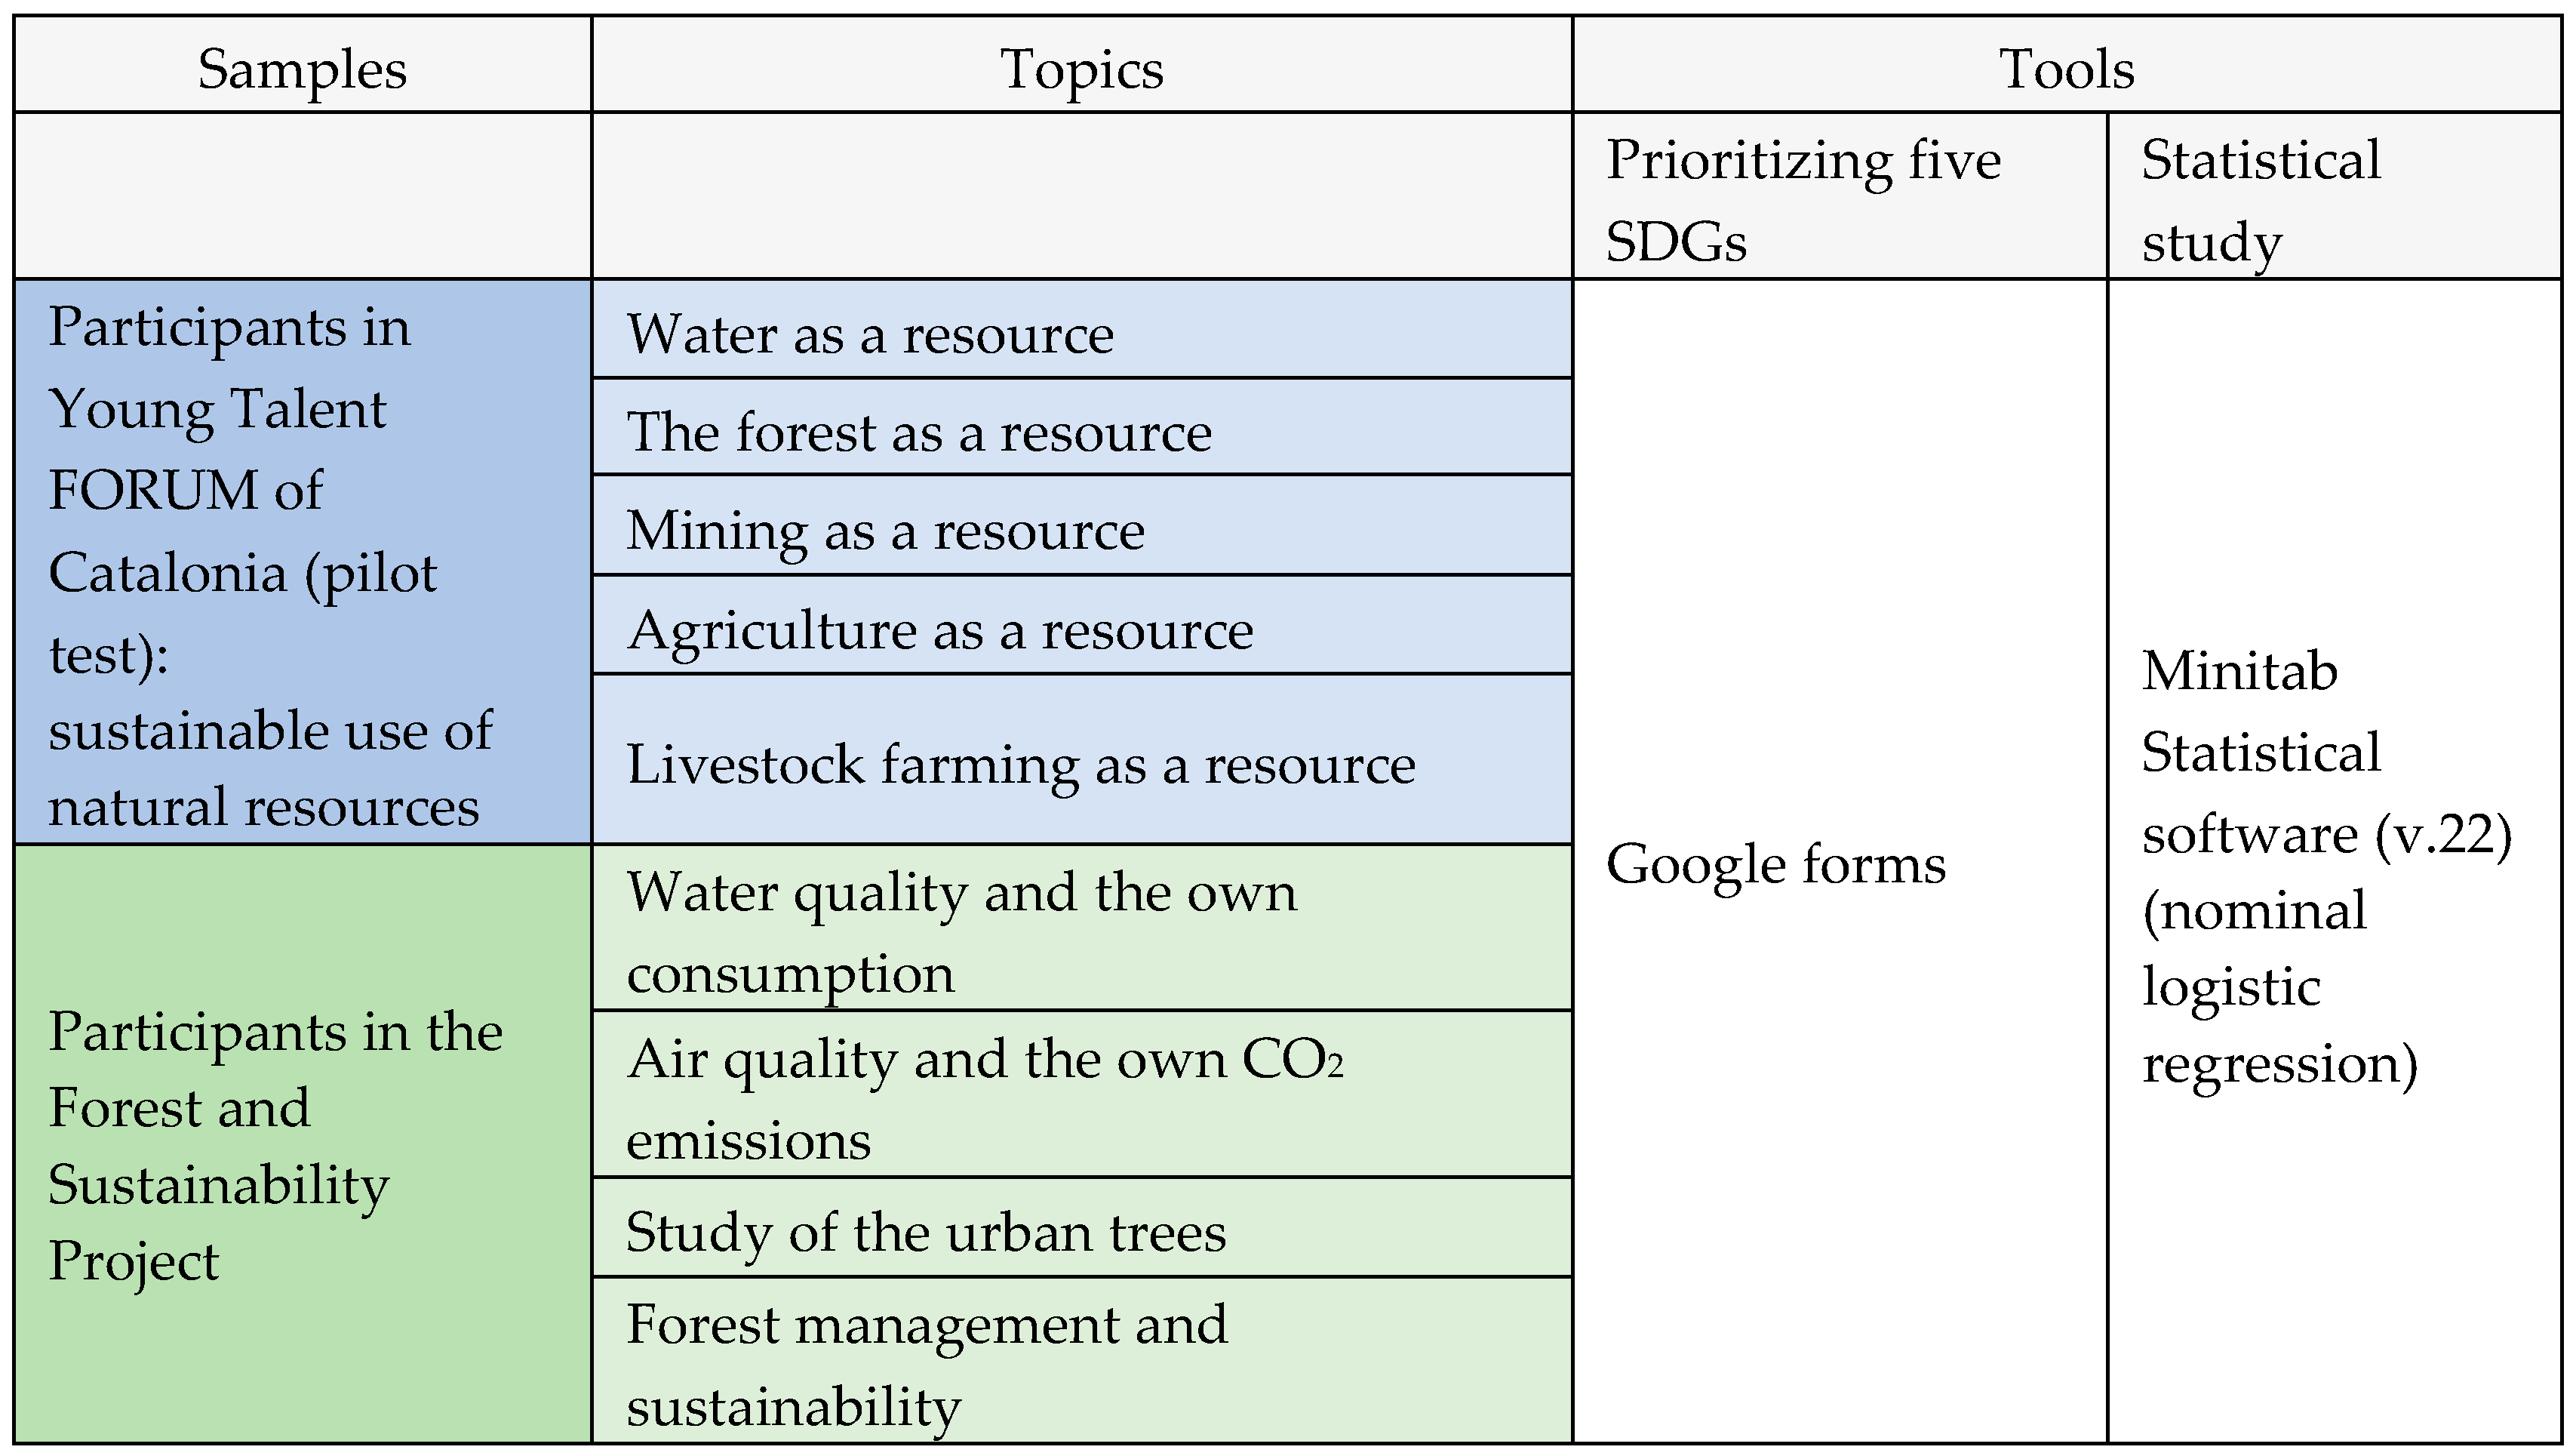
This study was developed within the framework of Forest and Sustainability, a project designed for secondary schools in Catalonia. The Forest and Sustainability Project (FSP) seeks to raise awareness about the need for a global change towards sustainability, using forests and the need for sustainable forest management as a guiding thread.
Participants also have the opportunity to learn about the importance of their role in society. To this end, students are placed at the center of global change; nevertheless, they still need the resources and knowledge to critically analyze information and associate the course content with the Sustainable Development Goals.
The goal of the project is to promote the SDGs using the environmental impact of our actions in forests as a guiding thread. Although the key SDGs are 4 and 15, these are used as a path to the others—particularly SDGs 6 and 13.
The objective is for young participants to become aware of their power to change the world on an individual and collective level within the context of society as a whole. The project has grown thanks to a real process of co-creation with the teachers of the secondary school participants, and it is an example of Citizen Science and Open Science Schooling with different stakeholders involved [31]. Several documents were needed to make the project possible; specifically, six Interactive Activity Documents with a common esthetic to show that they were all part of the same project (resulting in consistency, as the interaction design indicates (IxD)). The user interface (UI) design is used because it has been very important the visual design of the documents, namely choosing colors, typography, icons, and images to create an appealing interface, and the interactive elements, such as designing buttons, forms, and other components that users interact with. In Figure 3, an example of the interactive activity document related to the study of water is shown.
The students study the water and air quality in their area and realize that their daily water and energy consumption—including electricity, heating, and transport—has a big impact and can be reduced with a simple change in habits. Using the data collected, they can evaluate whether there are sufficient green spaces nearby and assess the level of pollution they are exposed to (relationship with the forest). Participation in the project means that students ask themselves questions which they alone cannot answer, and this forces them to interact with the community: family, public administration, companies, etc. In this sense, it is an interactive learning project because it uses various tools and methods to create a dynamic learning environment as engagement, such as encouraging students to take an active role through discussions and hands-on activities, or social learning, namely promoting collaboration and communication among students, fostering a community of practice with different stakeholders.
Participants submit their results through Google Forms questionnaires and, at the same time, receive a copy of their own responses (feedback). This allows them to work more effectively in the classroom, as they can review their contributions and reflect on them during discussions or group activities. Additionally, having access to their responses facilitates tracking their ideas and developing projects related to the SDGs.
Once the project is completed, students can prioritize the five Sustainable Development Goals (SDG) that are most important from their perspective. The study presented in this article is based on surveys with participants of different age groups, resulting in a total of 1106 participants.
This study sought the highest possible diversity in terms of age, interest, and geographic distribution—with students from urban and rural areas—as well as the socioeconomic and cultural differences in the regions where the participating schools are located.

2.1. Study Samples

The first part of this study is based on one pilot test: the group of young participants took part in the fifth edition of the Young Talent Forum of Catalonia, where the central theme was “Sustainable use of natural resources”. This non-formal educational project sought to recognize fourth-year secondary school and first-year Baccalaureate students from Catalonia with the highest marks. The 40 students who took part were between 15 and 17 years of age and came from secondary schools across Catalonia. During the 4 days of the Forum, participants completed activities related to the central theme. They were also encouraged to attend a conference on the SDGs with the Director of the Advisory Council for the Sustainable Development of Catalonia, who provided them with an even deeper knowledge of the subject.
Therefore, most of the responses used here are from students that took part in the Forest and Sustainability Project. This provided a total of 1106 samples that will be evaluated in this article. Participating schools were categorized either as “rural” or “urban”, depending on the number of inhabitants in the municipality where they are located. Students’ responses were classified by educational level: low level (first and second year of secondary school), medium level (third and fourth year of secondary school), and high level (baccalaureate and professional training). Participants’ gender (female, male) was also taken into account (Table 1). The total of validated samples was 1051.

2.2. Data Collection Tools

In all cases, young people were presented with a questionnaire where they were first asked for general information: school of origin, school year, and gender (female, male, non-binary). Next, they are asked to select the five SDGs that they find most relevant and place them in order of priority.
The questionnaire is in a Google Forms format where users are asked to choose one of the SDGs as most important (first) and to continue selecting SDGs they deem important until they have ranked a total of five.

2.3. Tools for Evaluating the Results Obtained

Due to the high number of samples, several graphs were created showing the results of the pilot test and of the set as a whole. To obtain additional information on the trends in the responses of the full group of participants, the program Minitab Statistical Software was used. The typology of available samples led to the use of nominal logistic regression. Minitab Statistical Software (v.22) can be used to examine data and discover trends, find and predict patterns, discover hidden relationships between variables, and create very useful visualizations when it comes to extracting as much information as possible from the study data. One of the tools used is nominal logistic regression, making it possible to model the relationship between a set of predictors and a nominal response. Several concepts must be considered to correctly interpret the information Minitab provides when using this type of regression. This method is used in many scientific fields, such as medicine [32], environmental health [33], or educational topics [34], to name a few.
First, it should be noted that throughout this study, a confidence level of 95% or, in other terms, a significance level of α = 0.05 was used. This means that when conducting the hypothesis test, the risk of rejecting the null hypothesis when it is true is 5%. The program provides a p-value that we must contrast with the significance level α. When p < α, we can conclude that there is a statistically significant association between the response variable and the term. Otherwise, when p ≥ α, it is not possible to guarantee that there is a significant association and, consequently, the null hypothesis is accepted.
If the model does not fit the data, the results may not be reliable. An adequate model is one where the p-values are greater than the significance level α in the goodness-of-fit tests. This condition indicates that there is not enough evidence to assert that the model does not fit the data or, in other words, the null hypothesis is accepted. The test that all slopes are zero indicates whether the model is or is not significant. If p < α, the slopes are different from zero and the model can be considered appropriate. The odds ratio compares the probabilities of different outcomes. The probabilities of an outcome are defined as the probability of the comparison outcome occurring divided by the probability of the reference outcome occurring. Odds ratios that are greater than 1 indicate that the comparison outcome is more probable when the categorical predictor changes from the reference level to the comparison level. Odds ratios of less than 1 indicate that the comparison outcome is less likely compared to the reference outcome when the categorical predictor changes from the reference level to the comparison level.

3. Results

Figure 4 shows the prioritization of the 17 ODS as a result of the analysis of all the samples that were included in the study, with a total of 1106 participants. The three SDGs with the highest score are SDG 1 (No Poverty), with SDG 2 in second place (Zero Hunger), SDG 3 (Good Health and Well-Being) in third place, SDG 5 (Gender Equality) in fourth place, and SDG 16 (Peace, Justice, and Strong Institutions) in fifth place.
The analysis of the results obtained is presented using two sections: first, the samples of the pilot test, and then the results of the set of responses. For this analysis, the characteristics of the different samples were compared.

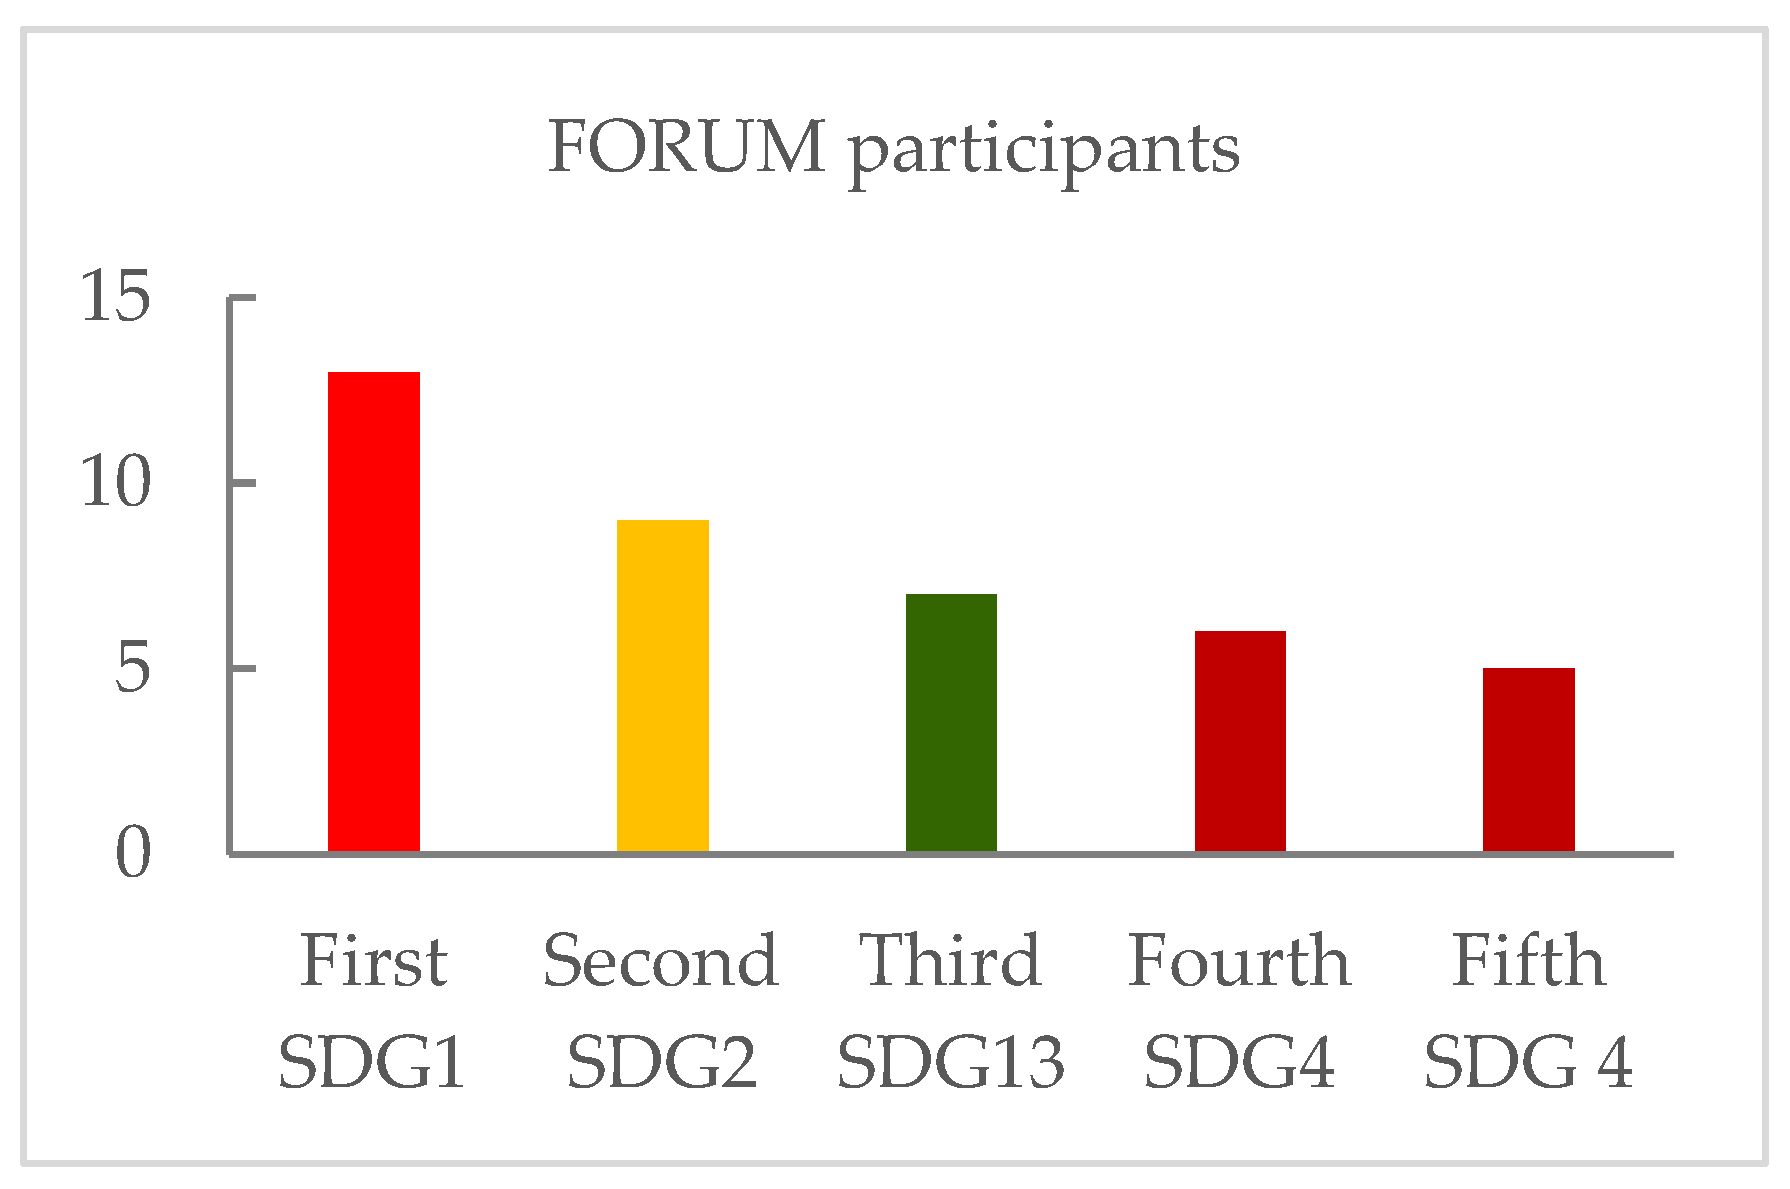
3.1. SDG Prioritization with Young Talent Forum Students

Figure 5 shows the graph from a study sample of participating secondary school students of the Young Talent Forum of Catalonia.
The results from the sample show a similar distribution of votes: the option in first place is valued much more highly than the rest, and the last three options are in similar amounts.
In the votes by participants in the Young Talent Forum of Catalonia, SDG 1 (No Poverty) came in first, SDG 2 (Zero Hunger) came in second, SDG 13 (Climate Action) came in third, and SDG 4 (Quality Education) came in fourth and fifth place. These participants already had a broad knowledge of the SDGs, since the main theme of the 2019 edition was “Sustainable use of natural resources”.
Figure 6 shows the distribution of votes from all participants.

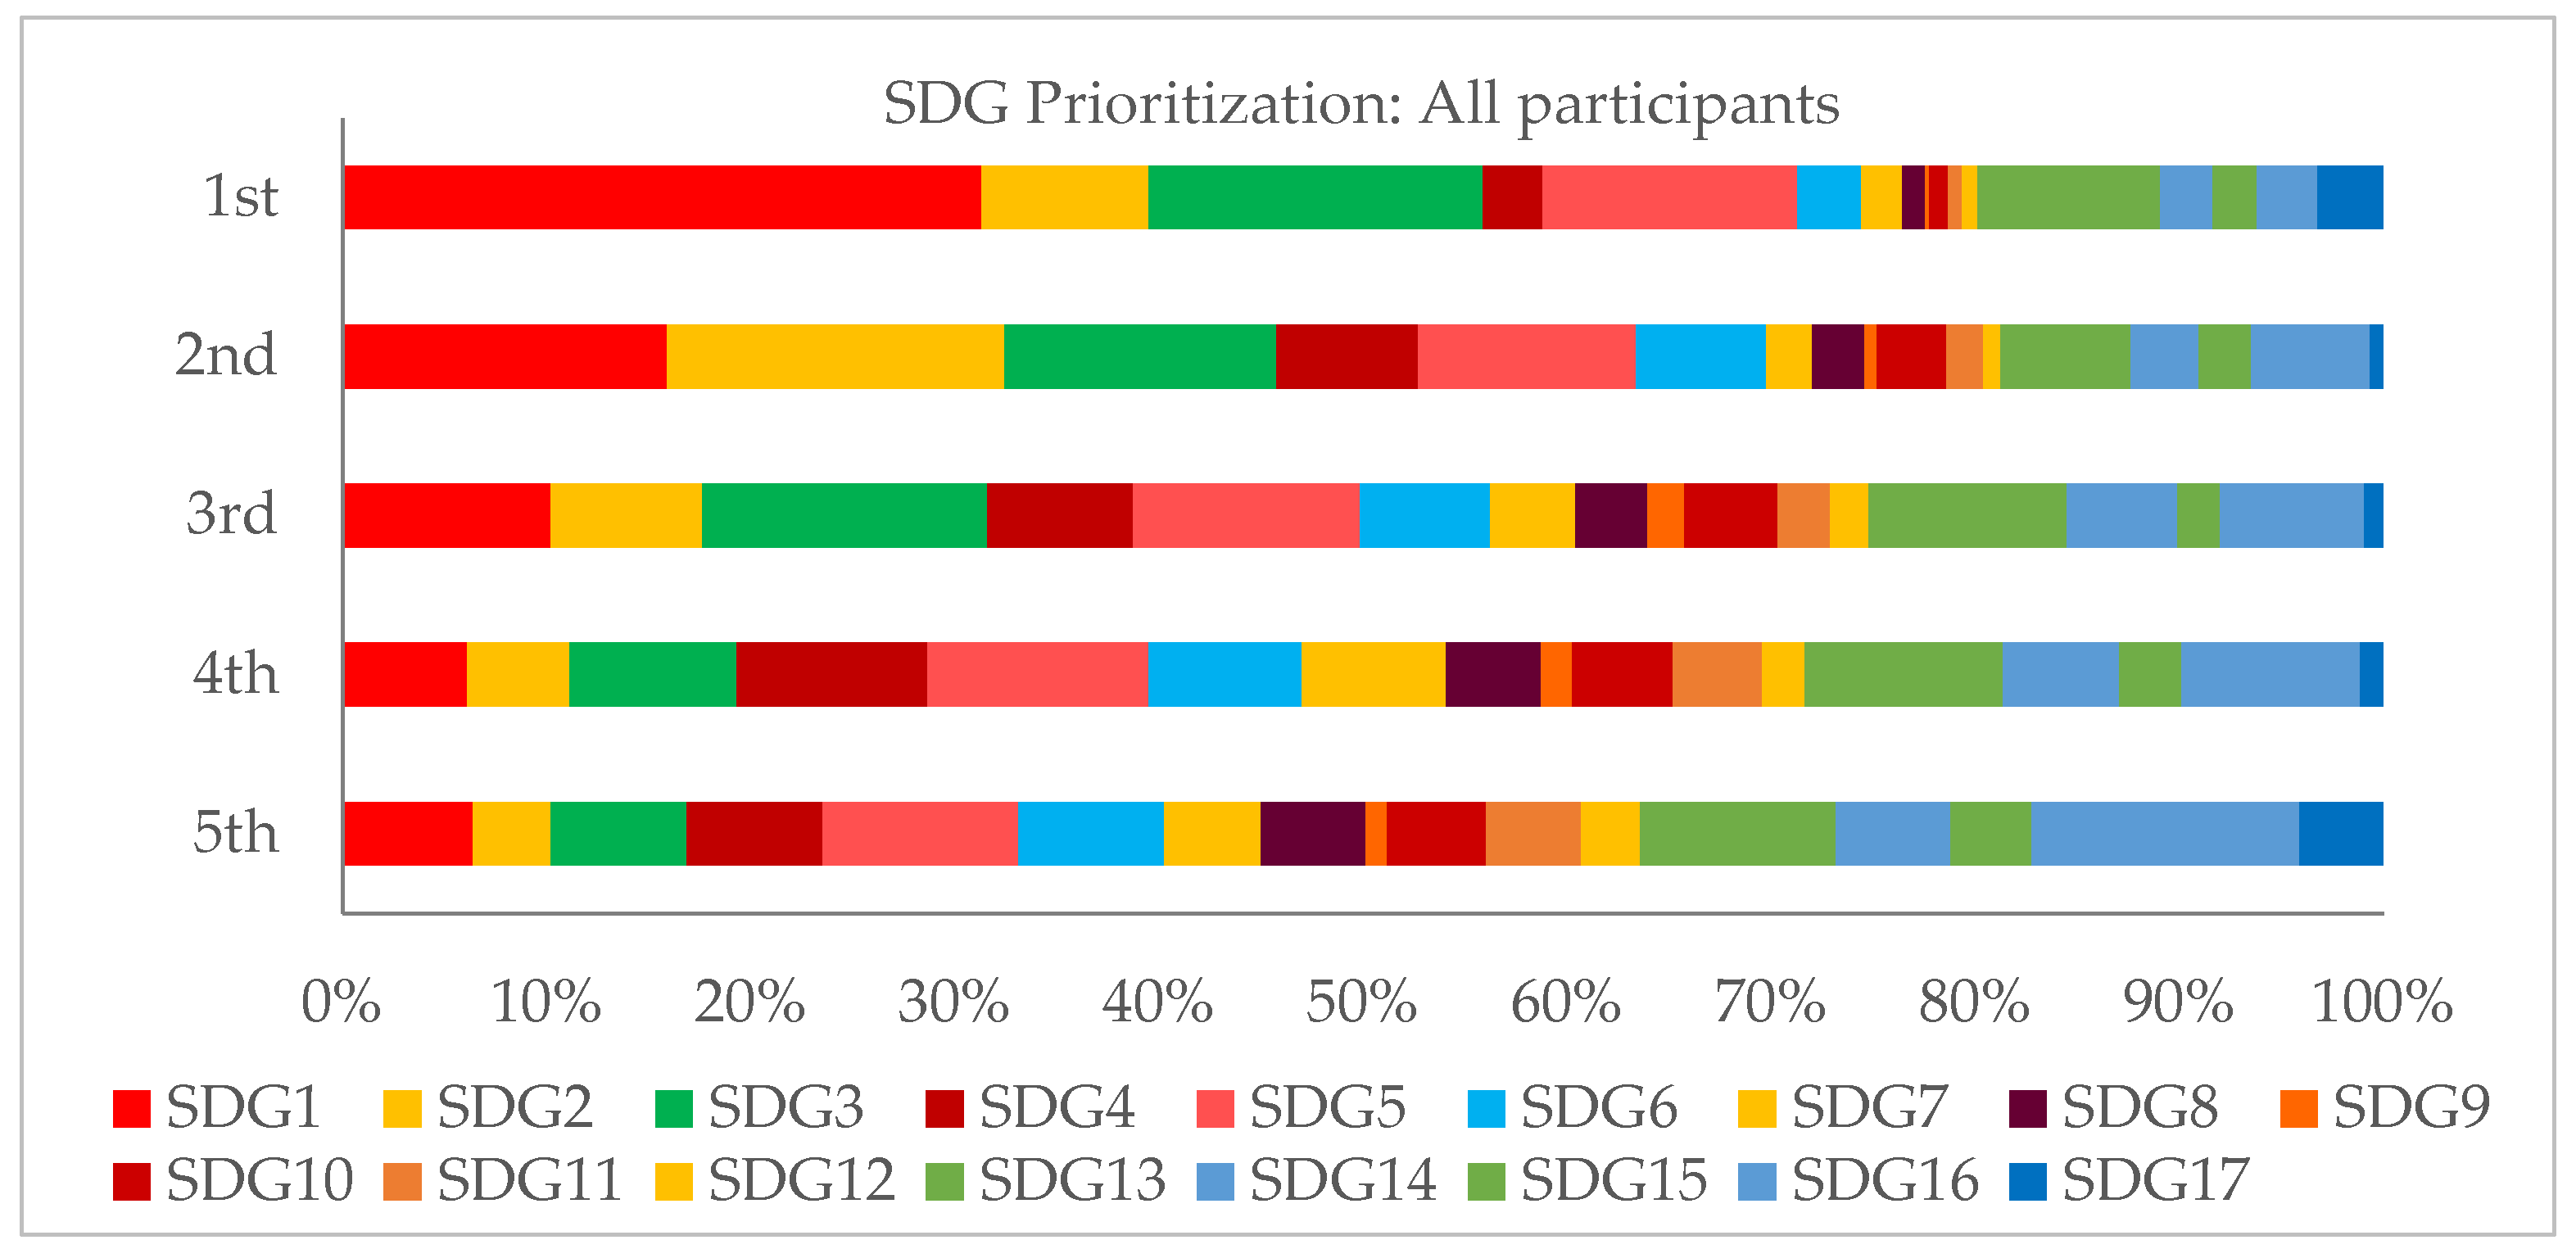
3.2. SDG Prioritization with All Responses

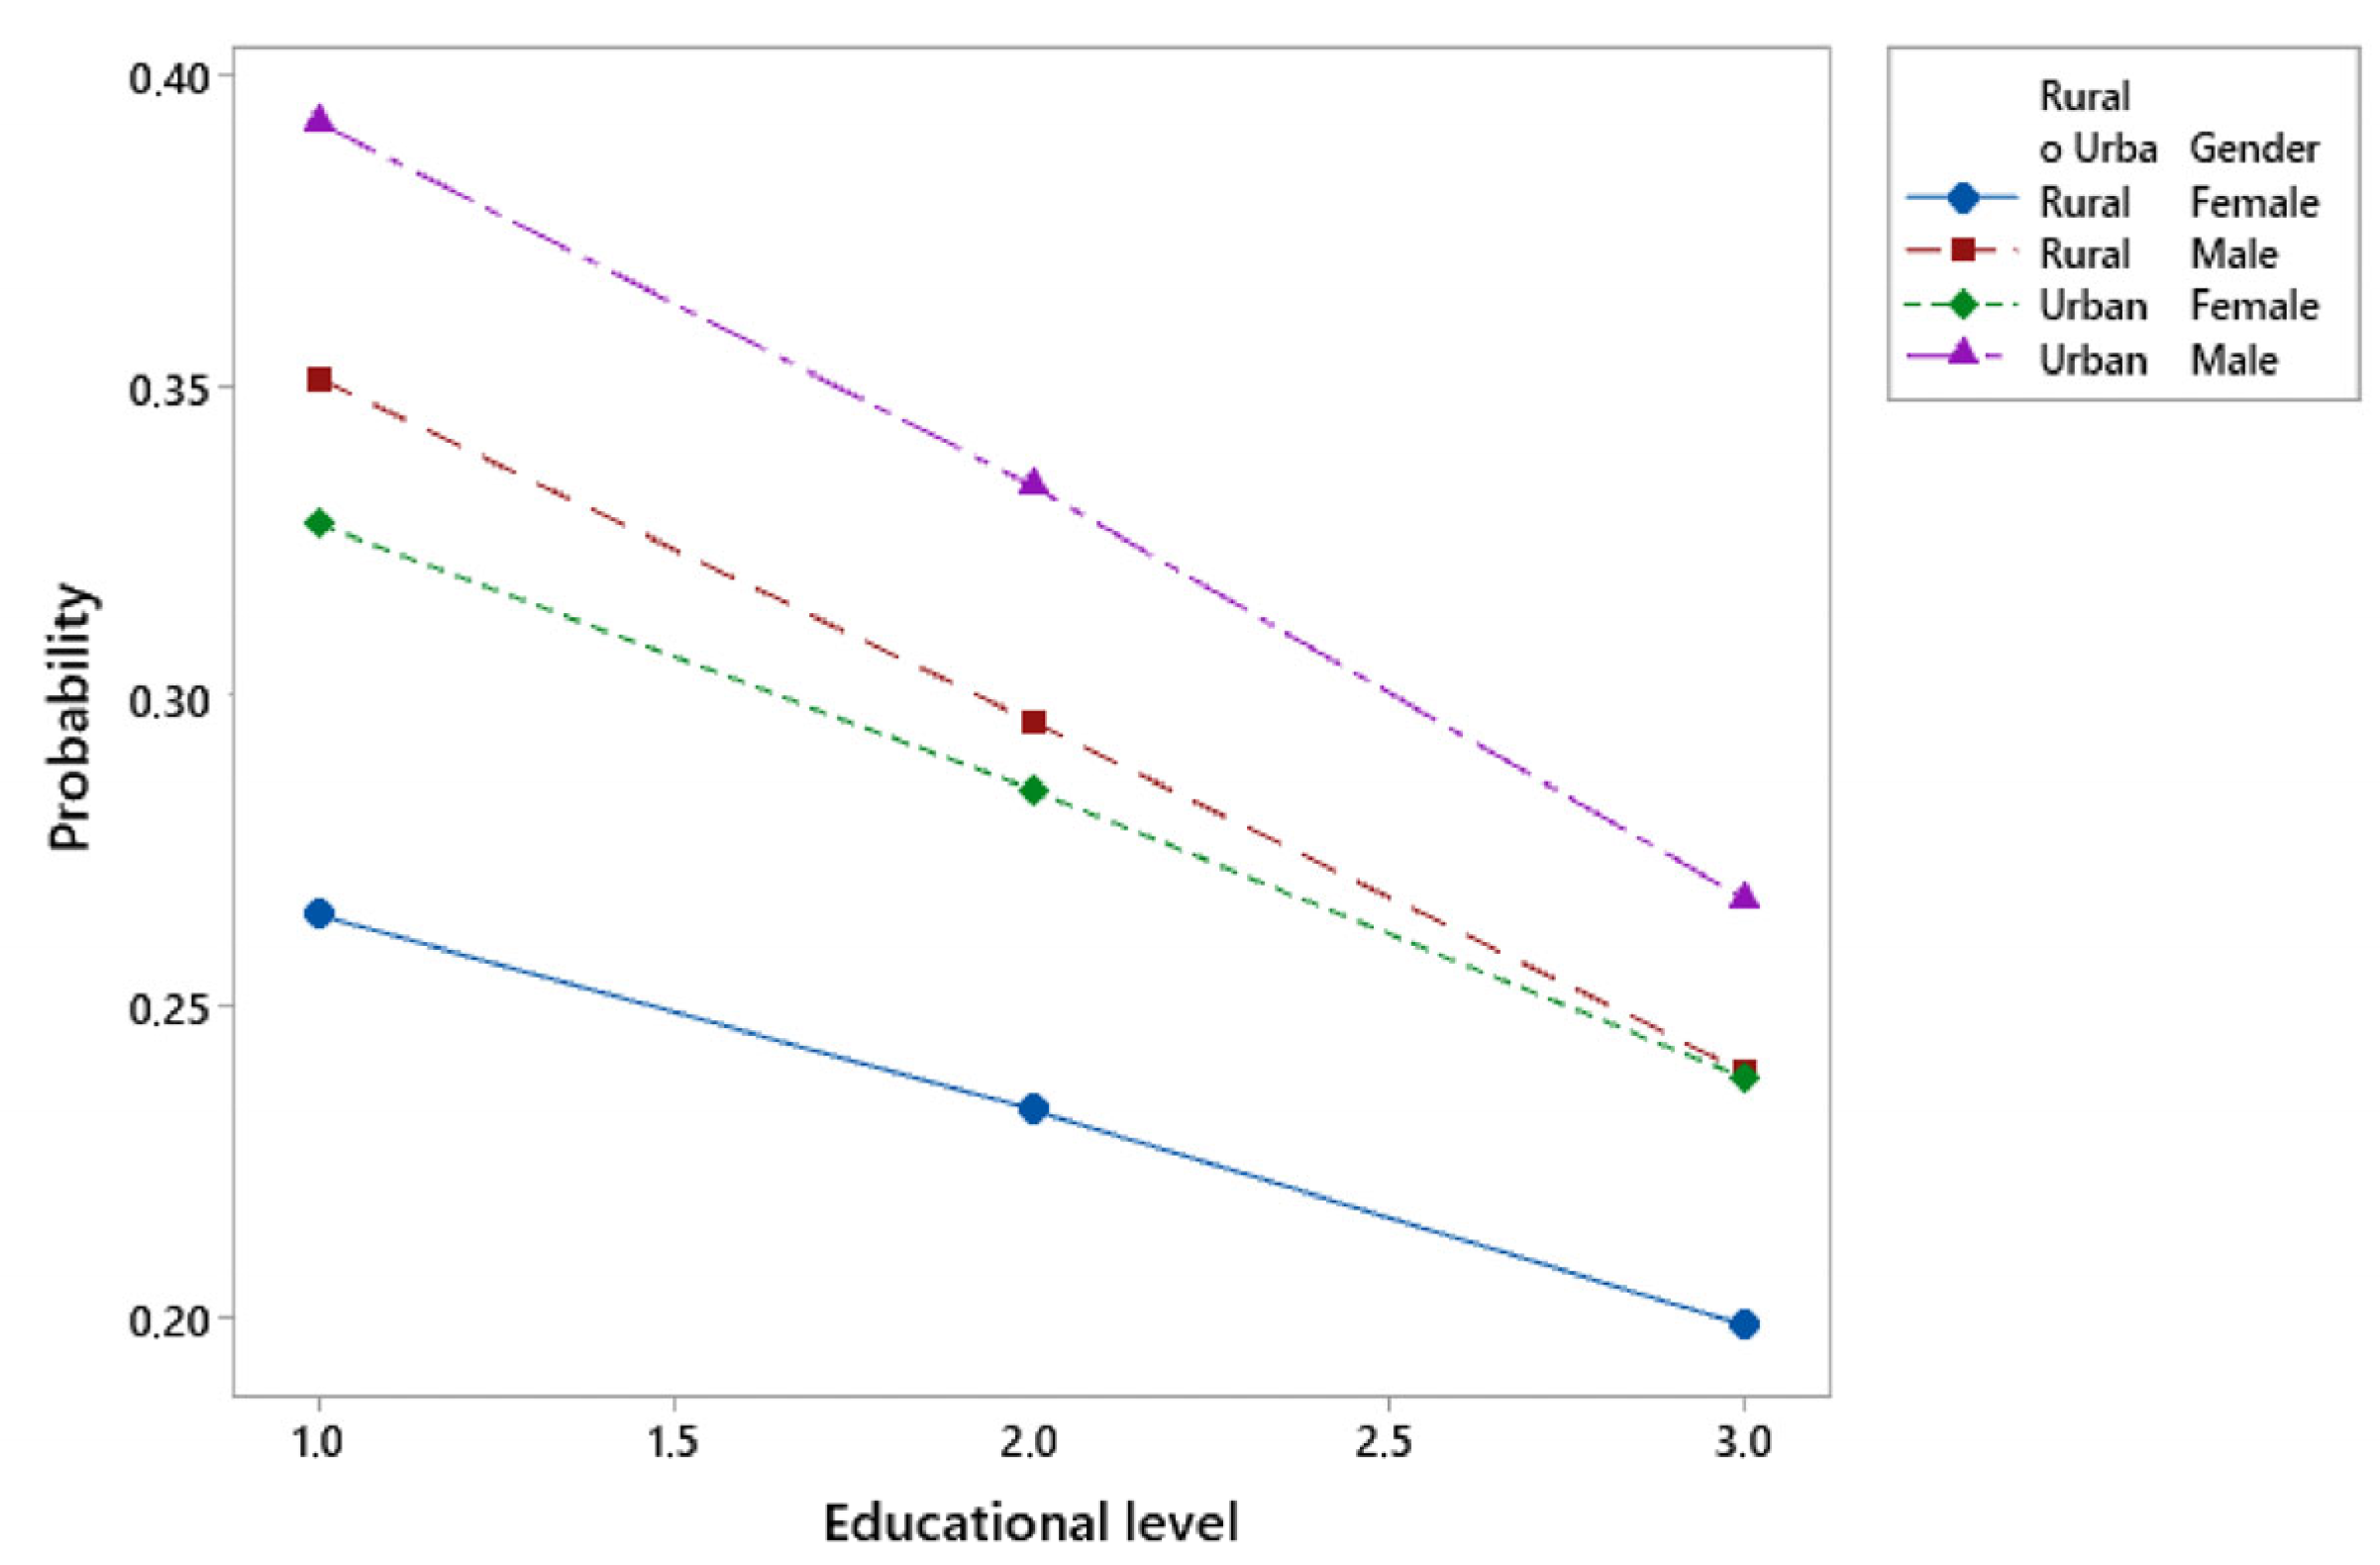
3.2.1. Study Conducted on First-Choice Responses

A study of first-choice responses was conducted using nominal logistic regression. The most frequently selected response was SDG 1, followed by SDG 3, SDG 5, and SDG 13, with SDG 2 in fifth place (see Figure 6). Below is a portion of the results obtained. Table 2 shows the results for these fourth SDGs voted in relation to SDG 1.
In this case, SDG 1 was taken as the reference response, since it was the most voted, and from here, Table 3 shows a comparison of each SDG with SDG 1, where GL represents the degrees of freedom.
Since α > p, the slopes are different from 0, and the model is significant.
Looking at the goodness-of-fit test of the Chi-square test (Table 4) using Pearson’s method, it can be observed that p = 0.771 > α, which ensures that the model fits well. As explained in Section 2.3 of the methodology, it is important to consider the odds ratio. To better understand this, an example from the case study will be considered. When examining Logit 2 (see Table 2), the comparison outcome is SDG 16, and the reference outcome is SDG 1. The odds ratio according to gender is 2.38, which is greater than 1. When the gender changes from “Male” to “Female”, the odds of a student choosing SDG 16 are 2.38 times higher than the odds of them choosing SDG 1.
Therefore, considering that the most frequently chosen SDGs will be discussed, with the performed regression, it can be said that:
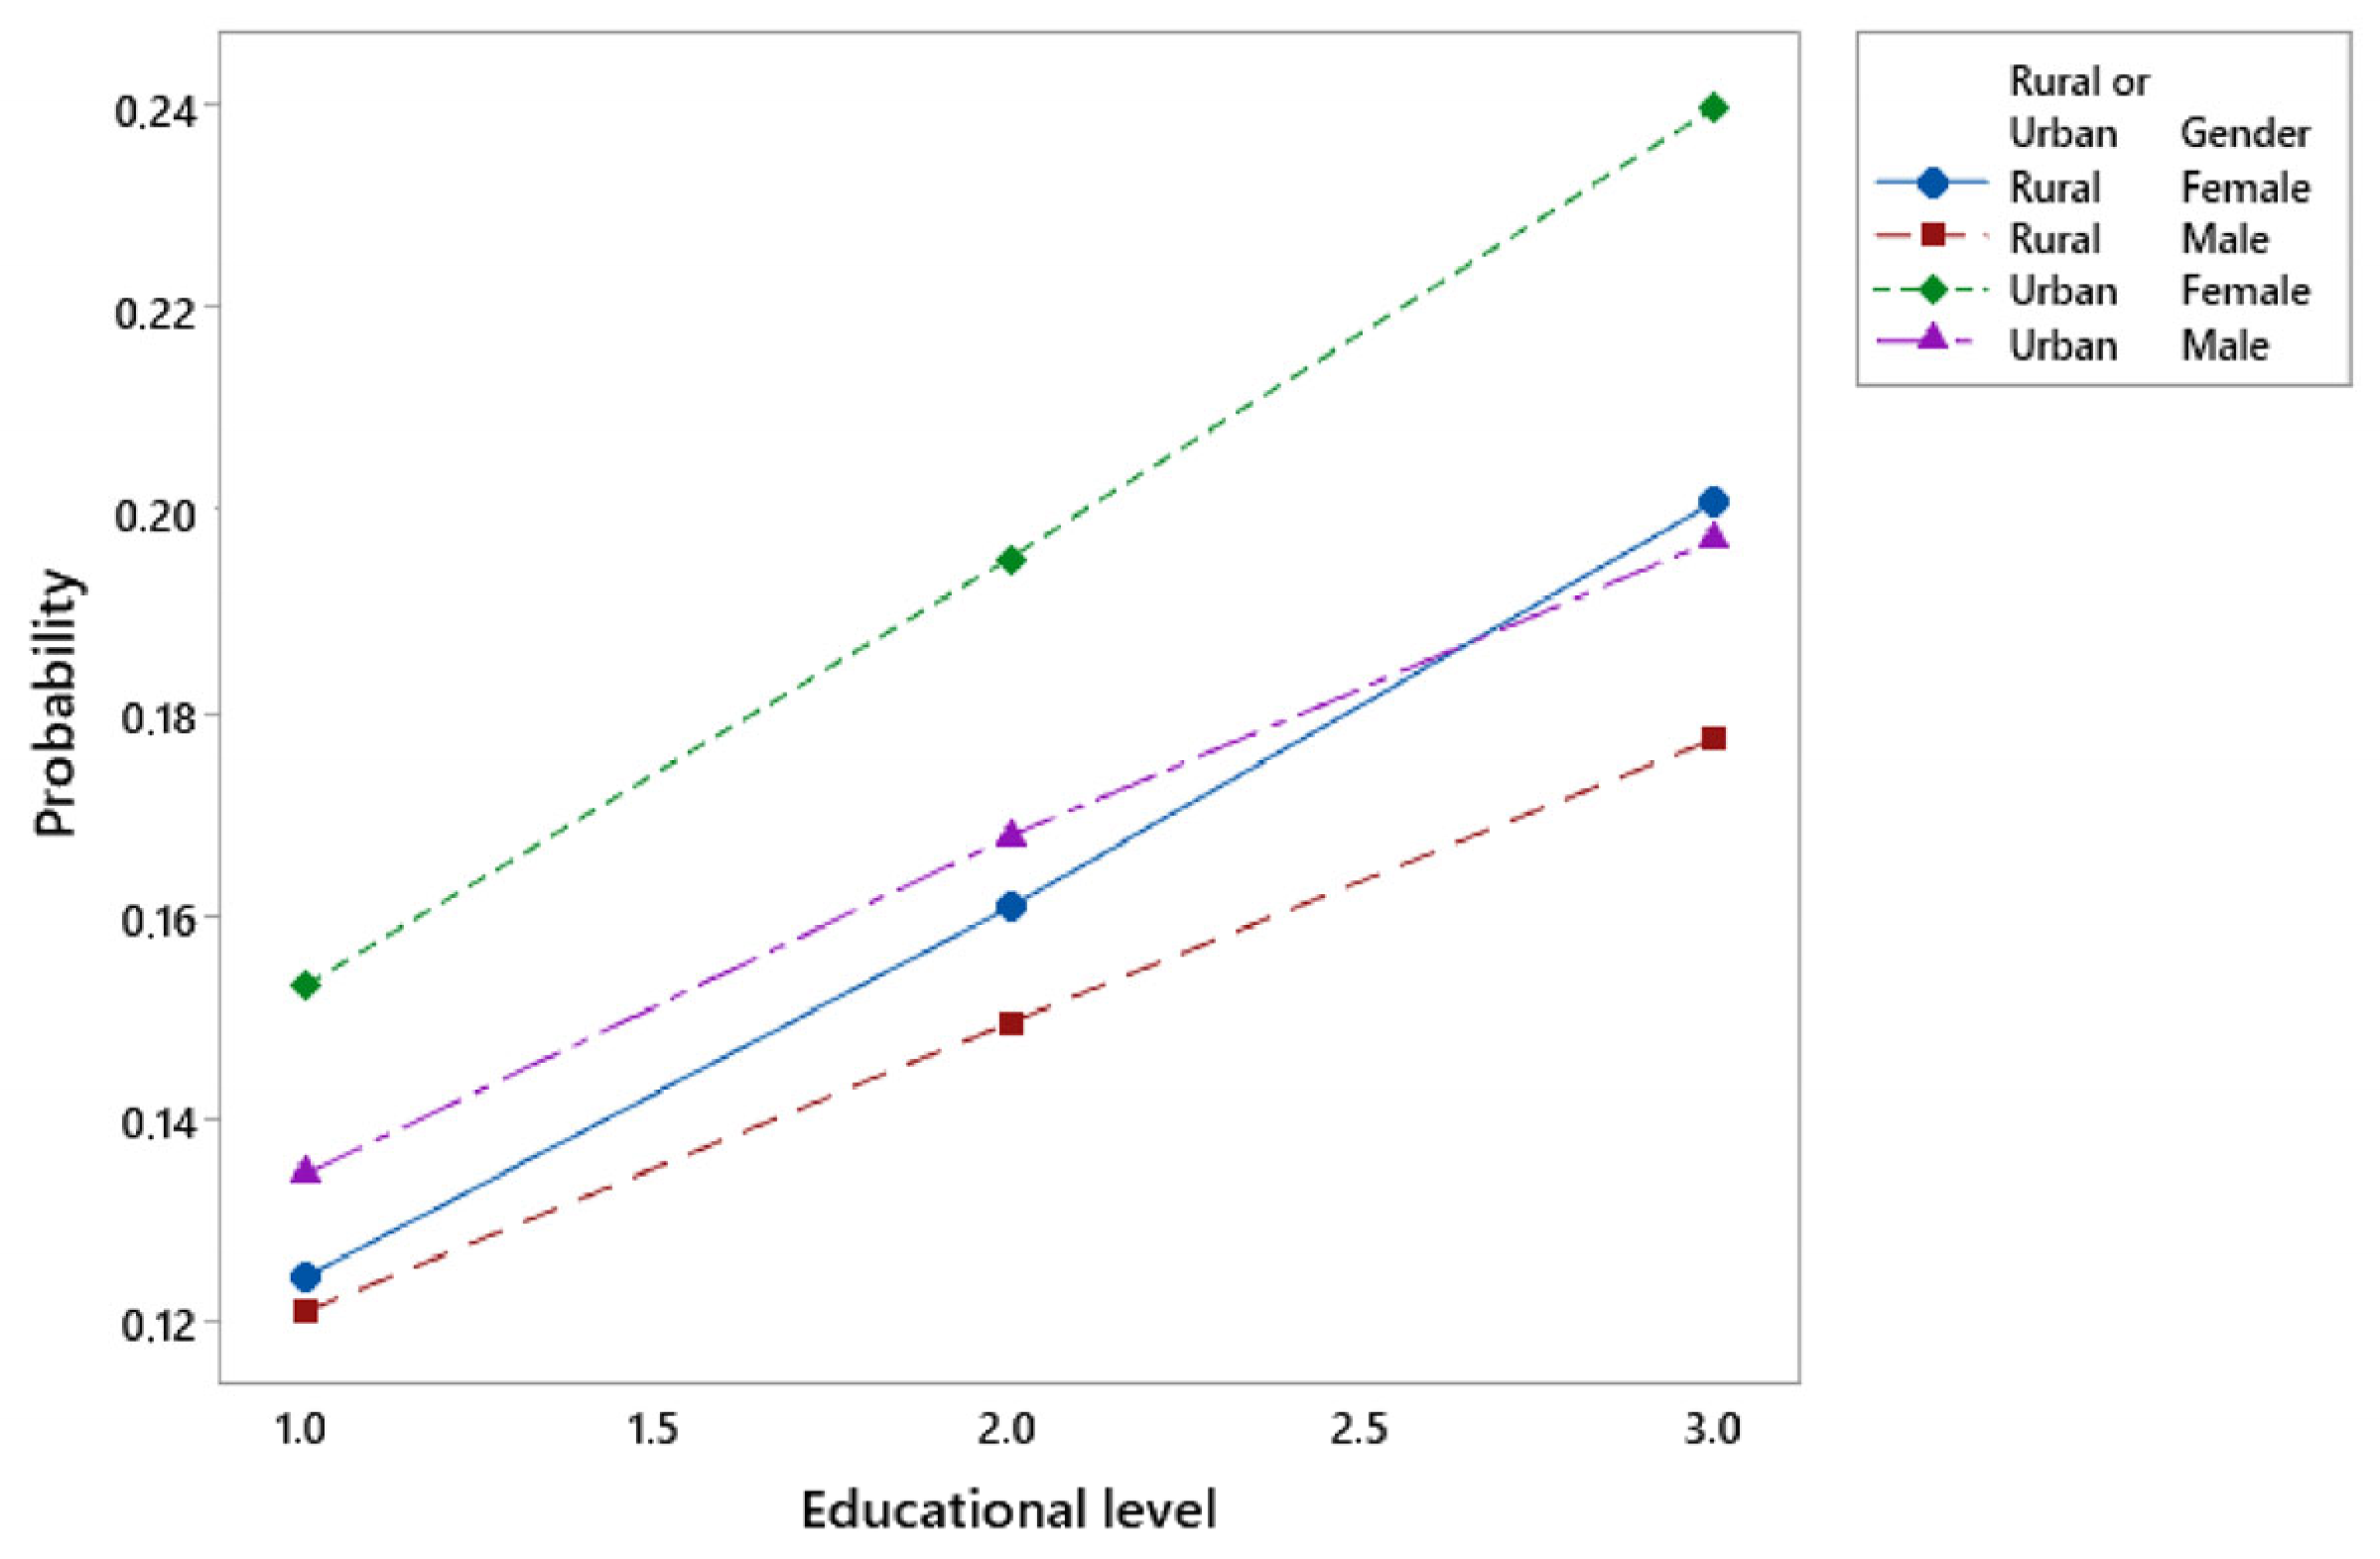
If the person is from a rural area, they are 1.01 times more likely to choose SDG 3 than SDG 1.
If the person is from an urban area, they are 0.99 times less likely to choose SDG 3 than SDG 1. Multiplying by a number of less than 1 means that the probability decreases; therefore, they are more likely to choose SDG 1 than SDG 3.
If the person is female, they are 1.36 times more likely to choose SDG 3 than SDG 1.
If the person is male, they are 0.73 times less likely to choose SDG 3 than SDG 1.
In terms of educational level, for each additional educational level, the probability of the person choosing SDG 3 is 1.47 times higher than SDG 1.
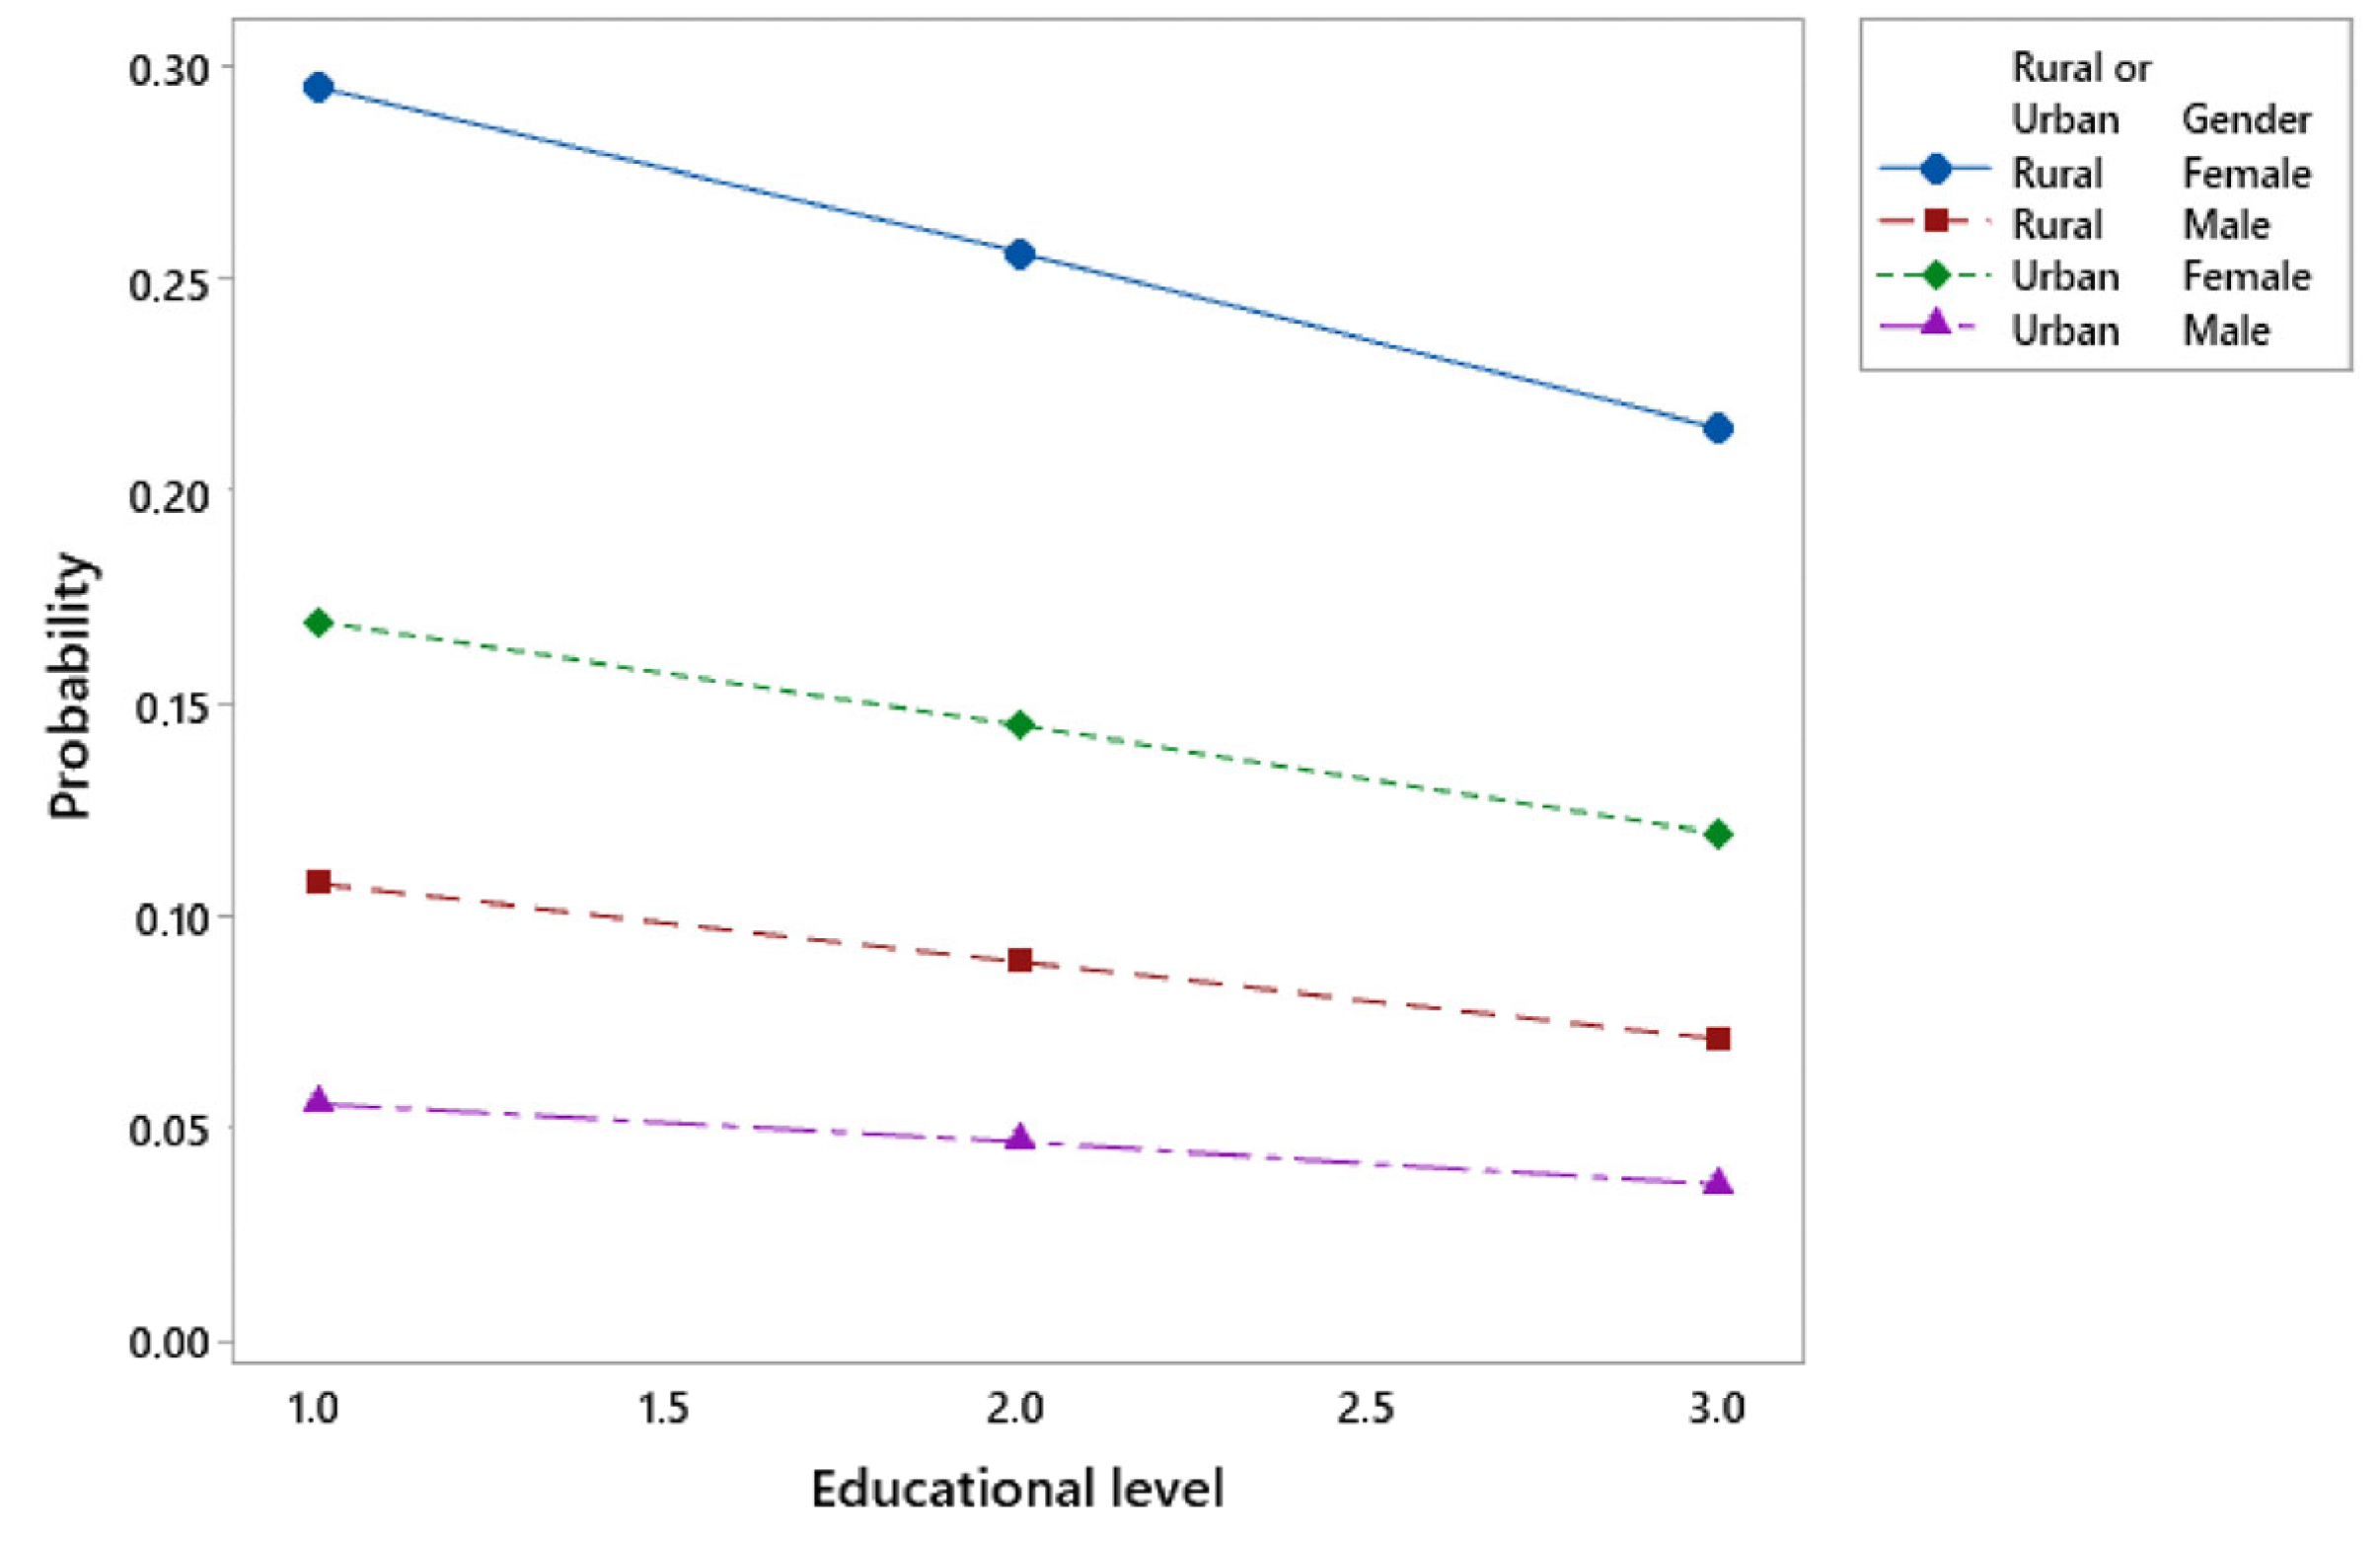
If the person is from a rural area, they are 2.16 times more likely to choose SDG 5 than SDG 1.
If the person is from an urban area, they are 0.46 times less likely to choose SDG 5 than SDG 1.
If the person is female, they are 3.63 times more likely to choose SDG 5 than SDG 1.
If the person is male, they are 0.28 times less likely to choose SDG 5 than SDG 1.
In terms of educational level, for each additional educational level, the probability of the person choosing SDG 5 is 0.98 times lower than SDG 1.
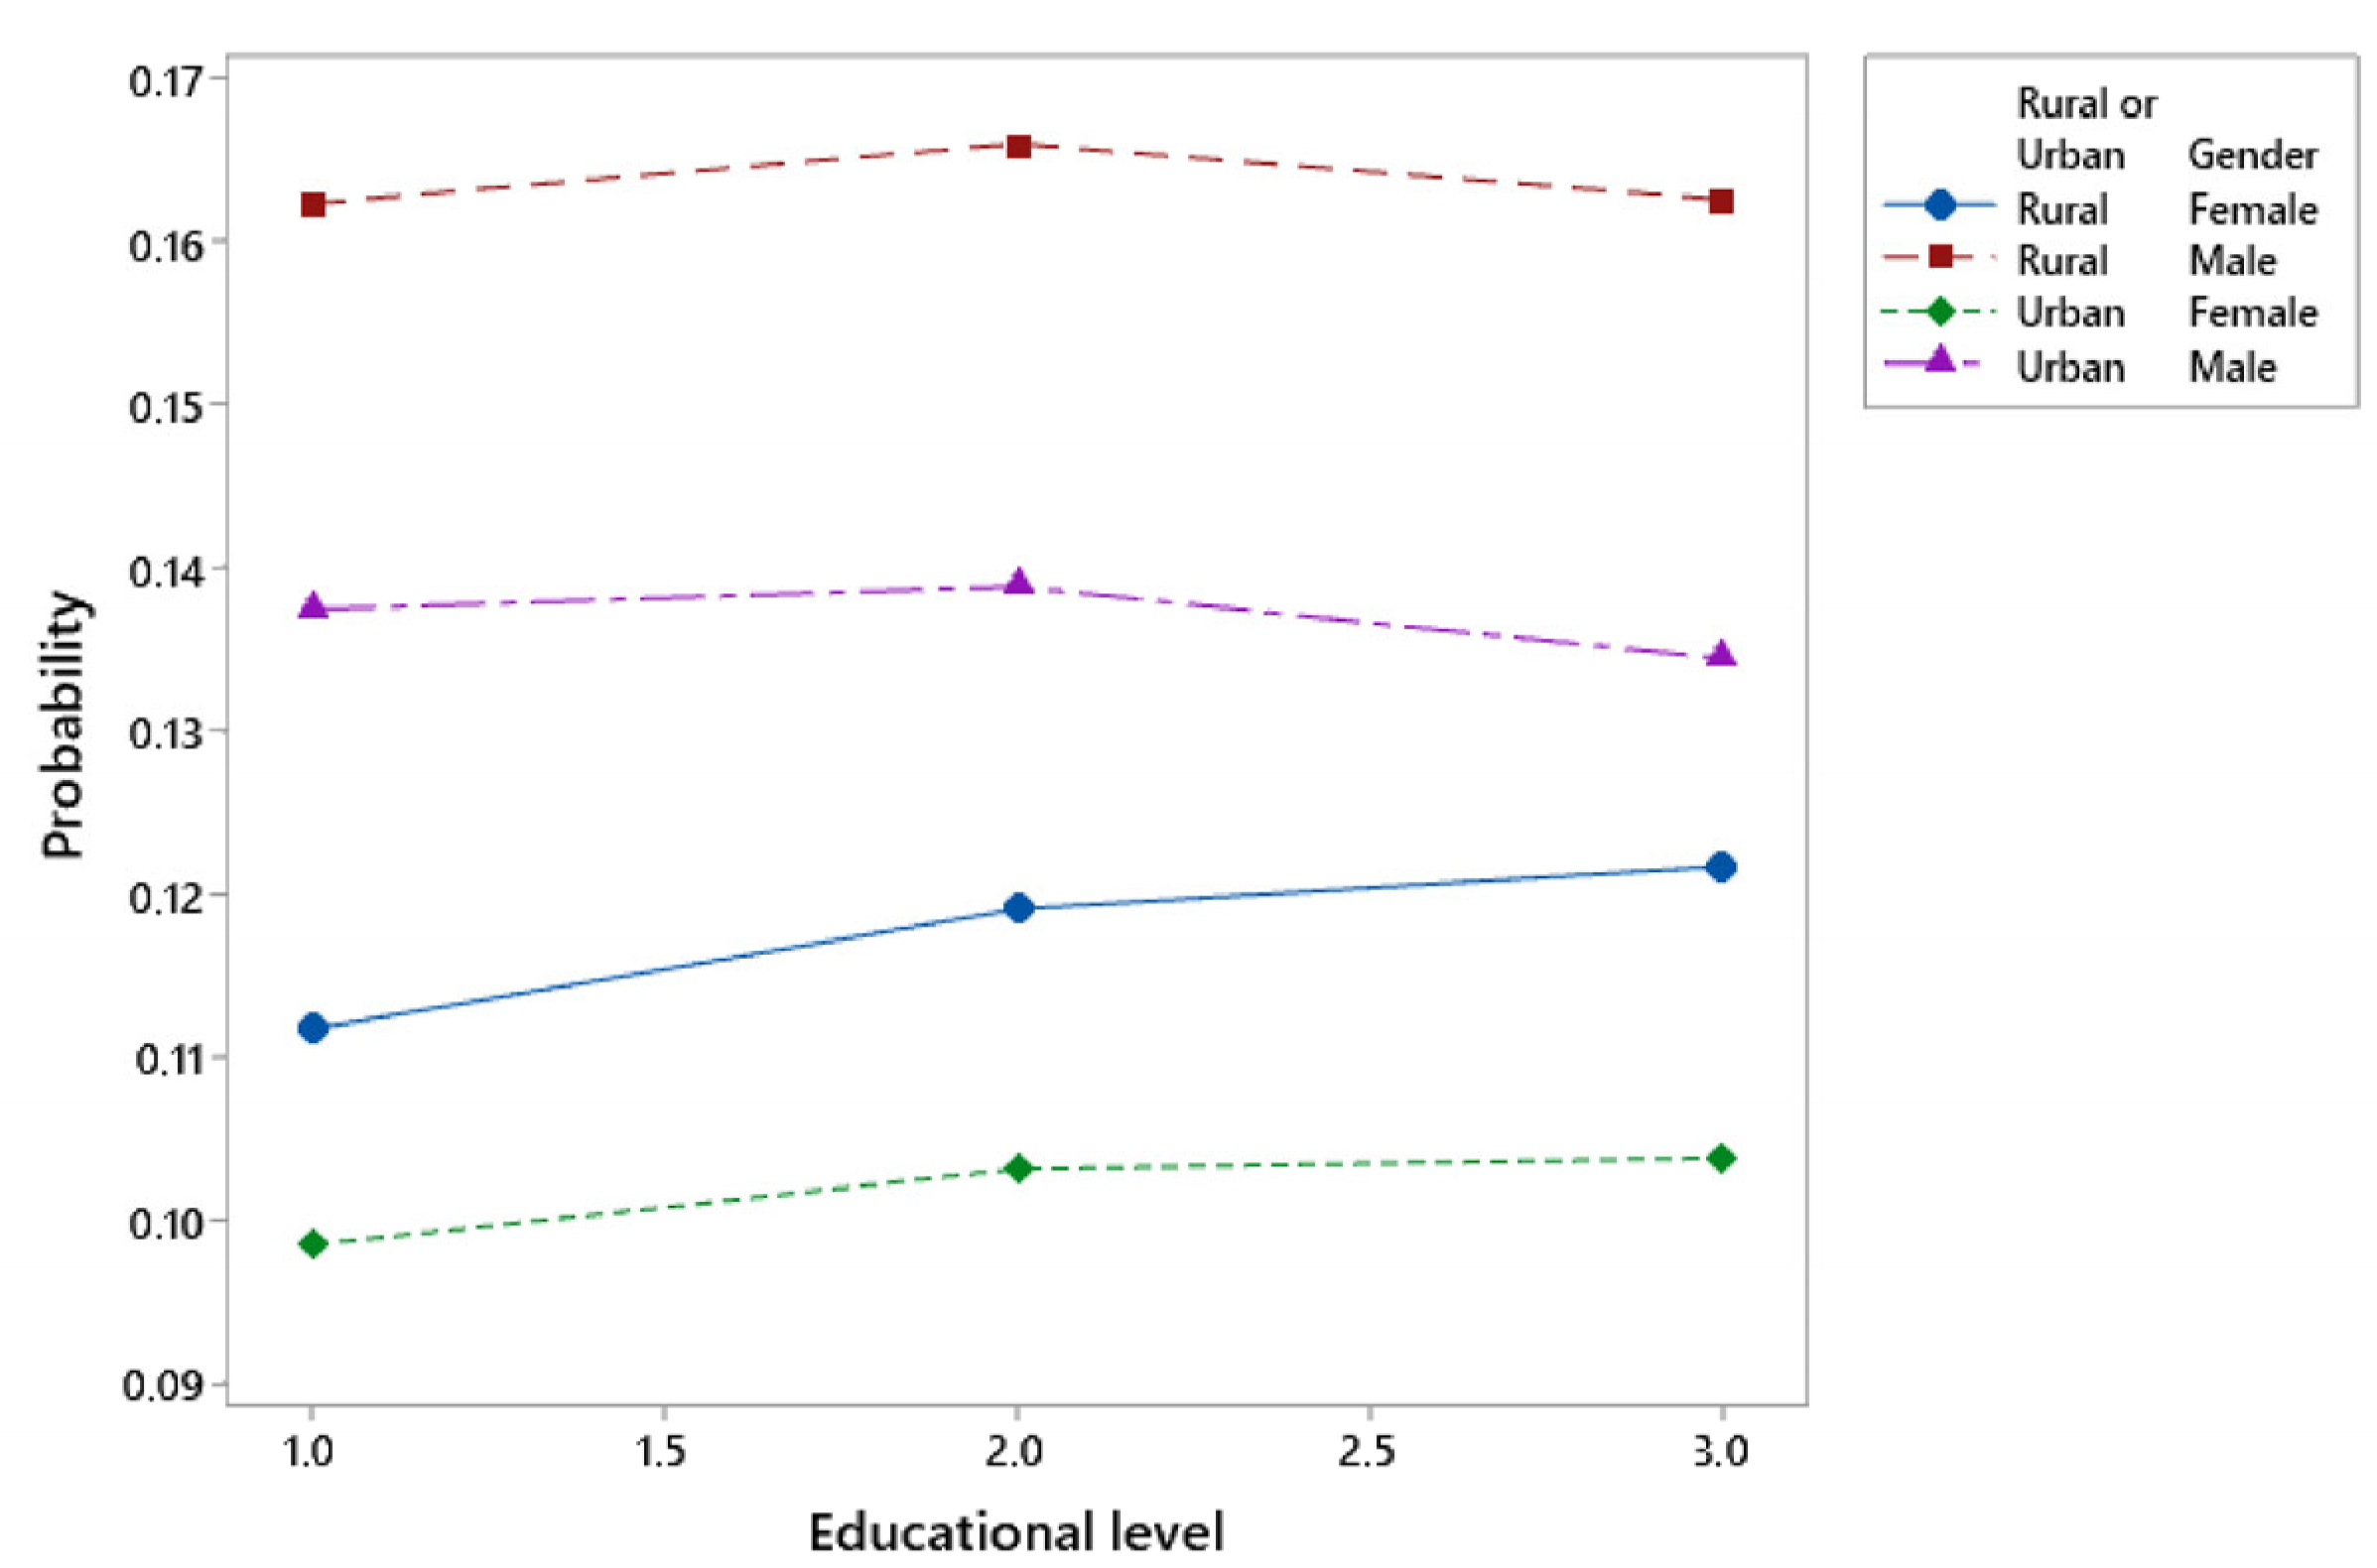
If the person is from a rural area, they are 1.18 times more likely to choose SDG 13 than SDG 1.
If the person is from an urban area, they are 0.85 times less likely to choose SDG 13 than SDG 1.
If the person is female, they are 1.25 times more likely to choose SDG 13 than SDG 1.
If the person is male, they are 0.80 times less likely to choose SDG 13 than SDG 1.
In terms of educational level, for each additional educational level, they are 1.35 times more likely to choose SDG 13 than SDG 1.
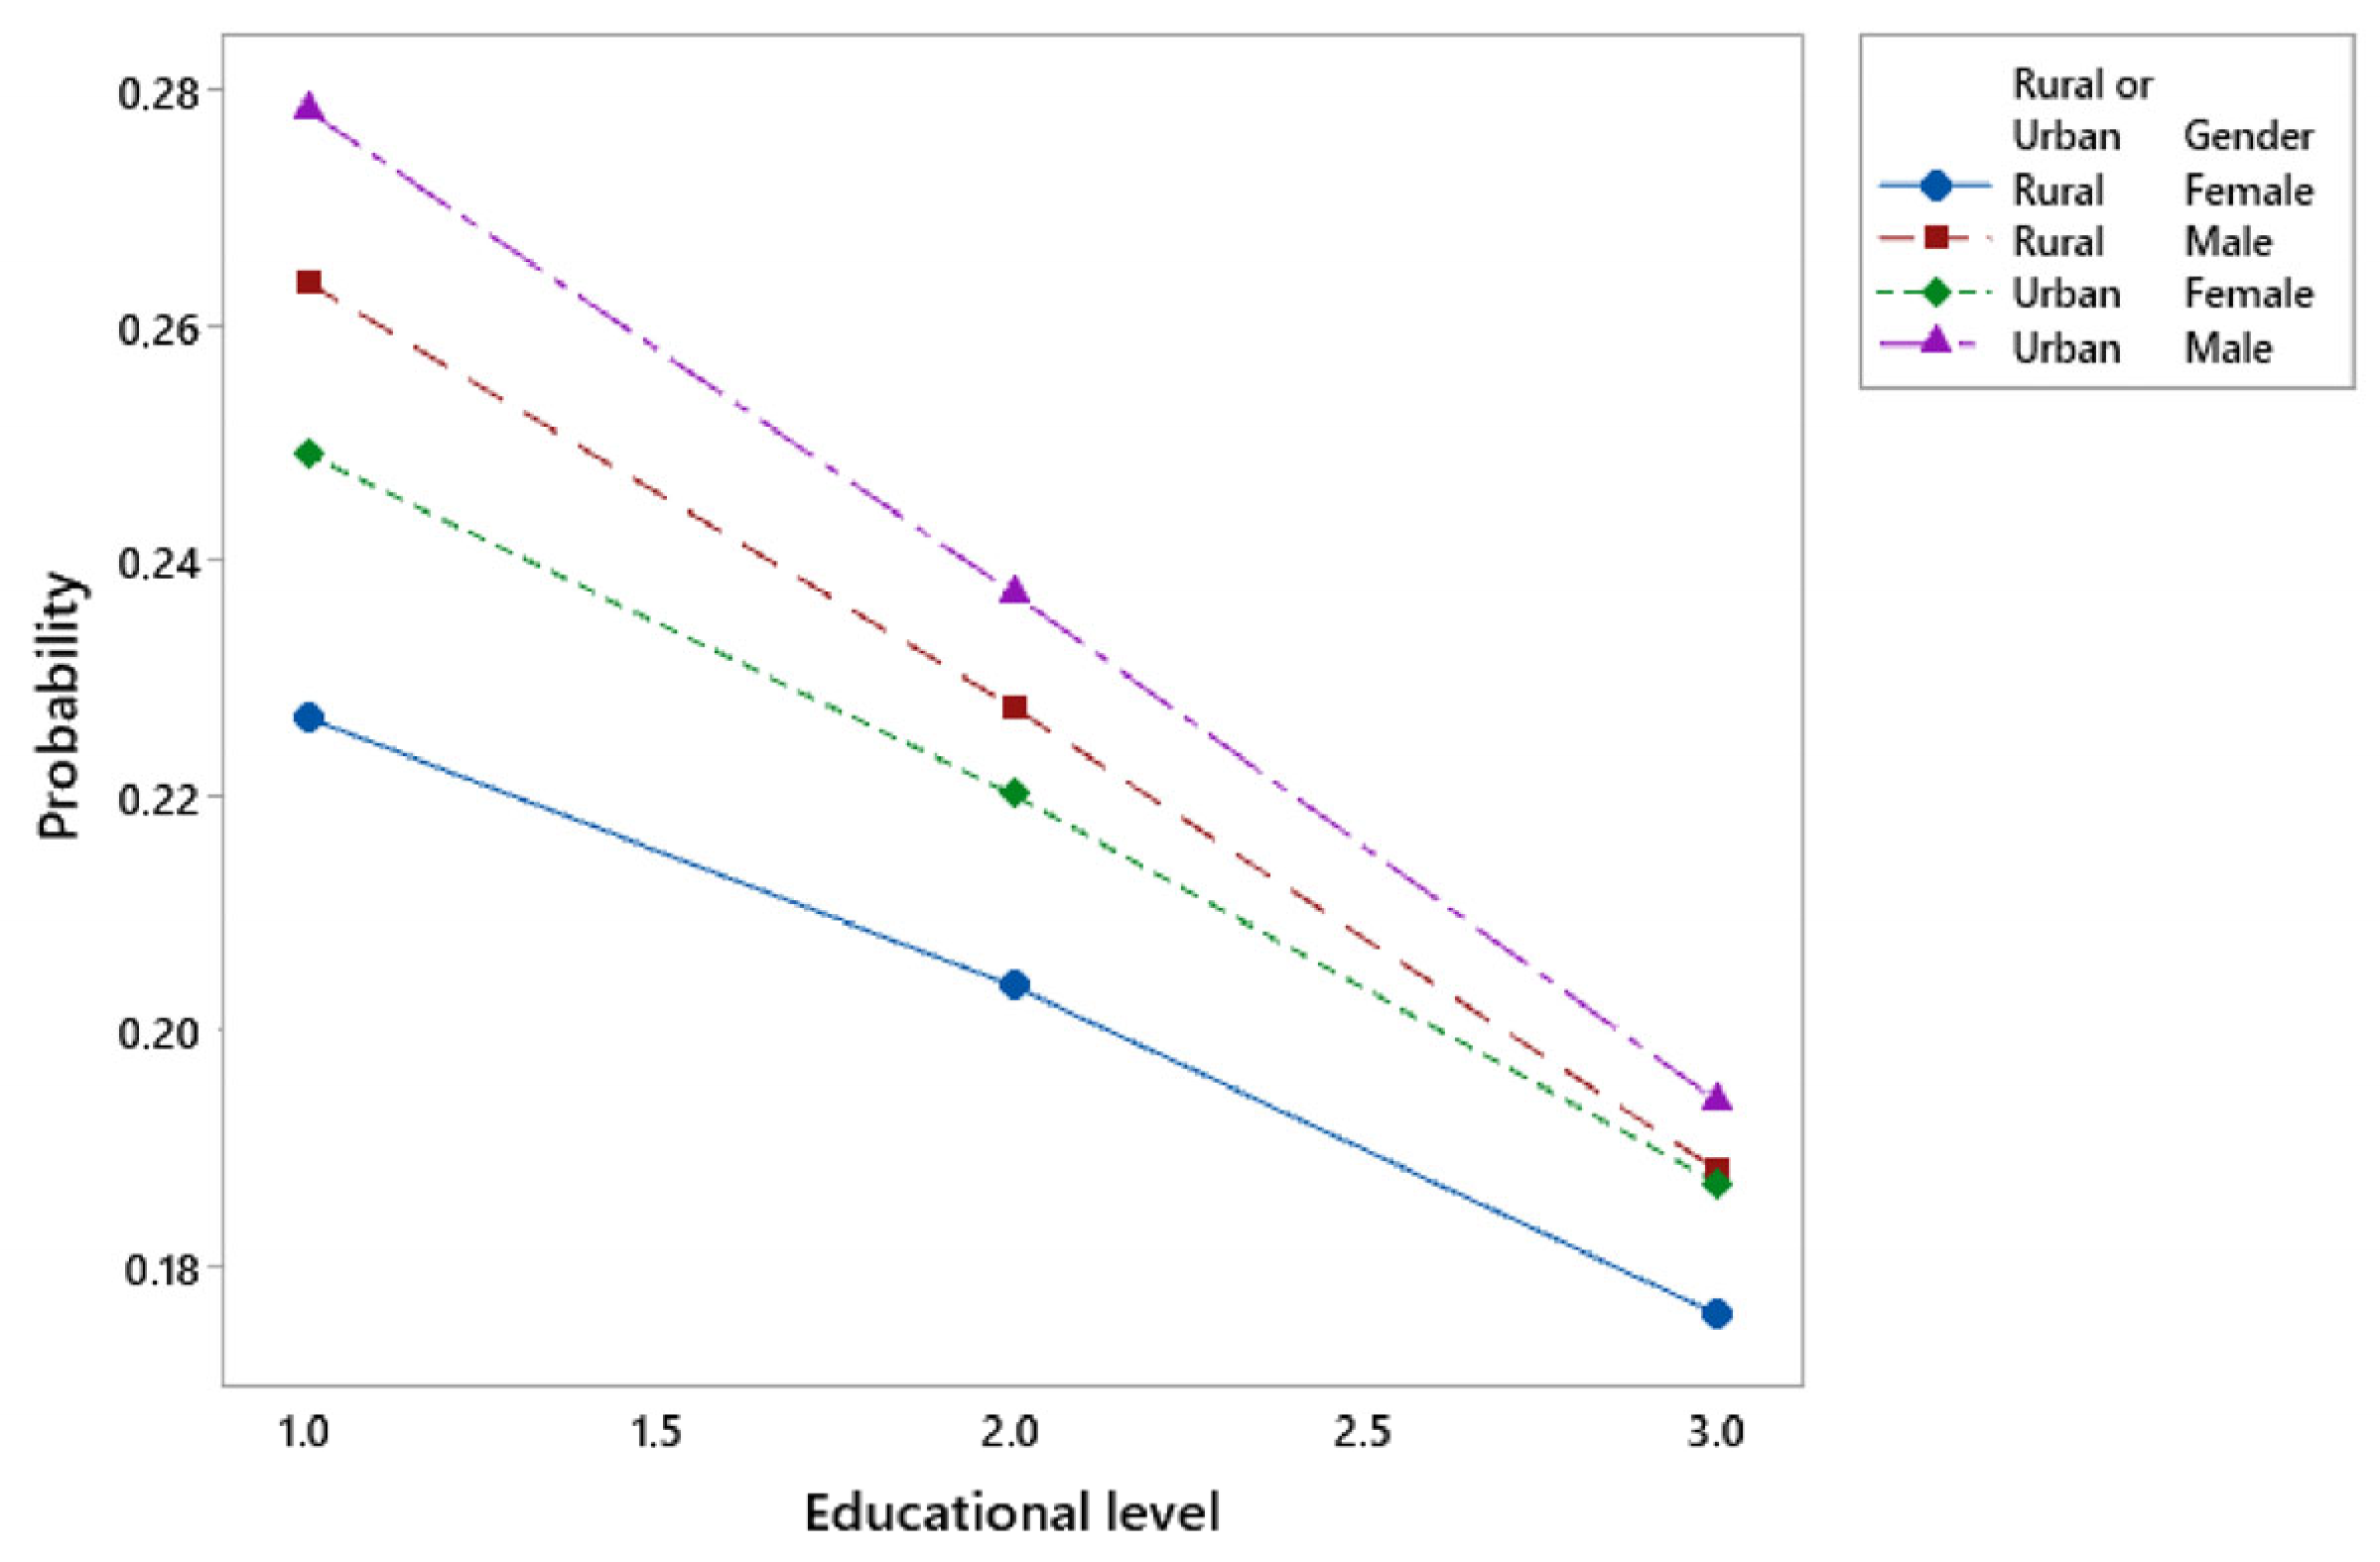
If the person is from a rural area, they are 1.97 times more likely to choose SDG 2 than SDG 1.
If the person is from an urban area, they are 0.51 times less likely to choose SDG 2 than SDG 1.
If the person is female, they are 0.73 times less likely to choose SDG 2 than SDG 1.
If the person is male, they are 1.37 times more likely to choose SDG 2 than SDG 1.
In terms of educational level, for each additional educational level, the probability of the person choosing SDG 2 is 1.49 times higher than SDG 1.
When analyzing the graphs that show the probability of choosing a specific SDG, we obtain the following results.
In the case of SDG 1 (Figure 7), it can be seen that the higher the educational level, the lower the probability of choosing this SDG. It is also observed that the profile with the highest probability is urban males, and the one with the lowest probability is rural females.
In the case of SDG 3 (Figure 8), we see that the higher the educational level, the higher the probability of choosing this SDG. We also see that the profile with the highest probability is urban females, and the one with the lowest probability is rural males. It is interesting to observe how priorities can vary among different groups. Many times, girls tend to be more focused on well-being and health, perhaps due to social and cultural factors that encourage them to take better care of themselves. However, this does not mean that boys do not care about their health; they may just express it in different ways.
In the case of SDG 5 (Figure 9), we see that the higher the educational level, the lower the probability of choosing this SDG. We also see that the profile with the highest probability is rural females, and the one with the lowest probability is urban males.
Despite the observations made, it is worth noting that the y-axis, which indicates the probability, has a very reduced scale, so the observed variations are very small.

3.2.2. Study Conducted with First- and Second-Choice Responses Together

Among second-choice responses, SDG 2 (eradicating hunger) received the most votes, followed by SDG1, SDG3, and SDG 5, and with SDG 4 in fifth place (Figure 6).
Because the SDGs chosen as first and second choices are very similar (SDG 1 and SDG 2), in this case, the responses were considered together, as participants may have given equal importance to both SDGs and may have been unsure which SDG to choose as their first and second choices. For this reason, the responses from the first and second choices have been considered on equal terms.
Taking this into account, the final results are now as follows: the response with the most votes was SDG 1, followed by SDG 3, SDG 2, and SDG 5, with SDG 13 in fifth place. In this case, SDG 1 was taken as the reference response since it received the most votes.
The data analyzed in first and second choices also form a significant and fitting model.
Considering that the most chosen SDGs will be discussed, with the performed regression it could be argued that:
If the person is from a rural area, they are 0.96 times less likely to choose SDG 3 than SDG 1.
If the person is from an urban area, they are 1.04 times more likely to choose SDG 3 than SDG 1.
If the person is female, they are 1.43 times more likely to choose SDG 3 than SDG 1.
If the person is male, they are 0.70 times less likely to choose SDG 3 than SDG 1.
In terms of educational level, for each additional educational level, the probability of the person choosing SDG 3 over SDG 1 is 1.30 higher.
If the person is from a rural area, they are 1.25 times more likely to choose SDG 2 than SDG 1.
If the person is from an urban area, they are 0.80 times less likely to choose SDG 2 than SDG 1.
If the person is female, they are 0.80 times less likely to choose SDG 2 than SDG 1.
If the person is male, they are 1.25 times more likely to choose SDG 2 than SDG 1.
In terms of educational level, for each additional educational level, the probability of the person choosing SDG 2 over SDG 1 is 1.19 times higher.
If the person is from a rural area, they are 1.43 times more likely to choose SDG 5 than SDG 1.
If the person is from an urban area, they are 0.70 times less likely to choose SDG 5 than SDG 1.
If the person is female, they are 2.80 times more likely to choose SDG 5 than SDG 1.
If the person is male, they are 0.36 times less likely to choose SDG 5 than SDG.
In terms of educational level, for each additional educational level, the probability of the person choosing SDG 5 over SDG 1 is 0.87 times lower.
If the person is from a rural area, they are 1.19 times more likely to choose SDG 13 than SDG 1.
If the person is from an urban area, they are 0.84 times less likely to choose SDG 13 than SDG 1.
If the person is female, they are 1.06 times more likely to choose SDG 13 than SDG 1.
If the person is male, they are 0.94 times less likely to choose SDG 13 than SDG 1.
In terms of educational level, for each additional educational level, the probability of the person choosing SDG 13 over SDG 1 is 1.18 times higher.
If analyzed the graphs showing the probability of choosing a specific SDG, the following results are obtained.
In the case of SDG 1 (Figure 10), it is observed that the higher the educational level, the lower the probability of choosing this SDG. It is also observed that the profile with the highest probability is urban males, and the one with the lowest probability is rural females.
In the case of SDG 3 (Figure 11), we see that the higher the educational level, the higher the probability of choosing this SDG. We also see that the profile with the highest probability is urban females, and the one with the lowest probability is rural males.
In the case of SDG 2 (Figure 12), it can be observed that level of education has almost no influence. It can also be observed that the profile with the highest probability is rural males, and the one with the lowest probability is urban females.

4. Discussion

This study seeks innovation in the educational context, with the use of interactive learning, to raise awareness of the SDGs among participants. Before starting the Forest and Sustainability Project and other experiences, a large majority of students were completely unaware of the Sustainable Development Goals. In all sample groups, knowledge of and interest in the SDGs has increased significantly: both among those who discovered the SDGs through experiences carried out by the researchers and among students who worked on them to varying degrees. Students clearly gained awareness of the importance of their role in society, fulfilling the main goal of the Forest and Sustainability Project.
It was also found that of the different experiences that include the selection and prioritization of five SDGs, the Forest and Sustainability Project had the greatest impact.
It is difficult to make comparisons between the results of this study and other works on SDG prioritization, because, as mentioned in the introduction, most research focuses on high-level students. However, in some of these studies, students indicate that they were already familiar with the SDGs from their secondary school education [29,30]. On the other hand, the studies focus more on the knowledge of the SDGs rather than on their prioritization.
In the present study, in the joint study of all samples (1051 participants), the SDGs with the highest scores were SDG 1 (No Poverty), which was in first place (far ahead of the others), and SDG 2 (Zero Hunger), which was in second place. SDG 3 (Good Health and Well-Being) is in third place and SDG 5 (Gender Equality) is in fourth place, while SDG 16 (Peace, Justice, and Strong Institutions), is in fifth place. As a result, it can be concluded that humanitarian, health, and social factors concern members of the sample group most. Considering that the purpose of SDGs is primarily a call to action to end poverty and inequality, it can be concluded that the opinions of the young participants align with this perspective.
When analyzing participants’ prioritization of the seventeen SDGs, SDG 1 comes in first place. It can also be observed that for each additional educational level, the probability of the person choosing SDG 3 is 1.47 times higher than SDG 1, and the probability of the person choosing SDG 2 over SDG 1 is 1.49 times higher.
When it comes to the type of school, if the person is from a rural area, they are 2.16 times more likely to choose SDG 5 and 1.97 times more likely to choose SDG 2 over SDG 1. If the person is from an urban area, they are 0.46 times less likely to choose SDG 5 and 0.51 times less likely to choose SDG 2 over SDG 1. These data seem to indicate that individuals who live in rural areas are more sensitive to inequalities and place greater importance on the population’s nutrition.
When comparing responses by gender, the likelihood of choosing SDG 5 over SDG 1 is 3.63 times greater if the person is female and 0.28 times less if the person is male. In the case of SDG 13, the relationship is 1.25 to 0.80. On the other hand, If the person is male, they are 1.37 times more likely to choose SDG 2, and if the person is female, they are 0.73 times less likely to choose SDG 2 over SDG 1. This suggests that females are more sensitive to global poverty and care for nature, while males place more importance on hunger.
When it comes to the combined analysis of SDGs 1 and 2, we can see that if the person is from a rural area, they are 1.43 times more likely to choose SDG 5 over SDG 1; if the person is from an urban area, they are 0.70 times less likely. Therefore, we can consider that gender equality is of greater concern in rural areas.
If females and males are compared, the former are 1.43 times more likely to choose SDG 3 than SDG 1, while the latter are 0.70 times less likely. This result confirms that gender can influence how well-being and health are prioritized. Meanwhile, females are 2.80 times more likely to select SDG 5, while males are 0.36 times less likely. Therefore, females are more concerned about health and gender equality than males.
It was found that when conducting the study of the SDG selected as a first option, specific voter profiles can be generated. In the case of SDG 1, we see that the higher their educational level, the lower the probability of a person choosing this SDG. We also see that the higher their educational level, the higher the probability of a person choosing SDG 3. Finally, it can be observed that the profile with the highest probability is urban females, and the profile with the lowest probability is rural males. When the study is repeated with the combination of the SDGs placed in first and second place, the results corroborate the previously described profiles.

5. Conclusions

The large number of participants in the project shows that the use of interactive learning tools has yielded good results. The importance of the use of the Interactive Activity Documents, considering the visual design, has been evidenced by a significant level of engagement from the students involved in the project. This fact demonstrates that the user interface is a crucial factor to consider when targeting students in this age group.
Minitab Statistical Software (v.22) using nominal logistic regression has enabled the achievement of good results for this type of study sample.
Although most of the responses come from participants in the Forest and Sustainability Project, the study’s limitation lies in the difficulty of evaluating how each educational institution implements the project with their students. Some groups may have worked more intensively on the project’s connection with the SDGs than others.
The results regarding the prioritization of the SDGs show that humanitarian issues, along with health and well-being, are the primary concerns for young participants. The greatest differences in opinion emerge when considering the gender of the participants, particularly concerning SDG 5 (Gender Equality) and SDG 13 (Climate Action). Future research could focus on a more detailed comparison of these gender-related differences.
It is evident that young people prioritize social SDGs (see Figure 4 and Figure 5) over others. In the case of the pilot test with students participating in the Young Talent FORUM of Catalonia, SDG 13 was addressed in detail, as the forum’s theme was the sustainable use of natural resources. Despite this focus, SDG 13 was ranked in third position in terms of priority. For the participants in the Forest and Sustainability Project, the focus was on issues such as water and air pollution, as well as water and energy conservation at home, yet SDG 13 was not prioritized.
It seems that future generations are striving for a more equitable world, with progress being driven primarily by the eradication of poverty and hunger. Indeed, the core aim of the SDGs is to eliminate poverty and hunger. The insights gathered from students serve as an indicator of how well sustainability education is being received and highlight which areas resonate most with them. By aligning educational initiatives with students’ priorities, educators can more effectively engage them in sustainability efforts. This alignment could inspire further work aimed at encouraging young people to propose practical solutions to achieve these key objectives.
This study aligns with the three pillars of the Youth Action Plan in EU External Action [26]. (1) Engage: Amplifying young people’s voices in policy and decision-making processes at all levels. (2) Empower: Combating inequalities and providing young people with the skills and resources necessary for them to thrive and fulfill their potential. (3) Connect: Creating opportunities for young people to network and exchange ideas with their peers. These principles motivate the authors to continue developing the projects described in this article, as well as other similar initiatives addressing various topics.

Author Contributions

Conceptualization, L.M. and D.G.; Methodology, L.M., J.C., D.G. and J.M.R.; Software, J.M.R. and A.F.; Validation, L.M., J.C., D.G. and J.M.R.; Formal Analysis, L.M. and D.G.; Investigation, L.M. and D.G.; Writing—Original Draft Preparation, L.M. and D.G.; Writing—Review and Editing, L.M., J.C., J.M.R., A.F. and D.G.; Funding Acquisition, L.M., J.C. and D.G. All authors have read and agreed to the published version of the manuscript.

Funding

This work was supported by the Fundación Española para la Ciencia y la Tecnología (FECYT)—Ministerio de Ciencia e Innovación, under grant FCT-20-15857.

Institutional Review Board Statement

The study was conducted in accordance with the protocol of Code of Ethics and Good Practice of the Universitat Politècnica de Catalunya, approved on 22 February 2022, by the Governing Council Decision CG/2022/02.

Informed Consent Statement

Not applicable.

Data Availability Statement

No new data were created or analyzed in this study.

Conflicts of Interest

The authors declare no conflicts of interest.

References

  1. Visser, W.; Brundtland, G.H. Our Common Future (‘The Brundtland Report’): World Commission on Environment and Development. In The Top 50 Sustainability Books; Routledge: Oxfordshire, UK, 2013; pp. 52–55. [Google Scholar] [CrossRef]
  2. European Commission. Sustainable Development in the European Union—Monitoring report on Progress Towards the SDGs in an EU Context; European Union: Brussels, Belgium, 2018. [Google Scholar] [CrossRef]
  3. Lafferty, W.M.; Eckerberg, K. From the Earth Summit to Local Agenda 21: Working Towards Sustainable Development; Routledge: Hoboken, NJ, USA, 2013. [Google Scholar]
  4. Leggett, J.A.; Carter, N.T. Rio+ 20: The United Nations Conference on Sustainable Development; Library of Congress, Congressional Research Service: Rio de Janeiro, Brazil, 2012. [Google Scholar]
  5. United Nations. Transforming Our World: The 2030 Agenda for Sustainable Development. General Assembly 70 Session; United Nations: New York, NY, USA, 2015; Available online: https://www.un.org/en/development/desa/population/migration/generalassembly/docs/globalcompact/A_RES_70_1_E.pdf (accessed on 12 January 2024).
  6. United Nations. Progress Towards the Sustainable Development Goals; United Nations Economic and Social Council: New York, NY, USA, 2017. [Google Scholar]
  7. United Nations. Global Sustainable Development Report 2019: The Future Is Now—Science for Achieving Sustainable Development; Independent Group of Scientists Appointed by the Secretary-General: New York, NY, USA, 2019. [Google Scholar]
  8. Rieckmann, M.; Mindt, L.; Gardiner, S. Education for Sustainable Development Goals Learning Objectives; UNESCO: London, UK, 2017. [Google Scholar]
  9. UNESCO. Global Citizenship Education: Topics and Learning Objectives. 2015. Available online: http://unesdoc.unesco.org/images/0023/002329/232993e.pdf (accessed on 12 January 2024).
  10. Shulla, K.; Filho, W.L.; Lardjane, S.; Sommer, J.H.; Borgemeister, C. Sustainable development education in the context of the 2030 Agenda for sustainable development. Int. J. Sustain. Dev. World Ecol. 2020, 27, 458–468. [Google Scholar] [CrossRef]
  11. Socientize Consortium. Green Paper on Citizen Science for Europe: Towards a Society of Empowered Citizens and Enhanced Research. Socientize. 2013, pp. 1–54. Available online: https://digital-strategy.ec.europa.eu/en/library/green-paper-citizen-science-europe-towards-society-empowered-citizens-and-enhanced-research (accessed on 5 February 2024).
  12. Cooper, L.; Gorman, D. A holistic approach to embedding social responsibility and sustainability in a university—Fostering collaboration between researchers, students and operations. In Handbook of Sustainability Science and Research; Springer International Publishing: Cham, Switzerland, 2018; pp. 177–192. [Google Scholar]
  13. Costanza, R.; Alperovitz, G.; Daly, H.; Farley, J.; Franco, C.; Jackson, T.; Kubiszewski, I.; Schor, J.; Victor, P. Building a Sustainable and Desirable Economy in Society in Nature; UN Department of Economic and Social Affairs: New York, NY, USA, 2011. [Google Scholar]
  14. Kagan, C.; Burton, M.H. Putting the ‘social’ into sustainability science. In Handbook of Sustainability Science and Research; Springer International Publishing: Cham, Switzerland, 2018; pp. 285–298. [Google Scholar]
  15. Costanza, R. A theory of socio-ecological system change. J. Bioecon. 2014, 16, 39–44. [Google Scholar] [CrossRef]
  16. Costanza, R.; Fioramonti, L.; Kubiszewski, I. The UN sustainable development goals and the dynamics of well-being. Front. Ecol. Environ. 2016, 14, 59. [Google Scholar] [CrossRef]
  17. Le Blanc, D. Towards integration at last? The sustainable development goals as a network of targets. Sustain. Dev. 2015, 23, 176–187. [Google Scholar] [CrossRef]
  18. Kim, R.E. The nexus between international law and the sustainable development goals. Rev. Eur. Comp. Int. Environ. Law 2016, 25, 15–26. [Google Scholar] [CrossRef]
  19. Nilsson, M.; Griggs, D.; Visbeck, M. Policy: Map the interactions between sustainable development goals. Nature 2016, 534, 320–322. [Google Scholar] [CrossRef] [PubMed]
  20. Pradhan, P.; Costa, L.; Rybski, D.; Lucht, W.; Kropp, J.P. A systematic study of sustainable development goal (SDG) interactions. Earth’s Future 2017, 5, 1169–1179. [Google Scholar] [CrossRef]
  21. Liu, J.; Hull, V.; Godfray, H.C.J.; Tilman, D.; Gleick, P.; Hoff, H.; Pahl-Wostl, C.; Xu, Z.; Chung, M.G.; Sun, J.; et al. Nexus approaches to global sustainable development. Nat. Sustain. 2018, 1, 466–476. [Google Scholar] [CrossRef]
  22. Gade, A.N.; Madsen, M.B. Early prioritization of the United Nation’s goals for sustainable development in construction projects. IOP Conf. Ser. Earth Environ. Sci. 2020, 588, 052054. [Google Scholar] [CrossRef]
  23. Yang, S.; Zhao, W.; Liu, Y.; Cherubini, F.; Fu, B.; Pereira, P. Prioritizing sustainable development goals and linking them to ecosystem services: A global expert’s knowledge evaluation. Geogr. Sustain. 2020, 1, 321–330. [Google Scholar] [CrossRef]
  24. Toth, W.; Vacik, H.; Pülz, H.; Carlsen, H. Deepening our understanding of which policy advice to expect from prioritizing SDG targets: Introducing the Analytic Network Process in a multi-method setting. Sustain. Sci. 2021, 17, 1473–1488. [Google Scholar] [CrossRef]
  25. Tremblay, D.; Gowsy, S.; Riffon, O.; Boucher, J.-F.; Dubé, S.; Villeneuve, C. A systemic approach for sustainability implementation planning at the local level by sdg target prioritization: The case of Quebec City. Sustainability 2021, 13, 2520. [Google Scholar] [CrossRef]
  26. European Comission. Questions and Answers: Youth Action Plan in EU External Action for 2022–2027. 2022. Available online: https://ec.europa.eu/commission/presscorner/detail/en/qanda_22_5882 (accessed on 12 November 2024).
  27. Stockholm Resilience Centre. The SDGs Wedding Cake. 2016. Available online: https://www.stockholmresilience.org/research/research-news/2016-06-14-the-sdgs-wedding-cake.html (accessed on 12 November 2024).
  28. Aleixo, A.M.; Leal, S.; Azeiteiro, U.M. Higher education students’ perceptions of sustainable development in Portugal. J. Clean. Prod. 2021, 327, 129429. [Google Scholar] [CrossRef]
  29. Zimon, D.; Lysenko-Ryba, K.; Zatwarnicka-Madura, B. Polish students’ attitude to the importance and assessment of implementation of 17 SDGs—Pilot study. Int. J. Qual. Res. 2023, 17, 1291–1302. [Google Scholar] [CrossRef]
  30. Leiva-Brondo, M.; Lajara-Camilleri, N.; Vidal-Meló, A.; Atarés, A.; Lull, C. Spanish University Students’ Awareness and Perception of Sustainable Development Goals and Sustainability Literacy. Sustainability 2022, 14, 4552. [Google Scholar] [CrossRef]
  31. Mulero, L.; Cunill-Solà, J.; Grau, M.D. Implementació a L’aula del Projecte BOSC i Sostenibilitat: Curs de Formació del Professorat; Congreso Internacional de Docencia Universitaria e Innovación (XII CIDUI): Lleida, Spain, 2023. [Google Scholar]
  32. Jayaprakash, D.; Kanimozhiselvi, C.S. Multinomial logistic regression method for early detection of autism spectrum disorders. Meas. Sens. 2024, 33, 101125. [Google Scholar] [CrossRef]
  33. Kaçorri, D.; Totoni, R.; Prifti, L. Multinomial logistic regression to estimate the public perception of air pollution and its impact on health: A case study in Tirana. In Proceedings of the 2nd International Conference on Recent Academic Studies ICRAS 2023, Konya, Turkey, 22 October 2023; All Sciences Academy: Konya, Turkey, 2023; pp. 312–317. [Google Scholar]
  34. Widiyanto, W.; Nurkhin, A.; Yulianto, A.; Daud, N.M. Multinomial logistic regression for the analysis of career decision style in teacher education. Eur. J. Educ. Res. 2023, 12, 329–340. [Google Scholar] [CrossRef]
Figure 1. The SDG Wedding Cake. Credit: Azote for Stockholm Resilience Centre, Stockholm University CC BY-ND 3.0.
Sustainability 16 10813 g001
Figure 2. Outline of the study design.
Sustainability 16 10813 g002
Figure 3. Example of interactive materials used in the project.
Sustainability 16 10813 g003
Figure 4. SDG prioritization by all study participants.
Sustainability 16 10813 g004
Figure 5. Prioritization of SDGs by students from the Young Talent Forum of Catalonia.
Sustainability 16 10813 g005
Figure 6. Distribution of votes from secondary school students participating.
Sustainability 16 10813 g006
Figure 7. Scatter plot for SDG 1.
Sustainability 16 10813 g007
Figure 8. Scatter plot for SDG 3.
Sustainability 16 10813 g008
Figure 9. Scatter plot for SDG 5.
Sustainability 16 10813 g009
Figure 10. Scatter plot for SDG 1.
Sustainability 16 10813 g010
Figure 11. Scatter plot for SDG 3.
Sustainability 16 10813 g011
Figure 12. Scatter plot for SDG 2.
Sustainability 16 10813 g012
Table 1. Distribution of participants.
Schools Low LevelMedium LevelHigh LevelTotal
19 (34%)Rural
Female98 (19%)23 (6%)12 (7%)133 (13%)
Male95 (18%)27 (8%)12 (7%)134 (13%)
37 (66%)Urban
Female157 (30%)170 (48%)85 (51%)412 (39%)
Male177 (33%)136 (38%)59 (35%)372 (35%)
56 527 (50%)356 (34%)168 (16%)1051
Table 2. Part of the full table of nominal logistic regression.
Odds RatioIC of 95%
PredictorCoef.p-ValueInferiorSuperior
Logit 5: (13/1)
Constant−1.7340.000
Rural or Urban
Urban−0.1680.5490.850.491.47
Educational level0.3010.0641.350.981.86
Gender
  Female0.2220.3451.250.791.98
Logit 13: (5/1)
Constant−1.1640.000
Rural or Urban
Urban−0.76810.0010.460.290.73
Educational level−0.0160.9190.980.731.34
Gender
  Female1.2890.0003.632.305.74
Logit 15: (3/1)
Constant−1.4480.000
Rural or Urban
Urban−0.0050.9820.990.631.58
Educational level0.3830.0031.471.141.90
Gender
  Female0.3090.1051.360.941.98
Logit 16: (2/1)
Constant−1.3870.000
Rural or Urban
Urban−0.6790.0120.510.300.86
Educational level0.4020.0171.491.082.08
Gender
  Female−0.3180.2020.730.451.19
Table 3. The proof that all slopes are zero.
GLp-Value
480.0001
Table 4. Goodness-of-fit tests.
MethodChi-SquareGLp-Value
Pearson115.8531280.771
Deviation123.6871280.591
Disclaimer/Publisher’s Note: The statements, opinions and data contained in all publications are solely those of the individual author(s) and contributor(s) and not of MDPI and/or the editor(s). MDPI and/or the editor(s) disclaim responsibility for any injury to people or property resulting from any ideas, methods, instructions or products referred to in the content.

