
Land-Use Transfer and Its Ecological Effects in Rapidly Urbanizing Areas: A Case Study of Nanjing, China
Abstract
1. Introduction
2. Area Studied and Data Sources
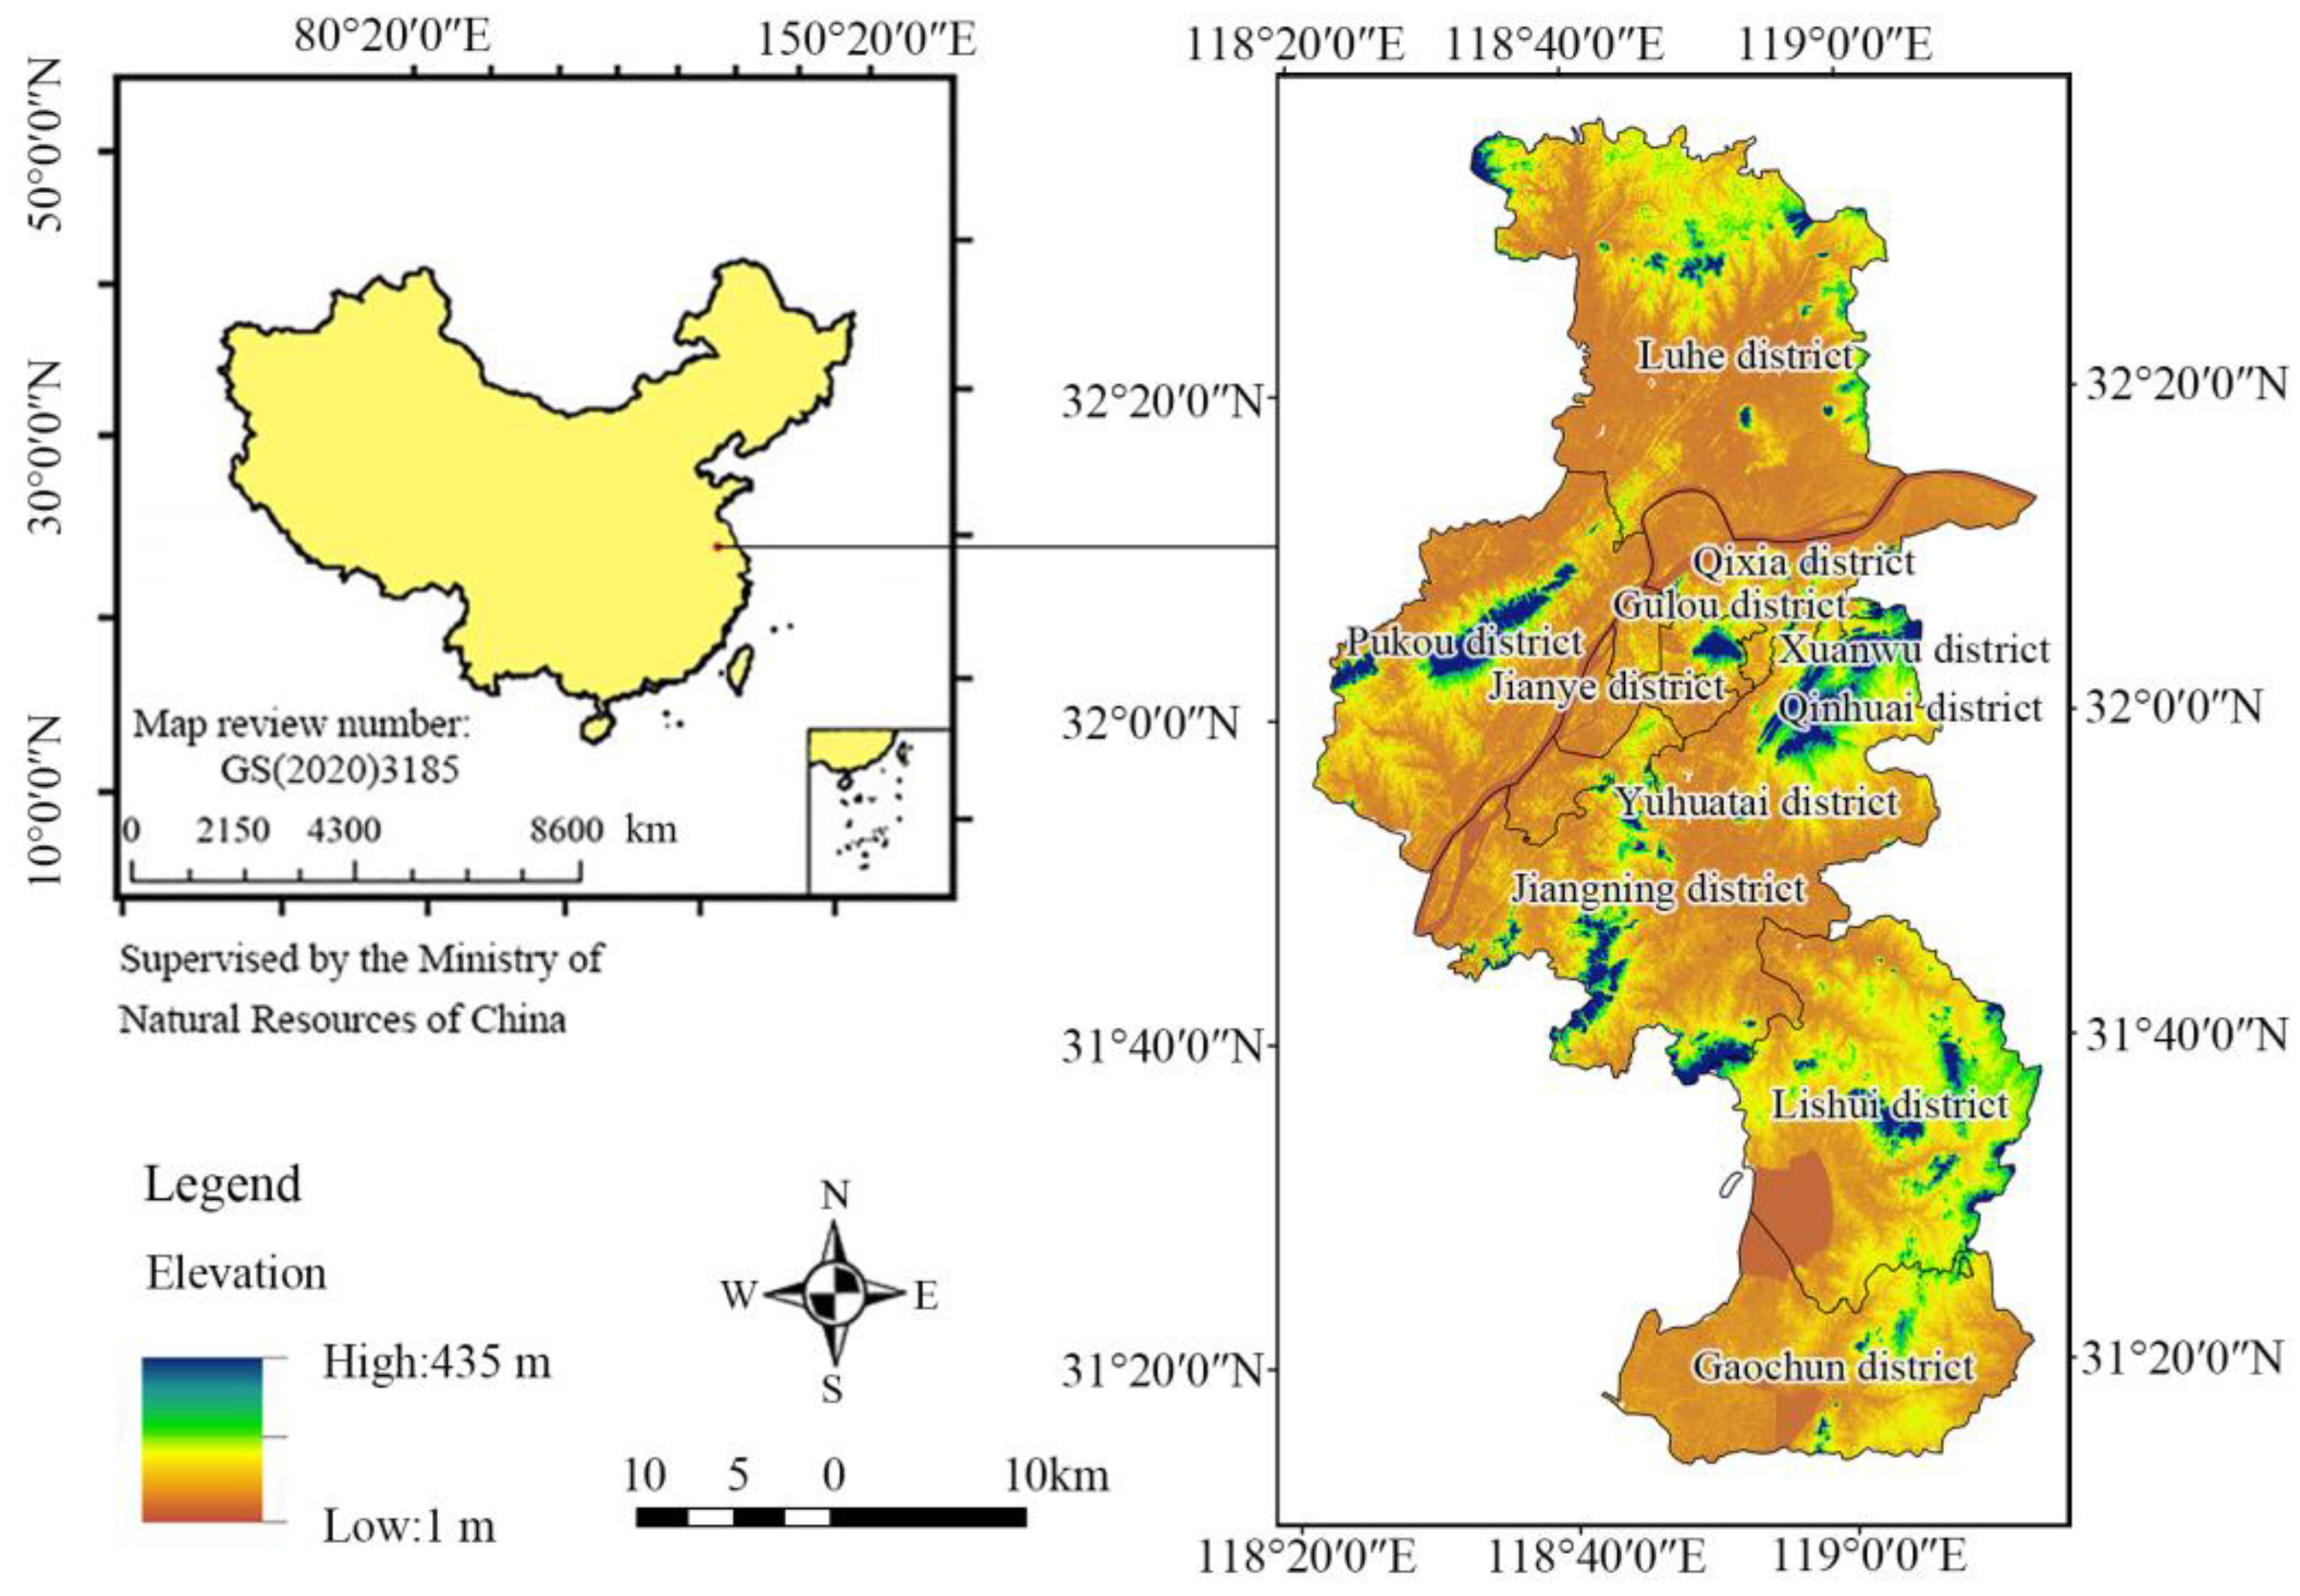
2.1. Area Studied
2.2. Data Sources and Data Processed
2.2.1. Data Sources
2.2.2. Data Processed
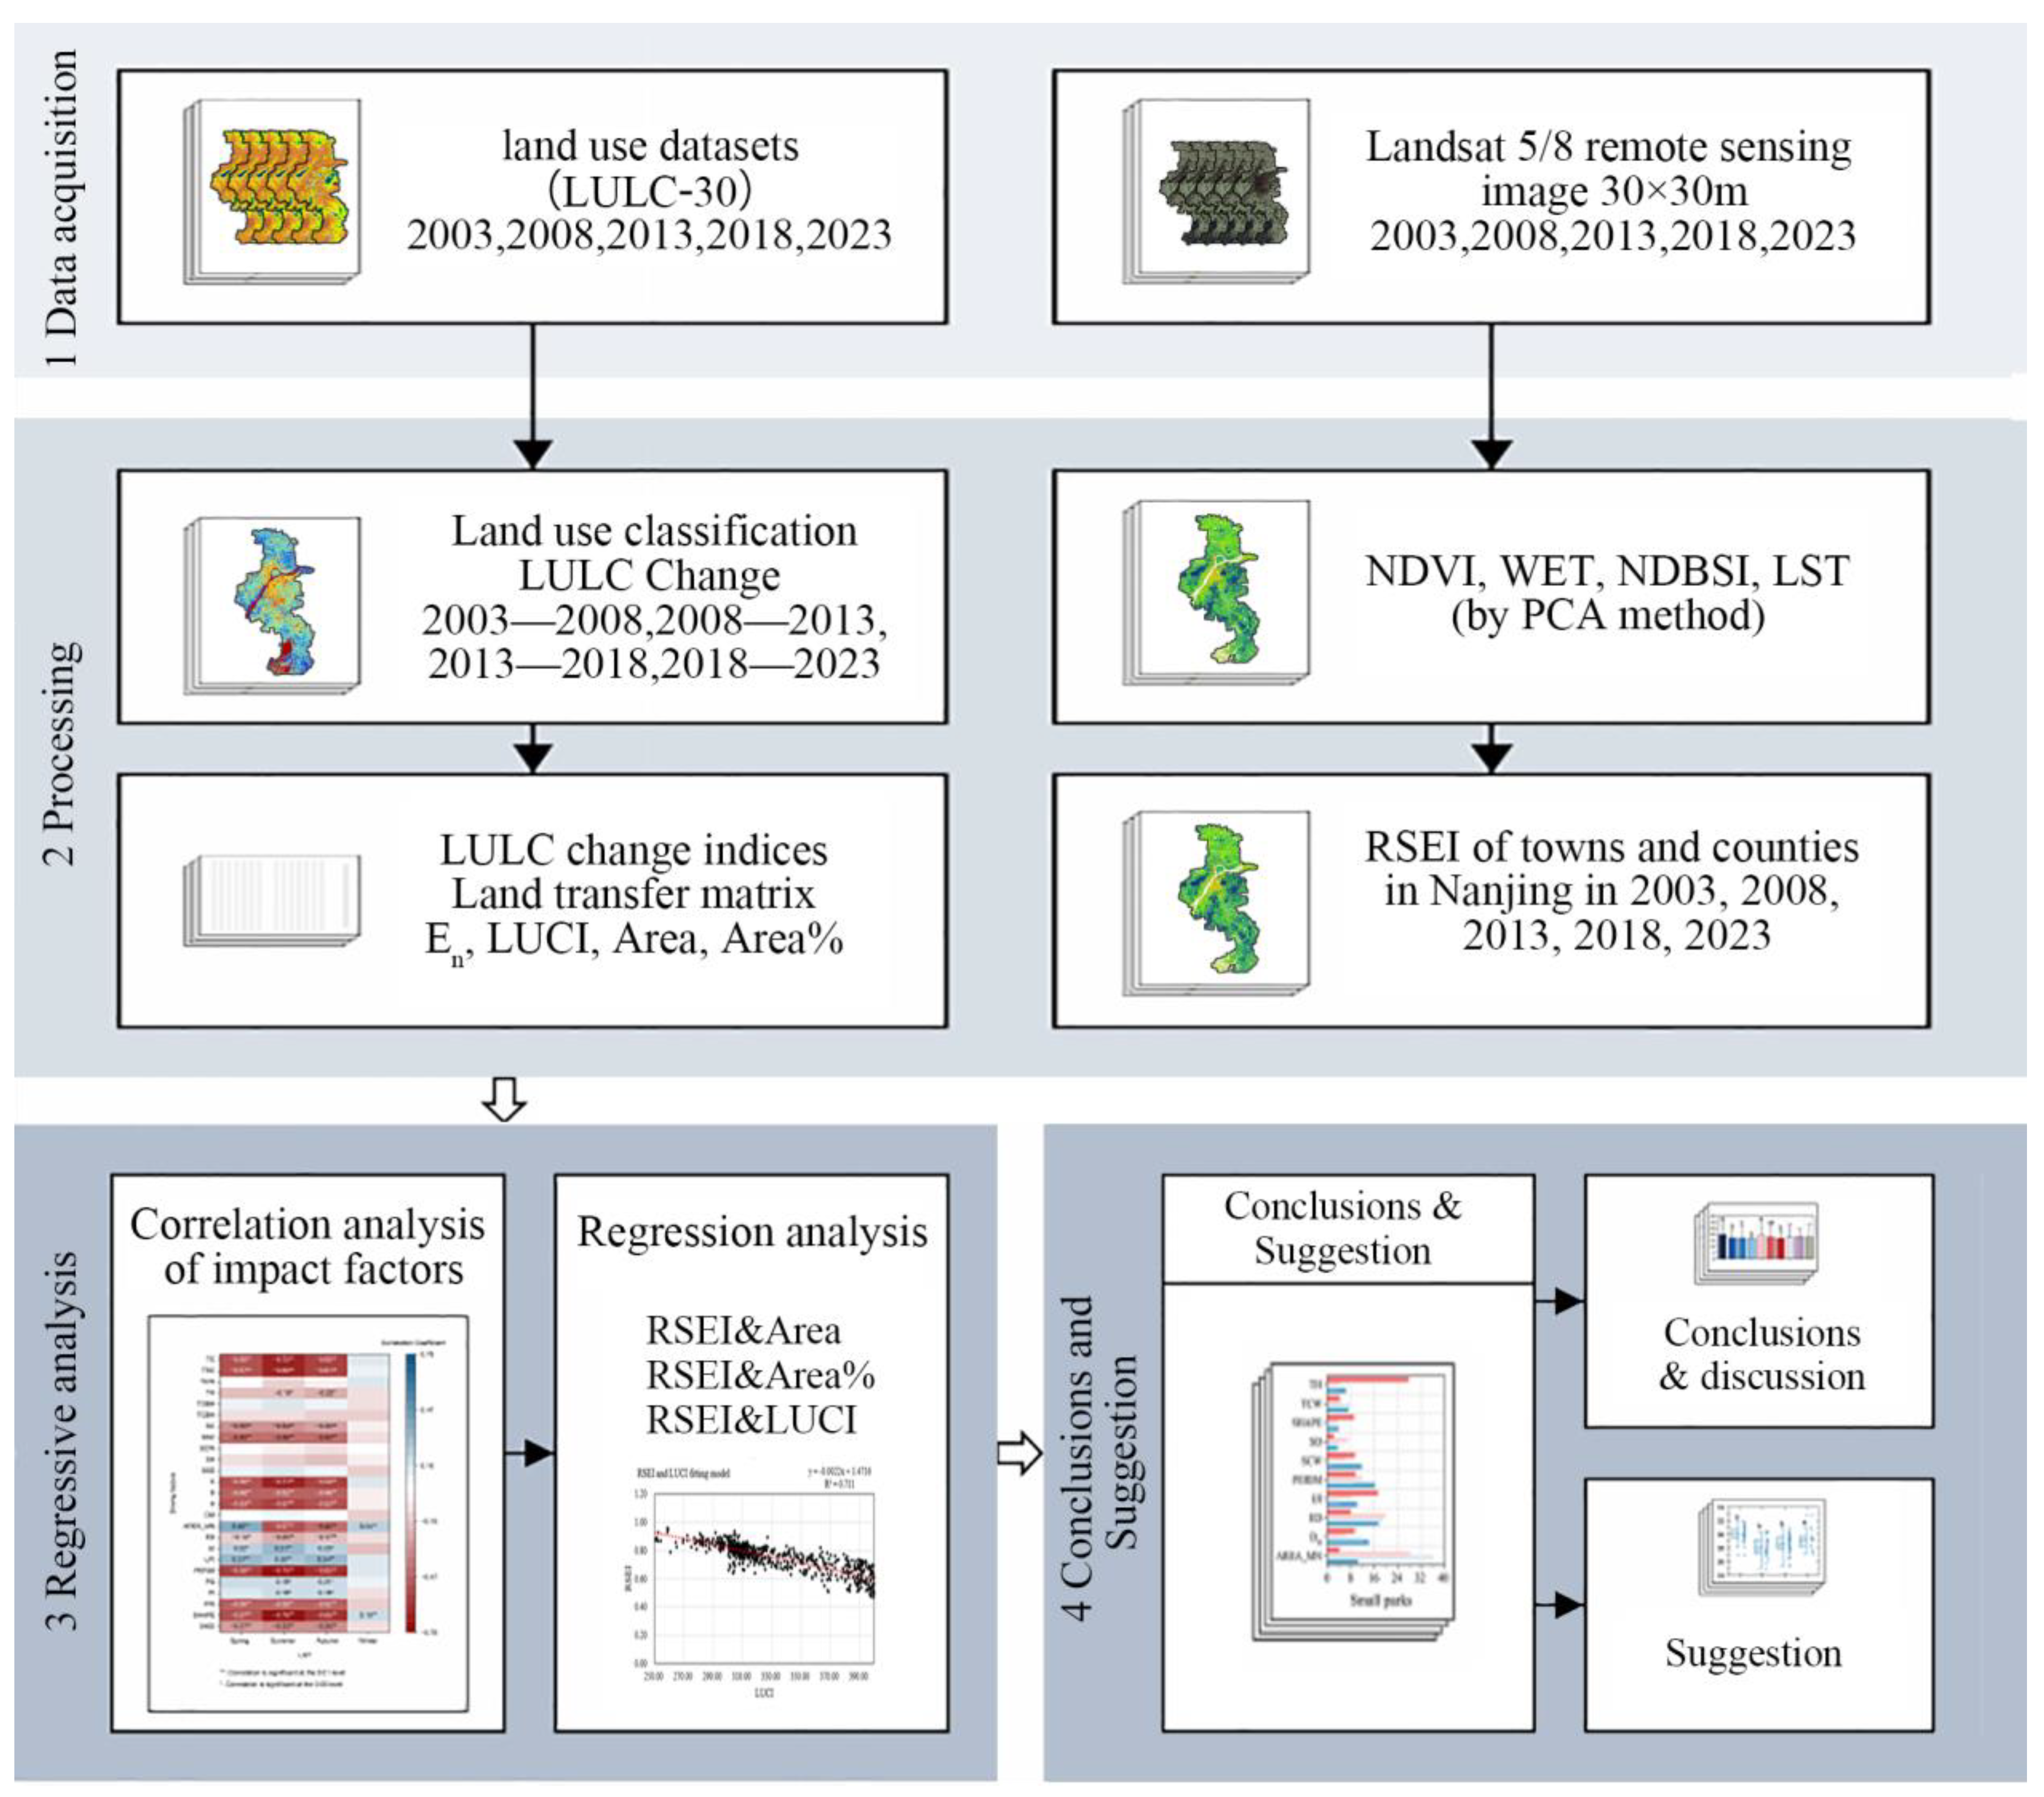
3. Methodology
3.1. Land-Use Change Analysis
3.1.1. Land Expansion Intensity
3.1.2. Land-Use Degree
3.1.3. Transfer Matrix of Land Use
3.2. Evaluation of Eco-Environment Quality: RSEI
3.3. Spatial Analysis
3.4. Data Statistical Analysis Method
4. Results
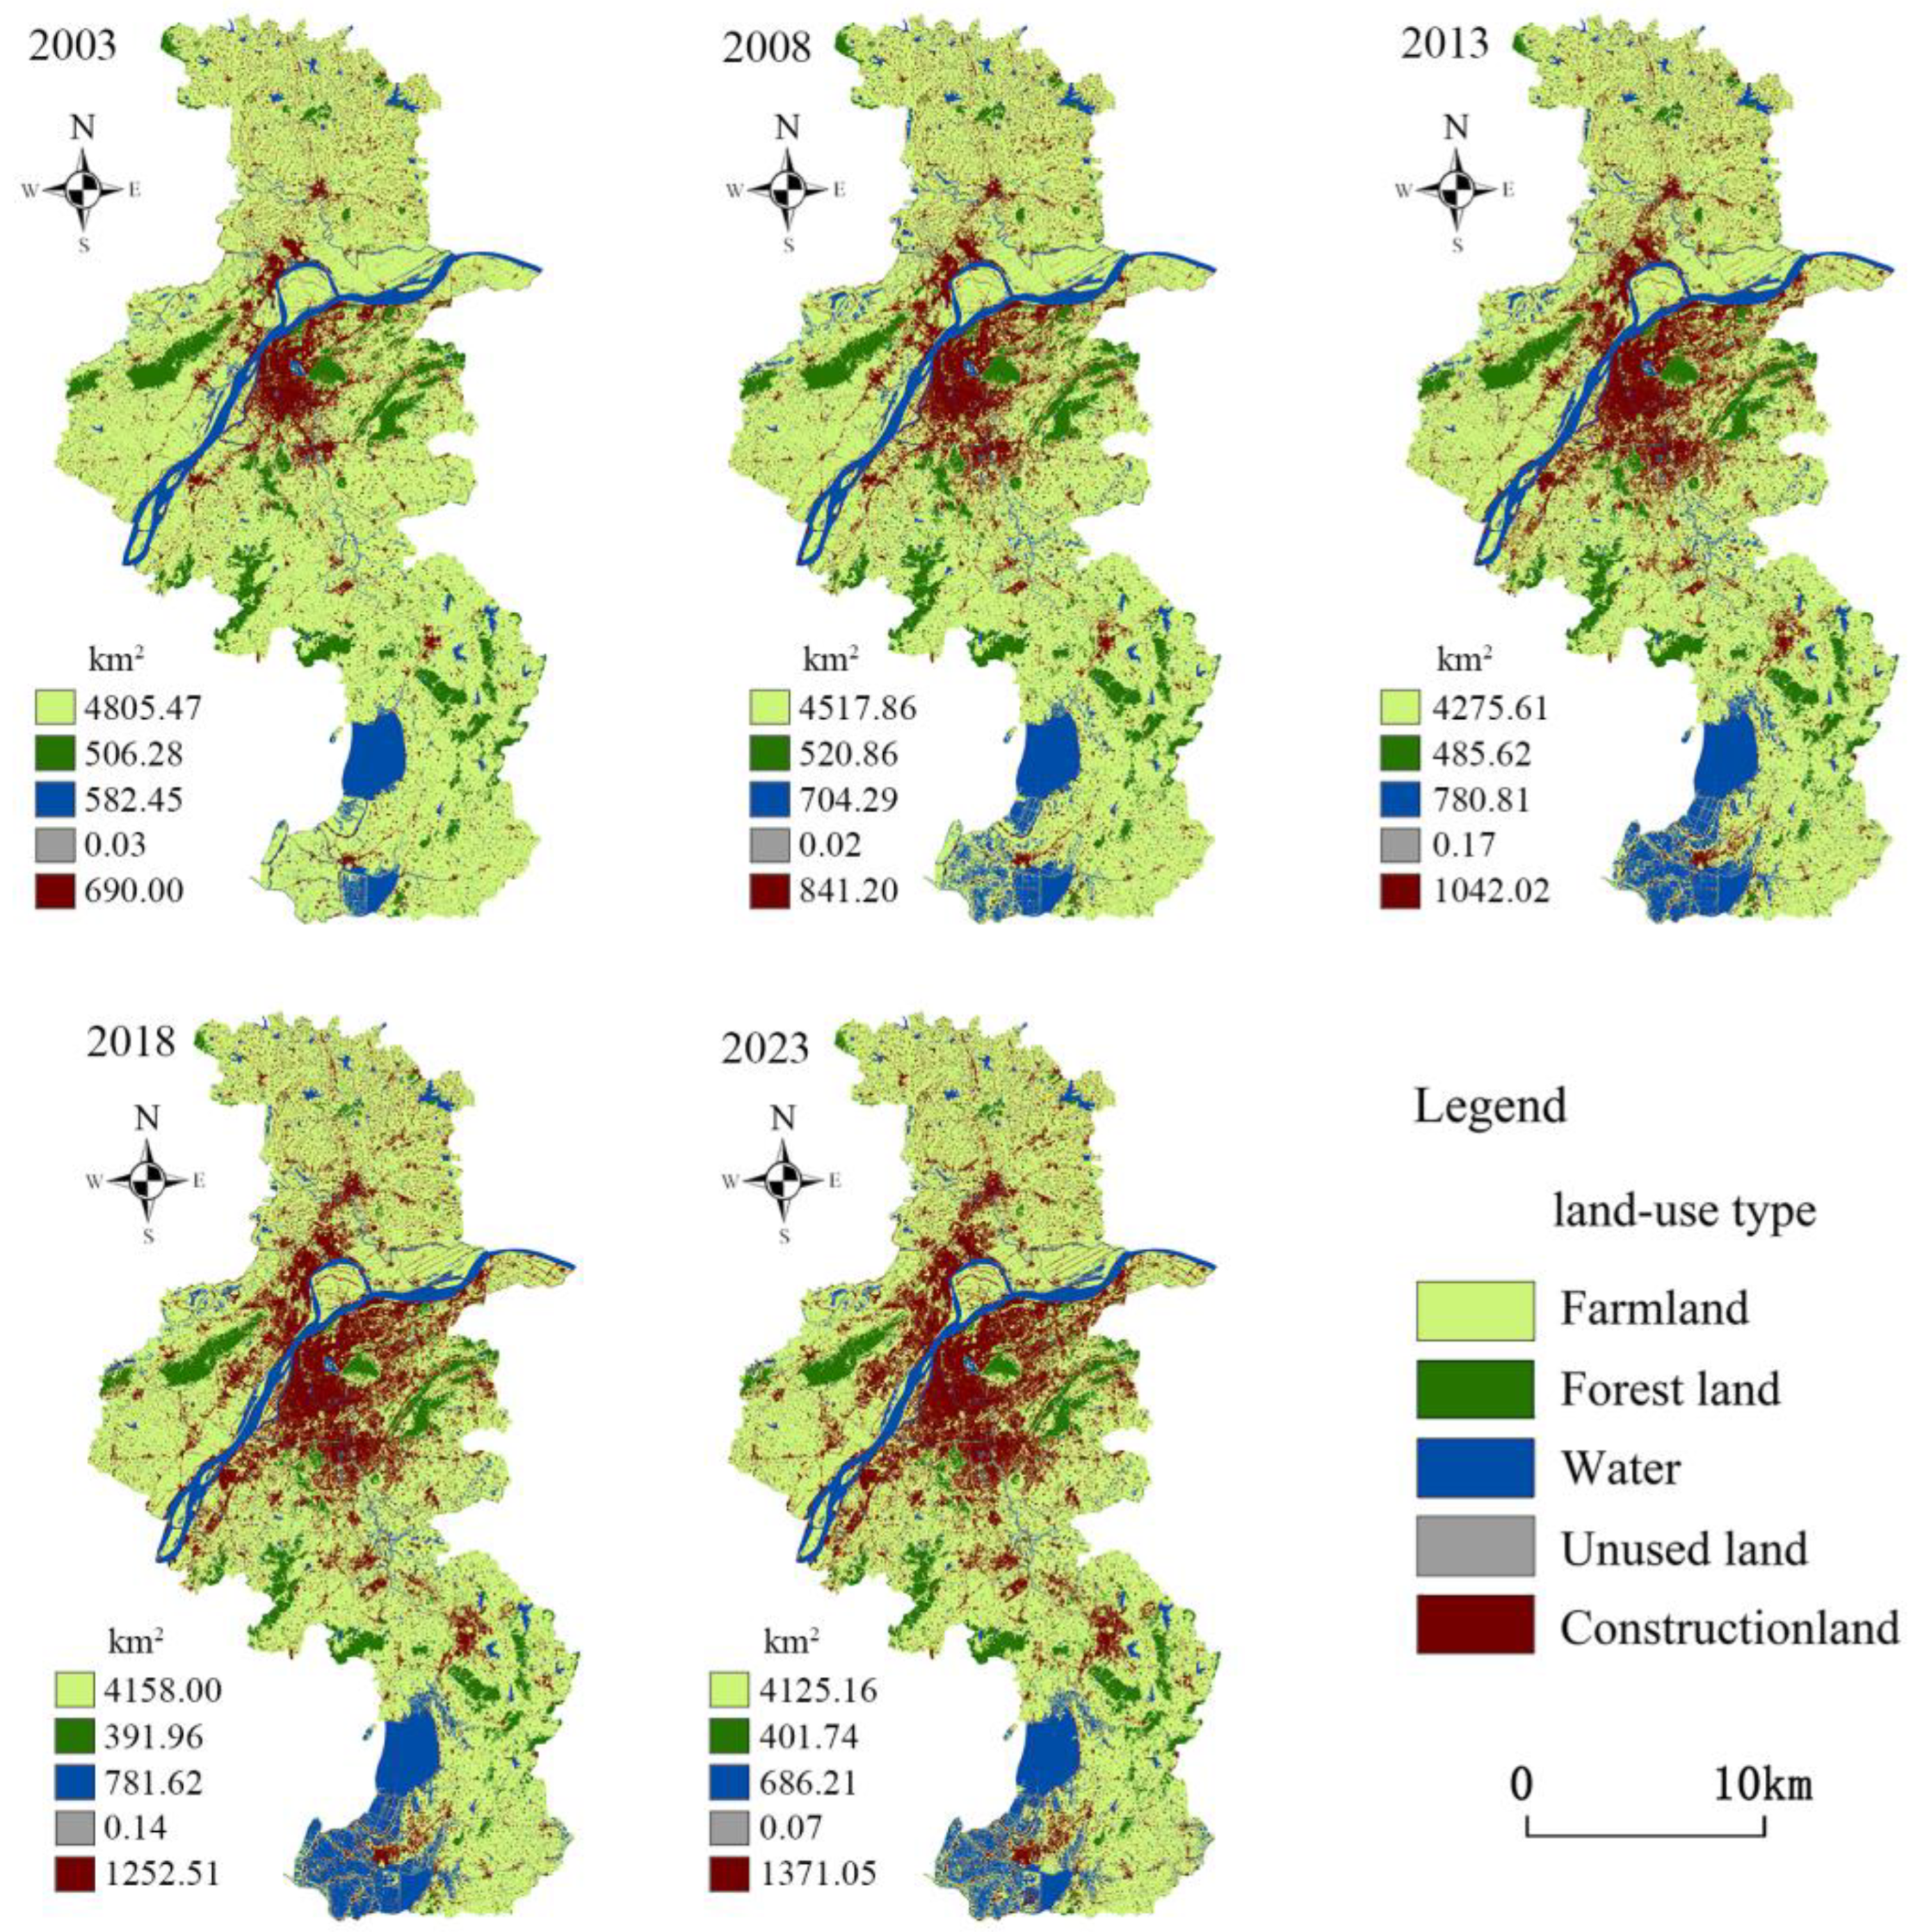
4.1. Spatial-Temporal Distribution of Land Use in Nanjing
4.1.1. Area of Various Types of Land and En
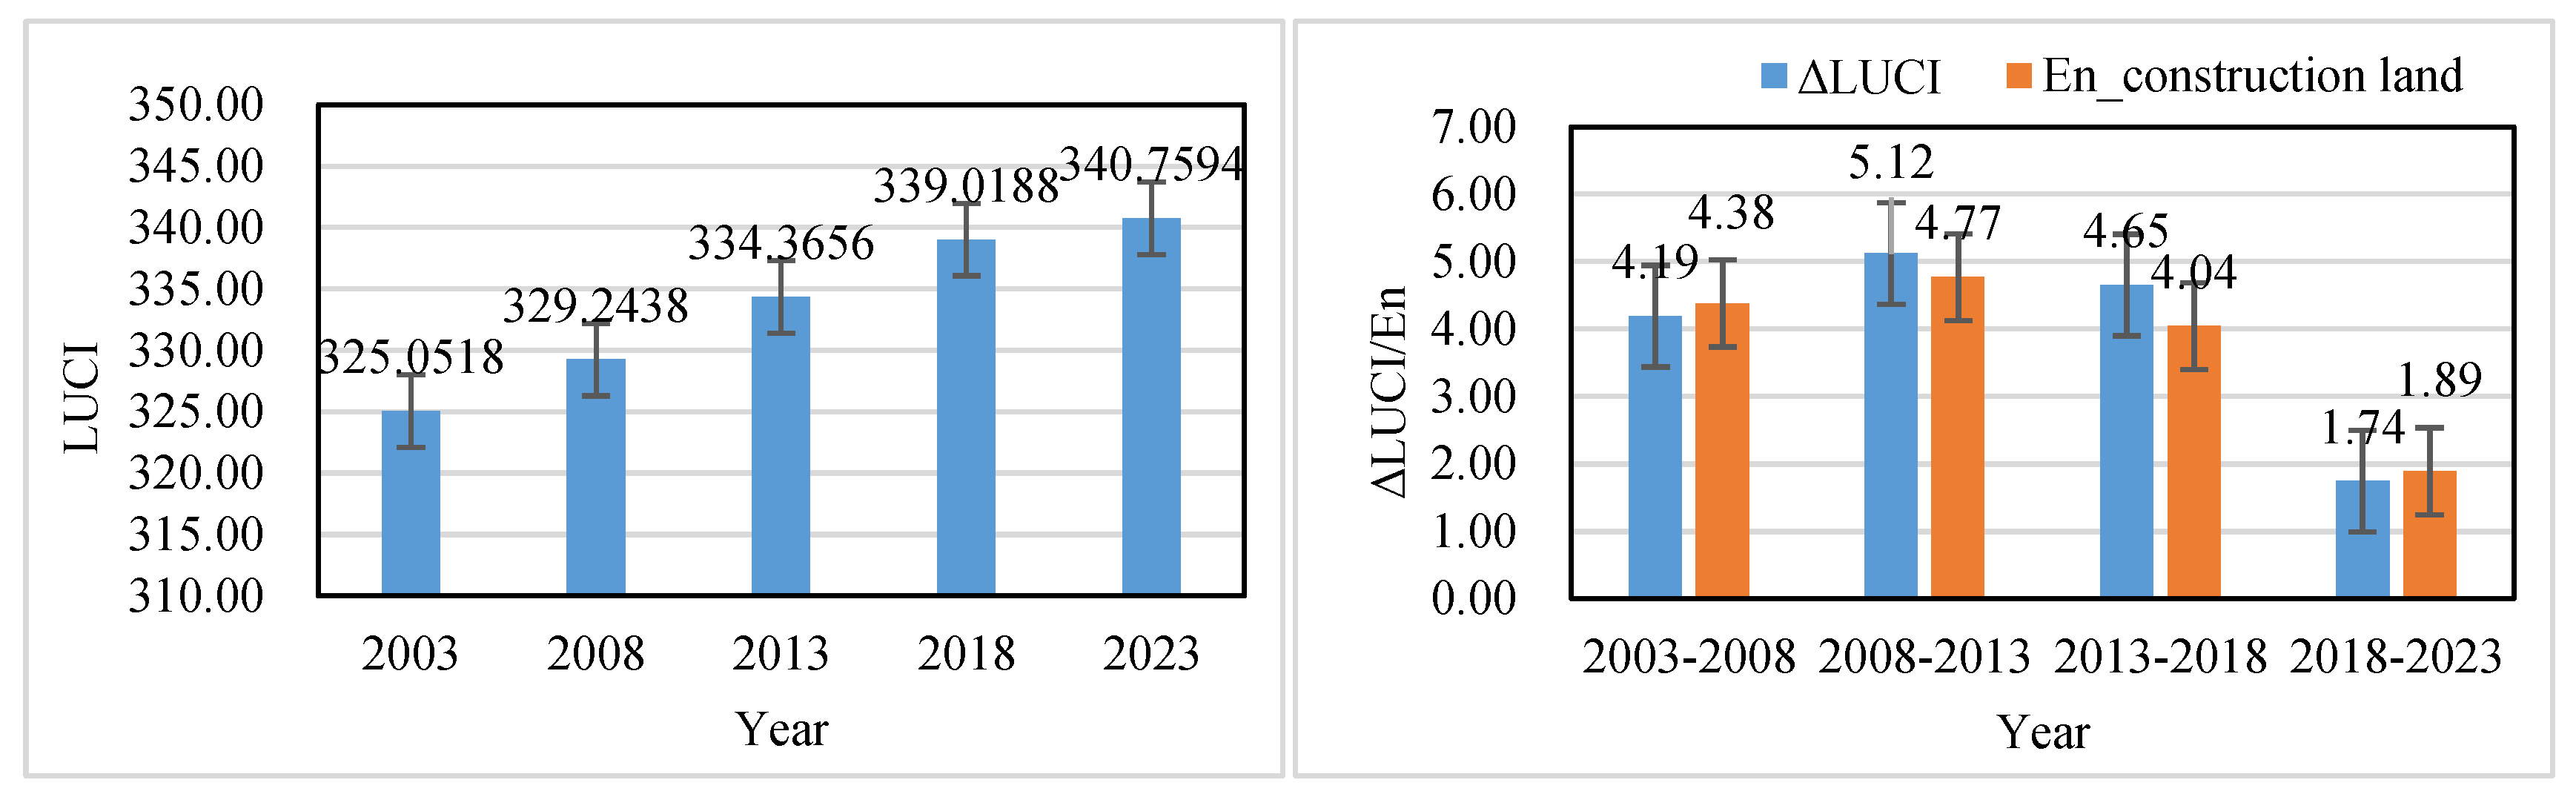
4.1.2. LUCI and ΔLUCI
4.1.3. Transfer of Land Use
4.2. Spatio-Temporal Changes in Ecological Quality
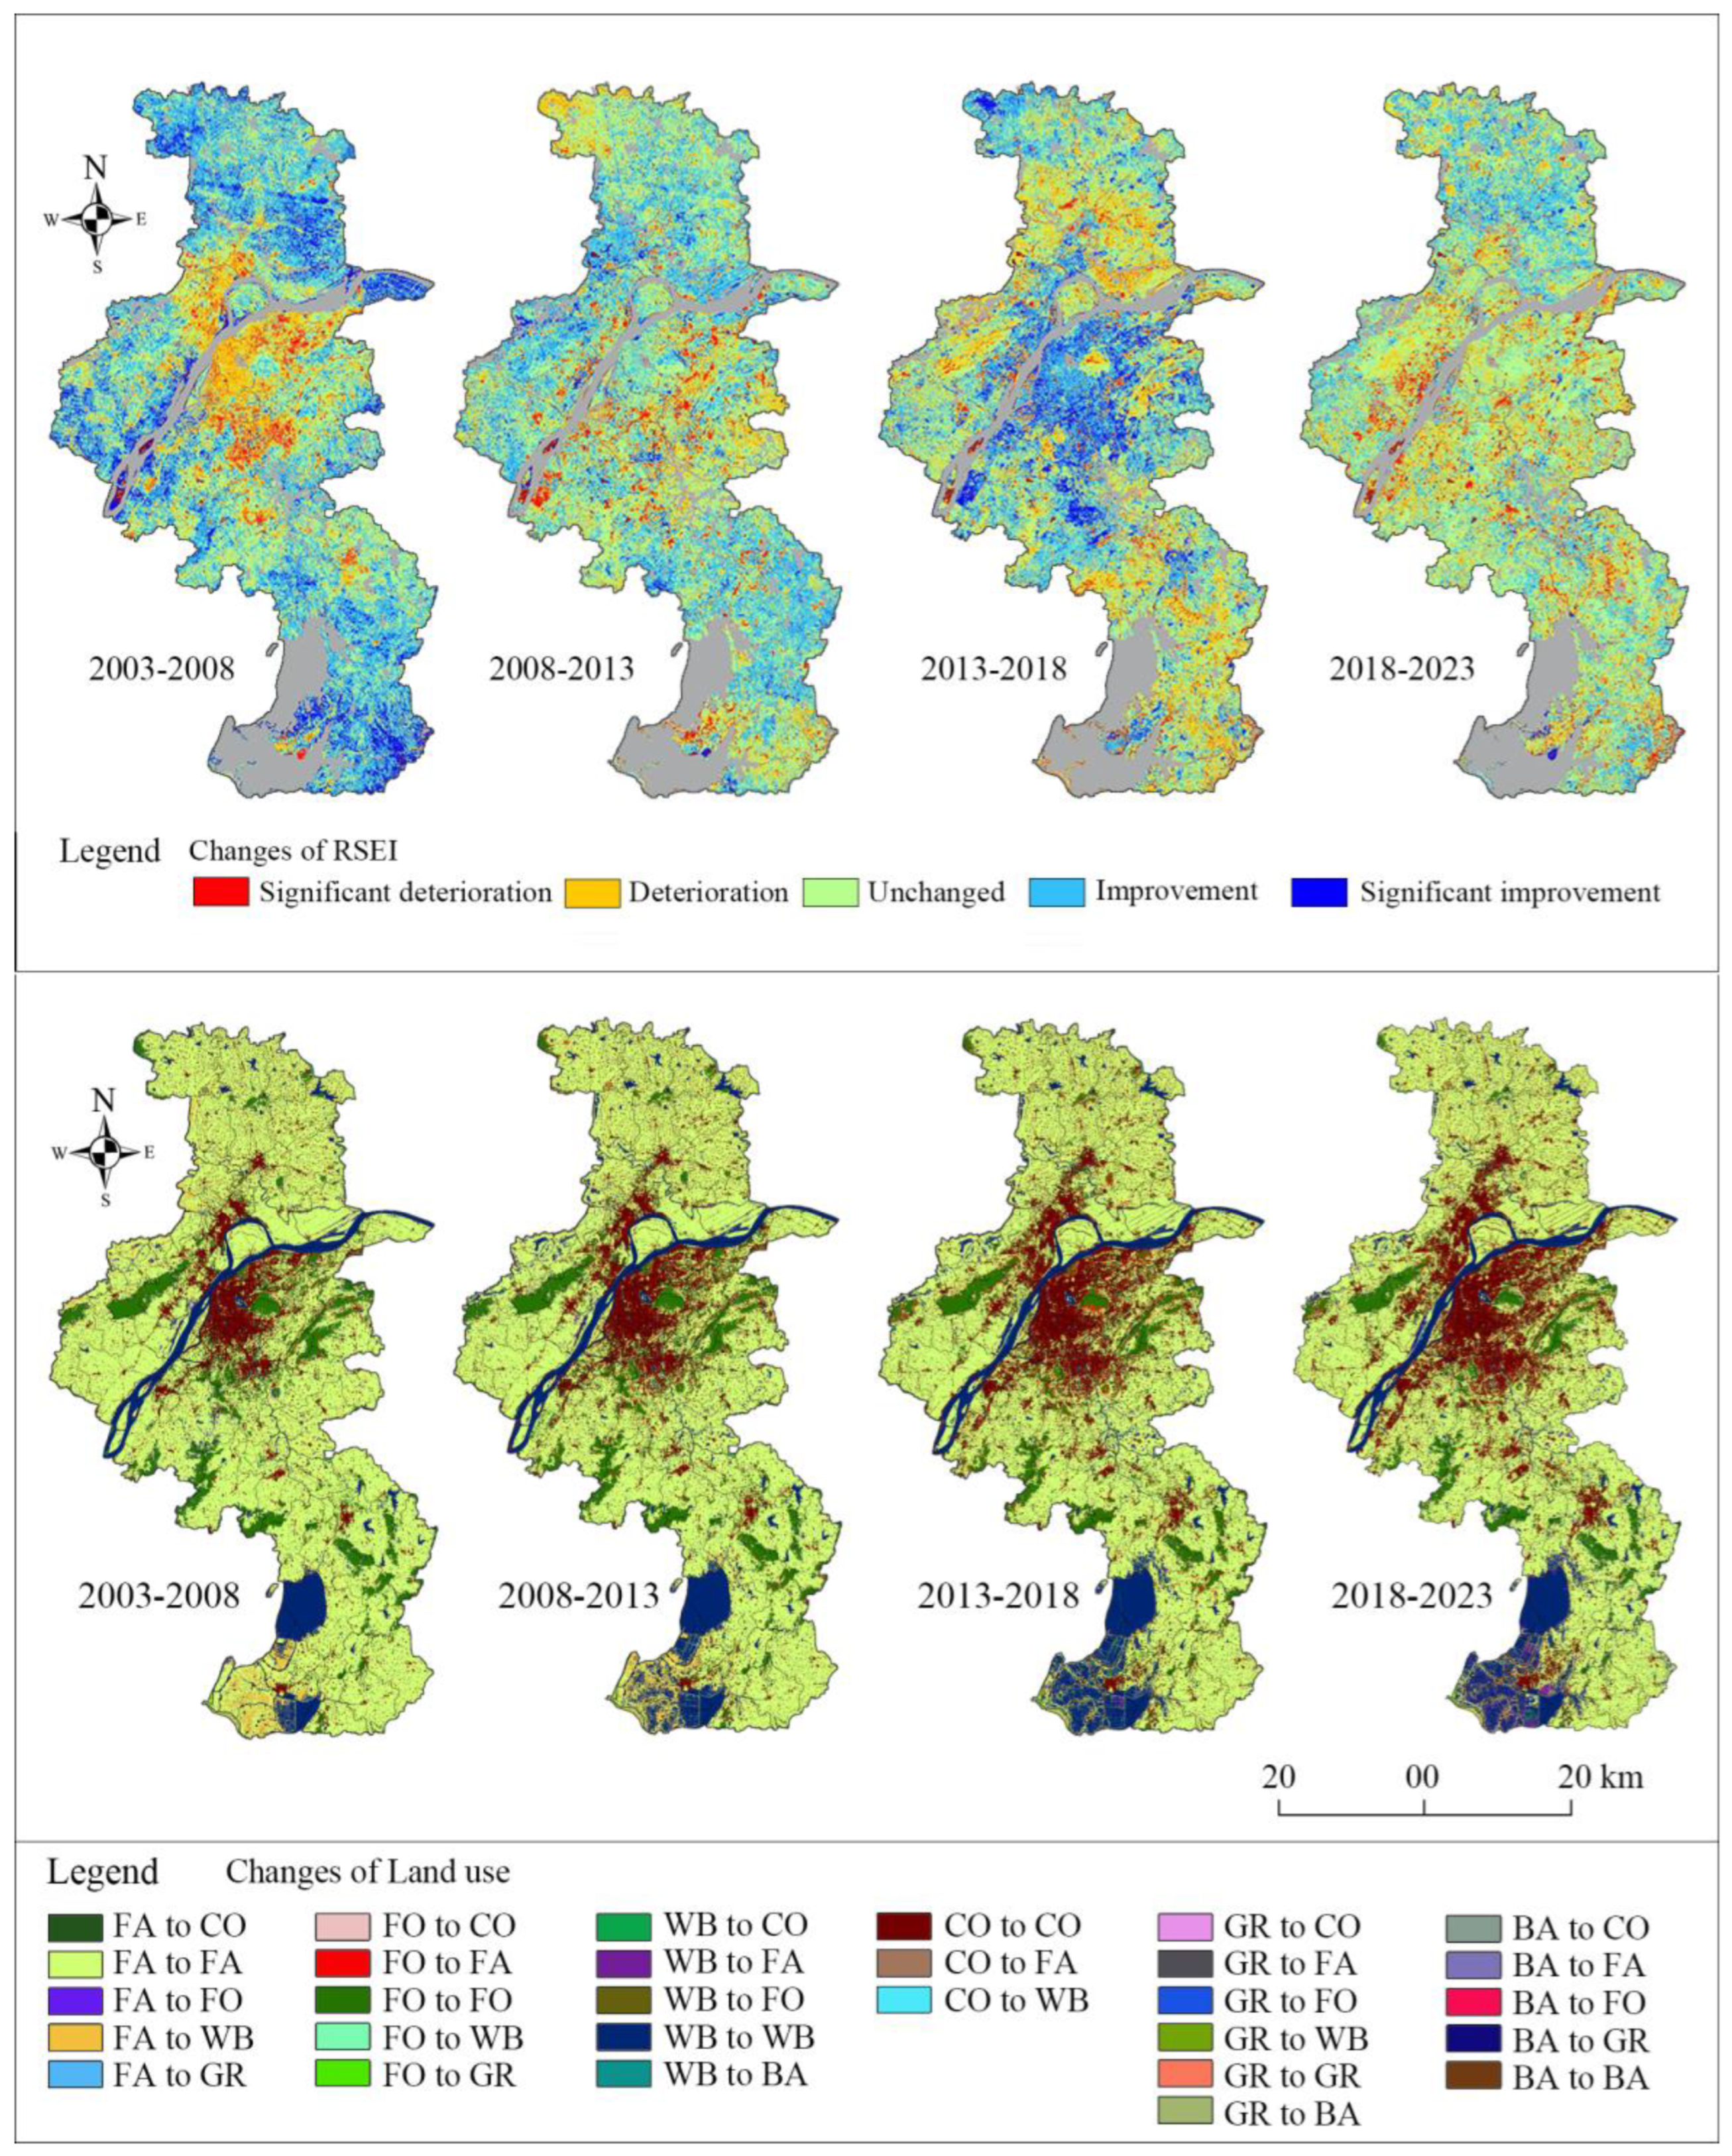
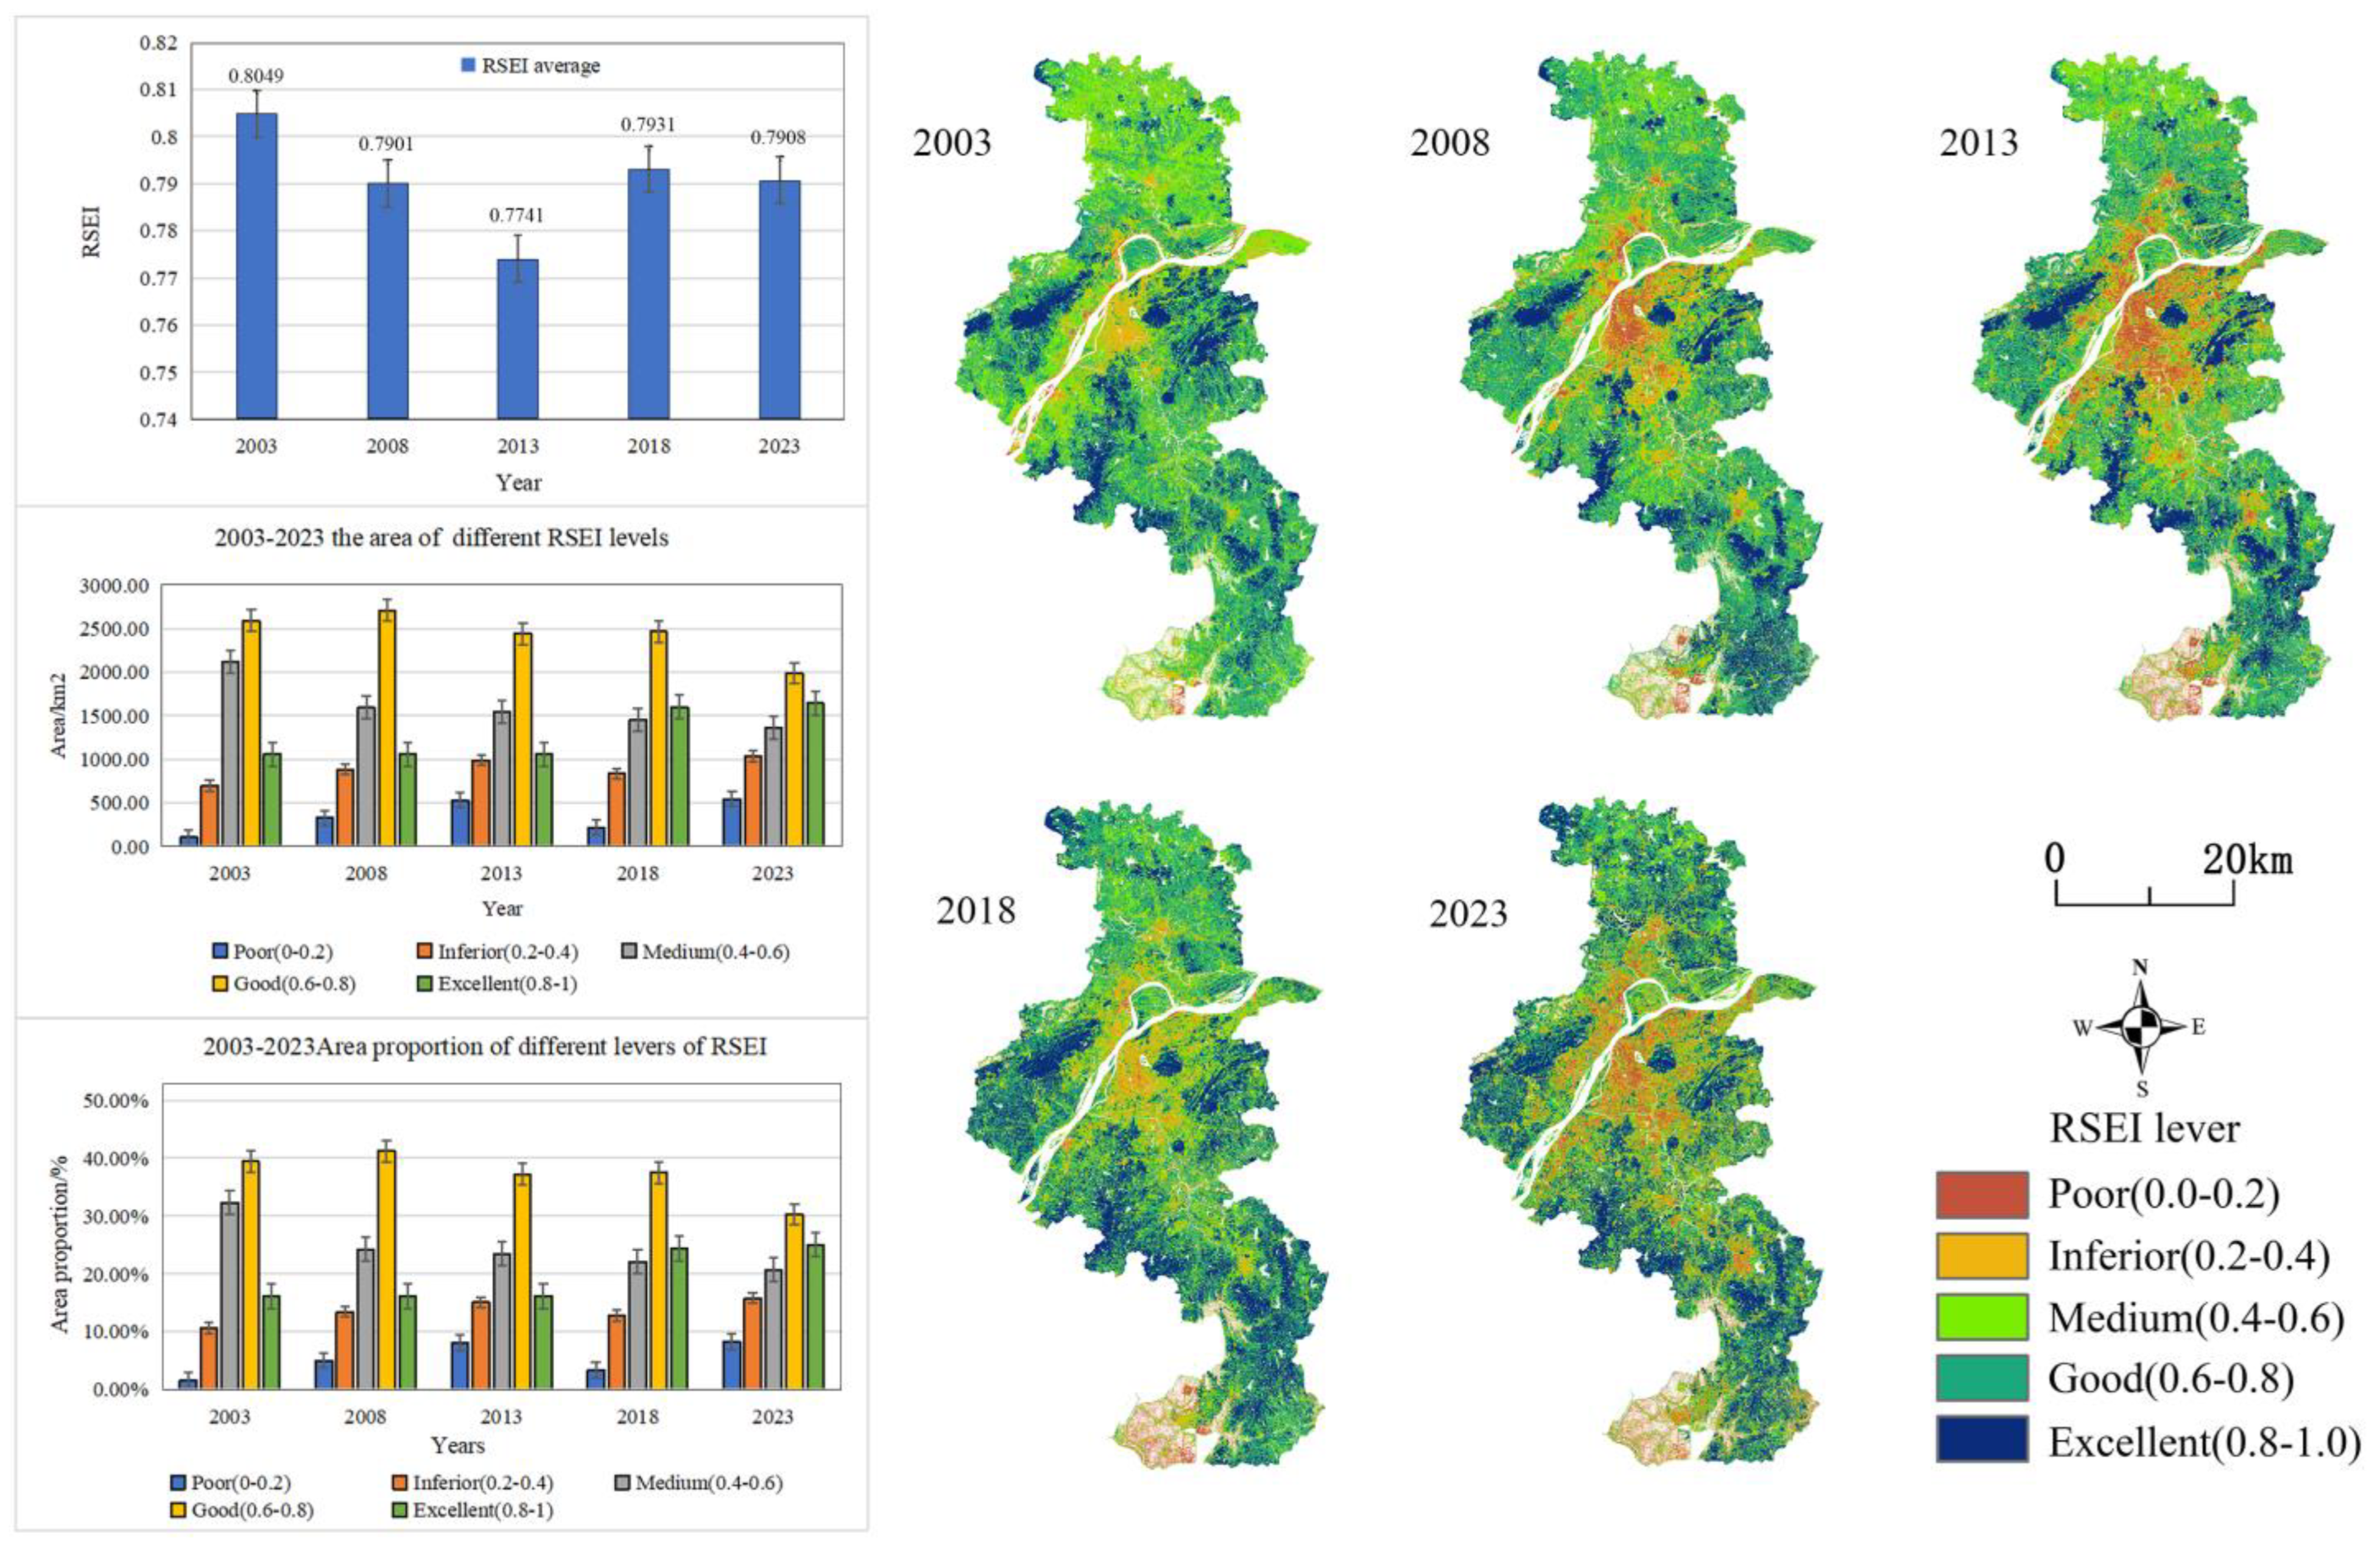
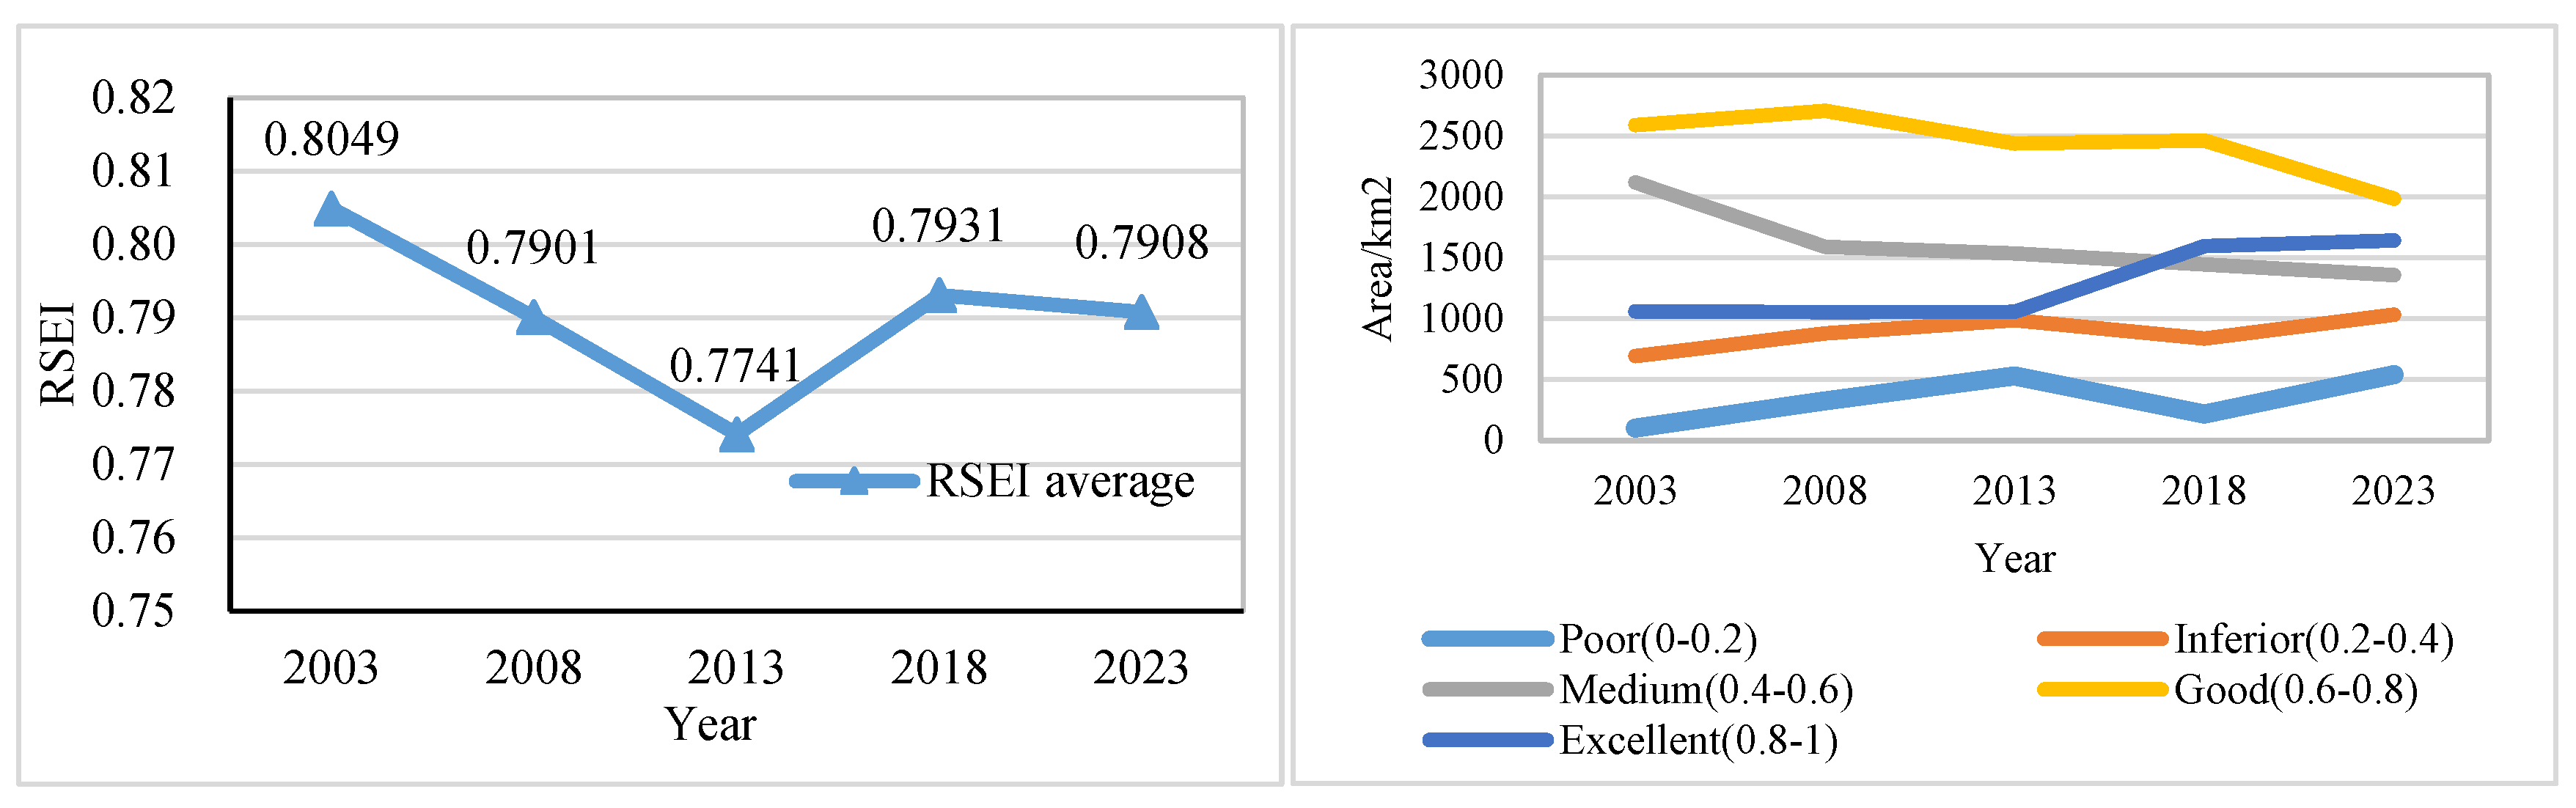
4.2.1. The Eco-Environmental Quality (RSEI) in Nanjing from 2003 to 2023
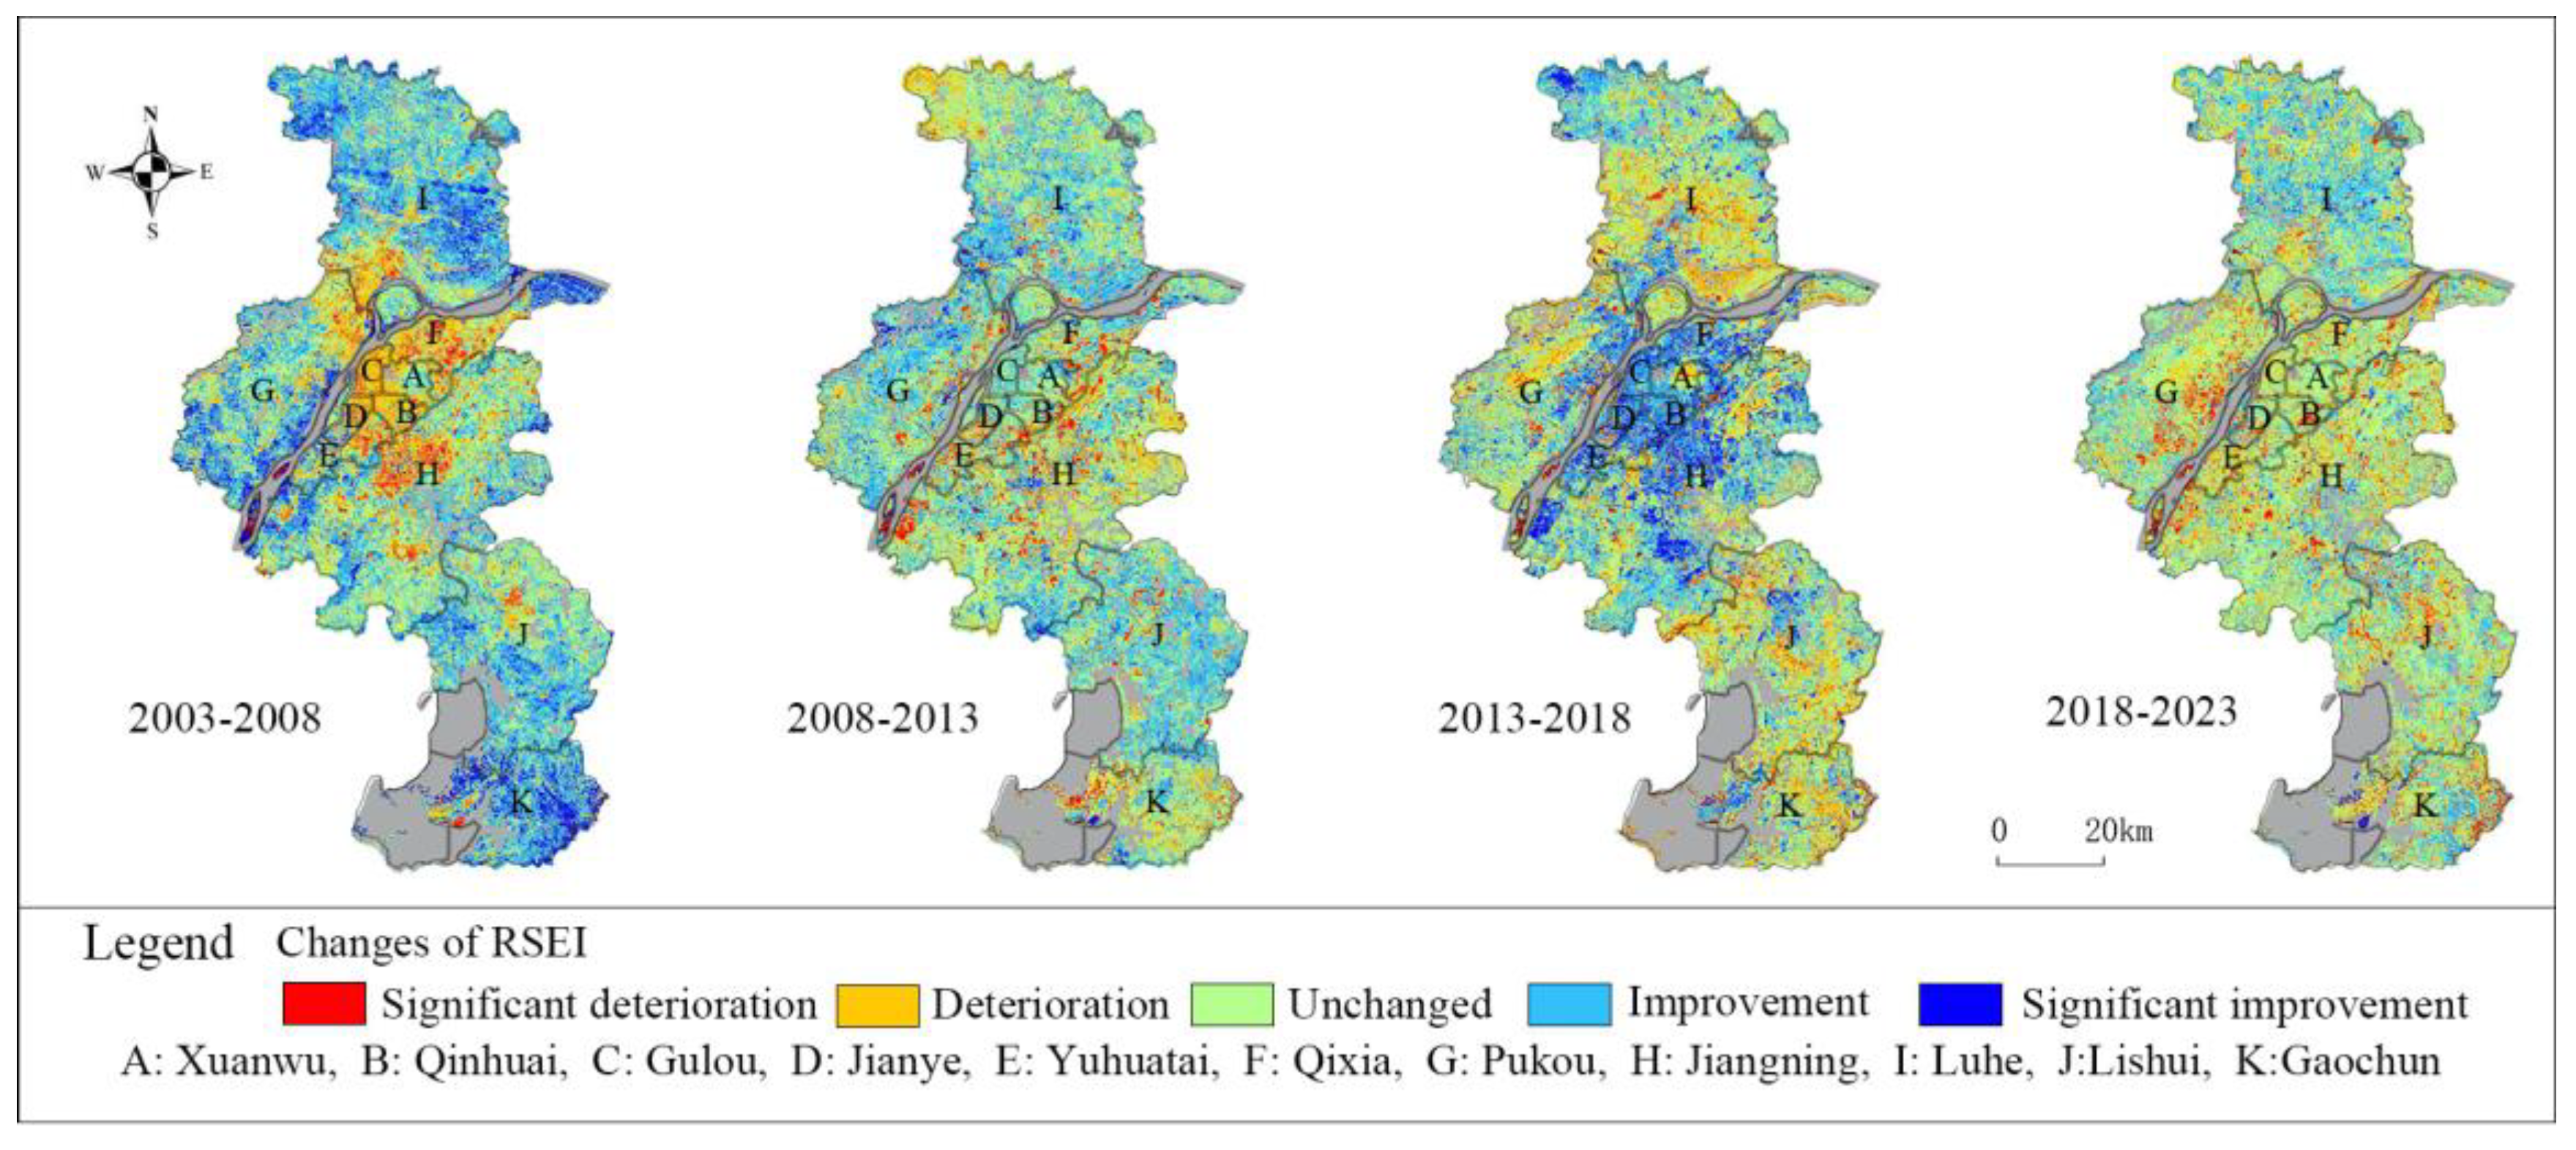
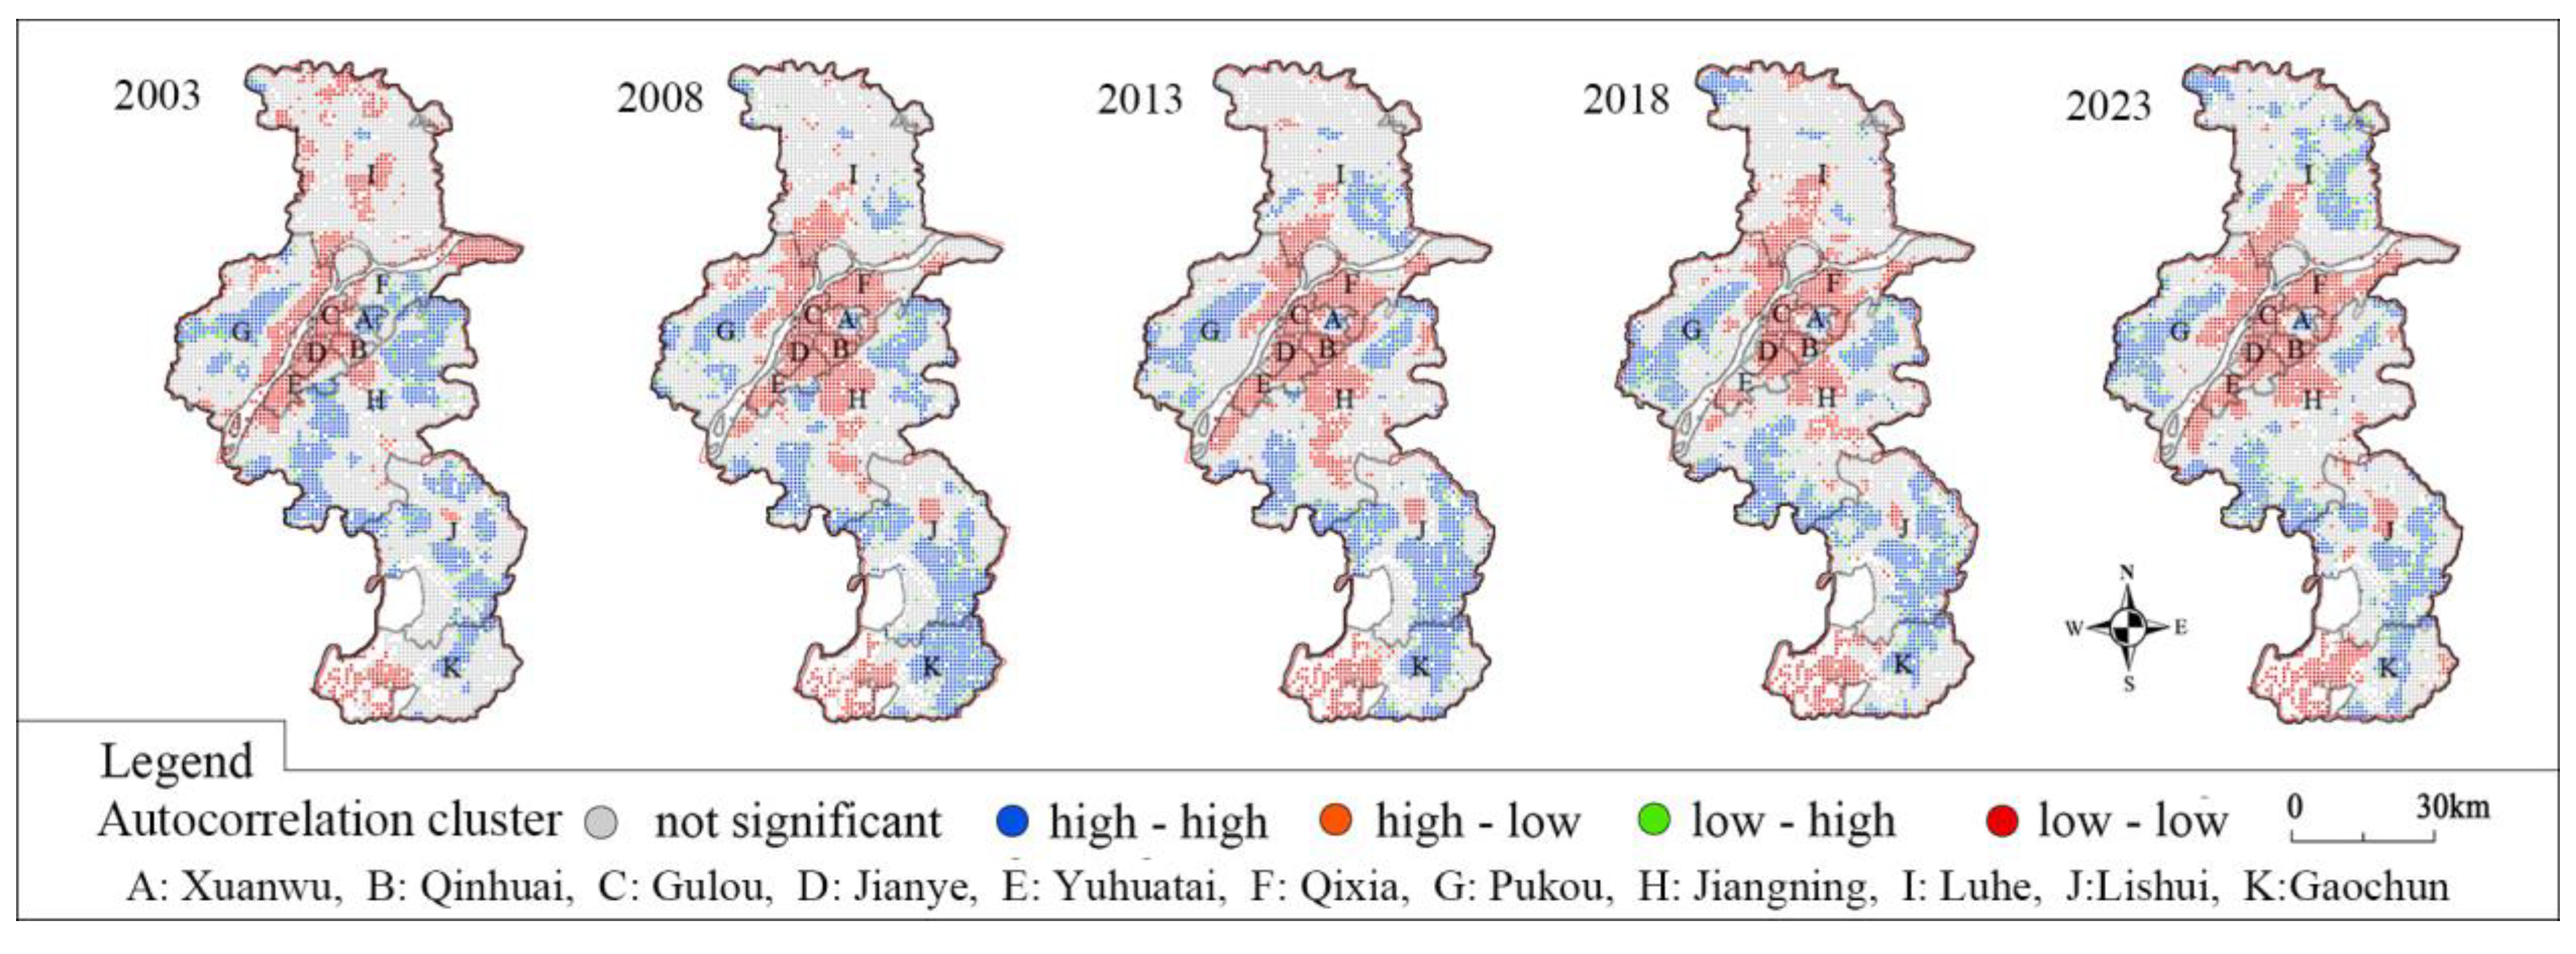
4.2.2. Spatio-Temporal Changes in RSEI in Nanjing from 2003 to 2023
4.3. Effects of Land-Use Changes Affecting Eco-Environment Quality
4.3.1. RSEI Differences of Land Types and PCA of RSEI
4.3.2. Correlation Analysis Between RSEI and Area of Land Types
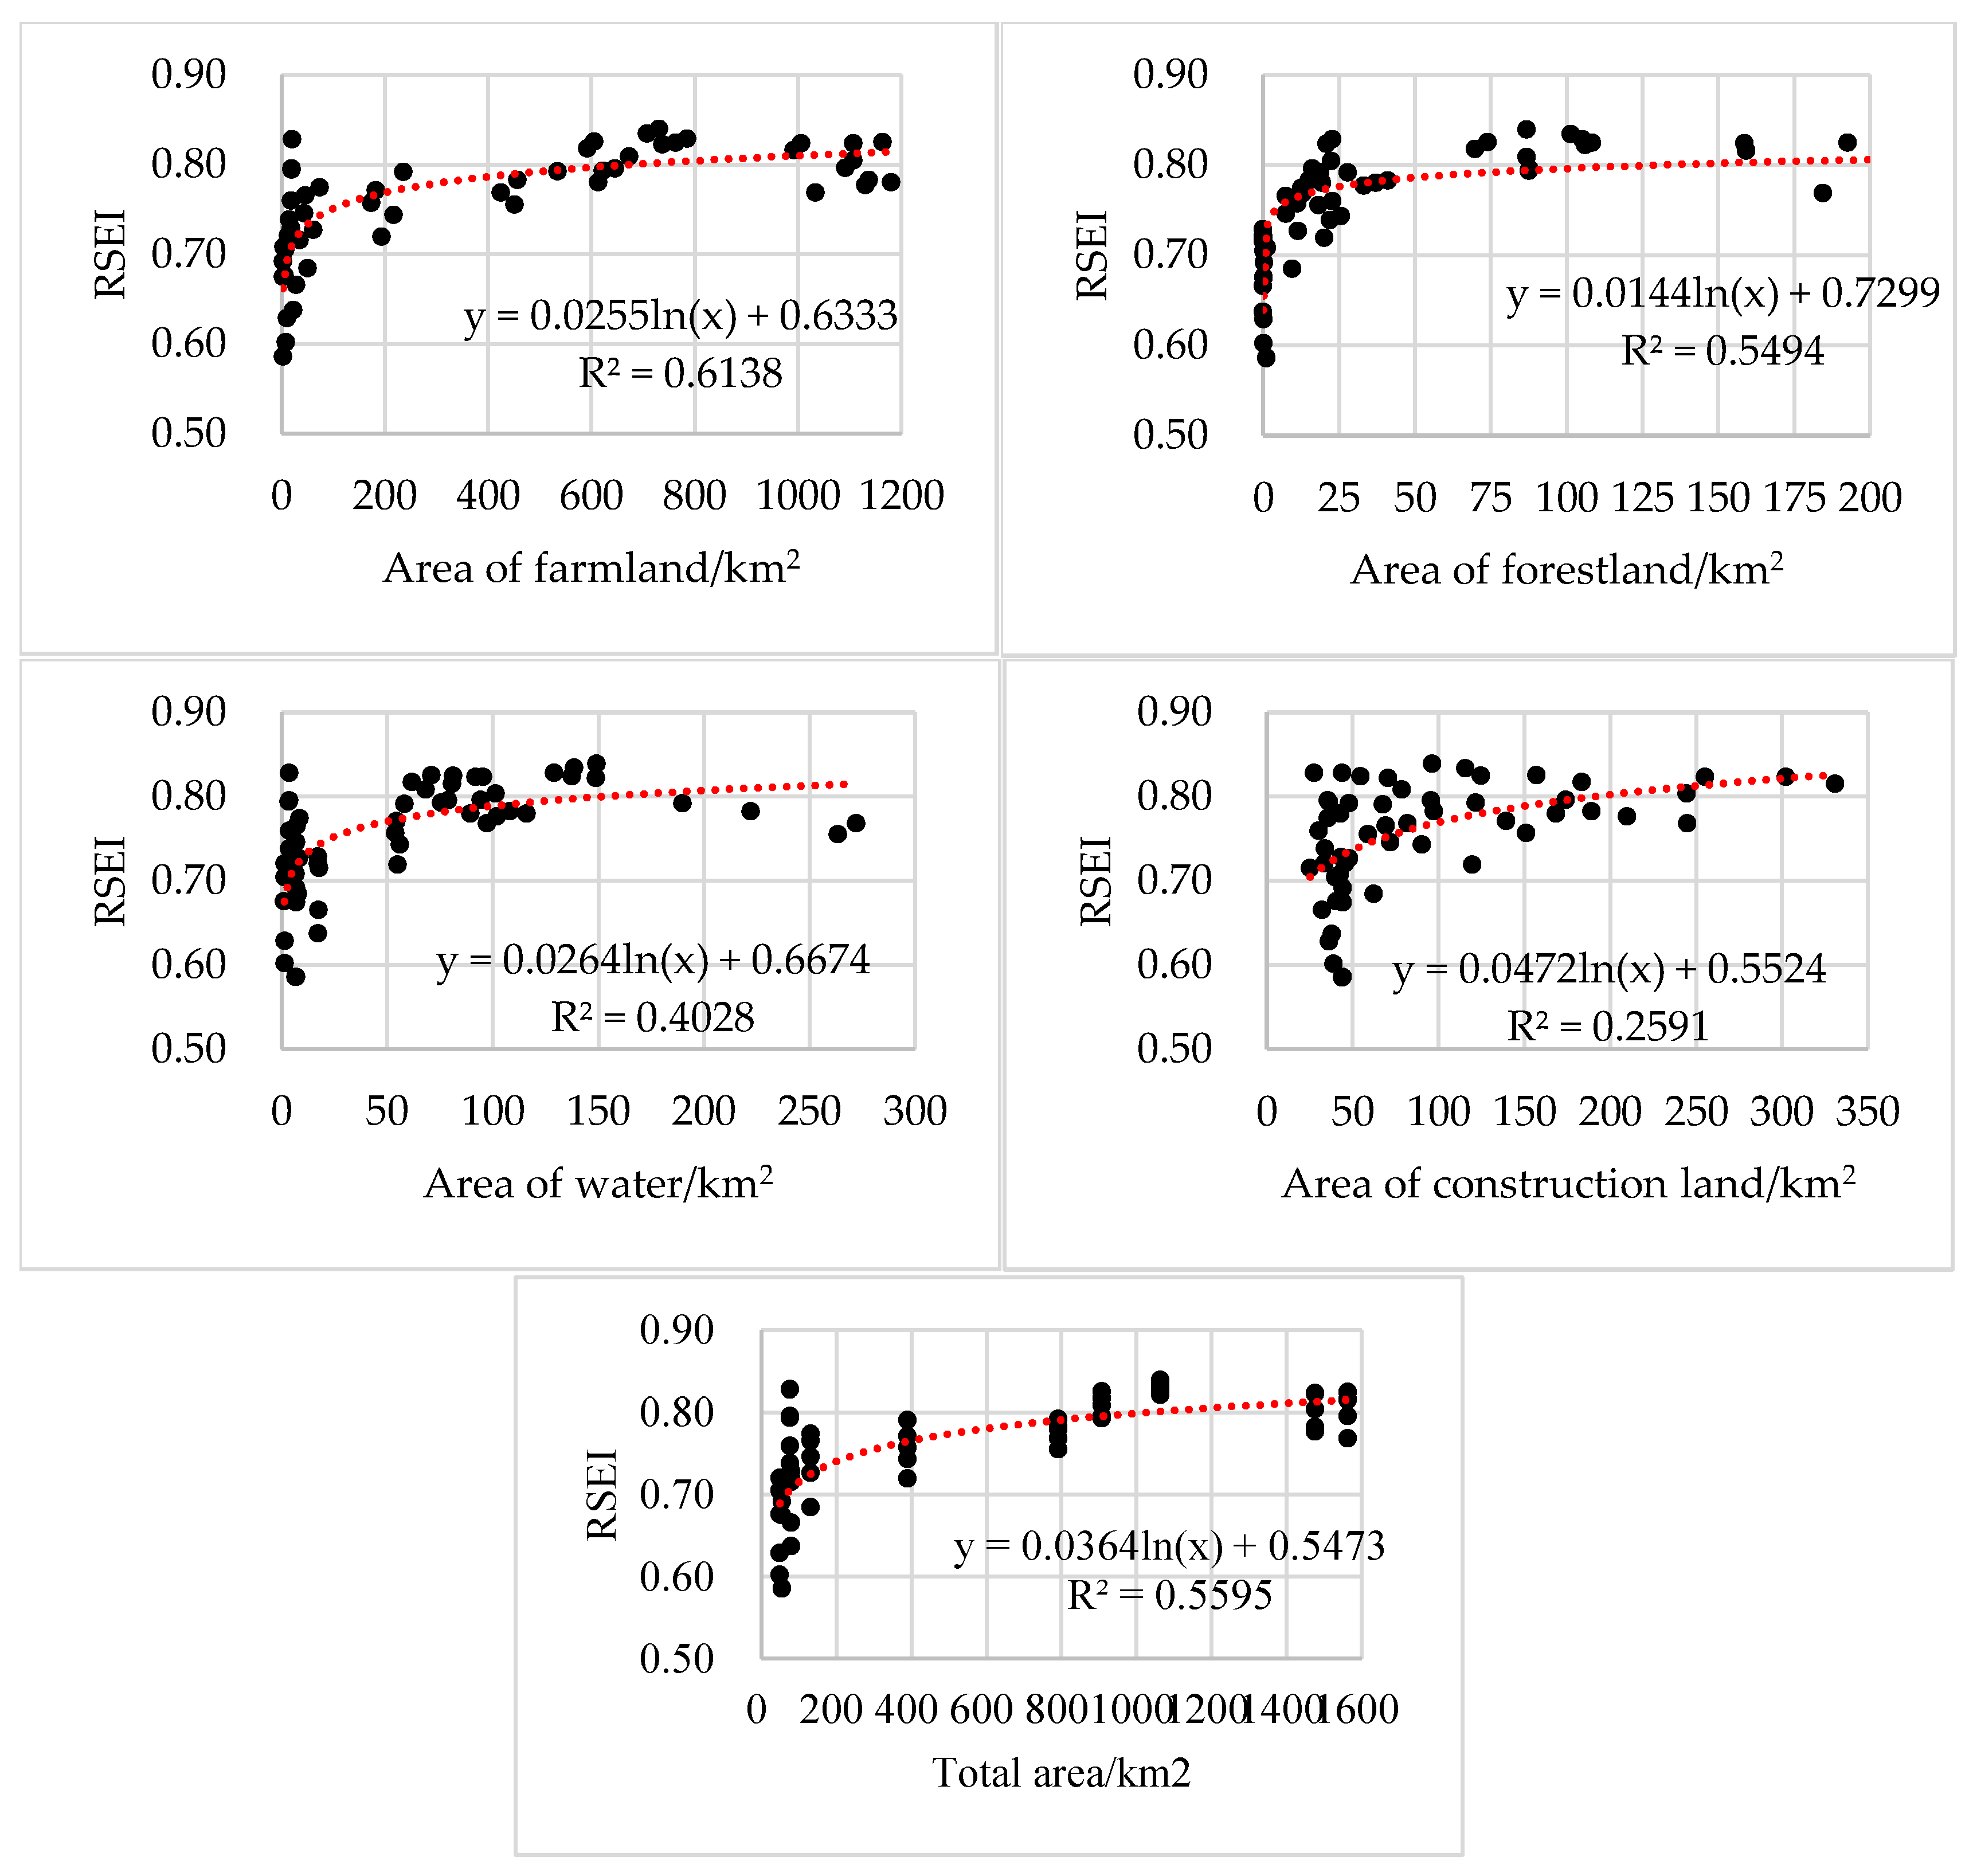
4.3.3. Regression Analysis Between RSEI and the Area of Various Land-Use Types
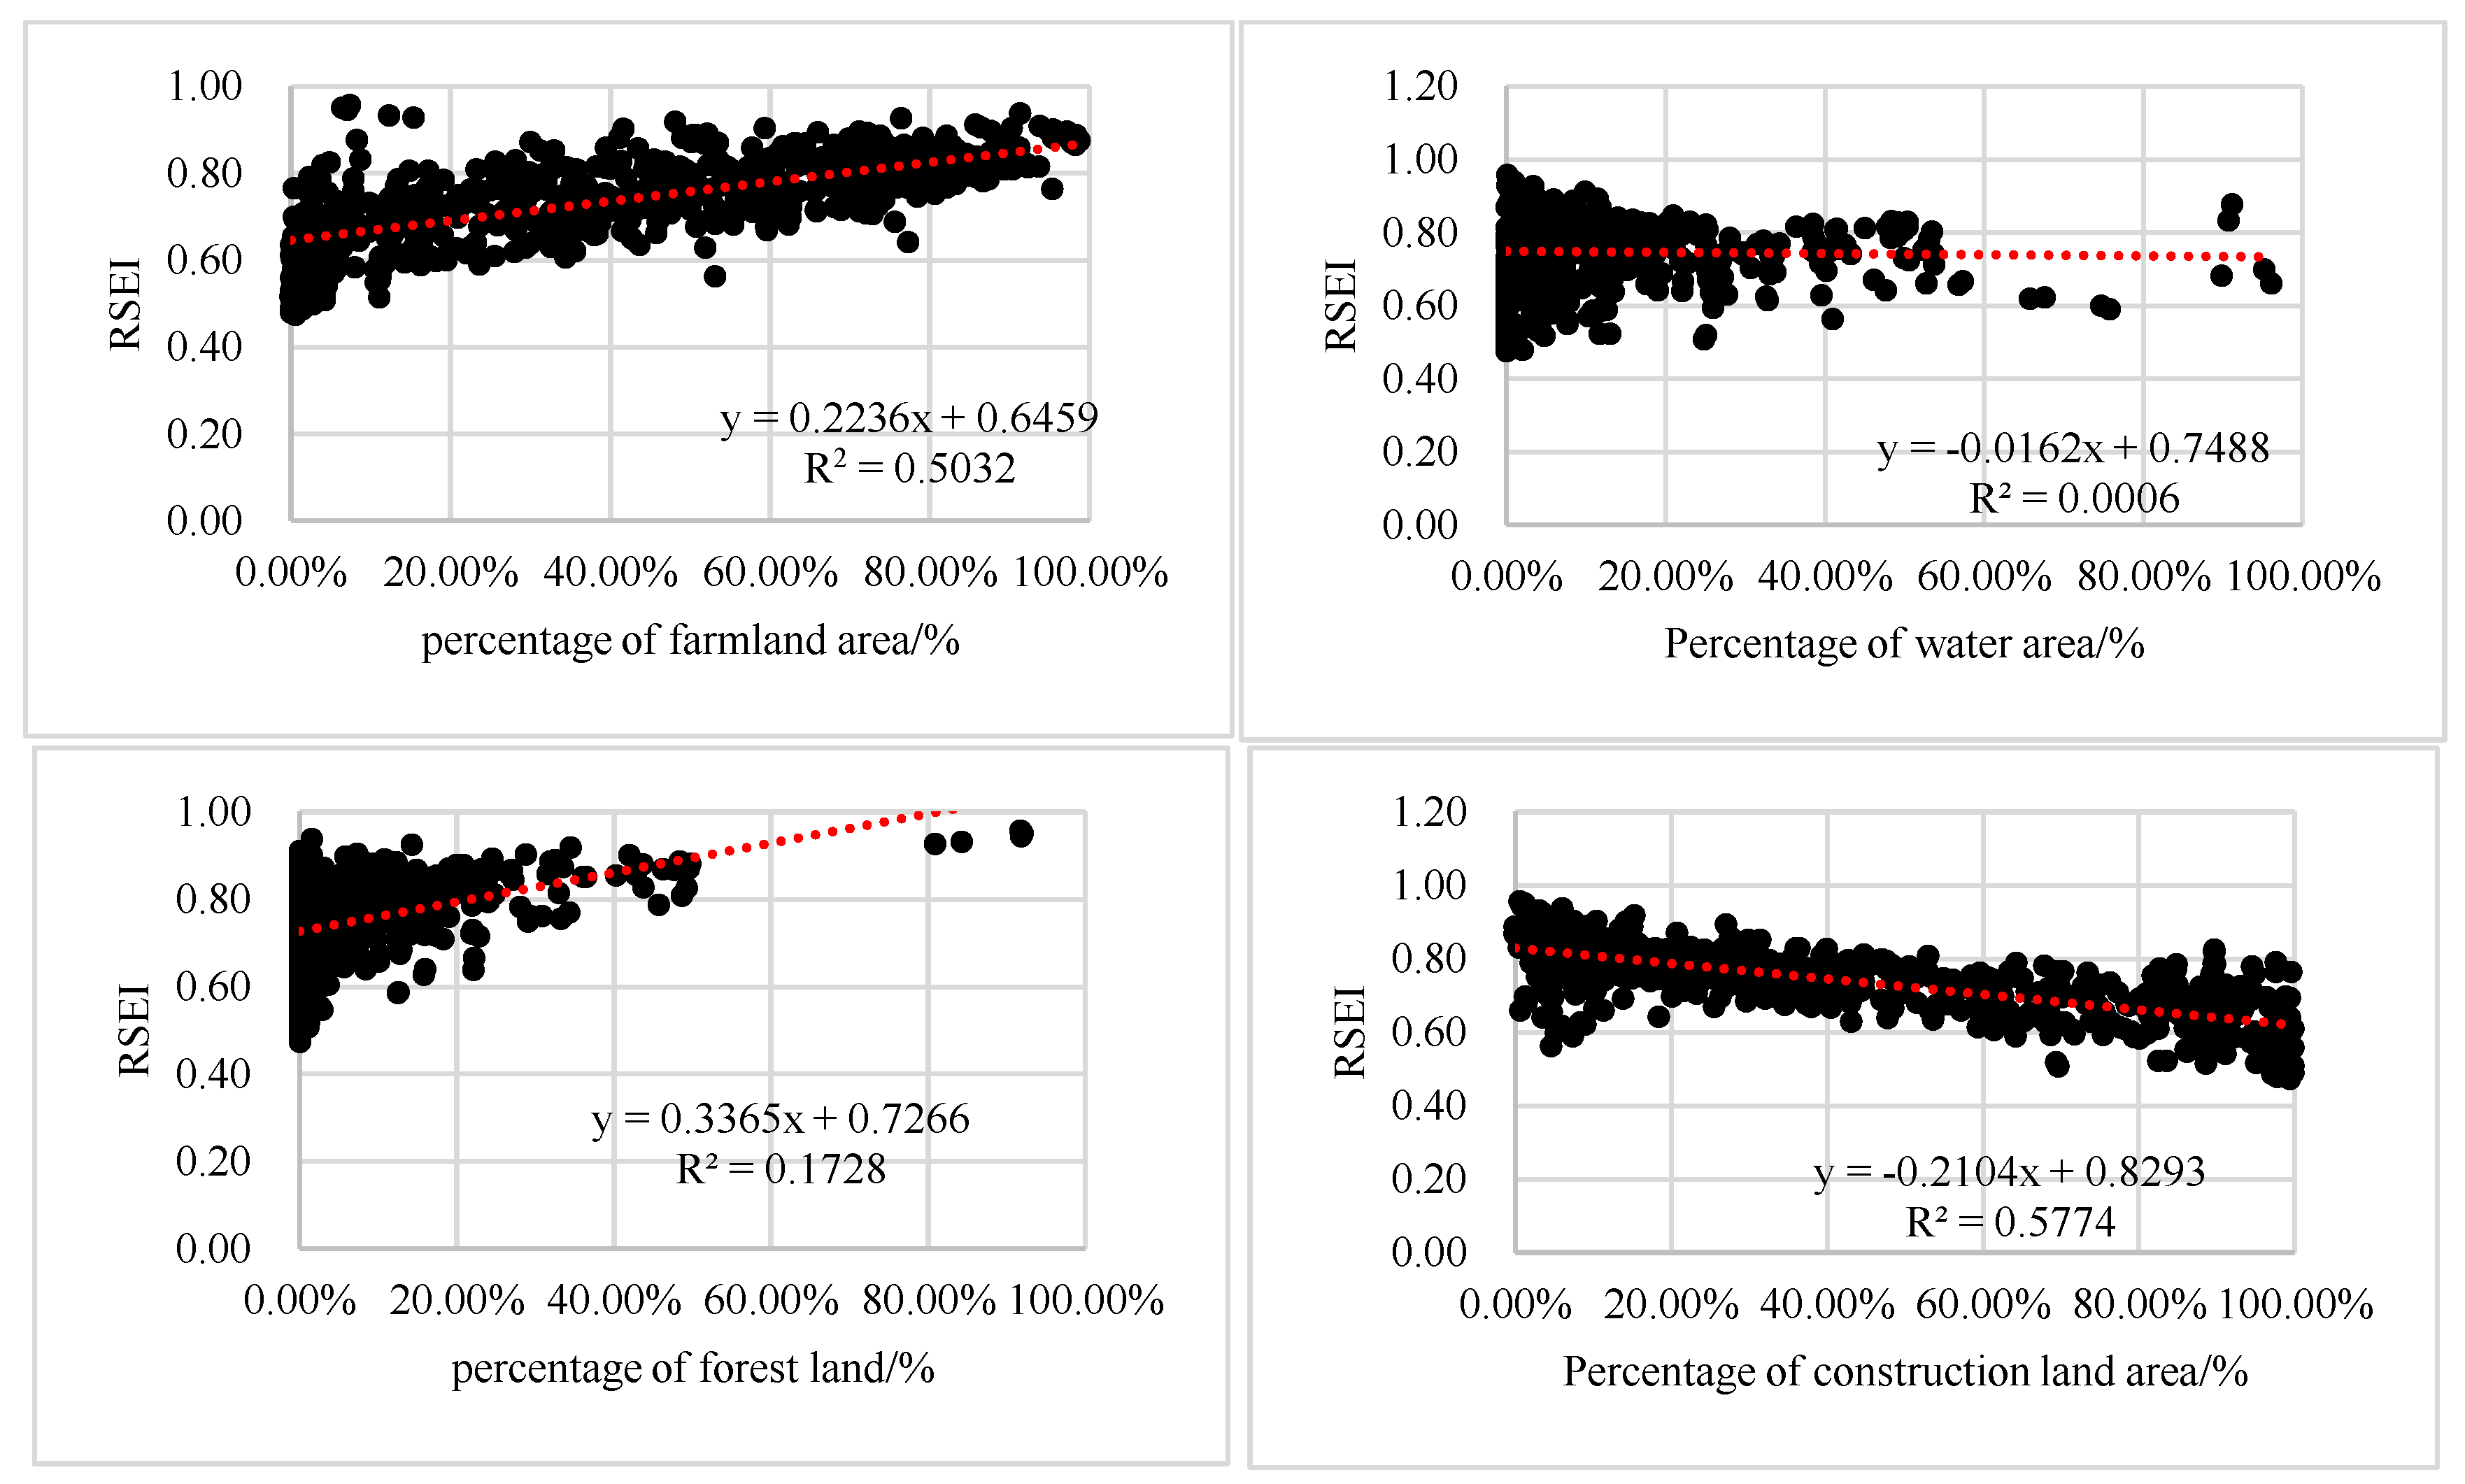
4.3.4. Regression Analysis Between RSEI and the Area Proportion of Various
Land-Use Types
4.3.5. Regression Analysis Between RSEI and LUCI
5. Discussion
5.1. Measurement and Inversion of Eco-Environmental Quality
5.2. Response of Ecological Environmental Quality to Land-Use Transfer
5.3. Optimization Suggestions for Land-Use Planning and Management in Nanjing
5.4. Limitations
- (1)
- Due to data source constraints, the 30 m land-use data, while capable of distinguishing most land-use types, does not effectively separate green spaces within constructed areas in urban centers, in particular the lack of fine-grained classification of urban green spaces, which affects the accuracy of data extraction. Future research could benefit from employing machine learning methods to classify land-use data with 1 m and sub-meter accuracy. In particular, fine-grained classification of urban green space has important value for obtaining accurate urban green space data and is an important research direction in the future [55].
- (2)
- The inversion of RSEI shows significant seasonal variations. Although this study attempts to use remote sensing data from the same or similar months, data source limitations affect consistency. Additionally, because RSEI cannot assess the ecological quality of water bodies, which significantly impacts overall ecological quality, the inversion model has inherent limitations and may incur errors. Future studies should focus on optimizing RSEI to address the inability to assess water bodies.
- (3)
- Regarding future predictions of land-use changes, this study’s projections are based on fitted models and trends from the past five years. These predictions may be influenced by other factors, potentially reducing accuracy. Future research should incorporate comprehensive land-use forecasting models such as FLUS and PLUS to enhance the robustness of predictions in subsequent studies [56,57].
6. Conclusions
- (1)
- From 2003 to 2023, Nanjing experienced significant changes in land area and utilization. Construction land saw the largest increase, while agricultural land faced the most substantial reduction. LUCI steadily increased, while RSEI continued to decrease.
- (2)
- RSEI can well reflect the eco-environmental quality of rapid urbanization areas. Significant correlations (p < 0.05) and spatial autocorrelations were observed between land use changes and RSEI fluctuations. High ecological quality primarily clusters in forested regions, while low-quality areas are mainly in built-up zones; rural and suburban areas exhibit better ecological quality than urban centers. This conclusion is similar to other studies [39,47,49]
- (3)
- Under the policy background of building ecological civilization and green high-quality development, the monitoring of land-use transfer and ecological environment quality is particularly important for the construction of digital cities in rapidly urbanizing areas. On the one hand, they can monitor the direction and quantity of all kinds of land transfer in real time so as to scientifically formulate the land-use indicators of all kinds of land and provide a theoretical basis for protecting cultivated land, limiting the excessive expansion of construction land and realizing sustainable development; On the other hand, using remote sensing technology to retrieve the regional ecological quality is of great practical value to discover the weak areas of ecological quality in time and eliminate ecological risks, which is worthy of promotion and application by local governments in daily land management.
Author Contributions
Funding
Institutional Review Board Statement
Informed Consent Statement
Data Availability Statement
Conflicts of Interest
References
- National Bureau of Statistics. National Data: Population Census Urbanization Rate in 2023. Official Website of the National Bureau of Statistics. Available online: https://data.stats.gov.cn/easyquery.htm?cn=C01 (accessed on 29 February 2024).
- Liu, J.Y.; Ning, J.; Kuang, W.H.; Xu, X.L.; Zhang, S.W.; Yan, C.Z.; Li, R.D.; Wu, S.X.; Hu, Y.F.; Du, G.M.; et al. Spatio-temporal patterns and characteristics of land-use change in China during 2010–2015. Acta Geogr. Sin. 2018, 73, 789–802. (In Chinese) [Google Scholar]
- Galecka-Drozda, A.; Raszeja, E.; Szczepanska, M.; Wilkaniec, A. Land cover changes in natura 2000 areas located in suburban zones: Planning problems in the context of environmental protection. Pol. J. Env.-Ment. Stud. 2019, 28, 587–595. [Google Scholar] [CrossRef] [PubMed]
- Li, M.R.; Abuduwailia, J.; Liu, W.; Feng, S.; Saparov, G.; Ma, L. Application of geographical detector and geographically weighted regression for assessing landscape ecological risk in the Irtysh River Basin, Central Asia. Ecol. Indic. 2024, 158, 111540. [Google Scholar] [CrossRef]
- Mohanrajan, S.N.; Loganathan, A.; Manoharan, P.; Alenizi, F.A. Fuzzy Swin transformer for Land Use/Land Cover change detection using LISS-III Satellite data. Earth Sci. Inform. 2024, 17, 1745–1764. [Google Scholar] [CrossRef]
- Tejasree, G.; Agilandeeswari, L. Land use/land cover (LULC) classification using deep-LSTM for hyperspectral images. Egypt. J. Remote Sens. Space Sci. 2024, 27, 52–68. [Google Scholar] [CrossRef]
- Zhang, Y.; Liu, Y.F.; Gu, J.P.; Ding, Q. Land use/land cover change and its environmental effects in Wuhan City. Sci. Geogr. Sin. 2011, 31, 1280–1285. (In Chinese) [Google Scholar]
- Deng, G.Y.; Jiang, H.B.; Zhu, S.Y.; Wen, Y.; He, C.G.; Wang, X.; Sheng, L.X.; Guo, Y.; Cao, Y.Y. Projecting the response of ecological risk to land use/land cover change in ecologically fragile regions. Sci. Total Environ. 2024, 914, 169908. [Google Scholar] [CrossRef]
- Zhao, J.L.; Yang, Z.Q.; Govers, G. Soil and water conservation measures reduce soil and water losses in China but not down to background levels: Evidence from erosion plot data. Geoderma 2019, 337, 729–741. [Google Scholar] [CrossRef]
- Kuang, W.H. National urban land-use/cover change since the beginning of the 21st century and its policy implications in China. Land Use Policy 2020, 97, 104747. [Google Scholar] [CrossRef]
- Wang, S.J.; Ma, H.T.; Zhao, Y.B. Exploring the relationship between urbanization and the eco-environment-A case study of Beijing-Tianjin-Hebei region. Ecol. Indic. 2014, 45, 171–183. [Google Scholar] [CrossRef]
- Liu, N.N.; Liu, C.Z.; Xia, Y.F.; Da, B.W. Examining the coordination between urbanization and eco-environment using coupling and spatial analyses: A case study in China. Ecol. Indic. 2018, 93, 1163–1175. [Google Scholar] [CrossRef]
- Lang, Y.Q.; Song, W. Quantifying and mapping the responses of selected ecosystem services to projected land use changes. Ecol. Indic. 2019, 102, 186–198. [Google Scholar] [CrossRef]
- Bryan, B.A.; Ye, Y.Q.; Zhang, J.E.; Connor, J.D. Land-use change impacts on ecosystem services value: Incorporating the scarcity effects of supply and demand dynamics. Ecosyst. Serv. 2018, 32, 144–157. [Google Scholar] [CrossRef]
- Salhi, A.; Benabdelouahab, S.; Bouayad, E.; Benabdelouahab, T.; Larifi, I.; El Mousaoui, M.; Acharrat, N.; Himi, M.; Ponsati, A.C. Impacts and social implications of land use-environment conflicts in a typical Mediterranean watershed. Sci. Total Environ. 2021, 764, 142853. [Google Scholar] [CrossRef] [PubMed]
- Xiong, Y.; Zhang, F. Effect of human settlements on urban thermal environment and factor analysis based on multi-source data: A case study of Changsha city. J. Geogr. Sci. 2021, 31, 819–838. [Google Scholar] [CrossRef]
- Grimm, N.B.; Faeth, S.H.; Golubiewski, N.E.; Redman, C.L.; Wu, J.G.; Bai, X.M.; Briggs, J.M. Global change and the ecology of cities. Science 2008, 319, 756–760. [Google Scholar] [CrossRef] [PubMed]
- Jin, G.; Shi, X.; He, D.W.; Guo, B.S.; Li, Z.H.; Shi, X.B. Designing a spatial pattern to rebalance the orientation of development and protection in Wuhan. J. Geogr. Sci. 2020, 30, 569–582. [Google Scholar] [CrossRef]
- Singh, P.; Kikon, N.; Verma, P. Impact of land use change and urbanization on urban heat island in Lucknow city, Central India. A remote sensing based estimate. Sustain. Cities Soc. 2017, 32, 100–114. [Google Scholar] [CrossRef]
- Chang, Q.L.; Sha, Y.Y.; Chen, Y. The Coupling Coordination and Influencing Factors of Urbanization and Ecological Resilience in the Yangtze River Delta Urban Agglomeration, China. Land 2024, 13, 111. [Google Scholar] [CrossRef]
- Du, W.X.; Wang, Y.X.; Qian, D.Y.; Lyu, X. Process and Eco-Environment Impact of Land Use Function Transition under the Perspective of “Production-Living-Ecological” Spaces-Case of Haikou City, China. Int. J. Environ. Res. Public Health 2022, 19, 16902. [Google Scholar] [CrossRef]
- Qi, J.C.; Liu, H.P.; Liu, X.P.; Zhang, Y.H. Spatiotemporal evolution analysis of time-series land use change using self-organizing map to examine the zoning and scale effects. Comput. Environ. Urban Syst. 2019, 76, 11–23. [Google Scholar] [CrossRef]
- Wang, H.; Wan, Q.N.; Huang, W.; Niu, J.Q. Spatial heterogeneity characteristics and driving mechanism of land use change in Henan Province, China. Geocarto Int. 2023, 38, 2271442. [Google Scholar] [CrossRef]
- Zhao, Y.B.; Wang, S.J.; Zhou, C.S. Understanding the relation between urbanization and the eco-environment in China’s Yangtze River Delta using an improved EKC model and coupling analysis. Sci. Total Environ. 2016, 571, 862–875. [Google Scholar] [CrossRef] [PubMed]
- Xu, H.Q. Research on extracting water information using improved normalized difference water index (MNDWI). J. Remote Sens. 2005, 9, 589–595. [Google Scholar]
- Anasuya, B.; Swain, D.; Vinoj, V. Rapid urbanization and associated impacts on land surface temperature changes over Bhubaneswar Urban District, India. Environ. Monit. Assess. 2020, 191, 790. [Google Scholar] [CrossRef] [PubMed]
- Ariken, M.; Zhang, F.; Liu, K.; Fang, C.L.; Kung, H.T. Coupling coordination analysis of urbanization and eco-environment in Yanqi Basin based on multi-source remote sensing data. Ecol. Indic. 2020, 114, 106331. [Google Scholar] [CrossRef]
- Guo, B.B.; Fang, Y.L.; Jin, X.B. Monitoring the effects of land consolidation on the ecological environmental quality based on remote sensing: A case study of Chaohu Lake Basin, China. Land Use Policy 2020, 95, 104569. [Google Scholar] [CrossRef]
- Xu, H.Q. A remote sensing urban ecological index and its application. Acta Ecol. Sin. 2013, 33, 7853–7862. [Google Scholar]
- Cui, E.Q.; Ren, L.J.; Sun, H.Y. Evaluation of variations and affecting factors of eco-environmental quality during urbanization. Environ. Sci. Pollut. Res. 2015, 22, 3958–3968. [Google Scholar] [CrossRef]
- Song, Y.Y.; Xue, D.Q.; Dai, L.H.; Wang, P.T.; Huang, X.G.; Xia, S.Y. Land cover change and eco-environmental quality response of different geomorphic units on the Chinese Loess Plateau. J. Arid Land 2020, 12, 29–43. [Google Scholar] [CrossRef]
- Yue, H.; Liu, Y.; Li, Y.; Lu, Y. Eco-environmental quality assessment in China’s 35 major cities based on remote sensing ecological index. IEEE Access 2019, 7, 51295–51311. [Google Scholar] [CrossRef]
- Sun, R.; Wu, Z.X.; Chen, B.Q.; Yang, C.; Qi, D.L.; Lan, G.Y.; Fraedrich, K. Effects of land-use change on eco-environmental quality in Hainan Island, China. Ecol. Indic. 2020, 109, 105777. [Google Scholar] [CrossRef]
- Fang, C.L.; Liu, H.M.; Li, G.D. International progress and evaluation on interactive coupling effects between urbanization and the eco-environment. J. Geogr. Sci. 2016, 26, 1081–1116. [Google Scholar] [CrossRef]
- Zhang, T.Z.; Gao, Y.; Li, C.; Xie, Z.; Chang, Y.Y.; Zhang, B.L. How human activity has changed the regional habitat quality in an eco-economic zone: Evidence from Poyang Lake Eco-Economic Zone, China. Int. J. Environ. Res. Public Health 2020, 17, 6253. [Google Scholar] [CrossRef] [PubMed]
- The Official Website of Nanjing Municipal Statistics Bureau, China. Available online: https://tjj.nanjing.gov.cn/tjxx/ (accessed on 9 October 2024).
- Yang, J.; Huang, X. The 30 m annual land cover dataset and its dynamics in China from 1990 to 2019. Earth Syst. Sci. Data 2021, 13, 3907–3925. [Google Scholar] [CrossRef]
- Brown, C.F.; Brumby, S.P.; Guzder-Williams, B.; Birch, T.; Hyde, S.B.; Mazzariello, J.; Czerwinski, W.; Pasquarella, V.J.; Haertel, R.; Ilyushchenko, S.; et al. Dynamic world, near real-time global 10 m land use land cover mapping. Sci. Data 2022, 9, 251. [Google Scholar] [CrossRef]
- China Geo-Spatial Data Cloud. Available online: http://www.gscloud.cn/search (accessed on 8 October 2024).
- Hu, C.; Song, M.; Zhang, A.L. Dynamics of the eco-environmental quality in response to land use changes in rapidly urbanizing areas: A case study of Wuhan, China from 2000 to 2018. J. Geogr. Sci. 2023, 33, 245–265. [Google Scholar] [CrossRef]
- He, Y. Construction of qualitative assessment model of ecological environment quality under river safety remediation. Int. J. Environ. Technol. Manag. 2024, 27, 400–414. [Google Scholar] [CrossRef]
- Rikimaru, A.; Roy, P.S.; Miyatake, S. Tropical forest cover density mapping. Trop. Ecol. 2002, 43, 39–47. [Google Scholar]
- Wang, H.; Liu, X.M.; Zhao, C.Y.; Chang, Y.P.; Liu, Y.Y.; Zang, F. Spatial-temporal pattern analysis of landscape ecological risk assessment based on land use/land cover change in Baishuijiang National nature reserve in Gansu Province, China. Ecol. Indic. 2021, 124, 107454. [Google Scholar] [CrossRef]
- Zhang, J.; Yang, L.P.; Gong, E.J.; Wang, Y.; Ren, J.; Liu, M. Dynamic monitoring of eco-environment quality in Xi’an base on GEE and adjusted RSEI. Acta Ecol. Sin. 2023, 43, 2114–2127. (In Chinese) [Google Scholar]
- Mondal, J.; Basu, T.; Das, A. Application of a novel remote sensing ecological index (RSEI) based on geographically weighted principal component analysis for assessing the land surface ecological quality. Environ. Sci. Pollut. Res. Int. 2024, 31, 32350–32370. [Google Scholar] [CrossRef] [PubMed]
- Yang, W.L.; Zhou, Y.; Li, C.Z. Assessment of Ecological Environment Quality in Rare Earth Mining Areas Based on Improved RSEI. Sustainability 2023, 15, 2964. [Google Scholar] [CrossRef]
- Zhang, H.M.; Zhang, Y.F.; Tian, M.; Wu, C.L. Dynamic monitoring of eco-environment quality changes based on PCA: A case study of urban area of Baoji City. Remote Sens. Land Resour. 2018, 30, 203–209. (In Chinese) [Google Scholar]
- Wang, Y.; Li, X.M.; Zhang, Q.; Li, J.F.; Zhou, X.W. Projections of future land use changes: Multiple scenarios-based impacts analysis on ecosystem services for Wuhan city, China. Ecol. Indic. 2018, 94, 430–445. [Google Scholar] [CrossRef]
- Zhou, Y.Q.; Li, X. Analysis of temporal and spatial changes of ecological quality in Wuxi urban area based on water type ecological index. Acta Ecol. Sin. 2024, 4, 1476–1490. (In Chinese) [Google Scholar]
- Wang, M.Y.; Xu, H.Q. Temporal and spatial changes of urban impervious surface and its influence on urban ecological quality: A comparison between Shanghai and New York. Chin. J. Appl. Ecol. 2018, 29, 3735–3746. (In Chinese) [Google Scholar]
- Jiao, Z.J.; Sun, G.Y.; Zhang, A.Z.; Jia, X.P.; Huang, H.; Yao, Y.J. Water Benefit-Based Ecological Index for Urban Ecological Environment Quality Assessments. IEEE J. Sel. Top. Appl. Earth Obs. Remote Sens. 2021, 14, 7557–7569. [Google Scholar] [CrossRef]
- Grilo, F.; Pinho, P.; Aleixo, C.; Catita, C.; Silva, P.; Lopes, N.; Freitas, C.; Santos-Reis, M.; McPhearson, T.; Branquinho, C. Using green to cool the grey: Modelling the cooling effect of green spaces with a high spatial resolution. Sci. Total Environ. 2020, 724, 138182. [Google Scholar] [CrossRef]
- Gao, L.; Tao, F.; Liu, R.R.; Wang, Z.L.; Leng, H.J.; Zhou, T. Multi-scenario simulation and ecological risk analysis of land use based on the PLUS model: A case study of Nanjing. Sustain. Cities Soc. 2022, 85, 104055. [Google Scholar] [CrossRef]
- Ma, X.X.; Li, N.M.Z.; Yang, H.; Li, Y.Y. Exploring the relationship between urbanization and water environment based on coupling analysis in Nanjing, East China. Environ. Sci. Pollut. Res. Int. 2021, 29, 4654–4667. [Google Scholar] [CrossRef]
- Cao, S.; Zhao, X.S.; Du, S.H. Multi-type and fine-grained urban green space function mapping based on BERT model and multi-source data fusion. Int. J. Digit. Earth 2024, 17, 2308723. [Google Scholar] [CrossRef]
- Xu, X.H.; Kong, W.J.; Wang, L.G.; Wang, T.J.; Luo, P.P.; Cui, J.J. A novel and dynamic land use/cover change research framework based on an improved PLUS model and a fuzzy multi-objective programming model. Ecol. Inform. 2024, 80, 102460. [Google Scholar] [CrossRef]
- Hu, N.; Xu, D.; Zou, N.; Fan, S.; Wang, P.; Li, Y. Multi-Scenario Simulations of Land Use and Habitat Quality Based on a PLUS-InVEST Model: A Case Study of Baoding, China. Sustainability 2023, 15, 557. [Google Scholar] [CrossRef]

| Type | Sensor Type | Path/Row | Date | Data Source |
|---|---|---|---|---|
| LULC data | Land-use datasets (CLCD-30) | N50_30 | 2003, 2008, 2013, 2018, 2023 | http://www.resdc.cn https://zenodo.org/records/8176941 (accessed on 6 August 2024) |
| Satellite remote sensing data | Landsat_5 TM | 120/038 | 20 August 2003 | http://www.gscloud.cn/search (accessed on 6 August 2024) |
| 120/038 | 9 August 2008 | |||
| 120/038 | 11 August 2013 | |||
| Landsat_8 OLI/TIRS | 120/038 | 6 August 2018 | ||
| 120/038 | 7 August 2023 | |||
| SHP data | administrative boundary data | / | 2023 | http://www.webmap.cn/ (accessed on 6 August 2024) National Geomatics Center of China |
| Land Use | Area (km2) | En (%) | ||||||||
|---|---|---|---|---|---|---|---|---|---|---|
| 2003 | 2008 | 2013 | 2018 | 2023 | 2003–2008 | 2008–2013 | 2013–2018 | 2018–2023 | 2003–2023 | |
| FA | 4805.47 | 4517.86 | 4275.61 | 4158.00 | 4125.16 | −1.20 | −1.07 | −0.55 | −0.16 | −0.71 |
| FO | 506.28 | 520.86 | 485.62 | 391.96 | 401.74 | 0.58 | −1.35 | −3.86 | 0.50 | −1.03 |
| WB | 582.45 | 704.29 | 780.81 | 781.62 | 686.21 | 4.18 | 2.17 | 0.02 | −2.44 | 0.89 |
| CO | 690.00 | 841.20 | 1042.02 | 1252.51 | 1371.05 | 4.38 | 4.77 | 4.04 | 1.89 | 4.93 |
| BA | 0.03 | 0.02 | 0.17 | 0.14 | 0.07 | −6.67 | 150.00 | −3.53 | −10.00 | 6.67 |
| Years | Land Type | FA | FO | GR | WB | BA | CO | Land Transition Chart |
|---|---|---|---|---|---|---|---|---|
| 2003–2008 | FA | 5074.60 | 47.67 | 1.20 | 176.20 | 0.00 | 166.00 |  |
| FO | 29.74 | 542.82 | 0.03 | 0.00 | 0.00 | 2.61 | ||
| GR | 0.18 | 0.04 | 0.54 | 0.01 | 0.00 | 0.14 | ||
| WB | 34.06 | 0.20 | 0.01 | 621.38 | 0.01 | 6.70 | ||
| BA | 0.00 | 0.00 | 0.01 | 0.00 | 0.01 | 0.02 | ||
| CO | 0.08 | 0.00 | 0.00 | 3.05 | 0.00 | 781.43 | ||
| 2008–2013 | FA | 4760.99 | 22.51 | 2.51 | 132.12 | 0.03 | 220.50 | 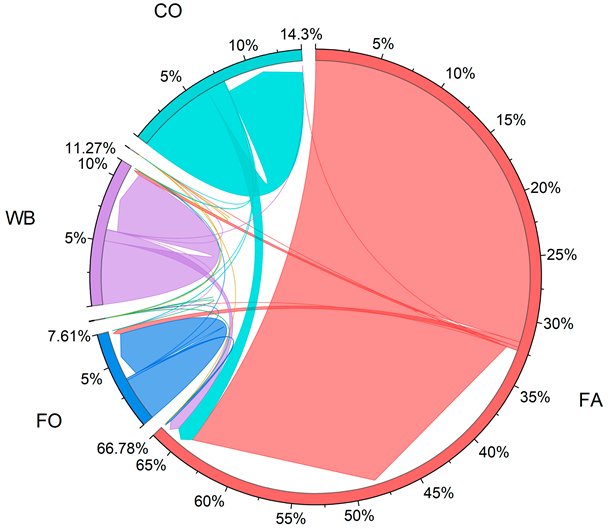 |
| FO | 61.50 | 525.96 | 0.01 | 0.04 | 0.00 | 3.23 | ||
| GR | 0.14 | 0.02 | 1.09 | 0.00 | 0.15 | 0.39 | ||
| WB | 40.11 | 0.31 | 0.06 | 752.95 | 0.01 | 7.21 | ||
| BA | 0.00 | 0.00 | 0.00 | 0.01 | 0.01 | 0.01 | ||
| CO | 0.07 | 0.00 | 0.00 | 2.73 | 0.00 | 954.11 | ||
| 2013–2018 | FA | 4574.30 | 8.90 | 0.17 | 54.62 | 0.00 | 224.81 | 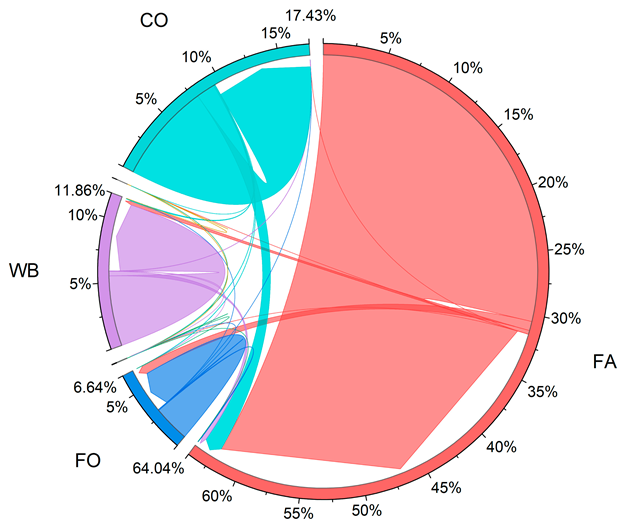 |
| FO | 109.90 | 436.26 | 0.00 | 0.01 | 0.00 | 2.62 | ||
| GR | 0.23 | 0.01 | 0.52 | 0.00 | 0.02 | 2.89 | ||
| WB | 44.41 | 0.00 | 0.00 | 830.88 | 0.04 | 12.51 | ||
| BA | 0.01 | 0.00 | 0.00 | 0.00 | 0.09 | 0.09 | ||
| CO | 0.04 | 0.00 | 0.00 | 3.10 | 0.00 | 1182.31 | ||
| 2018–2023 | FA | 4537.51 | 44.59 | 0.01 | 20.00 | 0.00 | 126.79 | 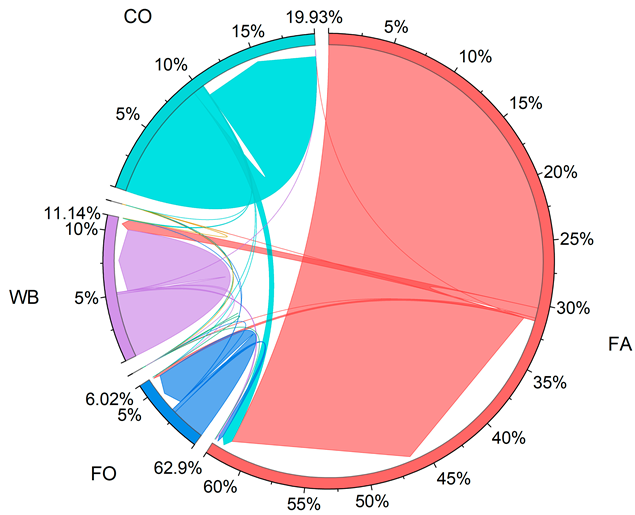 |
| FO | 32.69 | 412.10 | 0.00 | 0.01 | 0.00 | 0.38 | ||
| GR | 0.22 | 0.01 | 0.24 | 0.00 | 0.02 | 0.20 | ||
| WB | 121.23 | 0.02 | 0.00 | 757.68 | 0.01 | 9.67 | ||
| BA | 0.06 | 0.00 | 0.01 | 0.00 | 0.05 | 0.04 | ||
| CO | 0.08 | 0.00 | 0.00 | 2.42 | 0.00 | 1422.73 |
| RSEI Levels | 2003 | 2008 | 2013 | 2018 | 2023 | |||||
|---|---|---|---|---|---|---|---|---|---|---|
| Area | % | Area | % | Area | % | Area | % | Area | % | |
| Poor (0–0.2) | 103.36 | 1.58 | 326.75 | 4.98 | 528.01 | 8.05 | 215.76 | 3.29 | 541.34 | 8.25 |
| Inferior (0.2–0.4) | 693.67 | 10.57 | 880.28 | 13.42 | 988.15 | 15.06 | 835.75 | 12.74 | 1033.40 | 15.75 |
| Medium (0.4–0.6) | 2118.65 | 32.29 | 1591.03 | 24.25 | 1538.50 | 23.45 | 1448.58 | 22.08 | 1358.32 | 20.70 |
| Good (0.6–0.8) | 2587.17 | 39.43 | 2706.28 | 41.25 | 2439.50 | 37.18 | 2462.55 | 37.53 | 1985.87 | 30.27 |
| Excellent (0.8–1) | 1058.33 | 16.13 | 1056.82 | 16.11 | 1056.37 | 16.10 | 1598.53 | 24.36 | 1642.25 | 25.03 |
| Category | Change Level | 2003–2008 | 2008–2013 | 2013–2018 | 2018–2023 | ||||
|---|---|---|---|---|---|---|---|---|---|
| Ratio | Subtotal Ratio | Ratio | Subtotal Ratio | Ratio | Subtotal Ratio | Ratio | Subtotal Ratio | ||
| Deteriorated | Deteriorated rapidly | 3.69% | 18.12% | 4.18% | 19.84% | 3.91% | 25.27% | 4.87% | 25.02% |
| deteriorated slowly | 14.42% | 15.65% | 21.36% | 20.14% | |||||
| Unchanged | Unchanged | 33.80% | 33.80% | 42.58% | 42.58% | 37.95% | 37.95% | 47.30% | 47.30% |
| Improved | Improved slowly | 37.48% | 48.08% | 33.14% | 37.58% | 27.42% | 36.78% | 25.01% | 27.69% |
| Improved rapidly | 10.60% | 4.45% | 9.37% | 2.67% | |||||
| Indicators | PC1 of RSEI | ||||
|---|---|---|---|---|---|
| 2003 | 2008 | 2013 | 2018 | 2023 | |
| NDVI | 0.824 | 0.7801 | 0.7536 | 0.8083 | 0.818 |
| WET | 0.3914 | 0.5043 | 0.571 | 0.4076 | 0.339 |
| LST | −0.281 | −0.2373 | −0.166 | −0.297 | −0.2573 |
| NDBSI | −0.298 | −0.284 | −0.2799 | −0.3036 | −0.3868 |
| Characteristic value | 0.2129 | 0.2326 | 0.2527 | 0.2816 | 0.3564 |
| Contribution rate | 67.54% | 63.75% | 62.45% | 60.77% | 66.68% |
| Correlation | RSEI | Area/km2 | ||||||
|---|---|---|---|---|---|---|---|---|
| Farmland | Forest Land | Grassland | Water | Unused Land | Construction Land | Total Area | ||
| RSEI | / | |||||||
| Farmland | 0.656 ** | / | ||||||
| Forestland | 0.582 ** | 0.735 ** | / | |||||
| Grassland | 0.138 | 0.422 ** | 0.658 ** | / | ||||
| Water | 0.518 ** | 0.615 ** | 0.362 ** | 0.137 | / | |||
| Unused land | 0.195 | 0.406 ** | 0.621 ** | 0.775 ** | 0.133 | / | ||
| Construction land | 0.464 ** | 0.771 ** | 0.576 ** | 0.445 ** | 0.321 * | 0.604 ** | / | |
| Total area | 0.669 ** | 0.993 ** | 0.765 ** | 0.454 ** | 0.656 ** | 0.460 ** | 0.803 ** | / |
| Independent Variable (x) | Dependent Variable (y) | R2 | Sig. | Threshold Value/km2 |
|---|---|---|---|---|
| Farmland area | y = 0.0255 ln(x) + 0.6333 | 0.6138 | <0.001 | 400–500 |
| Forestland area | y = 0.0144 ln(x) + 0.7299 | 0.5494 | <0.001 | 20–30 |
| Water area | y = 0.0264 ln(x) + 0.6674 | 0.4028 | <0.001 | 100–120 |
| Construction land area | y = 0.0472 ln(x) + 0.5524 | 0.2591 | <0.001 | 120–150 |
| Total area | y = 0.0364 ln(x) + 0.5473 | 0.5595 | <0.001 | 600–800 |
| Correlation | RSEI | Percentage of Land Area/% | |||||
|---|---|---|---|---|---|---|---|
| Farmland | Forestland | Grassland | Water | Unused Land | Construction Land | ||
| RSEI | -- | ||||||
| Farmland area% | 0.763 ** | -- | |||||
| Forestland area% | 0.438 ** | 0.052 | -- | ||||
| Grassland area% | −0.385 | −0.229 | −0.006 | -- | |||
| Water area% | −0.078 | 0.039 | −0.382 ** | −0.177 | -- | ||
| Unused land area% | 0.011 | −0.052 | 0.056 | 0.461 ** | −0.075 | -- | |
| Construction land area% | −0.805 ** | −0.946 ** | −0.228 | 0.262 | −0.219 | 0.053 | -- |
| Percentage of Land Area | OLS Model (k = 0) | Model 2 (k = 0.10) | ||||||
|---|---|---|---|---|---|---|---|---|
| B | Beta | SE | VIF | B | Beta | SE | VIF | |
| farmland area% | −0.146 * | −0.464 | 0.057 | 70.64 | 0.096 *** | 0.306 | 0.005 | 0.563 |
| forestland area% | −0.022 | −0.027 | 0.056 | 10.24 | 0.195 *** | 0.241 | 0.016 | 0.800 |
| Water area% | −0.302 ** | −0.469 | 0.056 | 16.42 | −0.058 *** | −0.09 | 0.012 | 0.759 |
| construction land area% | −0.365 ** | −1.319 | 0.056 | 90.33 | −0.113 *** | −0.409 | 0.004 | 0.477 |
| _cons. | 0.987 ** | -- | 0.056 | 0.742 *** | -- | 0.004 | -- | |
| R2 | 0.674 | 0.663 | ||||||
| Adjust R2 | 0.672 | 0.661 | ||||||
| MSE | 0.056 | 0.010 | ||||||
| Independent Variable (x) | Dependent Variable (y) | R2 | Sig. | SE |
|---|---|---|---|---|
| Percentage of farmland area | y = 0.2236 x + 0.6459 | 0.5032 | <0.001 | 0.066 |
| Percentage of forestland area | y = 0.3365 x + 0.7266 | 0.1728 | <0.001 | 0.085 |
| Percentage of water area | y = −0.0162 x + 0.7488 | 0.0006 | 0.5030 | 0.094 |
| Percentage of construction land area | y = −0.2104 x + 0.8293 | 0.5774 | <0.001 | 0.061 |
| Year | Percentage of Area/% | En/% | LUCI | RSEI Observed Value | RSEI Model Value | ||||||
|---|---|---|---|---|---|---|---|---|---|---|---|
| FA | FO | WB | CO | FA | FO | WB | CO | ||||
| 2003 | 72.99 | 7.68 | 8.85 | 10.48 | −1.20 | 0.55 | 4.18 | 4.38 | 293.92 | 0.8049 | 0.7909 |
| 2008 | 68.62 | 7.89 | 10.70 | 12.78 | −1.07 | −1.42 | 2.17 | 4.77 | 294.12 | 0.7901 | 0.7906 |
| 2013 | 64.94 | 7.33 | 11.86 | 15.83 | −0.55 | −3.77 | 0.02 | 4.04 | 296.49 | 0.7741 | 0.7866 |
| 2018 | 63.15 | 5.94 | 11.87 | 19.02 | −0.16 | 0.52 | −2.44 | 1.89 | 301.18 | 0.8110 | 0.7786 |
| 2023 | 62.65 | 6.10 | 10.42 | 20.82 | −0.16 | 0.52 | −2.44 | 1.89 | 304.29 | 0.8108 | 0.7733 |
| 2028 | 62.54 | 6.13 | 10.17 | 21.21 | −0.16 | 0.52 | −2.44 | 1.89 | 305.07 | / | 0.7720 |
Disclaimer/Publisher’s Note: The statements, opinions and data contained in all publications are solely those of the individual author(s) and contributor(s) and not of MDPI and/or the editor(s). MDPI and/or the editor(s) disclaim responsibility for any injury to people or property resulting from any ideas, methods, instructions or products referred to in the content. |
© 2024 by the authors. Licensee MDPI, Basel, Switzerland. This article is an open access article distributed under the terms and conditions of the Creative Commons Attribution (CC BY) license (https://creativecommons.org/licenses/by/4.0/).
Share and Cite
Zhou, Y.; Cao, W.; Zhou, J. Land-Use Transfer and Its Ecological Effects in Rapidly Urbanizing Areas: A Case Study of Nanjing, China. Sustainability 2024, 16, 10615. https://doi.org/10.3390/su162310615
Zhou Y, Cao W, Zhou J. Land-Use Transfer and Its Ecological Effects in Rapidly Urbanizing Areas: A Case Study of Nanjing, China. Sustainability. 2024; 16(23):10615. https://doi.org/10.3390/su162310615
Chicago/Turabian StyleZhou, Yinqiao, Wei Cao, and Jiandong Zhou. 2024. "Land-Use Transfer and Its Ecological Effects in Rapidly Urbanizing Areas: A Case Study of Nanjing, China" Sustainability 16, no. 23: 10615. https://doi.org/10.3390/su162310615
APA StyleZhou, Y., Cao, W., & Zhou, J. (2024). Land-Use Transfer and Its Ecological Effects in Rapidly Urbanizing Areas: A Case Study of Nanjing, China. Sustainability, 16(23), 10615. https://doi.org/10.3390/su162310615