Article

Assessing the Monetary Value and Environmental Impact of Household Food Waste in Italy

1
Barilla Foundation, 43122 Parma, Italy
2
Natural Resources Institute Finland (Luke), 00790 Helsinki, Finland
3
Foundation CMCC—Euro-Mediterranean Center on Climate Change, 73100 Lecce, Italy
4
Department of Agricultural and Food Sciences, University of Bologna, 40126 Bologna, Italy
5
Department of Innovation in Biology, Agri-Food and Forest System, University of Tuscia, 01100 Viterbo, Italy
*
Author to whom correspondence should be addressed.
Sustainability 2024, 16(23), 10614; https://doi.org/10.3390/su162310614
Submission received: 7 November 2024 / Revised: 28 November 2024 / Accepted: 30 November 2024 / Published: 4 December 2024

Abstract

:
Household food waste accounts for a significant share of total food waste. In 2022, around 1.05 billion tons of food waste were generated—60% of which came from households. In the EU, households generate 54% of the total food waste. In Italy, according to a former diary study, avoidable household food waste accounts for 529.9 g per capita per week. Building on this data, this study assesses the monetary value of food waste at the household level in 6 provinces across the country, considering the prices of food items recorded by the Italian Observatory of market prices. Moreover, the environmental impacts of household food waste (greenhouse gas emissions, water consumed, and land used) were investigated based on existing data from well-grounded scientific literature. The results show that the monetary value of food waste ranges from EUR 357.43 to EUR 404.62 per household per year, corresponding to 5–7% of the average household expenditure for food. The environmental impacts per household per year account for 149 kgCO2eq, which contributes to climate change. In addition, household food waste is responsible for 303,498 L of water consumed and 1426 m2 of land used. The results of this study can be integrated into National Energy and Climate Plans (NECPs), to integrate food waste reduction into energy savings and greenhouse gas mitigation strategies.

Graphical Abstract

1. Introduction

Food loss and waste (FLW) has emerged as a pressing global issue, as they represent not only a loss of valuable resources but also environmental challenges. Especially, the resources used to produce, transport, and store wasted food—in terms of water, energy, and land—are squandered. Recent estimates by the United Nations Environment Programme [1] indicate that in 2022, 19% of food available to consumers (i.e., retail, food service, and household sectors combined) was wasted globally. This equates to 1.05 billion tons, or about 132 kg per person each year, with households contributing 79 kg per person. Regarding the environmental impacts, globally, FLW accounts for about one-quarter of the freshwater and one-fifth of cropland and fertilizers utilized throughout the food supply chain [2]. They are also responsible for about 8–10% of global greenhouse gas (GHG) emissions [3,4]. Consequently, FLW undermines food security and exacerbates inequalities in food distribution, with approximately 9.1% of the world population suffering from undernutrition [5]. The amount of edible food waste equals approximately 1.3 meals for each person affected by hunger each day [1].
Globally, most of the food waste occurs at the household level (60%), followed by the food service sector (28%) and retail (12%) [1]. A similar pattern is observed in Europe that around 54% of total food waste produced yearly (59 million tons or 132 kg/inhabitant) is generated at home (72 kg/inhabitant) [6], with an associated market value estimated at 132 billion euros [7]. Concerning the environmental impacts, if food waste was counted as a Member State, it would rank as the EU’s fifth largest source of greenhouse gas emissions [8]. At the same time, over 42 million people cannot afford a quality meal every second day [9]. The growing global epidemic of overweight and obesity also contributes significantly to virtual food waste, as consuming food in excess leads to substantial resource losses. A recent study estimated that, in Italy alone, overnutrition accounts for approximately 1.553 Mt of food, resulting in an environmental impact of 6.15 Mt of CO2-eq annually. This equals an additional emission burden of approximately 24% for obese adults and 12% for overweight adults compared to those with normal weight, highlighting the urgent need to address dietary habits and food consumption patterns [10]. All these scenarios highlight the inefficiencies present in food systems, underscoring the need for understanding the quantity of food waste and its economic value in order to develop targeted interventions to mitigate food waste at various levels, including production, distribution, and consumption.
Challenges in quantifying household food waste lie in the variability of definitions and methodologies employed across different studies. The intricacies involved in assessing what constitutes “food waste” led to discrepancies in reported quantities [11]. Household food waste assessments are also rarely comparable due to variations in data collection methodologies. Questionnaires have been proven to be unreliable in determining quantities of wasted food because they underestimate the actual quantities as they rely on self-reported intentions rather than actual behaviors [12,13,14], they can successfully be used to monitor food waste-related behaviors over time or across different groups of people [15]. To improve the quantitative assessments, two European projects (FUSIONS and REFRESH) [16,17,18] as well as the European Commission’s methodological guidelines published in May 2019 recommend the use of food diaries and waste compositional analyses for national food waste assessments [19].
Even though there are guidelines aiming at standardizing the accounting and reporting of FLW, with the goal of enhancing transparency in methods and improving the comparability of studies, studies on household food waste in Italy reveal a predominance of questionnaire-based methodologies [20,21,22,23,24]. For instance, based on online surveys, the 2024 Waste Watcher report estimates that household food waste accounts for an average of 683.3 g per person per week, reflecting a significant increase from the previous year [20]. Results from studies on household food waste in Italy also vary, from 36 kg [22] to 107 kg [1] per person per year. Grant et al. (2023) reported an average of 480 g of food waste per family per week [25], while Scalvedi and Rossi (2021) indicated that on average 370 g of food per family per week was wasted [26]. The European project REFRESH estimated the average annual household food waste at 94.64 kg [18]. Giordano et al. (2019), the first study applying the diary method in quantifying household food waste in Italy, estimated an average food waste per person per week at 529.9 g, which equals to an annual average of 27.5 kg per person [13]. In particular, the study by Giordano et al. was based on a national survey conducted in Italy in May–June 2017, which analyzed food waste in 388 families, collecting data on both edible and non-edible food waste over a week. Families were asked to fill out paper diaries for one week, detailing the food thrown away after each meal with a kitchen scale or common kitchen tools to quantify it as precisely as possible. The average food waste per person of 529.9 g per week only refers to the edible fraction, both avoidable and possibly avoidable, with single households wasting more (713.7 g) compared to larger families (375 g for three-member families and 424.5 g for four or more members). Aside from household composition, geography also impacts wasted food quantities: Families in Northern Italy wasted significantly less—370 g per week—compared to 616 g in Central and Southern Italy. Regarding the composition of waste, the most wasted foods were vegetables (136 g), milk (92 g), fruits (86 g), and baked goods (61 g), with smaller amounts of pasta, rice, meat, and drinks also contributing to the waste.
Although many studies have shed light on quantifying household food waste in Italy, the economic value of household food waste has been analyzed only by a few studies. For example, Aureli et al. (2021) showed that Italian families wasted 4.4% of the weight of food purchased, representing 3.8% of their food expenditure [21], while the 2020 Waste Watcher report estimated that the average weekly expenditure on food waste was EUR 4.90 per household [27].
Against this backdrop and building upon the foundation laid by Giordano et al. (2019) [13], this paper aims to explore the economic and environmental impacts of food waste in Italian households.
The analysis will assess the monetary value of food waste in Italian households as well as the environmental impacts in terms of greenhouse gas emissions, land use, and water footprint. By examining these dimensions, we seek to provide a comprehensive and updated understanding of the impact of food waste in Italy, contributing to the broader discourse on sustainable consumption and waste-reduction strategies. Through this research, we hope to inform policymakers, stakeholders, and consumers alike, fostering a collective effort to mitigate food waste and its associated impacts.

2. Materials and Methods

To estimate both the economic value and the environmental impacts of food waste, we used data on the weight of food waste for Italian households reported by Giordano et al. (2019) (529.9 g per person per week) [13]. In their study, participants were selected using stratified random sampling, ensuring representation across macro-regions (North, Center, and South), city population size (below or above 100,000 residents), and whether households included children. The selection process was handled by SWG, a marketing survey firm with expertise in food waste research [13]. The average quantity of food waste has been shown to be significantly higher when data are collected through diaries, while questionnaires capture less than one-third of food waste determinants mainly due to the “attitude–behavior gap” (they report intentions, not actual behaviors) [13]. Moreover, food diaries are mentioned in the methodological guidelines recommended by the European Commission (2019) as methods to be used in national assessment of food waste [19], while questionnaires are excluded. It should be noted that the data reported by Giordano et al. (2019) refer only to avoidable food waste, excluding non-edible parts of foods (e.g., bones). Food categories were distinguished into vegetables (“Vegs”), fruits, meat, cereals, baked products (“Baked”), dairy, drinks, desserts, legumes, fish, eggs, and other products (“Other”) (Table 1) [13]. Even though the study was conducted on a representative sample of households in Italy in 2017, it provides the latest available data on household food waste in Italy, applying a diary method that is in line with the EU official methodology [19]. For estimating the monetary value and environmental impacts of household food waste in Italy, we assume that the quantity of household food waste produced by Italian households remains the same as reported by Giordano et al. (2019) [13]. Although some studies, i.e., ref. [20] suggested that the quantity might have increased, no evidence based on direct quantification of household food waste has been provided so far. Even if this trend may be confirmed by further studies quantifying household food waste in Italy, the results of this study might be intended as a “benchmark” estimation.

2.1. Economic Assessment

The monetary value of food waste was assessed using secondary data by assigning an economic value to each food category, using the database provided by the Italian Observatory (Osservatorio Prezzi e Tariffe of the Ministry of Entrepreneurship and Made in Italy (2024)) [28]. This Observatory was developed by ISTAT (Italian National Institute of Statistics), which monitors prices across different categories of goods, including food, on a monthly basis in Italian provinces (NUTS3 level, in the EU classification). For the purposes of this study, six provinces were selected based on data availability to ensure a significant geographic representation of the country (i.e., Milan, Parma, Florence, Rome, Bari, and Palermo). For each of these provinces, prices (max, min, mean) were downloaded in June 2024. Data availability varied consistently across cities, from 57 products in Parma to 105 in Rome. Product categories were homogenized with those used by Giordano et al. [13] as shown in Table S1 in the Supplementary Materials. Mineral water was not included in any category as this product was excluded from the survey of food waste by Giordano et al. (2019) [13]. As methodological choices, canned tuna, frozen potatoes, or peas were included in the respective categories of fresh products (e.g., tuna in FISH, potatoes in VEGS, peas in LEGUMES); tomato puree and peeled tomatoes were included in OTHER; eggs were included in EGGS. To be noted, the price of eggs was only available for the city of Milan. Hence, the price in Milan was used as a proxy in all the other cities considered. For each city, mean and median of food prices were calculated for each food category. Then, this price was calculated based on the quantities of food waste per capita reported by Giordano et al. (2019) [13] as the monetary value of food waste. The monetary value is expressed in per capita terms as well as per household, considering the average size of an Italian family of 2.3 persons as reported by ISTAT (2022) [29].

2.2. Environmental Assessment

The environmental impacts of food waste are assessed through Carbon Footprint (CF), Water Footprint (WF), and Land Footprint (LF), which are critical environmental indicators that measure the impact of human activities on natural resources. The CF measures the total amount of greenhouse gases in carbon dioxide equivalents (CO2eq), directly or indirectly emitted throughout the life cycle of a food product. It encompasses emissions from the entire food supply chain (the production and use of raw materials, energy use, and transportation) both for food agricultural production and for its processing. The importance of the CF indicator lies in its capacity to quantify the contribution of a food product to climate change [30]. The WF quantifies the total volume of freshwater used to produce a food product. It includes three components: blue water (surface and groundwater) and green water (rainwater stored in soil) [31]. Understanding WF is crucial for managing water resources sustainably. The LF indicates the amount of land used to produce a given food item depending on the agricultural yield, which in turn relies on the local pedo-climatic conditions, the agricultural management intensity, the technological level, and the farming practices implemented. CF and WF values for food items were derived by Petersson et al. (2021) [32], while LF values were derived by Poore and Nemecek (2018) [33]. Food items were grouped under the same category (as further specified in Table S1 in the Supplementary Materials), and the mean as well as median values for each food category were calculated for each footprint. Then, as completed for the economic assessment, the CF, WF, and LF values were applied to the quantities of per capita food waste reported by Giordano et al. (2019) [13] in order to calculate the environmental impacts of food waste both expressed in per capita terms as well as per household, considering the average size of an Italian family of 2.3 persons as reported by ISTAT (2022) [29]. To provide a comparative analysis of the economic and environmental impacts generated by the amount wasted for each food category at the household level, each food category was indexed in the range of 0–1 against the maximum value it shows per annual quantity of household FW, per monetary value of the household food waste, and per CF, WF, and LF value.

3. Results

3.1. Economic Impact Assessment

For each selected province, the economic value of food waste was calculated for each food category by multiplying the quantities of waste reported by Giordano et al. (2019) on a national scale [13] and the average as well as median price provided by the Italian Observatory in June 2024 in the selected territories [28]. In all food categories, the median price is always lower than the average price, indicating a strongly skewed price distribution due to the much higher prices of a few products that influence the average. The exception is only the Fish category for which in some provinces the median is slightly higher than the average. As a result, the economic value of food waste per person per week varies from EUR 2.99 to EUR 3.39 in different provinces in terms of average prices. The economic value of food waste per person per week varies from EUR 2.53 and EUR 3.04 in different provinces if median prices are considered. Thus, the use of average prices reduces the variability of the data between provinces. At the national level, the average minimum value of food waste (corresponding to the city where prices were lower) is EUR 357.43 (302.07 median) and the average maximum value (corresponding to the city where prices were higher) is EUR 404.62 (EUR 363.53 median) per household per year (Table 2). According to the latest data provided by ISTAT, Italian households spend EUR 482 per month on food purchases, which means that they waste between 5.2% and 7.0% of the value of their food expenditure [29].

3.2. Environmental Impacts Assessment

Regarding the environmental impacts, the results highlight a total of 1.25 kg CO2eq (or 0.77 kg CO2eq as median value), 2538 L of water (or 970 L as median value), and 12 m2 of land (or 7 m2 as median value) embedded in household food waste per person per week (Table 3). Wasted meat and dairy products are the major contributors both to CF (474 and 285 g CO2eq per person per week, respectively) and to LF (5.3 and 4.45 m2 per person per week, respectively). Their impacts on WF are 441 and 332 L per person per week. Wasted vegetables entail a moderate impact in terms of CF (122 g CO2eq per person per week) and WF (63 L per person per week). Wasted Fruits show a higher WF (265 L per person per week) but maintain a lower CF (68 g CO2eq per person per week), suggesting a trade-off between water use and carbon emissions. Wasted legumes have a notably low CF (7 g CO2eq per person per week), a moderate WF (30 L per person per week), and a low LF (0.11 m2 per person per week). Wasted cereals and baked food show low impacts in terms of CF (49 and 69 g CO2eq per person per week, respectively) and WF (74 and 73 L per person per week, respectively) but a moderate and high LF (0.15 and 0.79 m2 per person per week, respectively). Fish wastes reveal a low CF (45 g CO2eq per person per week) and WF (26 L per person per week). Waste eggs have a low impact in all three footprints, representing the least impacting category.
For a yearly basis, the total environmental impacts per household are 149 kg CO2eq (or 92 kg CO2eq as median value) for CF, 303,498 L of water (or 116,014 L as median value) for WF, and 1426 m2 of land (or 839 m2 as median value) for LF.

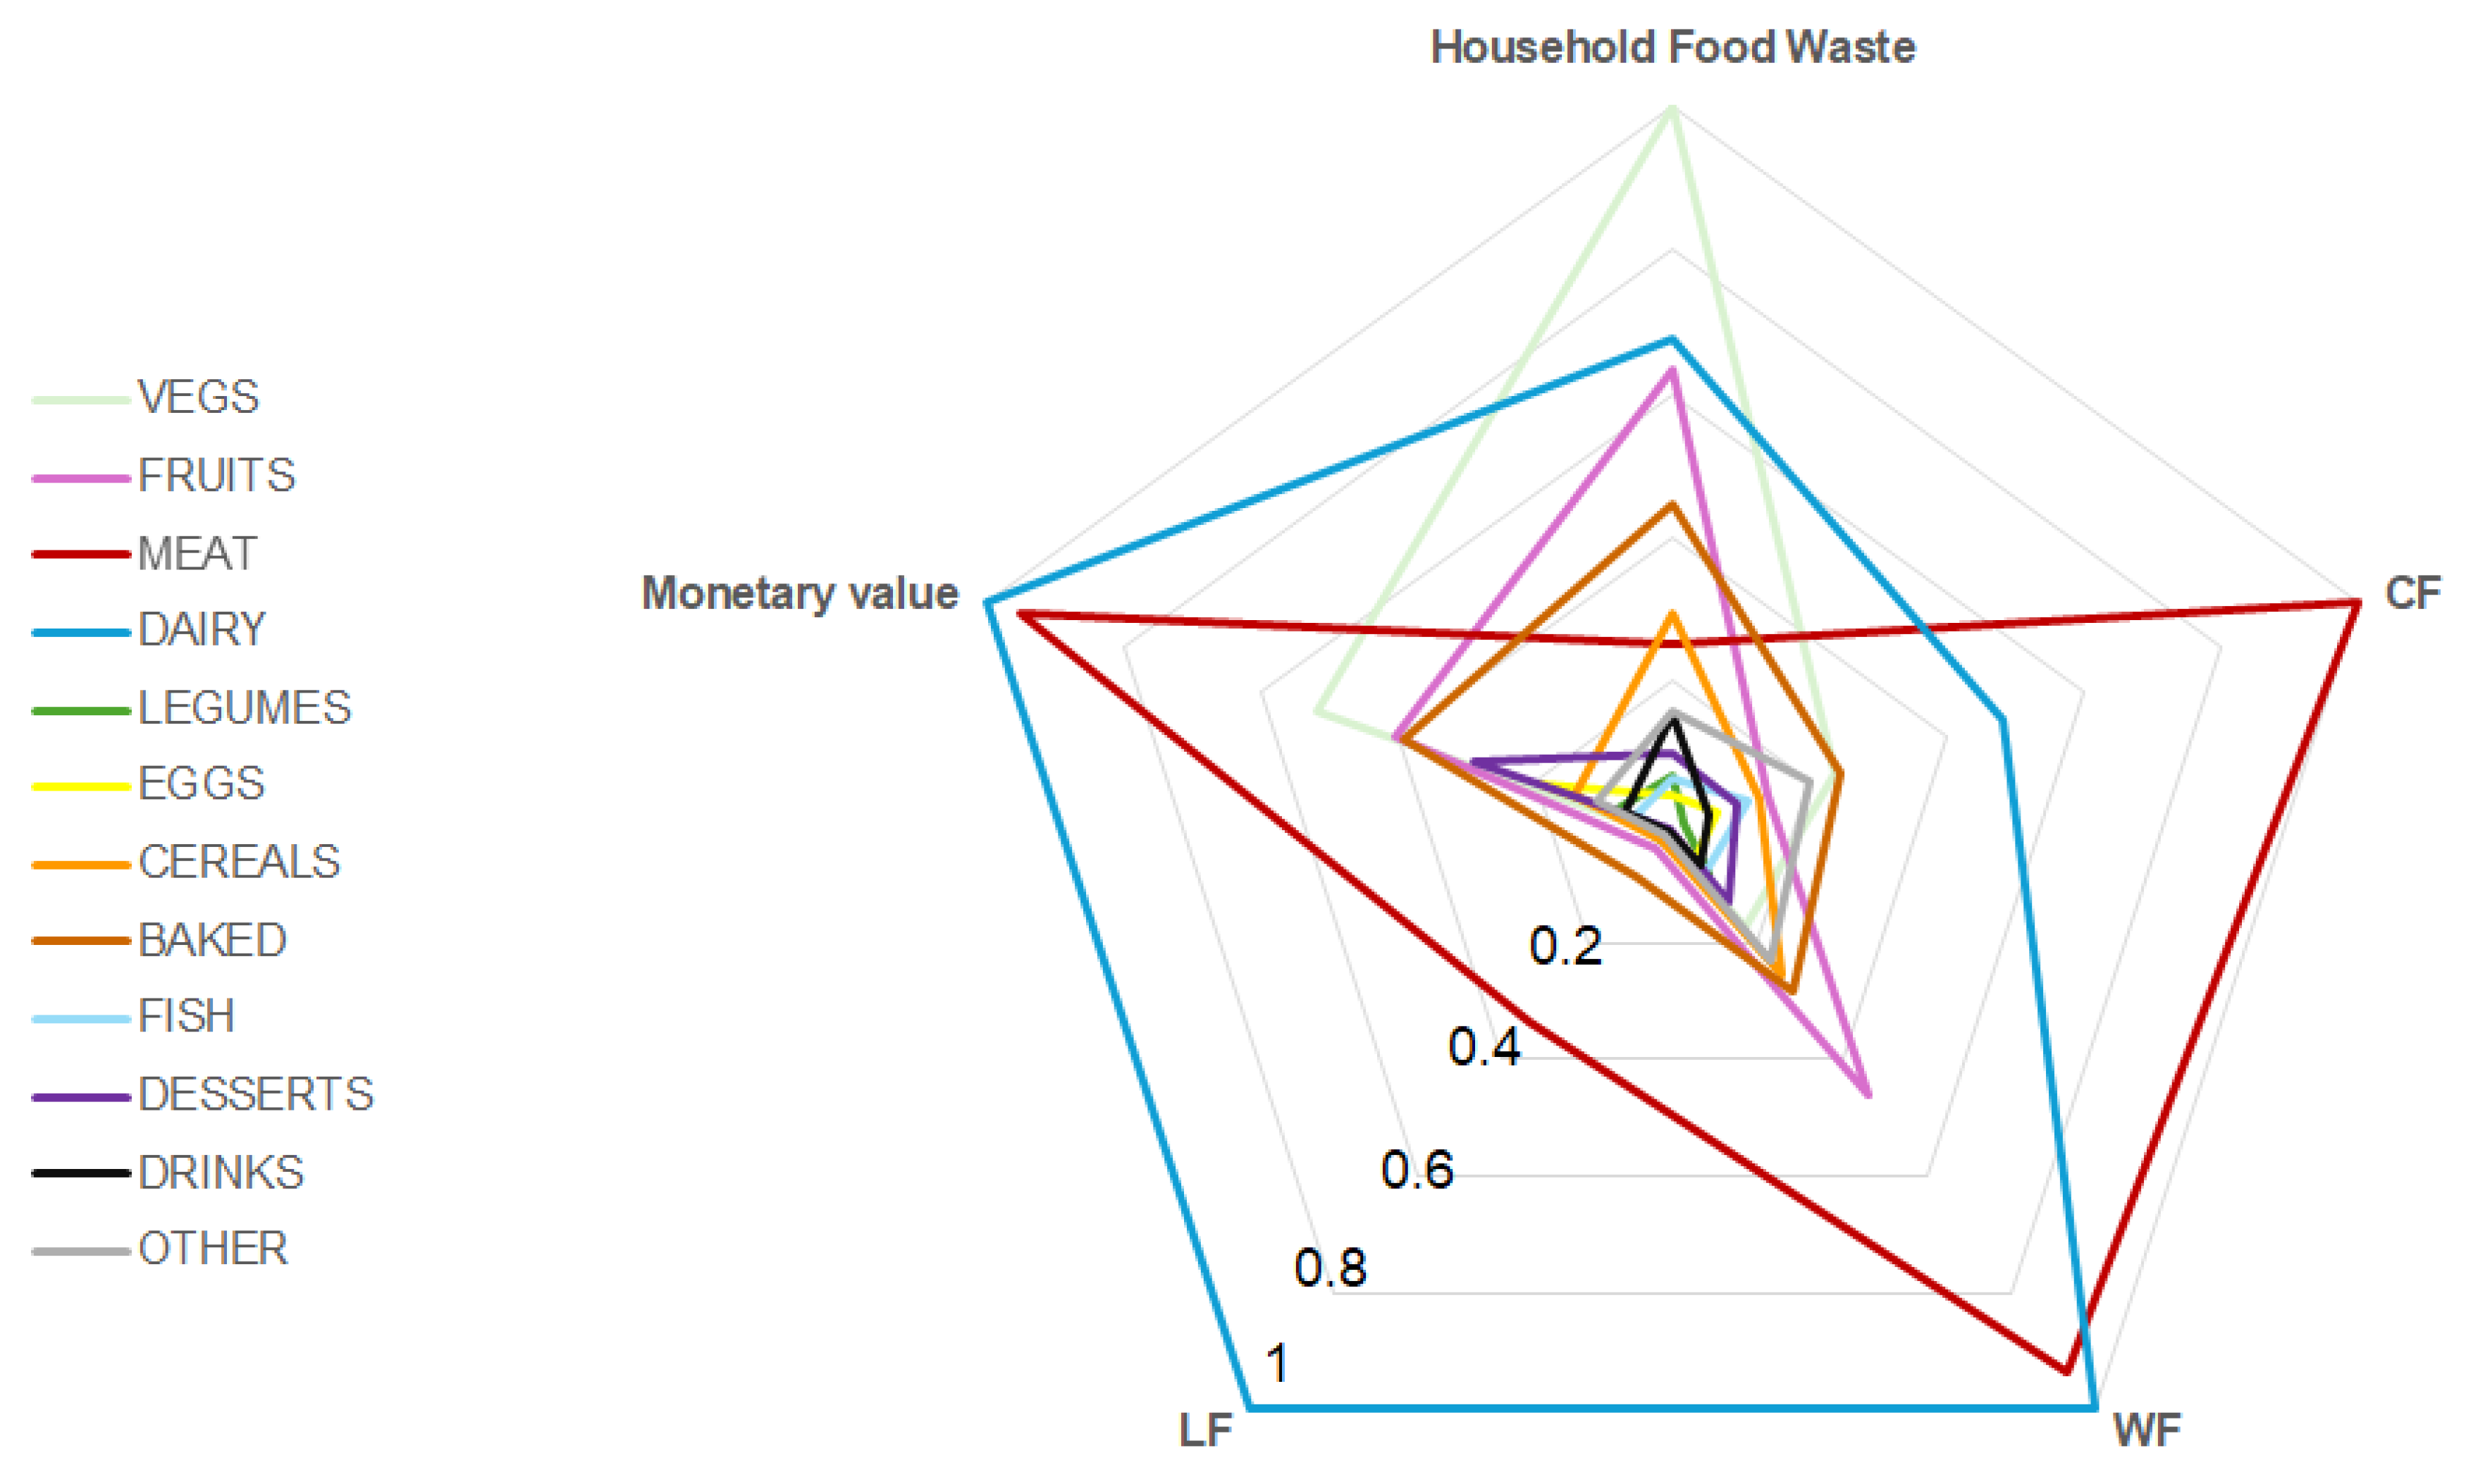
3.3. A Combined Assessment of Economic and Environmental Impacts

Table 4 summarizes the overall impact of each food category at the household level in Italy in terms of absolute (median) values of quantity of food wasted, CF, WF, LF, and economic value per household per year. Figure 1 visually compares the amount of household food waste with its economic value and environmental impacts (carbon, water, and land footprint). What clearly emerges from the figure is that some food categories, among the most wasted ones, have limited economic and/or environmental impacts. For instance, in the case of VEGS, even though it is the most wasted food category, it shows a medium monetary value and a relatively low environmental footprint. Conversely, other categories such as DAIRY and MEAT, despite having a medium and low rate of waste, result in the highest economic as well as environmental impacts.

4. Discussion

This study provides a comprehensive assessment of the impacts of household food waste in Italy by looking at its economic and environmental impacts together. Despite the wealth of literature on food waste, only a few studies considered its economic and environmental ramifications. Von Massow et al. (2019) in Canada [34] and Buzby and Hyman (2012) in the USA [35] provided detailed data on both the monetary value of food waste per household and the percentage of household expenditure, but only Von Massow included a full analysis on environmental impacts covering CO2 emissions, water usage, and land use. In contrast, Aureli et al. (2021) [21] and Waste Watcher (2020) [27] in Italy as well as Silvennoinen et al. (2012) and Katajajuuri et al. (2014) in Finland [36,37] focused solely on the monetary value of food waste. Giménez et al. (2023) in Uruguay offered a balanced analysis, covering both the economic value of food waste and environmental impacts like CO2 emissions, water footprint, and land use [38], making their study comparable to that of Von Massow et al. (2019) [34]. Similarly, Adelodun et al. (2021) in South Korea included both economic data and environmental aspects, such as CO2 emissions and water usage although they do not cover land use [39]. Some other studies, however, only included the analysis of the environmental impacts of food waste. For example, Song et al. (2015) [40] and Liu et al. (2023) [41] in China focused primarily on the carbon and water footprints of food waste, providing substantial environmental data but no economic analysis. Similarly, Cooper et al. (2018) [42] and WRAP (2023) [43] in the UK analyzed CO2 emissions and water use without addressing the economic costs of food waste. The studies conducted by Djekic et al. in Bosnia and Herzegovina [44] as well as in Serbia [45] focused on CO2 emissions and eutrophication potentials of food waste but lacked economic data, leaving a gap in their analysis. In addition, Silvennoinen et al. (2022) calculated the climate impact assessment of FW based on a Life Cycle Assessment (LCA) for the carbon footprint (CF) [37]. Cakar et al. (2016) in Turkey [46] and Read et al. (2020) in the USA [47] provided a detailed environmental analysis, focusing on CO2 emissions, water use, and land use (in the USA) as well as energy consumption (in Turkey). Nevertheless, none of them address the economic impact of food waste. In summary, there is a clear need for more integrated research to fill these gaps and provide a comprehensive view of the economic and environmental impacts of household food waste. As such, this study provides for the first time in literature an overall environmental and economic analysis of the impact of food waste in Italy.
As the first study examining the economic and environmental impacts of household food waste in Italy implementing the diary method, the results of the current study reveal that the average household edible food waste amounts to 529.9 g per capita per week (i.e., 27.5 kg per person per year (Giordano et al. 2019)) [13]. The average monetary value of food waste ranges between EUR 357.43 and EUR 404.62 per year. Comparing this data with the latest estimate of food expenditure of Italian households, Italian households waste between 5.2% and 7.0% of the value of their food expenditure or about the economic value of one month of food purchases. This figure is higher than that estimated by Aureli et al. (2021) [21] as well as by Waste Watcher (2020) [27]. However, this seems to be plausible because in both cases the quantification of food waste was performed using questionnaires that tend to underestimate quantities [15,48].
What is worth noting from this paper is the evidence that the household waste of certain food items, such as meat and dairy products, contributes significantly to monetary loss and is the most impactful in terms of water and land footprint (meat) and carbon and water footprint (dairy). However, interestingly, despite their environmental and economic impact, these items are not among the most wasted. Conversely, products like vegetables, fruits, and baked goods, which are the most perishable, are among the most wasted although they have a relatively low economic and environmental impact compared to other food categories. These findings reinforce the idea that the waste of some food items can be conceptualized as a luxury behavior [49], which might be found especially in households that have a higher expenditure for food, or that show a higher opportunity cost for the time needed in every meal preparation, thus increasing household FW [50]. In any case, special attention should be given to the appropriate consumption of those food elements, like meat and dairy, which potentially could generate high monetary loss and environmental impact, focusing further efforts on reducing the waste. This information could be used to develop educational and awareness campaigns to address food behavior change at the household level.
The environmental impacts accounted for in this study are also significant, with annual household food waste contributing 149 kgCO2eq to climate change, consuming 303,498 L of water, and wasting 1426 m2 of land only in Italy. These findings highlight the importance of generating reliable data on greenhouse gas emissions and other environmental impacts of food waste to evaluate the potential environmental benefits of prevention and reduction measures. Associating food waste-related emissions with national quantification studies supports ongoing monitoring, aligned with the EU’s delegated decision, which requires updates every four years from Member States. Furthermore, identifying the food products most linked to waste and their emissions can inform targeted reduction strategies. Such outputs could be successfully integrated into National Energy and Climate Plans (NECPs), which guide EU member states in addressing decarbonization and energy efficiency. In fact, the feedback of the EU Commission to the current NEPCs round is that, despite significant progress in reducing greenhouse gas (GHG) emissions, achieving the 2030 targets set in the Climate Law remains a challenge. “Net GHG emissions are projected to be 51% lower than 1990 levels by 2030, falling short of the 55% reduction target by 4 percentage points. Additional enabling measures at the national level are required to bridge the remaining gap, particularly in sectors such as transport, buildings, agriculture, waste, and carbon removals. (…) Emissions from domestic transport (excluding aviation), buildings, agriculture, small industry, and waste must be reduced by 40% by 2030 compared to 2005. The majority of the draft updated NECPs do not show sufficient ambition and action on land. Very few Member States show a concrete pathway to reach their national net removal targets, or sufficient actions to assist farmers, foresters, and other stakeholders in building sustainable business models in line with these targets” (COM (2023) 796 final, 2.1.1). Future research should build on these results to develop specific policy recommendations that integrate food waste reduction into energy savings and greenhouse gas mitigation strategies, particularly within the NECP framework, by showing a clear pathway to reduction that is currently missing.
For mitigating food waste reduction and implementing effective interventions at the household level, it is important to understand consumer behavior toward food waste and the factors affecting the behavioral changes. In general, at home, food is discarded after a series of complex actions and decisions that take place across various food-related practices and routines—such as planning, shopping, storing, cooking, eating, and managing leftovers—each of which gradually increases the likelihood of food waste [51,52]. For example, planning and purchasing, as the initial stages of the consumption phase, have been shown to significantly influence food waste generation at home [24]. Moreover, the lack of meal planning has been identified as one of the main barriers to reducing food waste [53]. Crucial factors to address consumers’ attention to food waste-related behaviors include providing them with accurate information about economic and environmental impacts. For example, Boulet et al. (2021) proposed that an individual’s awareness and knowledge of food waste as well as its environmental and social consequences are crucial factors [54]. Attique et al. (2021) demonstrated that cognitive factors such as awareness about consequences and environmental knowledge correlated positively with food waste reduction behavior [55]. Van der Werf et al. (2019) showed the extent to which a focus on the economic dimension of food waste can lead to behavior change in households’ contexts [56]. In the context of Italy, recent studies also demonstrated price consciousness (i.e., saving money) and environmental concern (e.g., GHG emissions and water consumption) as primary factors influencing attitudes toward minimizing food waste [57]. While all these factors have been directly connected to the quantity of food waste generated at home, it is clear that the economic implications of food waste can also play a big role in pushing consumers’ awareness of the issue [58,59], especially where there is a low awareness of the environmental implications of food waste [60]. Finally, according to Gaiani et al. (2018), Italians would like to learn more about the environmental and socioeconomic impacts of food waste, as well as potential strategies for reducing it [23]. This would also be an opportunity to increase food literacy more broadly speaking about healthy and sustainable diets.
Three main limitations are acknowledged. Firstly, the study assumes that the quantity of household food waste in Italy, in the year 2024, is the same as measured by Giordano et al. (2019) [13]. Therefore, the prices of food products collected in 2024 are used on quantities of food waste that were, instead, collected some years before. While the source data of household food waste are not recent, this is the latest data on household food waste available in Italy, which adopts a data collection approach in line with the EU official methodology for food waste quantification. Other studies providing more recent estimates of food waste at the household level deploy questionnaires to assess the quantity of food waste in households, likely providing underestimated results [20,21,22,23,24]. A second limitation of the study is related to the fact that food waste quantities reported by Giordano et al. (2019) refer to avoidable food waste (which excludes meat bones, eggshells, and fruit skins) [13], while prices refer to whole food products. Future research should address the economic and environmental impacts of household food waste with more updated data on household food waste in Italy through diaries or waste compositional analysis. This would also allow us to compare results across time, not only to check whether food waste decreases, in line with the objectives set in the Sustainable Development Goals [61], but also to estimate the change in the related economic and environmental burdens.

5. Conclusions

The present study pursued, for the first time in the scientific literature, an economic and environmental impact analysis of household food waste in Italy aimed at informing policymakers, stakeholders, and consumers alike, fostering a collective effort to mitigate food waste and its associated impacts. This article argues that household food waste in Italy is worth between EUR 357.43 and EUR 404.62 per household per year, corresponding to 5–7% of the average expenditure for food. This is to say that about one month of food groceries expenses end up being thrown away. This is not only a huge inefficiency but also an opportunity to save money. The study also showed that environmental impact per household per year accounts for 149 kgCO2eq, which contributes to determining climate change, and for 303,498 L of water and 1426 m2 of land used needlessly. This study provides, to our best knowledge, the first economic and environmental assessment of household food waste in Italy. This analysis provides a few suggestions to inform the public debate on this topic. A greater awareness of the economic and environmental implications can support the adoption of more sustainable food consumption patterns, which is also linked to the prevention and reduction of food waste. Moreover, these data can feed the setting up of tailored policy measures to be included in different National Plans, from NEPCs to National Plans for Food Waste Prevention.
Finally, contextualizing household food waste in detail is crucial for effectively directing strategies to reduce it. The fact that this study focuses only on avoidable food waste allows for providing a real figure on the potential savings that can be achieved by reducing it. At the consumer level, increased awareness of potential savings can motivate individuals to reduce waste by adopting simple but effective habits like meal planning, storing food properly, and creatively using leftovers, which help minimize unnecessary purchases and waste [53,62,63]. Moreover, reducing food waste can free up money to spend on healthier and more sustainably produced foods, improving the quality of diets while lowering their environmental impact. For policymakers and educators, understanding which foods are most wasted and the reasons behind this can help to tailor more effective waste reduction strategies. Policymakers should implement food waste reduction targets, incentivize food donations, and standardize date labeling to guide consumer behavior [64], while educational efforts should focus on integrating food waste education in schools and promoting practical food preservation skills [65]. A collaborative approach across all sectors will help foster sustainable consumption patterns, with food waste reduction as a key element of this transition [66,67].

Supplementary Materials

The following supporting information can be downloaded at: https://www.mdpi.com/article/10.3390/su162310614/s1, Table S1: Items included in the considered Food categories.

Author Contributions

Conceptualization, M.A., C.C. and M.V.C.; methodology, M.A., C.C. and M.V.C.; formal analysis, C.C., M.V.C. and G.P.; writing—original draft preparation, M.A., S.C., M.V.C., G.P., P.-J.C., A.M. and E.C.; writing—review and editing, C.C., C.G., L.F. and F.A.; supervision, C.C. All authors have read and agreed to the published version of the manuscript.

Funding

Part of this work was supported by the Barilla Foundation, whose research projects aim to promote sustainable behaviors and healthy food choices. The views reflected in this article represent the professional views of the authors and do not necessarily reflect the views of the Barilla Foundation.

Institutional Review Board Statement

Not applicable.

Informed Consent Statement

Not applicable.

Data Availability Statement

The raw data supporting the conclusions of this article will be made available by the authors on request.

Acknowledgments

The authors of this article would like to acknowledge Inês Guerreiro Gomes Silva for her support in the development and design of the graphical abstract.

Conflicts of Interest

The authors declare no conflicts of interest.

References

  1. United Nations Environment Programme. Food Waste Index Report 2024; UNEP: Nairobi, Kenya, 2024. [Google Scholar]
  2. Kummu, M.; De Moel, H.; Porkka, M.; Siebert, S.; Varis, O.; Ward, P.J. Lost food, wasted resources: Global food supply chain losses and their impacts on freshwater, cropland, and fertiliser use. Sci. Total Environ. 2012, 438, 477–489. [Google Scholar] [CrossRef] [PubMed]
  3. Mbow, C.; Rosenzweig, C.; Barioni, L.G.; Benton, T.G.; Herrero, M.; Krishnapillai, M.; Liwenga, E.; Pradhan, P.; Rivera-Ferre, M.G.; Sapkota, T.; et al. Chapter 5. Food security. In Climate Change and Land: An IPCC Special Report on Climate Change, Desertification, Land Degradation, Sustainable Land Management, Food Security, and Greenhouse Gas Fluxes in Terrestrial Ecosystems; IPCC: Geneva, Switzerland, 2019. [Google Scholar]
  4. United Nations Environment Programme. Food Waste Index Report 2021; UNEP: Nairobi, Kenya, 2021. [Google Scholar]
  5. FAO; UNICEF; WFP; WHO. The State of Food Security and Nutrition in the World 2024—Financing to End Hunger, Food Insecurity and Malnutrition in All Its Forms; FAO: Rome, Italy, 2024. [Google Scholar]
  6. Eurostat. Food Waste and Food Waste Prevention—Estimates; Eurostat: Luxembourg, 2024. [Google Scholar]
  7. European Commission. COMMISSION STAFF WORKING DOCUMENT IMPACT ASSESSMENT REPORT: Accompanying the Document; Directive of the European Parliament and of the Council amending Directive 2008/98/EC on waste; European Commission: Brussels, Belgium, 2023. [Google Scholar]
  8. Sala, S.; De, L.V.; Sanye, M.E. Food Consumption and Waste: Environmental Impacts from a Supply Chain Perspective; European Commission: Brussels, Belgium, 2023. [Google Scholar]
  9. Eurostat. Inability to Afford a Meal with Meat, Chicken, Fish (or Vegetarian Equivalent) Every Second Day; Eurostat: Luxembourg, 2023. [Google Scholar]
  10. Franco, S.; Barbanera, M.; Moscetti, R.; Cicatiello, C.; Secondi, L.; Massantini, R. Overnutrition is a significant component of food waste and has a large environmental impact. Sci. Rep. 2022, 12, 8166. [Google Scholar] [CrossRef] [PubMed]
  11. Moreno, L.C.; Tran, T.; Potts, M.D. Consider a broccoli stalk: How the concept of edibility influences quantification of household food waste. J. Environ. Manag. 2020, 256, 109977. [Google Scholar] [CrossRef] [PubMed]
  12. Giordano, C.; Piras, S.; Boschini, M.; Falasconi, L. Are questionnaires a reliable method to measure food waste? A pilot study on Italian households. Br. Food J. 2018, 120, 2885–2897. [Google Scholar] [CrossRef]
  13. Giordano, C.; Alboni, F.; Falasconi, L. Quantities, determinants, and awareness of households’ food waste in Italy: A comparison between diary and questionnaires quantities. Sustainability 2019, 11, 3381. [Google Scholar] [CrossRef]
  14. van der Werf, P.; Seabrook, J.A.; Gilliland, J.A. Food for thought: Comparing self-reported versus curbside measurements of household food wasting behavior and the predictive capacity of behavioral determinants. Waste Manag. 2020, 101, 18–27. [Google Scholar] [CrossRef]
  15. van Herpen, E.; van Geffen, L.; Nijenhuis-de Vries, M.; Holthuysen, N.; van der Lans, I.; Quested, T. A validated survey to measure household food waste. MethodsX 2019, 6, 2767–2775. [Google Scholar] [CrossRef]
  16. Östergren, K. FUSIONS Definitional Frameword for Food Waste (FP7-Rapport); SIK Institutet för Livsmedel och Bioteknik: Göteborg, Sweden, 2014. [Google Scholar]
  17. Tostivint, C.; Östergren, K.; Quested, T.; Soethoudt, J.; Stenmarck, A.s.; Svanes, E.; O’Connor, C. Food Waste Quantification Manual to Monitor Food Waste Amounts and Progression; BIO by Deloitte: Paris, Grance, 2016. [Google Scholar]
  18. Masotti, M.; Stewart, G.; Close, A.; Setti, M.; Vittuari, M.; Bos-Brouwers, H.; Aramyan, L.; Logatcheva, K.; van Herpen, H. D4.6-Pan-European Scenarios of Food Waste Levels; Refresh, 2019. [Google Scholar]
  19. European Commission. Commission Delegated Decision (EU) 2019/1597 of 3 May 2019 supplementing Directive 2008/98/EC of the European Parliament and of the Council as regards a common methodology and minimum quality requirements for the uniform measurement of levels of food waste. Off. J. Eur. Union 2019, 248, 77–85. [Google Scholar]
  20. Waste Watcher. Waste Watcher 2024. Lo spreco alimentare nei Paesi del G7: Dall’analisi all’azione. 2024. Available online: https://www.sprecozero.it/wp-content/uploads/2024/09/Osservatorio-Waste-Watcher-2024.docx.pdf (accessed on 15 October 2024).
  21. Aureli, V.; Scalvedi, M.L.; Rossi, L. Food waste of Italian families: Proportion in quantity and monetary value of food purchases. Foods 2021, 10, 1920. [Google Scholar] [CrossRef]
  22. Fanelli, R.M. Using causal maps to analyse the major root causes of household food waste: Results of a survey among people from Central and Southern Italy. Sustainability 2019, 11, 1183. [Google Scholar] [CrossRef]
  23. Gaiani, S.; Caldeira, S.; Adorno, V.; Segrè, A.; Vittuari, M. Food wasters: Profiling consumers’ attitude to waste food in Italy. Waste Manag. 2018, 72, 17–24. [Google Scholar] [CrossRef] [PubMed]
  24. Setti, M.; Banchelli, F.; Falasconi, L.; Segrè, A.; Vittuari, M. Consumers’ food cycle and household waste. When behaviors matter. J. Clean. Prod. 2018, 185, 694–706. [Google Scholar] [CrossRef]
  25. Grant, F.; Di Veroli, J.N.; Rossi, L. Characterization of household food waste in Italy: Three year comparative assessment and evaluation of seasonality effects. Waste Manag. 2023, 164, 171–180. [Google Scholar] [CrossRef] [PubMed]
  26. Scalvedi, M.L.; Rossi, L. Comprehensive measurement of Italian domestic food waste in a European framework. Sustainability 2021, 13, 1492. [Google Scholar] [CrossRef]
  27. Waste Watcher. Osservatorio sugli SPRECHI ALIMENTARI DOMESTICI delle FAMIGLIE ITALIANE 2020. 2020. Available online: https://www.sprecozero.it/wp-content/uploads/2021/01/DATI-Waste-Watcher-2020-5-FEBBRAIO-definitivo.pdf (accessed on 15 October 2024).
  28. The Ministry of Entrepreneurship and Made in Italy. Osservatorio Prezzi e Tariffe. Available online: https://www.mimit.gov.it/it/mercato-e-consumatori/prezzi/osservatorio-prezzi-e-tariffe (accessed on 11 September 2024).
  29. ISTAT. Annuario Statistico Italiano; ISTAT: Rome, Italy, 2022. [Google Scholar]
  30. Chiriacò, M.V.; Castaldi, S.; Valentini, R. Determining organic versus conventional food emissions to foster the transition to sustainable food systems and diets: Insights from a systematic review. J. Clean. Prod. 2022, 380, 134937. [Google Scholar] [CrossRef]
  31. Harris, F.; Moss, C.; Joy, E.J.; Quinn, R.; Scheelbeek, P.F.; Dangour, A.D.; Green, R. The water footprint of diets: A global systematic review and meta-analysis. Adv. Nutr. 2020, 11, 375–386. [Google Scholar] [CrossRef]
  32. Petersson, T.; Secondi, L.; Magnani, A.; Antonelli, M.; Dembska, K.; Valentini, R.; Varotto, A.; Castaldi, S. A multilevel carbon and water footprint dataset of food commodities. Sci. Data 2021, 8, 127. [Google Scholar] [CrossRef]
  33. Poore, J.; Nemecek, T. Reducing food’s environmental impacts through producers and consumers. Science 2018, 360, 987–992. [Google Scholar] [CrossRef]
  34. Von Massow, M.; Parizeau, K.; Gallant, M.; Wickson, M.; Haines, J.; Ma, D.W.; Wallace, A.; Carroll, N.; Duncan, A.M. Valuing the multiple impacts of household food waste. Front. Nutr. 2019, 6, 143. [Google Scholar] [CrossRef]
  35. Buzby, J.C.; Hyman, J. Total and per capita value of food loss in the United States. Food Policy 2012, 37, 561–570. [Google Scholar] [CrossRef]
  36. Katajajuuri, J.-M.; Silvennoinen, K.; Hartikainen, H.; Heikkilä, L.; Reinikainen, A. Food waste in the Finnish food chain. J. Clean. Prod. 2014, 73, 322–329. [Google Scholar] [CrossRef]
  37. Silvennoinen, K.; Nisonen, S.; Katajajuuri, J.-M. Food waste amount, type, and climate impact in urban and suburban regions in Finnish households. J. Clean. Prod. 2022, 378, 134430. [Google Scholar] [CrossRef]
  38. Giménez, A.; Alcaire, F.; Vitola, A.; Curutchet, M.R.; Ares, G. Exploring the economic and environmental effects of food waste in Uruguayan households. Enterp. Dev. Microfinanc. 2022, 33, 1–23. [Google Scholar] [CrossRef]
  39. Adelodun, B.; Kim, S.H.; Odey, G.; Choi, K.-S. Assessment of environmental and economic aspects of household food waste using a new Environmental-Economic Footprint (EN-EC) index: A case study of Daegu, South Korea. Sci. Total Environ. 2021, 776, 145928. [Google Scholar] [CrossRef]
  40. Song, G.; Li, M.; Semakula, H.M.; Zhang, S. Food consumption and waste and the embedded carbon, water and ecological footprints of households in China. Sci. Total Environ. 2015, 529, 191–197. [Google Scholar] [CrossRef]
  41. Liu, C.; Shang, J.; Liu, C. Exploring Household Food Waste Reduction for Carbon Footprint Mitigation: A Case Study in Shanghai, China. Foods 2023, 12, 3211. [Google Scholar] [CrossRef]
  42. Cooper, K.A.; Quested, T.E.; Lanctuit, H.; Zimmermann, D.; Espinoza-Orias, N.; Roulin, A. Nutrition in the bin: A nutritional and environmental assessment of food wasted in the UK. Front. Nutr. 2018, 5, 19. [Google Scholar] [CrossRef]
  43. WRAP. Household Food and Drink Waste in the United Kingdom 2021/22; WRAP: Banbury, UK, 2023. [Google Scholar]
  44. Djekic, I.; Operta, S.; Djulancic, N.; Lorenzo, J.M.; Barba, F.J.; Djordjević, V.; Tomasevic, I. Quantities, environmental footprints and beliefs associated with household food waste in Bosnia and Herzegovina. Waste Manag. Res. 2019, 37, 1250–1260. [Google Scholar] [CrossRef]
  45. Djekic, I.; Miloradovic, Z.; Djekic, S.; Tomasevic, I. Household food waste in Serbia–Attitudes, quantities and global warming potential. J. Clean. Prod. 2019, 229, 44–52. [Google Scholar] [CrossRef]
  46. Cakar, B.; Aydin, S.; Varank, G.; Ozcan, H.K. Assessment of environmental impact of FOOD waste in Turkey. J. Clean. Prod. 2020, 244, 118846. [Google Scholar] [CrossRef]
  47. Read, Q.D.; Brown, S.; Cuéllar, A.D.; Finn, S.M.; Gephart, J.A.; Marston, L.T.; Meyer, E.; Weitz, K.A.; Muth, M.K. Assessing the environmental impacts of halving food loss and waste along the food supply chain. Sci. Total Environ. 2020, 712, 136255. [Google Scholar] [CrossRef] [PubMed]
  48. Cicatiello, C.; Giordano, C. Measuring household food waste at national level: A systematic review on methods and results. CABI Rev. 2018, 13, 1–8. [Google Scholar] [CrossRef]
  49. Vargas-Lopez, A.; Cicatiello, C.; Principato, L.; Secondi, L. Consumer expenditure, elasticity and value of food waste: A Quadratic Almost Ideal Demand System for evaluating changes in Mexico during COVID-19. Socio-Econ. Plan. Sci. 2022, 82, 101065. [Google Scholar] [CrossRef] [PubMed]
  50. Secondi, L.; Principato, L. Consumer choice and food waste: A demand-side perspective to address the challenge of sustainable consumption models. In Transitioning to Responsible Consumption and Production; MDPI: Basel, Switzerland, 2020; p. 83. [Google Scholar]
  51. Schanes, K.; Dobernig, K.; Gözet, B. Food waste matters-A systematic review of household food waste practices and their policy implications. J. Clean. Prod. 2018, 182, 978–991. [Google Scholar] [CrossRef]
  52. Van Geffen, L.; van Herpen, E.; van Trijp, H. Household Food waste—How to avoid it? An integrative review. In Food Waste Management: Solving the Wicked Problem; Palgrave Macmillan: Cham, Switzerland, 2020; pp. 27–55. [Google Scholar]
  53. Romani, S.; Grappi, S.; Bagozzi, R.P.; Barone, A.M. Domestic food practices: A study of food management behaviors and the role of food preparation planning in reducing waste. Appetite 2018, 121, 215–227. [Google Scholar] [CrossRef]
  54. Boulet, M.; Hoek, A.C.; Raven, R. Towards a multi-level framework of household food waste and consumer behaviour: Untangling spaghetti soup. Appetite 2021, 156, 104856. [Google Scholar] [CrossRef]
  55. Attiq, S.; Habib, M.D.; Kaur, P.; Hasni, M.J.S.; Dhir, A. Drivers of food waste reduction behaviour in the household context. Food Qual. Prefer. 2021, 94, 104300. [Google Scholar] [CrossRef]
  56. van der Werf, P.; Seabrook, J.A.; Gilliland, J.A. Food for naught: Using the theory of planned behaviour to better understand household food wasting behaviour. Can. Geogr./Géographe Can. 2019, 63, 478–493. [Google Scholar] [CrossRef]
  57. Pellegrini, G.; Sillani, S.; Gregori, M.; Spada, A. Household food waste reduction: Italian consumers’ analysis for improving food management. Br. Food J. 2019, 121, 1382–1397. [Google Scholar] [CrossRef]
  58. van der Werf, P.; Seabrook, J.A.; Gilliland, J.A. “Reduce food waste, save money”: Testing a novel intervention to reduce household food waste. Environ. Behav. 2021, 53, 151–183. [Google Scholar] [CrossRef]
  59. Graham-Rowe, E.; Jessop, D.C.; Sparks, P. Identifying motivations and barriers to minimising household food waste. Resour. Conserv. Recycl. 2014, 84, 15–23. [Google Scholar] [CrossRef]
  60. Quested, T.E.; Marsh, E.; Stunell, D.; Parry, A.D. Spaghetti soup: The complex world of food waste behaviours. Resour. Conserv. Recycl. 2013, 79, 43–51. [Google Scholar] [CrossRef]
  61. UN General Assembly, Transforming our world: The 2030 Agenda for Sustainable Development, A/RES/70/1. 21 October 2015. Available online: https://www.refworld.org/legal/resolution/unga/2015/en/111816 (accessed on 15 October 2024).
  62. Aloysius, N.; Ananda, J.; Mitsis, A.; Pearson, D. Why people are bad at leftover food management? A systematic literature review and a framework to analyze household leftover food waste generation behavior. Appetite 2023, 186, 106577. [Google Scholar] [CrossRef] [PubMed]
  63. WRAP. Food Waste Reduction Roadmap Progress Report 2020; WRAP: Banbury, UK, 2020. [Google Scholar]
  64. Cattaneo, A.; Sánchez, M.V.; Torero, M.; Vos, R. Reducing food loss and waste: Five challenges for policy and research. Food Policy 2021, 98, 101974. [Google Scholar] [CrossRef] [PubMed]
  65. Nikravech, M.; Langen, N.; Bendisch, F.; Ziesemer, F.; Abels, S.; Schrader, U.; Fischer, D. The Food Waste Lab: Improving food waste reduction behavior through education. J. Clean. Prod. 2022, 370, 133447. [Google Scholar]
  66. Hagedorn, W.; Wilts, H. Who should waste less? Food waste prevention and rebound effects in the context of the Sustainable Development Goals. GAIA-Ecol. Perspect. Sci. Soc. 2019, 28, 119–125. [Google Scholar]
  67. Lemaire, A.; Limbourg, S. How can food loss and waste management achieve sustainable development goals? J. Clean. Prod. 2019, 234, 1221–1234. [Google Scholar] [CrossRef]
Figure 1. Comparative overview of the quantity of household food waste, its monetary value, carbon, water, and land footprints (CF, WF, and LF) in Italy, indexed (as min. 0 and max. 1) against the maximum value of each parameter (median values).
Sustainability 16 10614 g001
Table 1. Avoidable food waste in Italy (data provided by the authors of Giordano et al., 2019 [13]).
Food CategoryQuantity of Household Food Waste (FW (g)) per Person per Week
VEGS135.8
FRUITS85.7
MEAT34.5
CEREALS40.1
BAKED61.4
DAIRY92.1
DRINKS21.4
DESSERTS13.8
LEGUMES9.3
FISH8.9
EGGS5.4
OTHER21.4
TOTAL530.0
Table 2. Monetary value of food waste in 6 Italian provinces (mean and median values).
ProvinceMonetary Value FW per Household per Week (Mean Prices)Monetary Value FW per Household per Week (Median Prices)
MilanEUR 390.77 EUR 327.23
ParmaEUR 404.62EUR 363.53
FirenzeEUR 373.95EUR 302.07
RomaEUR 375.90EUR 306.56
BariEUR 357.43EUR 337.83
PalermoEUR 362.78EUR 308.66
Table 3. Environmental impact assessment (mean values of CF, WF, LF).
Food CategoryCF
kg CO2eq per Person per Week
WF
Liters per Person per Week
LF
m2 per Person per Week
VEGS0.122630.10
FRUITS0.0682650.35
MEAT0.4744415.30
CEREALS0.049740.15
BAKED0.069730.79
DAIRY0.2853324.45
DRINKS0.021190.17
DESSERTS0.028410.34
LEGUMES0.007300.11
EGGS0.018190.04
FISH0.045260.05
OTHER0.06011560.08
Total 1.25253811.9
Table 4. Food categories’ overall impact at the household level in Italy, per year (median values).
Food CategoryQuantity of FW
(g per Household per Year)
CF (kg CO2
per Household per Year)
WF (Liters of Water per Household per Year)LF (m2 per Household per Year)Monetary Value (EUR per Household per Year, Average of Median Prices in Italy)
VEGS16.277.8952868.9540.10
FRUITS10.294.641422319.8531.24
MEAT4.1333.2228896178.4273.28
CEREALS4.784.21792214.0611.00
BAKED7.308.08880945.7430.26
DAIRY11.0016.0630930532.2277.12
DRINKS2.511.7720094.475.23
DESSERTS1.653.1540633.3722.35
LEGUMES1.110.56259612.816.22
EGGS0.672.1917164.2014.76
FISH1.063.6323736.064.13
OTHER2.566.5971899.018.61
TOTAL63.3392116,014839324.31
Disclaimer/Publisher’s Note: The statements, opinions and data contained in all publications are solely those of the individual author(s) and contributor(s) and not of MDPI and/or the editor(s). MDPI and/or the editor(s) disclaim responsibility for any injury to people or property resulting from any ideas, methods, instructions or products referred to in the content.

