Article

Climate-Driven vs Human-Driven Land Degradation? The Role of Urbanization and Agricultural Intensification in Italy, 1960–2030

by
Marco Maialetti
1,
Matteo Clemente
2,
Kostas Rontos
3,
Donato Scarpitta
4,
Alessandra Stefanoni
5,
Fabrizio Rossi
5,
Adele Sateriano
6 and
Luca Salvati
7,*
1
Independent Researcher, 00195 Rome, Italy
2
Department for Innovation in Biological, Agro-Food and Forest Systems (DIBAF), University of Tuscia, 01100 Viterbo, Italy
3
Department of Sociology, Aegean University, 81100 Mitilini, Greece
4
Independent Researcher, 84067 Santa Marina, Italy
5
Department of Economics, Engineering, Society and Business Organization (DEIM), University of Tuscia, 01100 Viterbo, Italy
6
Mediterranean Sustainable Development Foundation (MEDES), 84029 Sicignano degli Alburni, Italy
7
Department of Methods and Models for Economics, Territory and Finance (MEMOTEF), Faculty of Economics, Sapienza University of Rome, 00161 Rome, Italy
*
Author to whom correspondence should be addressed.
Sustainability 2024, 16(20), 8938; https://doi.org/10.3390/su16208938
Submission received: 13 September 2024 / Revised: 8 October 2024 / Accepted: 12 October 2024 / Published: 16 October 2024
(This article belongs to the Special Issue Urban Planning and Sustainable Land Use—2nd Edition)

Abstract

:
Climate warming, agricultural intensity, and urban growth are main forces triggering land degradation in advanced economies. Being active over different spatial and temporal scales, they usually reflect—at least indirectly—the impact of additional factors, such as wellbeing, demographic dynamics, and social development, on land quality. Using descriptive statistics and a multiple regression analysis, we analyzed the impact of these three processes comparatively over a decadal scale from 1960 to 2020 at the provincial level (Nuts-3 sensu Eurostat) in Italy. We enriched the investigation with a short-term forecast for 2030, based on four simplified assumptions grounded on a purely deterministic approach. Land degradation was estimated adopting the Environmental Sensitive Area Index (ESAI) measured at the spatio-temporal scale mentioned above. Computing on multiple observations at nearly 300,000 locations all over Italy, provinces were regarded as representative spatial units of the territorial pattern of land degradation. Between 1960 and 1990, the three predictors (climate, agriculture, and urbanization) explained a relatively high proportion of variance, suggesting a modest role for any other (unobserved) factor. All of these factors were found to be highly significant predictors of land degradation intensity across provinces, the most impactful being farming intensity. The highest adjusted-R2 coefficient was observed in both 1990 and 2000, and suggests that the three predictors still reflect the most powerful drivers of land degradation in Italy at those times, with a marginal role for additional (unobserved) factors. The impact of farming intensity remained high, with the role of urbanization increasing moderately, and the role of climate aridity declining weakly between 2000 and 2010. In more recent times (2010 and 2020), and in future (2030) scenarios, the adjusted R2 diminished moderately, suggesting a non-negligible importance of external (unobserved) factors and the rising role of spatial heterogeneity. The climate factor became progressively insignificant over time, while increasing the role of urbanization systematically. The impact of farming intensity remained high and significant. These results underlie a latent shift in the spatial distribution of the level of land vulnerability in Italy toward a spatially polarized model, influenced primarily by human pressure and socioeconomic drivers and less intensively shaped by biophysical factors. Climate aridity was revealed to be more effective in the explanation of land degradation patterns in the 1960s rather than in recent observation times.

1. Introduction

Affluent countries have experienced persistent economic growth over the last decades, sometimes sacrificing environmental quality and the overall functionality of soils and ecosystems, because of intense threats to landscapes and biodiversity [1,2,3]. Land degradation can be considered the ultimate process of such dynamics, implying both soil resource depletion and a monetary loss of agricultural incomes, finally leading to point processes of early desertification [4]. Although this process was described with multiple definitions in the recent literature, the United Nation Convention to Combat Desertification (UNCCD) provided a generalized outline in 1977 highlighting ‘land degradation’ as a subtle phenomenon ‘in arid, semi-arid and dry sub-humid areas resulting from various factors, including climatic variations and human activities’ [5].
Despite global warming frequently being considered the main factor driving land degradation in already affected (or, at least, sensitive) countries, economic growth, social disparities, and demographic dynamics, were demonstrated to have important relations with land quality and soil resources [6,7,8]. Socioeconomic causes at the base of early desertification processes in advanced countries also threatened the sustainable development path of local communities in both relict and marginal districts (exposed, e.g., to soil erosion, depopulation, and land abandonment) and in affluent districts of more accessible locations—frequently exposed to soil salinization, compaction, sealing, and contamination, because of crop intensification and urban expansion at large [9,10,11]. When associated with (more or less intense) land degradation dynamics, the debate on sustainable development should be clearly coupled with a comparative, diachronic scrutiny of the complex interplay of biophysical and socioeconomic dimensions of change, that may impact, together, landscapes, environments, natural resources, agricultural production yields, and biodiversity stocks [12,13,14].
In more recent times, empirical studies have documented—especially adopting qualitative (or quali-quantitative, mixed) approaches—land degradation as expanding rapidly across moderately dry regions in advanced economies, with a more intense spatial polarization in affected and unaffected districts [15,16,17]. Such dynamics were primarily explained with a reduced impact of global factors (such as climate warming, determining, e.g., soil aridity, prolonged droughts, and water shortage, especially for crop irrigation), and an increased effect of regional forces—mostly reflecting higher anthropogenic pressure, accelerated socioeconomic dynamics, and territorial disparities in affluent (leading) and disadvantaged (lagging) regions [18,19,20]. Additionally, local heterogeneity—remaining substantially unexplained because it is not clearly associated either with climate or with land-use issues—arose as an additional driver of land degradation [21,22,23]. However, empirical studies grounded on truly quantitative exercises run on specific long-term monitoring data are increasingly needed for both knowledge (scientific) improvement and policy consolidation of operational, and more effective, strategies for preventing early desertification signs [24,25,26].
In this perspective, while being reflective of the permanent interaction among ecological and socioeconomic systems, land degradation (LD) in Southern Europe—one of the most evident desertification hotspots in the world [27], including some advanced production systems and rather healthy contexts, such as in metropolitan areas of Portugal and Spain (Lisbon, Madrid, and Barcelona), tourism locations along the Mediterranean rim from Portugal to Turkey, as well as the Po valley in Italy—was occasionally studied over sufficiently long time windows [28,29,30]. A permanent assessment covering a prolonged time horizon—being regarded as a powerful operational tool informing policy implementation in Mediterranean Europe—is increasingly requested to distinguish the differential impact of multiple drivers of LD, and especially biophysical from socioeconomic ones [31].
By considering the multiple forms of LD depending on landscape characteristics, geological conditions, spatial (observation) scale, and territorial contexts [32], the present study exploits a unique time series of experimental observations estimating LD intensity with a comparatively broad coverage (the whole of Italy), homogeneous spatial resolution representative of territorial processes and local heterogeneity (NUTS-3 level provinces), and a prolonged investigation time interval depicting past, present, and future dynamics (1960–2030), and thus providing the necessary historical depth to our quantitative study [33].
Initially depicted as a typical ‘rural issue’ in the UNCCD convention Annex IV addressing the Mediterranean environmental specificities [34], a progressive shift in the geography of LD was observed in Southern Europe, and especially in Italy, highlighting the duality between central and peripheral regions [35]. Going beyond the vulnerability of rural areas to global warming, wildfires, overgrazing, soil erosion, and salinization, LD in recent times was assumed to be more intensively associated with (apparently latent and spatially heterogeneous) drivers such as suburbanization, industrialization, and the intrinsic linkage with economic growth and population dynamics [36]. Assuming LD in advanced economies as a ‘holistic’ problem—not exclusively dealing with ‘strictly rural’ districts—and requiring distinctive responses for both rural and peri-urban areas, the present study provides, likely for the first time in the recent literature, an empirical exercise, grounded on the results of a permanent monitoring approach quantifying the changing impact of climate, urbanization, and farming intensity on LD dynamics over time [37,38,39].
The present study specifically evaluates the individual role of climate aridity, agricultural intensity, and urbanization assumed as main factors underlying soil degradation in multiple socioeconomic settings of Italy, a representative hotspot for early desertification risk in Mediterranean Europe [40,41,42]. Based on simplified assumptions, our work investigates the changing geography of Environmentally Sensitive Area Index (ESAI) scores at the province (NUTS-3) level with the aim of quantifying the long-term effects of these three factors and other (unobserved) forces in Italy [43]. Assuming the broad sample size as providing a stable distribution of the ESAI scores, we tested the role of three predictors of (i) climate aridity, (ii) farming intensity, and (iii) urbanization over 110 Italian provinces using a linear, multiple regression model [44]. This approach considered each observation separately, thus evaluating eleven points in time (1960, 1970, 1980, 1990, 2000, 2010, 2020, and 2030: S1-S4 scenarios). Following standard econometric diagnostics, the determination coefficient (adjusted R2) of each regression model was intended as a measure of the cumulative impact of the tested processes, indirectly outlining the eventual role of other (unobserved) factors, becoming more or less intense over time [45]. The empirical results of this study can be generalized to other Mediterranean regions [46], and possibly adapted to provide indications informing responses of local communities to early desertification.

2. Literature Review

Land degradation in recent times became an important issue having both ecological and socioeconomic implications for advanced economies, and involving both strictly rural areas and more dynamic agricultural districts and close-to-urban territories [47,48,49]. Various factors intensified in the Mediterranean basin, creating pre-conditions for the appearance of early desertification signs, especially in Southern Spain, in restricted parts of Greece and, more recently in Southern Italy and Portugal [50]. As a matter of fact, specific processes leading (at least indirectly) to desertification, have been demonstrated to affect LD intensity, often involving unaffected territories up to a few decades ago [51]. Non-agricultural factors, such as infrastructural development, agglomeration economies, urbanization/industrialization, and tourism growth, among others, were increasingly documented as important factors in LD, especially since the early-1990s, suggesting a more ‘holistic’ role for LD taken as a non-exclusively ecological issue, while encompassing the ‘socioeconomic’ dimension of change [52,53,54].
Interestingly, such evolution in LD geography (and its main drivers) in Southern Europe was observed systematically in various land classes, namely the following: (i) ‘strictly desertified’ areas, intended as dryland with ‘functional sterility’, particularly scarce in the Northern Mediterranean region and most diffused in the Southern bank [55]; (ii) areas classified as at risk, displaying semi-arid/dry ecological traits with specific, and individual, elements (e.g., vegetation cover, land-use, and climate) mitigating LD [56]; and, finally, (iii) sensitive districts where LD acts locally, having lost the ecological and the economic potential only in part [57]. However, the impact of different drivers (climate aridity, crop intensity, and urban expansion) across such diversified territories is basically unknown [58].
A basic explanation of LD may reflect the expansion of resident population demanding more land for settlement and cropping, since increasing human pressure is assumed to influence LD, usually in a negative fashion [59]. At a local scale, a growing population in suburban locations may additionally have indirect feedback, affecting LD negatively and additively [60]. However, empirical studies have occasionally documented a direct correlation between demographic dynamics and LD, while a mix of population dynamics, income growth, and settlement expansion may explain LD intensification more effectively [61]. In other words, this ‘Malthusian’ hypothesis was not finding a direct, empirical verification, although several studies argue population density (and change) as an indirect LD driver [62]. In this perspective, the ‘inverted-U’ relationship (hereafter known as the Environmental Kuznets Curve, EKC) sometimes observed between selected indicators of LD, and the level of per-capita income, received only partial confirmation through field studies [63]. As a matter of fact, this process was demonstrated to be heavily dependent on the combination of land-use and settlement morphologies, economic dynamics, and fringe land management [64]. Moving toward this assumption, the ‘center-periphery’ hypothesis argues how the human-driven misuse of land may generate territorial divergences interpreted as a factor accelerating LD [65]. Socioeconomic disparities should be monitored exhaustively through empirical approaches integrating different (social, environmental, and developmental) frameworks [66].
Crop intensification, overgrazing, mechanization, unsustainable irrigation, and clear-cutting made additional contributions to LD, especially in ecologically fragile conditions [67]. Policy strategies supporting agricultural development have sometimes led to spatial polarization in ‘favorable’ and ‘unfavorable’ districts, with the abandonment of marginal land taken as another consequence of Mediterranean LD [68]. In this perspective, the ‘farming intensification’ hypothesis additionally assumes improvements in agricultural technology as affecting LD [69], although the (point) impacts cannot be easily quantified without information regarding technology, output, and market elasticity [70]. Conversely, new technologies for non-frontier agriculture may intrinsically reduce pressures on the agricultural frontier [71].
The ‘downward spiral’ hypothesis assumes that climate change (both global and local warming) acts differently on various LD processes [72]. There is still little evidence on the linkage between LD and climate change in Southern Europe, and the possible interaction with socioeconomic drivers, as delineated above [73]. Global warming, and the associated environmental spirals (e.g., soil erosion, salinization, and aridity), were initially associated with intense LD processes, both in remote areas (i.e., with low-income agriculture, mostly based on self-consumption farms) and in more dynamic regions, i.e., with high-income agriculture based on farming intensification processes [74]. Soil aridity and poverty may finally reflect the off-farm employment–environment connections [75]. Because of a rapid economic growth in Mediterranean countries, the role of climate change as a possible LD driver should be clarified in connection with other socioeconomic processes [76]. This deserving objective is the main target of the present research.

3. Methodology

3.1. Study Region

In this study, the level of land degradation (LD) was assessed along sixty years over the whole Italian territory, taken as a kaleidoscopic ensemble of soil classes and landscape types possibly representative of the Northern Mediterranean region [31]. We adopted a composite index summarizing the information of 14 elementary variables organized in four distinct themes (climate, soil, vegetation, and land-use), and generating four partial indicators (climate quality, soil quality, vegetation quality, and land-use quality). A permanent monitoring of LD was assured with regularly updated observations (every ten years, regarded as an appropriate frame when studying changes in the level of LD over time) collected at the same spatial scale and covering past dynamics (1960–2010), present trends (2020), and future dynamics (four scenarios, based on alternative assumptions (S1 to S4, see below) for 2030).
The study area was classified into three macro-regions (north, centre, and south), 20 administrative regions (NUTS-2 geographical level), and more than 100 provinces (NUTS-3 level) covering a total surface area of nearly 301,330 km2 [43]. Over the time period considered in this study, provinces have ranged from 92 to 110. In this work, we considered the provincial boundaries referring to the 2007 administrative setting, with 110 governing units [63]. We extracted the needed information from the original raster files at the geographical level illustrated above (n = 110 provinces) in order to make the statistical analysis fully comparable over time [42]. Earlier studies have demonstrated how the geography of Italy may reflect the latent interaction of biophysical and socioeconomic dimensions predisposing land to (intense) degradation processes [24].

3.2. Data Sources

The Environmentally Sensitive Area Index (ESAI) is one of the best known indicators of land degradation for the Mediterranean basin, being more recently adopted (with few adjustments) in many other regions of the world [29]. In any application, it considered four research dimensions (climate, soil, vegetation/land use, and land management) as relevant for the construction of the composite index (see Benassi et al. [46] for a comprehensive review on the statistical sources providing information on land degradation in Europe). In this study, quantitative elaborations stemming from homogeneous, comparable public data sources encompassed a relatively long time period from the early 1960s to the early 2020s [47]. Earlier study periods were rarely investigated in the literature (and were not studied here) because of the absence of comparable information necessary to run the ESAI model at the national scale in Italy [64]. Short-horizon scenarios for 2030 were finally elaborated and considered in the present analysis [43].

3.3. Thematic Indicators

More specifically, climate quality was quantified on the basis of three variables: average annual precipitation, a standard aridity index, and land aspect [32]. Average annual precipitation and aridity index (the ratio of precipitation to reference evapotranspiration, sensu United Nations Environmental Program, UNEP) were computed by decade (e.g., 1951–1960, …, 2011–2020) from raw data extracted from the National Agro-meteorological Database of the Italian Ministry of Agriculture and Forestry Policies (MIPAF). Slope aspect was derived from the ASTER (Advanced Spaceborne Thermal Emission and Reflection Radiometer) database, a global 30 m resolution Digital Elevation Model (DEM) [45]. As indicators of soil quality, depth, texture, slope, and parent material were derived from a digital map derived from the Joint Research Centre (Ispra) at a resolution of 1 km2 that was prepared on basic data in the European Soil Database [34]. Based on the evidence provided in Salvati and Zitti [33], soil variables were regarded as static over the investigated time.
Vegetation cover and land-use were estimated adopting four variables [77] (vegetation cover, fire risk, the level of protection offered by vegetation against soil erosion, and the degree of drought resistance reflected in current vegetation cover), extracted from three comparable (digital) maps (a Corine-like ‘Land Use Map of Italy’ released by the National Research Council (CNR) and the Italian Touring Club (TCI) for 1960, and two Corine (Coordination of Information for the Environment) land cover maps, respectively dated 1990 and 2018). Corine maps allow continuous monitoring from 1990 to 2018 not only for Italy, but for the whole of Europe [43]. An explicit evaluation of land management background conditions considered population dynamics and land-use change in rural spaces [78], respectively computing the demographic density and annual population growth rates (%) at the municipal scale from census data (source: Istat) as proxies of human pressure [74]. Land-use intensity was finally derived from the three maps mentioned above after the classification of each land category according to the assumed intensity of economic use [32]. Details on data sources, elementary variables, partial indicators and the composite index have been provided in Recanatesi et al. [43].

3.4. Deriving ESAI Scenarios for 2030

Four short-term scenarios for desertification risk have been delineated with a time horizon toward 2030, through a recalculation of the ESA index, based on a system of four assumptions (i.e., the intersection of, respectively, two basic climate hypotheses and two basic demographic hypotheses associated with future trajectory paths). Both soil and vegetation layers were considered stable over time, depending on the fact that both dimensions, and especially the soil variables, modify relatively slowly along decades [31]. All scenarios have been derived across a national coverage (i.e., the whole of Italy) at the same spatial scale of the ESAI historical series (1960–2020) already available within the study (see Section 3.3 and Section 3.5). Statistics delineating the main results of the four scenarios were calculated at the provincial level. This elaboration should be considered as preliminary, and provides a descriptive reference with respect to the long-term trends observed and summarized between 1960 and 2020.
From a technical point of view, the approach considered here adopted a fully exploratory rationale based on ‘what … if’ predictions, with no rigid assumptions typical of socioeconomic scenarios (e.g., on population structure), and associated with the calculation requirements requested by the ESA scheme [79]. In practice, our scenarios’ assumptions were based on some contextual conditions considered more likely in the selected short-term projection horizon (2020–2030). The ESAI was recalculated accordingly at the end of the projection period (2030) and the expected deviations were evaluated compared to a reference period (1960–2010) or the most recent observed period (2010–2020). The two climate scenarios were derived from a fuzzy clustering procedure illustrated in earlier studies [44].
This choice, compared with other computational alternatives, was motivated with the need for producing reference scenarios specifically aimed at calculating ESAI scores covering the whole territory, under the assumption that the most relevant climatic variables changing over time are total rainfall and the average annual aridity index as inputs of the ESAI (land aspect was taken as stable over time). A descriptive methodology delineating future scenarios from an exploratory analysis of the past climatic conditions was preferred to more extensive results derived from climate circulation global models [42]. These results may give stable and reasonable estimates on a regional/local scale and are basically consistent with a ‘what...if’ approach capable of providing relevant inputs to the estimation of the ESAI score all over Italy in the coming future [13].
In summary, Salvati et al. [44] ran a non-hierarchical (k-means) clustering of 544 representative time series of total rainfalls and aridity indexes for a sufficiently long time interval (1961–2010) and that covered the country homogeneously, thus providing a representative geography of Italian climatic conditions most likely affecting LD conditions. Observations at each year of the investigated time period included a number of descriptive variables—computed as annual averages—such as the cumulative month precipitation, month thermometric regime (minimum and maximum air temperature), and month aridity index. The data matrix with variables (columns) and rows representing the analysis’ unit was elaborated via multivariate statistics reducing its intrinsic complexity. Specifically, a spectral decomposition (i.e., a principal component analysis) of the two-way data matrix was adopted with the aim of reducing inputs and managing the eventual redundancy by creating few independent components as a linear combination of the input variables [63]. A sequential k-means clustering of the statistical units taken as inputs was subsequently applied to the relevant components extracted in the operational step described before. In this way, all of the observation years were classified into three homogeneous clusters defined through a Cubic Clustering Criterion (CCC) that provided groups with the highest internal homogeneity [46]. They were labelled as ‘S0’, ‘S1’, and ‘S2’, respectively. Based on the analysis of the climatological variables for each year, the S0 cluster was considered as a reference period, in accordance with the long-term climatic averages, since it grouped years (44% of the analyzed sample) experiencing the wettest conditions observed during the investigated time interval (average annual values for Italy; rainfalls: 844 mm; aridity index: 1.68). The S1 group included years with a limited deviation toward dryness from the climatology, which together formed 28% of the analyzed sample (average annual values for Italy; rainfalls: 777 mm; aridity index: 1.49). The S2 group represented years with a more evident deviation from the climatic averages, both in terms of precipitation and aridity regimes, and includes another 28% of the sample (average annual values for Italy; rainfalls: 716 mm; aridity index: 1.35).
As can be seen from the values above, years belonging to the S1 cluster were taken as representative of a future scenario indicating a moderate trend towards potentially drier soil conditions with a decrease from 1.68 to 1.49 of the aridity index at the national level. Years classified into the S2 scenario delineated a more critical condition with a higher aridity index, on average, and a marked decline in average annual precipitation at the national level. Assuming past weather conditions as a possible ensemble for future conditions, the S1 and S2 scenarios were used, together with the demographic scenarios, to compose the final ESAI projection, according to the ‘what … if’ logic [42].
As regards population, future projections take on particularly problematic aspects based on recent demographic dynamics, being associated not only with the intrinsic aspects of (natural) growth, but also with the increasingly relevant contribution of the migration balance, and they were particularly hard to evaluate over long time horizons and at relatively detailed spatial scales [49]. In this regard, we worked on ESAI relevant variables such as population density, and the average annual growth rate of the resident population. Having to project demographic information at a spatial scale consistent with the ESAI, and therefore subject to strong estimation errors, we adopted two scenarios, in accordance with what was done for climate (see above), based on the analysis of past trends derived from the available database and built through the collection and digitalization of historical demographic data [46], already available for the construction of the ESAI (1960–2020).
As for climate, the two scenarios considered for demography represent a range of possible trends between two extremes [29]. This aspect was, in our opinion, very useful in the ‘what … if’ interpretative scheme, which thus represents a set of possible extreme states of the system under observation [19]. In this sense, rather than providing a point estimate (possibly affected by a high error, given the uncertainties mentioned above), a confidence interval was provided, using two values for both variables mentioned above (population density and demographic growth), i.e., a ‘base’ value and a ‘critical’ value, which represent extreme territorial conditions in the estimated time horizon up to 2030 [18]. The first scenario, S1, represents a ‘stable’ condition, i.e., reflecting homogeneous dynamics over both time and space with respect to the last observation period (2011–2021). In other words, local-scale demographic dynamics that significantly differ from the reference average of the observation period are not excluded; this scenario assumes that the spatial distribution of the resident population remained constant with respect to the reference period (2021), e.g., maintaining a balance between urban and rural areas [36]. Operationally, the result of these ‘stable’ dynamics is reflected in a municipal population density consistent with the average of the last observation period 2011–2021 and a zero population growth rate.
The second scenario, S2, instead represents a dynamic hypothesis incorporating moderate population growth based on a longer observation period, represented by the last 30 years of observation (1991–2021). This period, particularly homogeneous with respect to the previous ones, indicated a modest population growth rate at the national scale, basically alimented by the migration balance (immigration rates higher than emigration rates), and a stabilization of the population density on high values especially in peri-urban areas and in the most accessible rural areas [16], where a large proportion of the Italian population is concentrated [46]. In this scenario, the projected growth rate at the local scale was the one observed for municipalities between 1991 and 2021 and the population density is derived from the sum of the population stock in 2021 and the population flow resulting from the growth rate estimated as above. This scenario will lead to higher estimations of population density—possibly more impactful on the ESAI—and delineates a rising pressure on the environment.
The four scenarios (climate + demography) were therefore derived from the recalculation of the ESAI on the basis of the inputs from the intersection between the S1 or S2 (climate) and S1 or S2 (demography) scenarios, providing the following outcomes: (i) the S1 scenario as the intersection of S1(climate) and S1(demography); (ii) the S2 scenario as the intersection of S1 (climate) and S2 (demography); (iii) the S3 scenario as the intersection of S2 (climate) and S1 (demography); and, finally, (iv) the S4 scenario as the intersection of S2 (climate) and S2 (demography). Based on the premises above, S1 to S4 represent a range of progressively worse environmental conditions that were assumed to be more impactful on the ESAI. In particular, the S4 scenario assumes the most intense change to the worst conditions with regard to both climate and demography [35]. S1 is instead representing a negligible variation in respect to the initial conditions observed at the beginning of the scenario horizon (2020).

3.5. Data Analysis

By reclassifying the elementary variables mentioned above [77] into a score ranging from 1 (i.e., the lowest degree of land degradation) to 2 (i.e., the highest degree of degradation), the ESAI approach produced four (partial) indicators—Climate Quality Index (CQI), Soil Quality Index (SQI), Vegetation Quality Index (VQI), and land Management Quality Index (MQI). They were calculated as a geometric mean of the different scores assigned to each value of the inputs (3 variables for CQI and MQI, and 4 variables for SQI and VQI) at any given location. The final ESAI value (for each observation year, including 1960, 1970, 1980, 1990, 2000, 2010, and 2020, and for the 2030 scenarios, including S1, S2, S3, and S4) was then estimated at each spatial unit (1 km2 grid) as the geometric mean of the score of each partial indicator (CQI, SQI, VQI, and MQI). Summarizing the elementary score at each location, a mean value of the ESAI (still ranging from 1 to 2) was finally calculated at the NUTS-3 province level in Italy. ArcGIS (release 10) spatial tools (ESRI, Inc., Redwoods, USA) made all of these calculations possible [43]. Maps depicting the spatial distribution of the ESAI at the beginning and the end of the study period were provided in Figure 1, illustrating as well the main spatial trends toward an increasing (or decreasing) level of land exposure to degradation over time [31].
Following a descriptive analysis of the spatial distribution of ESAI scores along three geographical gradients (urban/non-urban, agricultural/non-agricultural, and north/south), we performed exploratory cross-section regressions of the average ESAI value at the provincial scale (NUTS-3 level) by year and three predictors of urbanization, crop intensity, and climate regimes [46]. More specifically, we modeled such possible drivers of the level of vulnerability to LD using dummies (i.e., dichotomous variables) characterizing each Italian province (the same observation scale adopted before for the dependent variable) as (i) urban (1) or rural (0); (ii) specialized (1) or unspecialized in agriculture; and (iii) located in Southern Italy (1), i.e., provinces belonging to one of eight administrative regions (Abruzzo, Molise, Campania, Basilicata, Apulia, Calabria, Sicily, and Sardinia) or in Central-Northern Italy (0). The three classifications were based on the Italian Geographical Atlas of official statistics released by the National Statistical Institute (Istat) and on other additional statistics downloaded in shape format from the same website (www.istat.it) [42,43,44,46,49].
Urban provinces were classified with population density above 250 inhabitants/km2; agricultural specialization derived from a specific policy classification of Italian land delineated in Istat ‘Atlante Statistico dei comuni’; and depending on the percent share of value added (>5%) and above-average labor productivity in agriculture (reflecting intensive and specialized districts). With few exceptions, the latitude gradient basically reflected the climate gradient in Italy [46]. Northern and Central Italy were classified, in the National Action Plan to combat desertification (NAP)—the official planning document in compliance with Annex IV (Mediterranean countries) of the world strategy of the United Nations Convention to Combat Desertification (UNCCD)—as wet or sub-humid regions where the aridity index (the ratio of annual precipitation to reference evapotranspiration) approaches 0.9–1.1, on average [42]. Southern regions were classified as drier because the average aridity index amounted here to 0.5–0.6, on average [46]. Additionally, latitude in a highly divided country like Italy reflected a particularly well-known gradient shaping economic dynamics (accelerated in Northern Italy), poverty (higher in Southern Italy), and policy efforts (bigger amounts of subsidies to economic activity and population recorded, on average, in Southern Italy).
As proposed in this study, cross-section (linear and multiple) regression provided a descriptive and preliminary measure of the latent linkage between the potential exposure of land to degradation and three, basically independent, candidate drivers, as delineated above. We assume these three dimensions as important, but not exclusive, factors of land degradation [15,20,22], and we measured their cumulative impact on land degradation using the overall goodness-of-fit of each regression run (Adj-R2). The increasing or decreasing (cumulative) impact of these three factors was studied over time from 1960 to 2020, incorporating the evidence for 2030 scenarios (S1-S4). The specific role of the three predictors was estimated considering the individual, coefficient slope of each regression [45]. We used standardized variables as input data, imposing a null intercept and thus testing the significance of slope coefficients (t-test) and adj-R2 (Fisher-Snedecor F test).
In a multiple regression run via standardized inputs, like in this study, the absolute value assigned to each slope coefficient represents the net impact of the related coefficient on the dependent variable [63]. A slope systematically above 0 indicates a non-null impact of the associated predictors. Slope values are comparable across predictors; a linear increase in slope coefficients reflects a rising impact on the dependent variable [19]. With this perspective in mind, the results of cross-section regressions presented in this study allowed us to delineate the increasing or decreasing (individual) impact of these three factors over time from 1960 to 2020 [24], considering in turn the evidence for the 2030 scenarios (S1–S4).
To summarize regression results, a principal component analysis (PCA) was finally run with exploratory purposes on a generalized data matrix formed of seven inputs (‘sU’, ‘sA’, and ‘sC’, respectively, meaning the standardized regression slope coefficient for urbanization, agriculture, and climate; ‘R2’ meaning the adjusted R2 coefficient; and ‘%U’, ‘%A’, and ‘%C’, respectively, meaning the percent share of the average ESAI scores). All of these values were made available over a time course between 1960 and 2030 (four scenarios from S1 to S4) and were reported as descriptive statistics in Table 1 and Table 2 (see below). The dimension of the raw matrix was 7 columns (inputs, see above) and 10 rows (years, see above). A correlation matrix extraction of principal components was used here, selecting the relevant component(s) by inspecting the scree plot [21], and preparing a biplot that illustrate, jointly, the results of relevant component loadings (regression inputs) and scores (years).

4. Results

4.1. Descriptive Statistics

Table 1 delineates the statistical distribution of the ESAI by year (1960–2020), additionally considering four short-term scenarios (S1–S4) for 2030. On average, results illustrate an evident trend toward increasing ESAI scores over time, shifting from scores around 1.34 to scores close to 1.37, possibly indicating worse environmental conditions and rising exposure to soil degradation all over the study area. Based on the standard classification of the ESAI, a score ranging from 1.225 to 1.375 reflects a ‘fragile’ area, basically an intermediate exposure class; a score above 1.375 indicates a ‘critical’ area, namely the most exposed class to soil degradation. The average shift (% increase) in the vulnerability scores (see Table 1) suggests that urban provinces were more exposed to soil degradation (average difference over time: +2.5%) than non-urban provinces, possibly reflecting the assumed impact of human pressure on land; the same pattern was recorded in agriculture-specialized provinces (average increase over time: +3.4% compared with unspecialized provinces) and southern provinces (average increase over time: +3.7% compared with northern-central Italian provinces).

4.2. Results of Multiple Regression Models

Table 2 illustrates the results of a cross-section regression estimating the (aggregated and individual) roles of the three factors underlying the level of soil degradation exposure in Italian provinces. Moving through the years, the goodness-of-fit of the estimated relationship was systematically high (usually more than 50%), suggesting that the three predictors together explain significantly more than the half of the overall variability in the dependent variable (land degradation exposure). These results are in line with the working assumptions of this study, indicating that the three analyses’ dimensions were important (but likely not unique) predictors of land degradation in Italy. Interestingly, the goodness-of-fit of regression models increased rapidly between 1960 and 2000, and decreased with a similar pace in the following decades. This result reflects a higher variability in earlier and more recent observation years, possibly associated with unobserved (or unobservable) drivers of land degradation; this outcome was in line with our working theory. All of the tested models were highly significant; slope coefficients were always significant for urbanization and agricultural specialization, and significant for latitude–climate only for the years between 1960 and 2010.

Analysis of Predictors’ Impact

Urbanization was found to have an increased impact on land degradation exposure during the time interval between 1960 and 2030, reaching the highest observed value in 2020. The same trend, even more pronounced, was observed for agricultural specialization, reaching the highest slope coefficient for 2020 and for the 2030 S1 scenario. These data clearly highlight the rising role of socioeconomic pressures in both urban and rural spaces during the observation time. Conversely, latitude–climate displayed a systematically decreasing impact from the early observation years (1960 and 1970) to the most recent times (2010 and 2020); this trend was confirmed in all four 2030 scenarios (S1 to S4). Taken together, dynamics may confirm the working hypothesis of this study, namely the increasing importance of socioeconomic forces and the moderate decline of biophysical factors, such as climate and, possibly, other factors associated with vegetation cover and soil quality, traditionally having lower values in Southern Italy, on average.

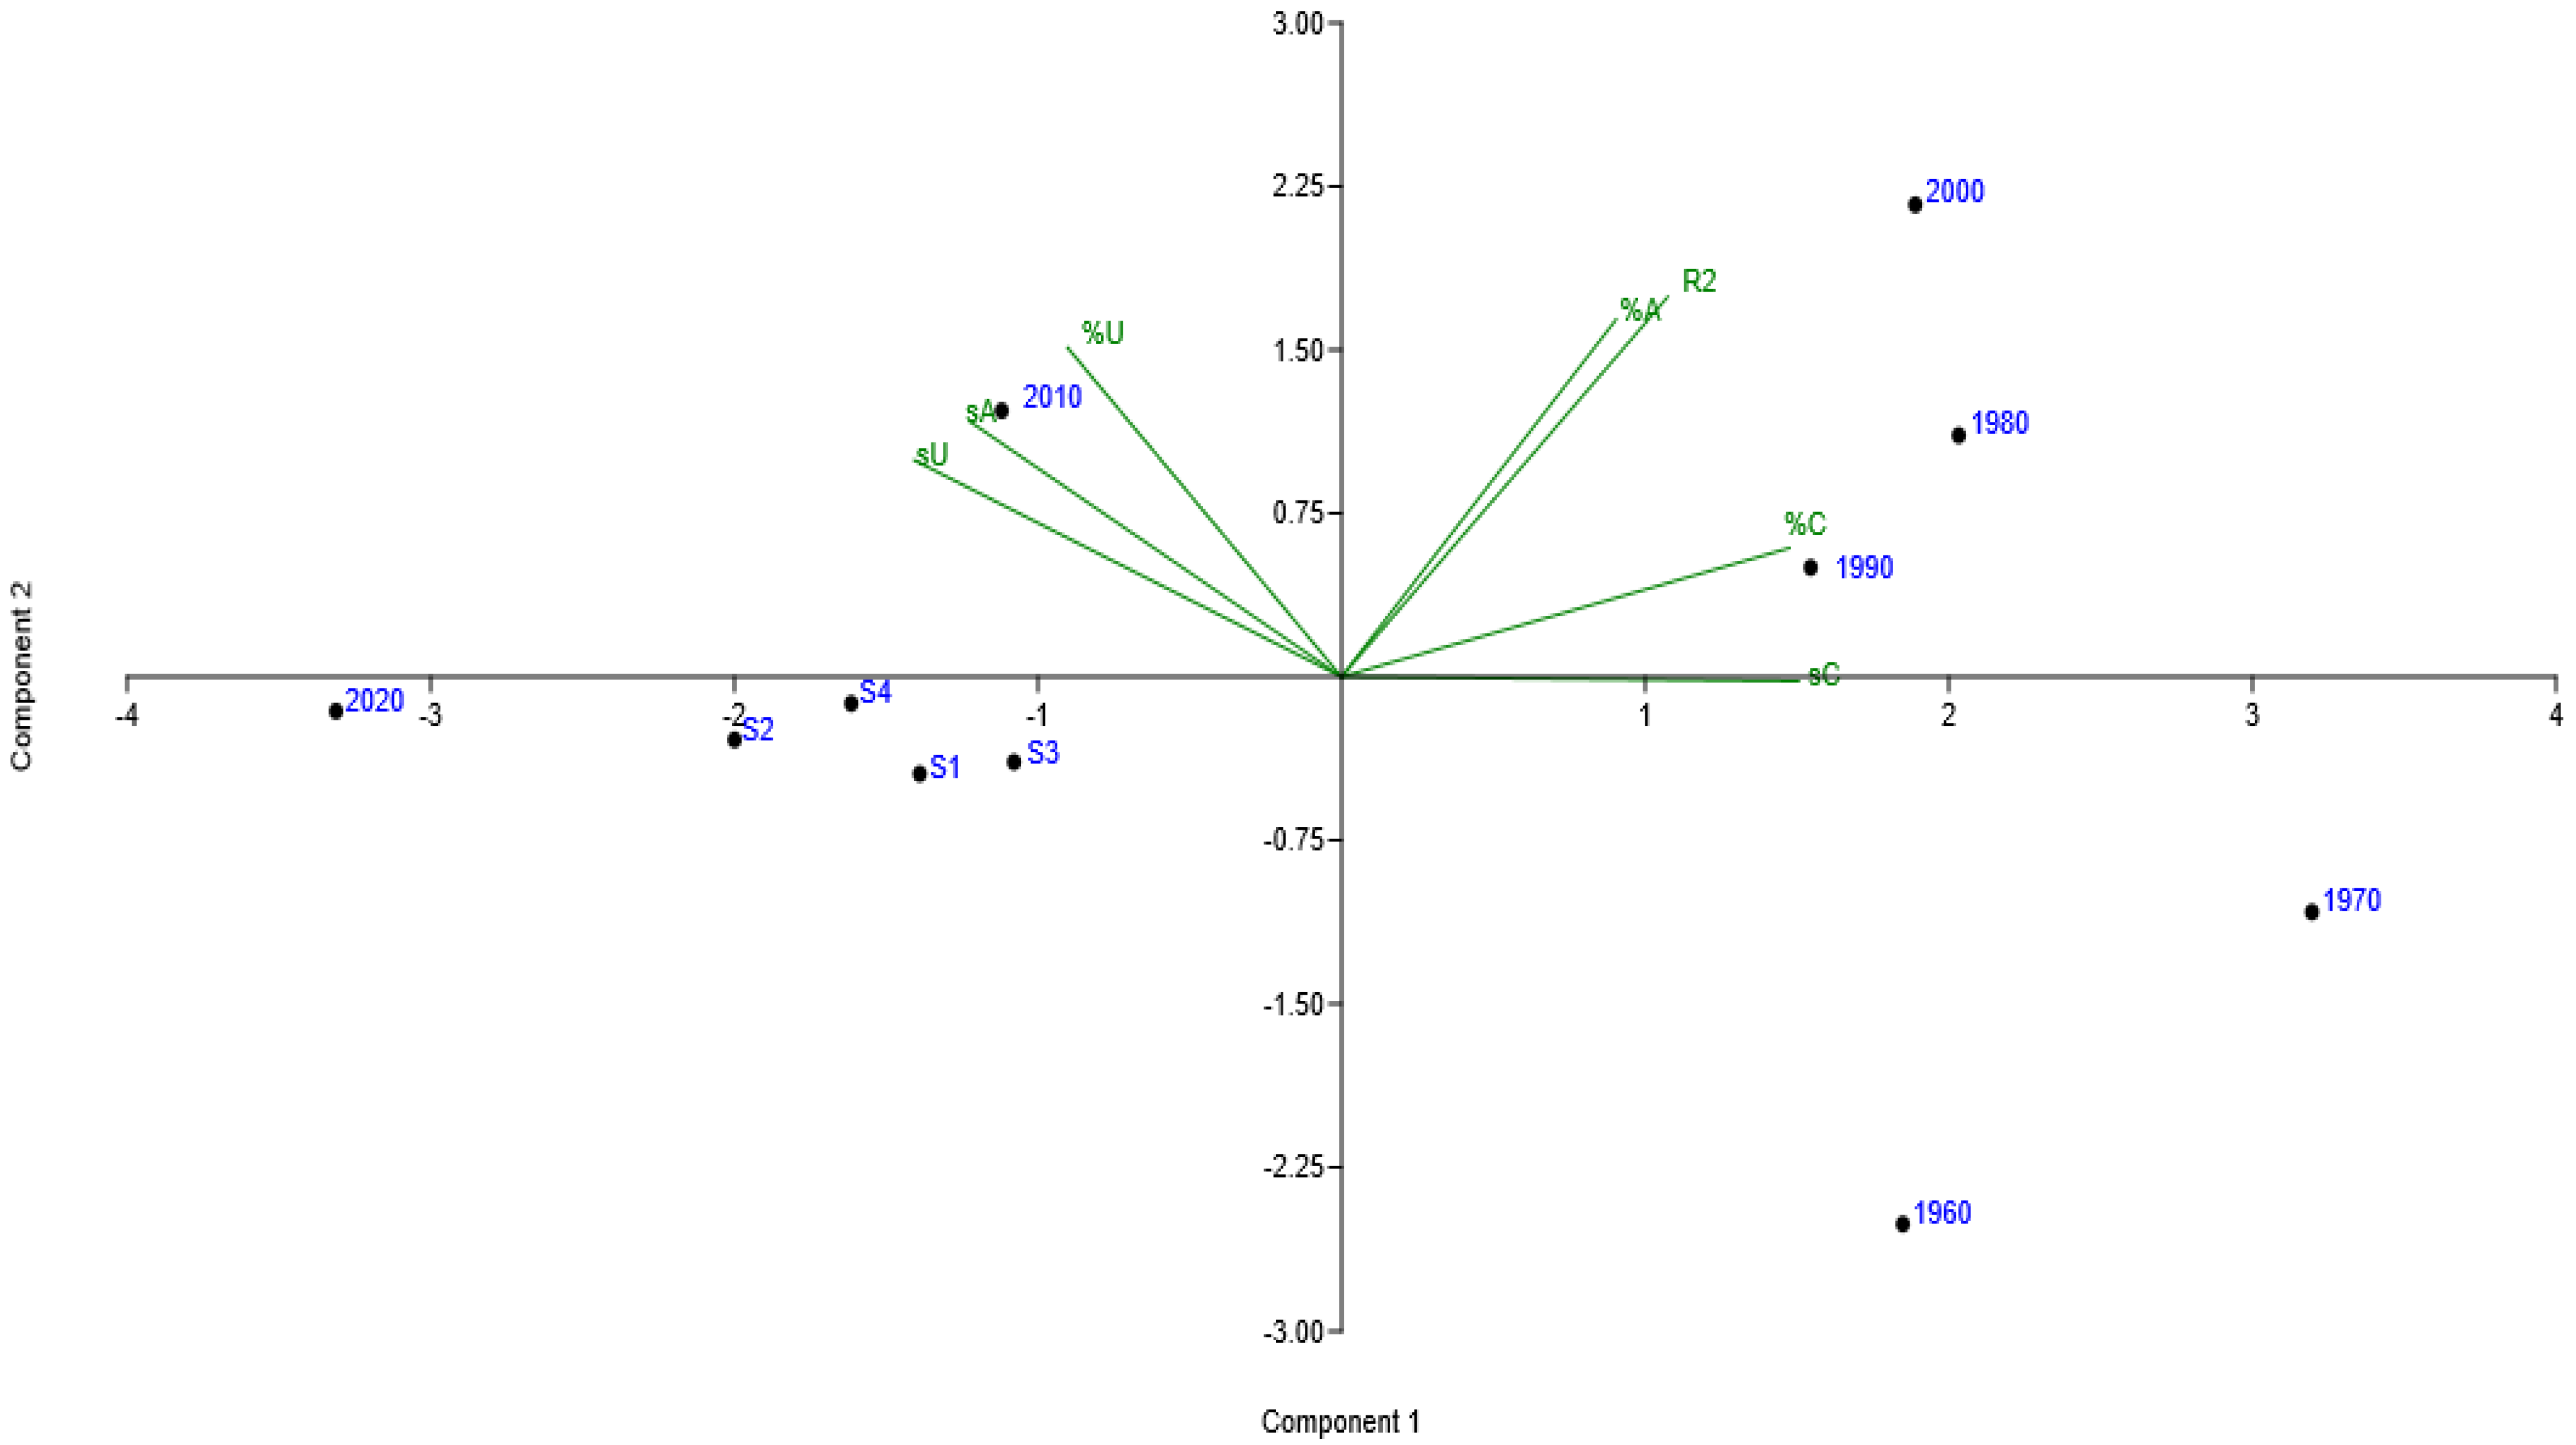
4.3. Summarizing Predictors’ Impact Dynamics Using a Principal Component Analysis

Figure 2 illustrates a biplot summarizing the results of a principal component analysis explaining 88% of the total variance (Axis 1: 65.2%; Axis 2: 22.3%) and run considering the data matrix composed of seven inputs (variables derived from the estimation of each regression model, see Section 3.5) and ten observation years as inputs. The analysis ordered years from right to left (counter-clockwise) along Component 1 and, less evidently, along Component 2. Similar (but slightly worse conditions over time) were found, for 1960–2000 (right side, Component 1) and 2010–2030 (left side, Component 1). As expected from the regression results, slope coefficients were differently ordered along principal components. Climate revealed a particular impact on the right side, i.e., during the first 40 observation years. Agricultural specialization was more associated with Component 2 (positive values) than Component 1. Being rather mixed as an agricultural specialization, urbanization was more intensively associated with Component 1 (negative side). As expected, the increasing shares of the ESAI between (i) urban/non-urban, (ii) agricultural/non-agricultural, and (iii) dry/humid provinces (‘%U’, ‘%A’, and ‘%C’) were found to be highly related with the respective regression slopes. The global models’ goodness-of-fit suggested that additional drivers, outside of the three drivers cumulatively considered in this study, were less (and possibly, marginally) important in the 2000s.

5. Discussion

The present study evaluates quantitatively the space–time evolution of land degradation in Italy, a relevant phenomenon with both environmental and socioeconomic implications, and its possible relationship with broad-scale development processes [79]. Since heterogeneous soil degradation processes complicate assessment and limit the development of efficient action plans, empirical evidence from the literature (see Section 2) was analyzed here with a view to environmental sustainability and territorial planning [80], in order to suggest suitable mitigation strategies for degradation processes derived from the results of the empirical exercise proposed in this study. Earlier contributions have intended land degradation as a composite notion and documented how different components of the land resource (e.g., soil, vegetation, and climate) have changed for the worse, especially in Southern Europe [12,17,38]. The increasing land vulnerability to degradation documented for several regions—both rural and peri-urban—in Mediterranean Europe is reflective of an environmental process that was intrinsically associated with the shift from a spatial asset (and relationships) typical of the center-periphery model to more diluted relationships over space, characteristic of urban sprawl [63]. To what measure regional disparities affect the spatial distribution of vulnerable land to degradation and what the role is of social inequality and economic polarization is not clear yet [31]. With these assumptions in mind, it is clear that these relationships need to be disentangled through a multidisciplinary approach [81,82,83].
The incompleteness of both theoretical and empirical knowledge depends on the fact that ‘soft’ sciences (economics, sociology, and demography) have sometimes underestimated the significance of the social dimension of land degradation in fringe districts, while planning has proposed possibly mechanistic views taken as equally valid and effective for both rural and peri-urban areas, possibly losing the holistic view that spreads from a geographical analysis established at the regional scale [84,85,86]. At the same time, fringe land degradation and the relationship with urbanization have been occasionally investigated in Europe [4,5,47,49].
The center-periphery model represents a classical framework suitable to interpret spatial disparities in several socioeconomic aspects, and can also be proficiently used when considering territorial divergences in land resources that result from spatially polarized processes of environmental degradation [81]. The most serious consequences of the center-periphery relationship applied to land degradation seem to be at the expenses of agricultural and semi-natural buffer areas around the major coastal cities of Southern Europe [58]. These consequences include (i) the consumption (or degradation) of fringe soils with high agricultural potential, (ii) the impoverishment of groundwater resources over the metropolitan river basin due to water overexploitation for (especially) domestic use, and (iii) the abandonment of cultivated land in suburban areas with a consequent increase in marginal and unproductive land [8,56,61]. Increasing fire severity, the concentration of tourism and industrial activities in coastal and lowland areas, and sprawl-induced land fragmentation reducing the connectivity among natural patches were themselves underlying factors of land degradation [46,74]. Coupled with crop intensification leading to soil compaction and salinization, the role of urbanization emerges when enhancing the environmental disparities at the regional scale [75]. Notably, the process was also active at a wider scale [87].
As clearly suggested in the present study, a refined perspective on land degradation exposure and the main underlying forces in Southern Europe requires a broader specification of both socioeconomic and biophysical drivers of change [31]. While the present study provides a fresh and original perspective evaluating the role of three basic drivers of land degradation, it is advisable that some technical aspects in the construction of appropriate predictors will be refined [42]. For instance, the complexity of the relationship between climate change and human activities deserves further research efforts [1,2,48]. Although, technically speaking, we tested three predictors in regression models (urban condition, agricultural intensity, and latitude–climate) after verifying the absence of multi-collinearity (Variance Inflation Factor always below five, indicating a negligible redundancy among these three variables), and we admit that an indirect linkage between global warming and anthropogenic pressure may exist and could be scrutinized with the use of refined indicators and estimation techniques in future studies on Italy or a broader spatial coverage [44]. Despite relatively rich literature on the issue, distinguishing the impact of socioeconomic and biophysical drivers on land degradation exposure still remains a topic deserving theoretical and applied (multi-disciplinary) research [88].
Further efforts should also be devoted to understanding the net impact of crop intensification (or extensivation) processes in Italy, and more generally, in Southern Europe [73]. The levels of agricultural intensity were largely variable across the Northern Mediterranean basin, likely because of the long-lasting cropping tradition characteristic of these areas [78]. Since antiquity, local communities exploited Mediterranean landscapes shaping more or less intensified agricultural systems, using irrigation, soil management, organic fertilizers, and, more recently, chemicals and mechanization as productive factors [50]. While an unsustainable use of production factors in agriculture is clearly a driver of land degradation, some agro-forest landscape systems, despite being heavily exploited from an economic perspective, could even be sustainable in the medium term and compatible with some (formal or informal) actions containing (or stabilizing) land degradation conditions [71]. A refined study of sustainable agricultural landscapes and the relationship with land degradation conditions is particularly appropriate in this line of thinking [77].
As far as the policy dimension is concerned, land mitigation strategies in the Mediterranean basin are especially designed for (and applied to) rural areas [53]. However, coping with land degradation in areas that are not strictly rural needs dedicated tools and governing efforts that are difficult to implement in rapidly changing peri-urban spaces [51]. The present study suggests that land degradation hotspots, identified as effective policy targets, should be delineated both in rural districts and in peri-urban regions, and their evolution over time should be continuously monitored [54]. In such areas, measures aimed at mitigating land degradation should be designed in a context of sustainable development and the reduction of socioeconomic disparities.

6. Concluding Remarks

The association of fringe land degradation with relevant socioeconomic processes such as poverty, social stratification, economic competitiveness, and settlement growth, should stimulate ’holistic’ policy frameworks encompassing, together, articulated (operational) issues such as population decentralization, sustainable land management, and the reduction of unwanted anthropogenic pressure. Having this perspective in mind, the ‘land degradation’ issue should be more broadly discussed in connection with the theoretical framework of sustainable development. Under the ‘resilience’ lens, especially applied to rural and peri-urban systems, a specific analysis of structural changes in economic systems, as well as the impact of new (and possibly unexpected) demographic dynamics at a local scale, and the role of social conflicts (especially for the even scarcer environmental/land resources) need further research efforts based on empirical investigation. Pilot studies with an experimental application of multiple containment strategies will further support the refined implementation of an adaptive approach towards the mitigation of fringe land degradation.

Author Contributions

Conceptualization, A.S. (Adele Sateriano) and M.M.; methodology, L.S.; software, A.S. (Adele Sateriano); validation, A.S. (Alessandra Stefanoni) and F.R.; formal analysis, K.R.; investigation, M.C.; resources, M.C.; data curation, A.S. (Alessandra Stefanoni) and F.R.; writing—original draft preparation, A.S. (Adele Sateriano) and L.S.; writing—review and editing, M.M. and F.R.; visualization, D.S.; supervision, K.R.; project administration, A.S. (Alessandra Stefanoni); funding acquisition, F.R. All authors have read and agreed to the published version of the manuscript.

Funding

This research received no external funding.

Institutional Review Board Statement

Not applicable.

Informed Consent Statement

Not applicable.

Data Availability Statement

Data from official statistics and the bibliographic analysis of scientific literature were used here.

Conflicts of Interest

The authors declare no conflicts of interest.

References

  1. Abahussain, A.A.; Abdu, A.S.; Al-Zubari, W.K.; El-Deen, N.A.; Abdul-Raheem, M. Desertification in the Arab Region: Analysis of current status and trends. J. Arid Environ. 2002, 51, 521–545. [Google Scholar] [CrossRef]
  2. Amiraslani, F.; Dragovich, D. Combating desertification in Iran over the last 50 years: An overview of changing approaches. J. Environ. Manag. 2011, 92, 1–13. [Google Scholar] [CrossRef]
  3. Arrow, K.; Bolin, B.; Costanza, R.; Dasgupta, P.; Folke, C.; Holling, C.S.; Jansson, B.O.; Levin, S.; Mäler, K.G.; Perrings, C.; et al. Economic growth, carrying capacity, and the environment. Ecol. Econ. 1995, 15, 91–95. [Google Scholar] [CrossRef]
  4. Atis, E. Economic impacts on cotton production due to land degradation in the Gediz Delta, Turkey. Land Use Policy 2006, 23, 181–186. [Google Scholar] [CrossRef]
  5. Bestelmeyer, B.T.; Okin, G.S.; Duniway, M.C.; Archer, S.R.; Sayre, N.F.; Williamson, J.C.; Herrick, J.E. Desertification, land use, and the transformation of global drylands. Front. Ecol. Environ. 2015, 13, 28–36. [Google Scholar] [CrossRef]
  6. Becerril-Piña, R.; Mastachi-Loza, C.A.; González-Sosa, E.; Díaz-Delgado, C.; Bâ, K.M. Assessing desertification risk in the semi-arid highlands of central Mexico. J. Arid Environ. 2015, 120, 4–13. [Google Scholar] [CrossRef]
  7. Beaumont, P.M.; Walker, R.T. Land degradation and property regimes. Ecol. Econ. 1996, 18, 55–66. [Google Scholar] [CrossRef]
  8. Fernández, R.J. Do humans create deserts? Trends Ecol. Evol. 2002, 17, 6–7. [Google Scholar] [CrossRef]
  9. Galeotti, M. Economic growth and the quality of the environment: Taking stock. Environ. Dev. Sustain. 2007, 9, 427–454. [Google Scholar] [CrossRef]
  10. Gisladottir, G.; Stocking, M. Land degradation control and its global environmental benefits. Land Degrad. Dev. 2005, 16, 99–112. [Google Scholar] [CrossRef]
  11. Oñate, J.J.; Peco, B. Policy impact on desertification: Stakeholders’ perceptions in southeast Spain. Land Use Policy 2005, 22, 103–114. [Google Scholar] [CrossRef]
  12. Portnov, B.A.; Paz, S. Climate change and urbanization in Arid Regions. Ann. Arid Zone 2008, 47, 457. [Google Scholar] [CrossRef]
  13. Petrişor, A.-I.; Hamma, W.; Nguyen, H.D.; Randazzo, G.; Muzirafuti, A.; Stan, M.-I.; Tran, V.T.; Aştefănoaiei, R.; Bui, Q.-T.; Vintilă, D.-F.; et al. Degradation of Coastlines under the Pressure of Urbanization and Tourism: Evidence on the Change of Land Systems from Europe, Asia and Africa. Land 2020, 9, 275. [Google Scholar] [CrossRef]
  14. Pérez-Sirvent, C.; Martínez-Sánchez, M.J.; Vidal, J.; Sánchez, A. The role of low-quality irrigation water in the desertification of semi-arid zones in Murcia, SE Spain. Geoderma 2003, 113, 109–125. [Google Scholar] [CrossRef]
  15. Mendelsohn, R.; Dinar, A. Climate, water, and agriculture. Land Econ. 2003, 79, 328–341. [Google Scholar] [CrossRef]
  16. Otto, R.; Krüsi, B.O.; Kienast, F. Degradation of an arid coastal landscape in relation to land use changes in Southern Tenerife (Canary Islands). J. Arid Environ. 2007, 70, 527–539. [Google Scholar] [CrossRef]
  17. Oxley, T.; Lemon, M. From social-enquiry to decision support tools: Towards an integrative method in the mediterranean rural environment. J. Arid Environ. 2003, 54, 595–617. [Google Scholar] [CrossRef]
  18. Colantoni, A.; Delfanti, L.; Recanatesi, F.; Tolli, M.; Lord, R. Land use planning for utilizing biomass residues in Tuscia Romana (central Italy): Preliminary results of a multi criteria analysis to create an agro-energy district. Land Use Policy 2016, 50, 125–133. [Google Scholar] [CrossRef]
  19. Ciommi, M.; Chelli, F.M.; Carlucci, M.; Salvati, L. Urban Growth and Demographic Dynamics in Southern Europe: Toward a New Statistical Approach to Regional Science. Sustainability 2018, 10, 2765. [Google Scholar] [CrossRef]
  20. Capozzi, F.; Di Palma, A.; De Paola, F.; Giugni, M.; Iavazzo, P.; Topa, M.E.; Adamo, P.; Giordano, S. Assessing desertification in sub-Saharan peri-urban areas: Case study applications in Burkina Faso and Senegal. J. Geochem. Explor. 2018, 190, 281–291. [Google Scholar] [CrossRef]
  21. Prăvălie, R.; Patriche, C.; Bandoc, G. Quantification of land degradation sensitivity areas in Southern and Central Southeastern Europe. New results based on improving DISMED methodology with new climate data. Catena 2017, 158, 309–320. [Google Scholar] [CrossRef]
  22. Bojö, J. The costs of land degradation in Sub-Saharan Africa. Ecol. Econ. 1996, 16, 161–173. [Google Scholar] [CrossRef]
  23. Capps, K.A.; Bentsen, C.N.; Ramírez, A. Poverty, urbanization, and environmental degradation: Urban streams in the developing world. Freshw. Sci. 2015, 35, 429–435. [Google Scholar] [CrossRef]
  24. Delfanti, L.; Colantoni, A.; Recanatesi, F.; Bencardino, M.; Sateriano, A.; Zambon, I.; Salvati, L. Solar plants, environmental degradation and local socioeconomic contexts: A case study in a Mediterranean country. Environ. Impact Assess. Rev. 2016, 61, 88–93. [Google Scholar] [CrossRef]
  25. Briassoulis, H. The institutional complexity of environmental policy and planning problems: The example of Mediterranean desertification. J. Environ. Plan. Manag. 2006, 47, 115–135. [Google Scholar] [CrossRef]
  26. Grilli, E.; Carvalho, S.C.; Chiti, T.; Coppola, E.; D’Ascoli, R.; La Mantia, T.; Castaldi, S. Critical range of soil organic carbon in southern Europe lands under desertification risk. J. Environ. Manag. 2021, 287, 112285. [Google Scholar] [CrossRef]
  27. De Groot, R. Function-analysis and valuation as a tool to assess land use conflicts in planning for sustainable, multi-functional landscapes. Landsc. Urban Plan. 2006, 75, 175–186. [Google Scholar] [CrossRef]
  28. Rubio, J.L.; Recatalá, L.; Andrew, V. European desertification. WIT Trans. Ecol. Environ. 1970, 31, 1–10. [Google Scholar]
  29. Ferrara, A.; Kosmas, C.; Salvati, L.; Padula, A.; Mancino, G.; Nolè, A. Updating the MEDALUS-ESA Framework for Worldwide Land Degradation and Desertification Assessment. Land Degrad. Dev. 2020, 31, 1593–1607. [Google Scholar] [CrossRef]
  30. Sterk, G.; Stoorvogel, J.J. Desertification–scientific versus political realities. Land 2020, 9, 156. [Google Scholar] [CrossRef]
  31. Salvati, L.; Zitti, M. Regional convergence of environmental variables: Empirical evidences from land degradation. Ecol. Econ. 2008, 68, 162–168. [Google Scholar] [CrossRef]
  32. Simeonakis, E.; Calvo-Cases, A.; Arnau-Rosalen, E. Land use change and land degradation in southeastern Mediterranean Spain. Environ. Manag. 2007, 40, 80–94. [Google Scholar] [CrossRef] [PubMed]
  33. Ferretti, M.; Marchetto, A.; Arisci, S.; Bussotti, F.; Calderisi, M.; Carnicelli, S.; Cecchini, G.; Fabbio, G.; Bertini, G.; Matteucci, G.; et al. On the tracks of Nitrogen deposition effects on temperate forests at their southern European range—An observational study from Italy. Glob. Change Biol. 2014, 20, 3423–3438. [Google Scholar] [CrossRef]
  34. Thornes, J.B. Stability and Instability in the Management of Mediterranean Desertification. In Environmental Modelling: Finding Simplicity in Complexity; John Wiley & Sons: Hoboken, NJ, USA, 2013; pp. 399–413. [Google Scholar] [CrossRef]
  35. Solecki, W.; Seto, K.C.; Marcotullio, P.J. It’s Time for an Urbanization Science. Environ. Sci. Policy Sustain. Dev. 2013, 55, 12–17. [Google Scholar] [CrossRef]
  36. Portnov, B.A.; Safriel, U.N. Combating desertification in the Negev: Dryland agriculture vs. dryland urbanization. J. Arid Environ. 2004, 56, 659–680. [Google Scholar] [CrossRef]
  37. Shaw, B.J.; van Vliet, J.; Verburg, P.H. The peri-urbanization of Europe: A systematic review of a multifaceted process. Landsc. Urban Plan. 2020, 196, 103733. [Google Scholar] [CrossRef]
  38. Sakellariou, M.; Psiloglou, B.E.; Giannakopoulos, C.; Mylona, P.V. Integration of Abandoned Lands in Sustainable Agriculture: The Case of Terraced Landscape Re-Cultivation in Mediterranean Island Conditions. Land 2021, 10, 457. [Google Scholar] [CrossRef]
  39. Rubio, J.L.; Bochet, E. Desertification indicators as diagnosis criteria for desertification risk assessment in Europe. J. Arid Environ. 1998, 39, 113–120. [Google Scholar] [CrossRef]
  40. Patel, M.; Kok, K.; Rothman, D.S. Participatory scenario construction in land use analysis: An insight into the experiences created by stakeholder involvement in the Northern Mediterranean. Land Use Policy 2007, 24, 546–561. [Google Scholar] [CrossRef]
  41. Pender, J.L. Population growth, agricultural intensification, induced innovation and natural resource sustainability: An application of neoclassical growth theory. Agric. Econ. 1998, 19, 99–112. [Google Scholar] [CrossRef]
  42. Scarascia, M.E.V.; Di Battista, F.; Salvati, L. Water resources in Italy: Availability and agricultural uses. Irrig. Drain. 2006, 55, 115–127. [Google Scholar] [CrossRef]
  43. Recanatesi, F.; Clemente, M.; Grigoriadis, E.; Ranalli, F.; Zitti, M.; Salvati, L. A fifty-year sustainability assessment of Italian agro-forest districts. Sustainability 2016, 8, 32. [Google Scholar] [CrossRef]
  44. Salvati, L.; Venezian Scarascia, M.E.; Sabbi, A.; Zitti, M.; Perini, L. Breve excursus sul clima italiano con riferimenti al settore agricolo. Boll. Della Soc. Geogr. Ital. 2011, 3, 295–310. [Google Scholar]
  45. Salvati, L.; Zitti, M.; Sateriano, A. Changes in city vertical profile as an indicator of sprawl: Evidence from a Mediterranean urban region. Habitat Int. 2013, 38, 119–125. [Google Scholar] [CrossRef]
  46. Benassi, F.; Cividino, S.; Cudlin, P.; Alhuseen, A.; Lamonica, G.R.; Salvati, L. Population trends and desertification risk in a Mediterranean region, 1861-2017. Land Use Policy 2020, 95, 104626. [Google Scholar] [CrossRef]
  47. Barbero-Sierra, C.; Marques, M.J.; Ruíz-Pérez, M. The case of urban sprawl in Spain as an active and irreversible driving force for desertification. J. Arid Environ. 2013, 90, 95–102. [Google Scholar] [CrossRef]
  48. Barbero-Sierra, C.; Marques, M.J.; Ruíz-Pérez, M.; Bienes, R.; Cruz-Maceín, J.L. Farmer knowledge, perception and management of soils in the Las Vegas agricultural district, Madrid, Spain. Soil Use Manag. 2016, 32, 446–454. [Google Scholar] [CrossRef]
  49. Bianchini, L.; Egidi, G.; Alhuseen, A.; Sateriano, A.; Cividino, S.; Clemente, M.; Imbrenda, V. Toward a dualistic growth? Population increase and land-use change in Rome, Italy. Land 2021, 10, 749. [Google Scholar] [CrossRef]
  50. Hammad, A.A.; Tumeizi, A. Land degradation: Socioeconomic and environmental causes and consequences in the eastern Mediterranean. Land Degrad. Dev. 2012, 23, 216–226. [Google Scholar] [CrossRef]
  51. Hein, L. Assessing the costs of land degradation: A case study for the Puentes catchment, southeast Spain. Land Degrad. Dev. 2007, 18, 631–642. [Google Scholar] [CrossRef]
  52. Gohari, Z.; Nikou, S. Impacts of land use changes on Technogenic desertification in Mashhad city. Desert Ecosyst. Eng. J. 2017, 5, 81–90. [Google Scholar]
  53. Grainger, A. The role of science in implementing international environmental agreements: The case of desertification. Land Degrad. Dev. 2009, 20, 410–430. [Google Scholar] [CrossRef]
  54. Herrmann, S.M.; Hutchinson, C.F. The changing contexts of the desertification debate. J. Arid Environ. 2005, 63, 538–555. [Google Scholar] [CrossRef]
  55. Puigdefabregas, J.; Mendizabal, T. Prospects for desertification impacts in Southern Europe. In Environmental Challenges in the Mediterranean 2000–2050: Proceedings of the NATO Advanced Research Workshop on Environmental Challenges in the Mediterranean 2000–2050 Madrid, Spain 2–5 October 2002; Springer: Dordrecht, The Netherlands, 2003; pp. 155–172. [Google Scholar]
  56. Khresat, S.A.; Rawajfih, Z.; Mohammad, M. Land degradation in north-western Jordan: Causes and processes. J. Arid Environ. 1998, 39, 623–629. [Google Scholar] [CrossRef]
  57. Juntti, M.; Wilson, G.A. Conceptualizing desertification in Southern Europe: Stakeholder interpretations and multiple policy agendas. Eur. Environ. 2005, 15, 228–249. [Google Scholar] [CrossRef]
  58. Kosmas, C.; Tsara, M.; Karavitis, C.A. Identification of indicators for desertification Effects of using treated municipal waste water for irrigation of olive trees in Greece. Ann. Arid Zones 2003, 42, 393–416. [Google Scholar]
  59. Harte, J. Human population as a dynamic factor in environmental degradation. Popul. Environ. 2007, 28, 223–236. [Google Scholar] [CrossRef]
  60. Kadhim, A.A.; Abbas, L.Z. Unplanned Urbanization and Agricultural Land Degradation in Baghdad City from 2003 to 2017. J. Coll. Educ. Women 2021, 32, 1–17. [Google Scholar] [CrossRef]
  61. Ibáñez, J.; Valderrama, J.M.; Puigdefábregas, J. Assessing desertification risk using system stability condition analysis. Ecol. Model. 2008, 213, 180–190. [Google Scholar] [CrossRef]
  62. Iosifides, T.; Politidis, T. Socio-economic dynamics, local development and desertification in western Lesvos, Greece. Local Environ. 2006, 10, 487–499. [Google Scholar] [CrossRef]
  63. Zambon, I.; Colantoni, A.; Carlucci, M.; Morrow, N.; Sateriano, A.; Salvati, L. Land quality, sustainable development and environmental degradation in agricultural districts: A computational approach based on entropy indexes. Environ. Impact Assess. Rev. 2017, 64, 37–46. [Google Scholar] [CrossRef]
  64. Zucca, C.; Peruta, R.D.; Salvia, R.; Sommer, S.; Cherlet, M. Towards a World Desertification Atlas. Relating and selecting indicators and data sets to represent complex issues. Ecol. Indic. 2012, 15, 157–170. [Google Scholar] [CrossRef]
  65. Zuindeau, B. Territorial Equity and Sustainable Development. Environ. Values 2007, 16, 253–268. [Google Scholar] [CrossRef]
  66. Verstraete, M.M.; Brink, A.B.; Scholes, R.J.; Beniston, M.; Stafford Smith, M. Climate change and desertification: Where do we stand, where should we go? Glob. Planet. Change 2008, 64, 105–110. [Google Scholar] [CrossRef]
  67. Wang, X.; Chen, F.; Dong, Z. The relative role of climatic and human factors in desertification in semiarid China. Glob. Environ. Change 2006, 16, 48–57. [Google Scholar] [CrossRef]
  68. Wilson, G.A.; Juntti, M. Unravelling Desertification: Policies and Actor Networks in Southern Europe; Wageningen Academic Publishing: Wageningen, The Netherlands, 2005; 246p. [Google Scholar]
  69. Yang, X.; Zhang, K.; Jia, B.; Ci, L. Desertification assessment in China: An overview. J. Arid Environ. 2005, 63, 517–531. [Google Scholar] [CrossRef]
  70. Hrubovcak, J.; LeBlanc, M.; Eakin, B.K. Agriculture, Natural Resources and Environmental Accounting. Environ. Resour. Econ. 2000, 17, 145–162. [Google Scholar] [CrossRef]
  71. Makhzoumi, J.M. The changing role of rural landscapes: Olive and carob multi-use tree plantations in the semiarid Mediterranean. Landsc. Urban Plan. 1997, 37, 115–122. [Google Scholar] [CrossRef]
  72. Latorre, J.G.; García-Latorre, J.; Sanchez-Picón, A. Dealing with aridity: Socio-economic structures and environmental changes in an arid Mediterranean region. Land Use Policy 2001, 18, 53–64. [Google Scholar] [CrossRef]
  73. Le Houérou, H.N. Land degradation in Mediterranean Europe: Can agroforestry be a part of the solution? A prospective review. Agrofor. Syst. 1993, 21, 43–61. [Google Scholar] [CrossRef]
  74. Lemon, M.; Seaton, R.; Park, J. Social enquiry and the measurement of natural phenomena: The degradation of irrigation water in the Argolid Plain, Greece. Int. J. Sustain. Dev. World Ecol. 2009, 1, 206–220. [Google Scholar] [CrossRef]
  75. Kok, K.; Patel, M.; Rothman, D.; Quaranta, G. Multi-scale narratives from an IA perspective: Part II Participatory local scenario development. Futures 2006, 38, 285–311. [Google Scholar] [CrossRef]
  76. Grove, A.T. Desertification in Southern Europe. Clim. Change 1986, 9, 49–57. [Google Scholar] [CrossRef]
  77. Marathianou, M.; Kosmas, C.; Detsis, V. Land-use evolution and degradation in Lesvos (Greece): A historical approach. Land Degrad. Dev. 2000, 11, 63–73. [Google Scholar] [CrossRef]
  78. Loumou, A.; Giourga, C.; Dimitrakopoulos, P.; Koukoulas, S. Tourism contribution to agro-ecosystems conservation: The case of Lesbos Island, Greece. Environ. Manag. 2000, 26, 363–370. [Google Scholar] [CrossRef]
  79. Danfeng, S.; Dawson, R.; Baoguo, L. Agricultural causes of desertification risk in Minqin, China. J. Environ. Manag. 2006, 79, 348–356. [Google Scholar] [CrossRef]
  80. Emadodin, I.; Taravat, A.; Rajaei, M. Effects of urban sprawl on local climate: A case study, north central Iran. Urban Clim. 2016, 17, 230–247. [Google Scholar] [CrossRef]
  81. Li, C.-Z.; Crépin, A.-S.; Folke, C. The Economics of Resilience. Int. Rev. Environ. Resour. Econ. 2018, 11, 309–353. [Google Scholar] [CrossRef]
  82. Li, W.; Wang, D.; Liu, S.; Zhu, Y. Measuring urbanization-occupation and internal conversion of peri-urban cultivated land to determine changes in the peri-urban agriculture of the black soil region. Ecol. Indic. 2019, 102, 328–337. [Google Scholar] [CrossRef]
  83. Liu, Y.; Wang, Y.; Peng, J.; Du, Y.; Liu, X.; Li, S.; Zhang, D. Correlations between urbanization and vegetation degradation across the world’s metropolises using DMSP/OLS nighttime light data. Remote Sens. 2015, 7, 2067–2088. [Google Scholar] [CrossRef]
  84. Lu, X.; Ke, S. Evaluating the effectiveness of sustainable urban land use in China from the perspective of sustainable urbanization. Habitat Int. 2018, 77, 90–98. [Google Scholar] [CrossRef]
  85. Luo, Y.; Sun, W.; Yang, K.; Zhao, L. China urbanization process induced vegetation degradation and improvement in recent 20 years. Cities 2021, 114, 103207. [Google Scholar] [CrossRef]
  86. Johnson, D.L.; Lewis, L.A. Land Degradation: Creation and Destruction, 2nd ed.; Rowman & Littlefield: Lahnam, MD, USA, 2007. [Google Scholar]
  87. Tanrivermis, H. Agricultural land use change and sustainable use of land resources in the mediterranean region of Turkey. J. Arid Environ. 2003, 54, 553–564. [Google Scholar] [CrossRef]
  88. Hubacek, K.; Van Den Bergh, J.C.J.M. Changing concepts of “land” in economic theory: From single to multi-disciplinary approaches. Ecol. Econ. 2006, 56, 5–27. [Google Scholar] [CrossRef]
Figure 1. The spatial distribution of the ESAI score observed for Italy ((left): 1960; middle: 2020) and a map (right) classifying territory based on the net increase (or decrease) of the ESAI score over time, 1960–2020.
Sustainability 16 08938 g001
Figure 2. Biplot of a principal component analysis (PCA) explaining nearly 88% of the total variance (Axis 1: 65.2%; Axis 2: 22.3%) in the data matrix composed of seven inputs; ‘sU’, ‘sA’, and ‘sC’, respectively, mean the standardized regression slope coefficient for urbanization, agriculture, and climate (see Table 2); ‘R2’ is the adjusted R2 coefficient and ‘%U’, ‘%A’, and ‘%C’, respectively, indicate the percent share of difference in the average ESAI scores in the characteristic provinces, see Table 1; all of these values were made available over a continuous (decadal) time course between 1960 and 2030 (four scenarios from S1 to S4).
Sustainability 16 08938 g002
Table 1. Analysis of the statistical distribution of the ESAI score across Italian provinces (NUTS-3 level, n = 110) by territorial characteristics (see text), year (1960–2020) or 2030 scenario (S1 to S4).
Geographic Partition1960197019801990200020102020S1S2S3S4
Italy1.3451.3671.3651.3581.3631.3711.3681.3711.3821.3691.380
Non-urban1.3411.3621.3591.3531.3571.3631.3611.3661.3761.3641.374
Urban1.3671.3941.3951.3831.3941.4081.4031.3981.4131.3971.411
% increase (urban)2.02.32.62.22.73.33.12.42.72.42.7
Non-agricultural1.3231.3421.3361.3301.3341.3461.3471.3461.3581.3441.356
Agricultural1.3641.3901.3901.3831.3881.3931.3871.3931.4031.3921.402
% increase (agricultural)3.13.64.14.04.03.43.03.63.33.63.4
North1.3261.3421.3411.3381.3401.3531.3571.3581.3691.3551.366
South1.3781.4101.4051.3931.4031.4011.3871.3941.4051.3941.405
% increase (South)3.95.04.74.14.73.52.22.72.62.92.8
Table 2. Summary results of multiple linear regressions run on the level of land degradation exposure (ESAI score) across Italian provinces (NUTS-3 level, n = 110) as a dependent variable as predicted by three factors (urban condition, agricultural intensity, and latitude-climate) by year or 2030 scenario (S1 to S4); models with standardized input variables determining a zero-intercept regression; and inferential tests for slope coefficients’ significance (testing against H0 with 0 slope value) at p < 0.05 (indicated with an asterisk *, together with the respective standard error of each estimated coefficient).
YearAdj-R2UrbanAgricultureSouth
Coeff. Std. Err.Coeff. Std. Err.Coeff. Std. Err.
19600.5530.474*0.0760.591*0.0770.367*0.068
19700.5890.460*0.0730.569*0.0740.420*0.065
19800.6150.532*0.0710.661*0.0720.339*0.063
19900.6070.531*0.0710.696*0.0730.298*0.064
20000.6790.570*0.0640.695*0.0660.348*0.057
20100.5900.641*0.0730.699*0.0740.216*0.065
20200.5250.678*0.0780.728*0.0800.063 0.070
2030
S10.5240.594*0.0780.733*0.0800.129 0.070
S20.5340.627*0.0780.728*0.0790.125 0.069
S30.5320.588*0.0780.727*0.0790.152 0.069
S40.5400.621*0.0770.720*0.0780.147 0.069
Disclaimer/Publisher’s Note: The statements, opinions and data contained in all publications are solely those of the individual author(s) and contributor(s) and not of MDPI and/or the editor(s). MDPI and/or the editor(s) disclaim responsibility for any injury to people or property resulting from any ideas, methods, instructions or products referred to in the content.

