1. Introduction
Inland waterway transport is an integral part of comprehensive transportation systems in most countries and an extension of international maritime shipping into inland territories, and its safety risk assessment and management are of key importance for sustainable development. Unlike maritime transport, which is subject to regional safety regulations and abundant accident reporting, inland waterways have limited access to data on vessel traffic accidents, with each segment displaying unique accident characteristics and risk factors. On the one hand, the diverse conditions across various segments of inland waterways demand a specific consideration of each segment’s circumstances during risk assessment, identifying targeted key risk factors. On the other hand, the risks of inland waterway transport are further complicated by limited accident reports and the dynamic nature of navigation channels, hydrology, climate, and vessel types, all of which form a complex interplay. This complexity necessitates the continuous improvement of safety risk management informatization and dynamic monitoring to reasonably assess and visualize the risk levels of different factors, ensuring navigational safety.
Current risk assessment methods for navigation can be categorized into inland navigation and marine transportation in terms of objects, and roughly categorized into traditional risk evaluation methods and modern uncertainty models in terms of methods. Notably, despite inland waterways connecting inland regions to the global trade network, there is a significant gap compared to maritime transport in terms of cargo volume, vessel tonnage, and accident losses, with maritime safety receiving more research attention. Inland waterway accidents, dominated by different factors such as human, vessel, and environmental aspects compared to maritime incidents are significantly influenced by navigational conditions, and accident types and causes vary across segments [
1], warranting specific research. In existing studies on inland waterway navigational safety risk analysis, scholars often establish risk indicator systems and evaluate risks across entire waterway segments. However, the navigational environment characteristics of different segments within complex waterways may vary greatly, with key risk factors differing significantly, and the interrelations among various factors are not static. Traditional methods such as hierarchical analysis, fuzzy comprehensive evaluation, and safety indices, as well as modern theories like the DS theory and fuzzy reasoning, despite handling complex interrelations, lack flexibility when assessing risks for different segments and are challenging to visualize. Moreover, the volume and completeness of accident data for each segment are difficult to guarantee, making it hard to train samples and calibrate parameters with purely data-driven statistical analysis methods or Bayesian network approaches.
This paper proposes a two-stage Bayesian network method for inland waterway navigational risk assessment, considering the characteristics of different segments. It combines the strengths of fuzzy reasoning in handling complex and uncertain inter-factor relationships with the flexibility and high visualization capabilities of Bayesian approaches, providing an effective means of risk assessment under uncertain conditions and promoting the sustainable development of inland waterway transport. The main objectives involve (1) how to preliminarily identify inland navigation risks from a multi-dimensional perspective; (2) how to propose a new method to achieve dynamic and visual inland navigation risk assessment; and (3) how to identify key risk factors and analyze and summarize the safety characteristics of different segments.
Supported by the aforementioned theoretical methods, this study takes the Yangtze River as an example to validate our method. It selects typical segments from the upper, middle, and lower reaches to analyze and comb through the main risk sources of each segment. A comprehensive assessment is conducted from multiple dimensions, including the probability of occurrence, severity, likelihood, and visibility. The key risk sources for each segment are proposed and compared with accident data, validating the feasibility of the method. The main contributions of this study are as follows: first, an extensive survey was conducted to show the most comprehensive sources of navigational risk on inland waterways. Second, a multi-segment navigation risk evaluation model was developed from the perspective of segment differentiation. This model integrates the differentiated risk sources and common risk sources among different segments, which helps to control inland waterway navigation risks more comprehensively. Third, the combination of a fuzzy rule base with a belief structure and Bayesian networks provides a powerful tool to combine subjective judgments for assessing risk under uncertainty, especially when waterway data are incomplete.
2. Literature Review
Understanding the concept of risk is fundamental in risk assessment. One of the most common definitions of risk is the product of the probability and the consequences of unintended events [
2,
3]. However, this definition has limitations, as it fails to accurately depict frequent low-consequence accidents and exceedingly rare but catastrophic events. Additionally, risk can be defined as a set of indicators related to the likelihood and severity of occurrence [
4,
5,
6]. Yet, relying solely on two risk parameters constrains the exploration of risk characteristics, resulting in an inability to distinguish levels among multiple risk events [
7].
In recent years, significant attention has been given to the study of navigational risks, with a plethora of assessment methods emerging. For instance, Yang et al. [
8] proposed a subjective security-based assessment framework using fuzzy evidential reasoning (ER) approaches, which have the ability to analyze security in situations of high-level uncertainty. Wu et al. [
9] proposed a modified cognitive reliability and error analysis method (CREAM) for estimating the human error probability in the maritime accident process on the basis of an evidential reasoning approach. Kandel et al. [
10] introduced an expandable data-driven predictive model using machine learning to predict types of Arctic incidents and identify their risk factors, assessing the risks of Arctic navigation under uncertain weather and ice conditions. Ma et al. [
11] defined maritime accident scenarios based on 104 ship grounding reports, using grounding theory within the HFACS framework to identify and construct human factors leading to ship grounding. Sun et al. [
12] formulated the allocation of maritime search-and-rescue resources in coastal areas as a non-linear optimization model. With the aid of an enhanced particle swarm optimization model, they explored the optimal solution for the allocation of maritime search-and-rescue resources under different constraints of onboard equipment base stations. Ma et al. [
13] integrated the risk evaluation of maritime transport with a robust optimization model and employed the entropy weighted method (EWM)–technique for order preference by similarity to ideal solution (TOPSIS)–analytic hierarchy process (AHP) method to evaluate the maritime risk. Wang et al. [
1] proposed a new method for identifying ship navigation risks by combining the ship domain with AIS data to increase the prediction accuracy of collision risk identification for ship navigation in complex waterways. Additionally, Bayesian network analysis is a common method in maritime accident analysis [
14], as demonstrated by Zhou et al. [
15], who conducted an in-depth study of factors affecting maritime accident casualties by establishing a new database and performing an accident casualty evolution analysis. Based on a refined dataset, a purely data-driven Bayesian network (BN) model was constructed, analyzing casualties in maritime accidents under different vessel operating conditions. Xia et al. [
16] proposed a risk assessment model that integrates failure mode and effects analysis (FMEA), a belief rule-based Bayesian network (BRBN), and evidence reasoning (ER) to quantify the risk levels of inland water transport risk factors.
In existing studies on the safety risk analysis of inland navigation, scholars often establish a complete set of safety indicators for a specific waterway, using qualitative and quantitative methods to assess the safety of that segment or the vessels transiting it. For example, Zhang et al. [
17] identified factors influencing ship collision risks and quantitatively evaluated the collision risk in the Jiangsu waterway using a Bayesian model. Mou et al. [
18] created a safety indicator framework to assess the risk levels of busy waterways, analyzing vessel traffic accident data from the western ports of Shenzhen. Huang et al. [
19] designed a risk assessment framework for hazardous goods in inland waterway transport and demonstrated the effectiveness of the model using fireworks being transported along the Yangtze River mainline. However, these studies have not considered the difference in safety characteristics across different segments, which represents a significant gap in inland navigation risk research.
3. Methodology
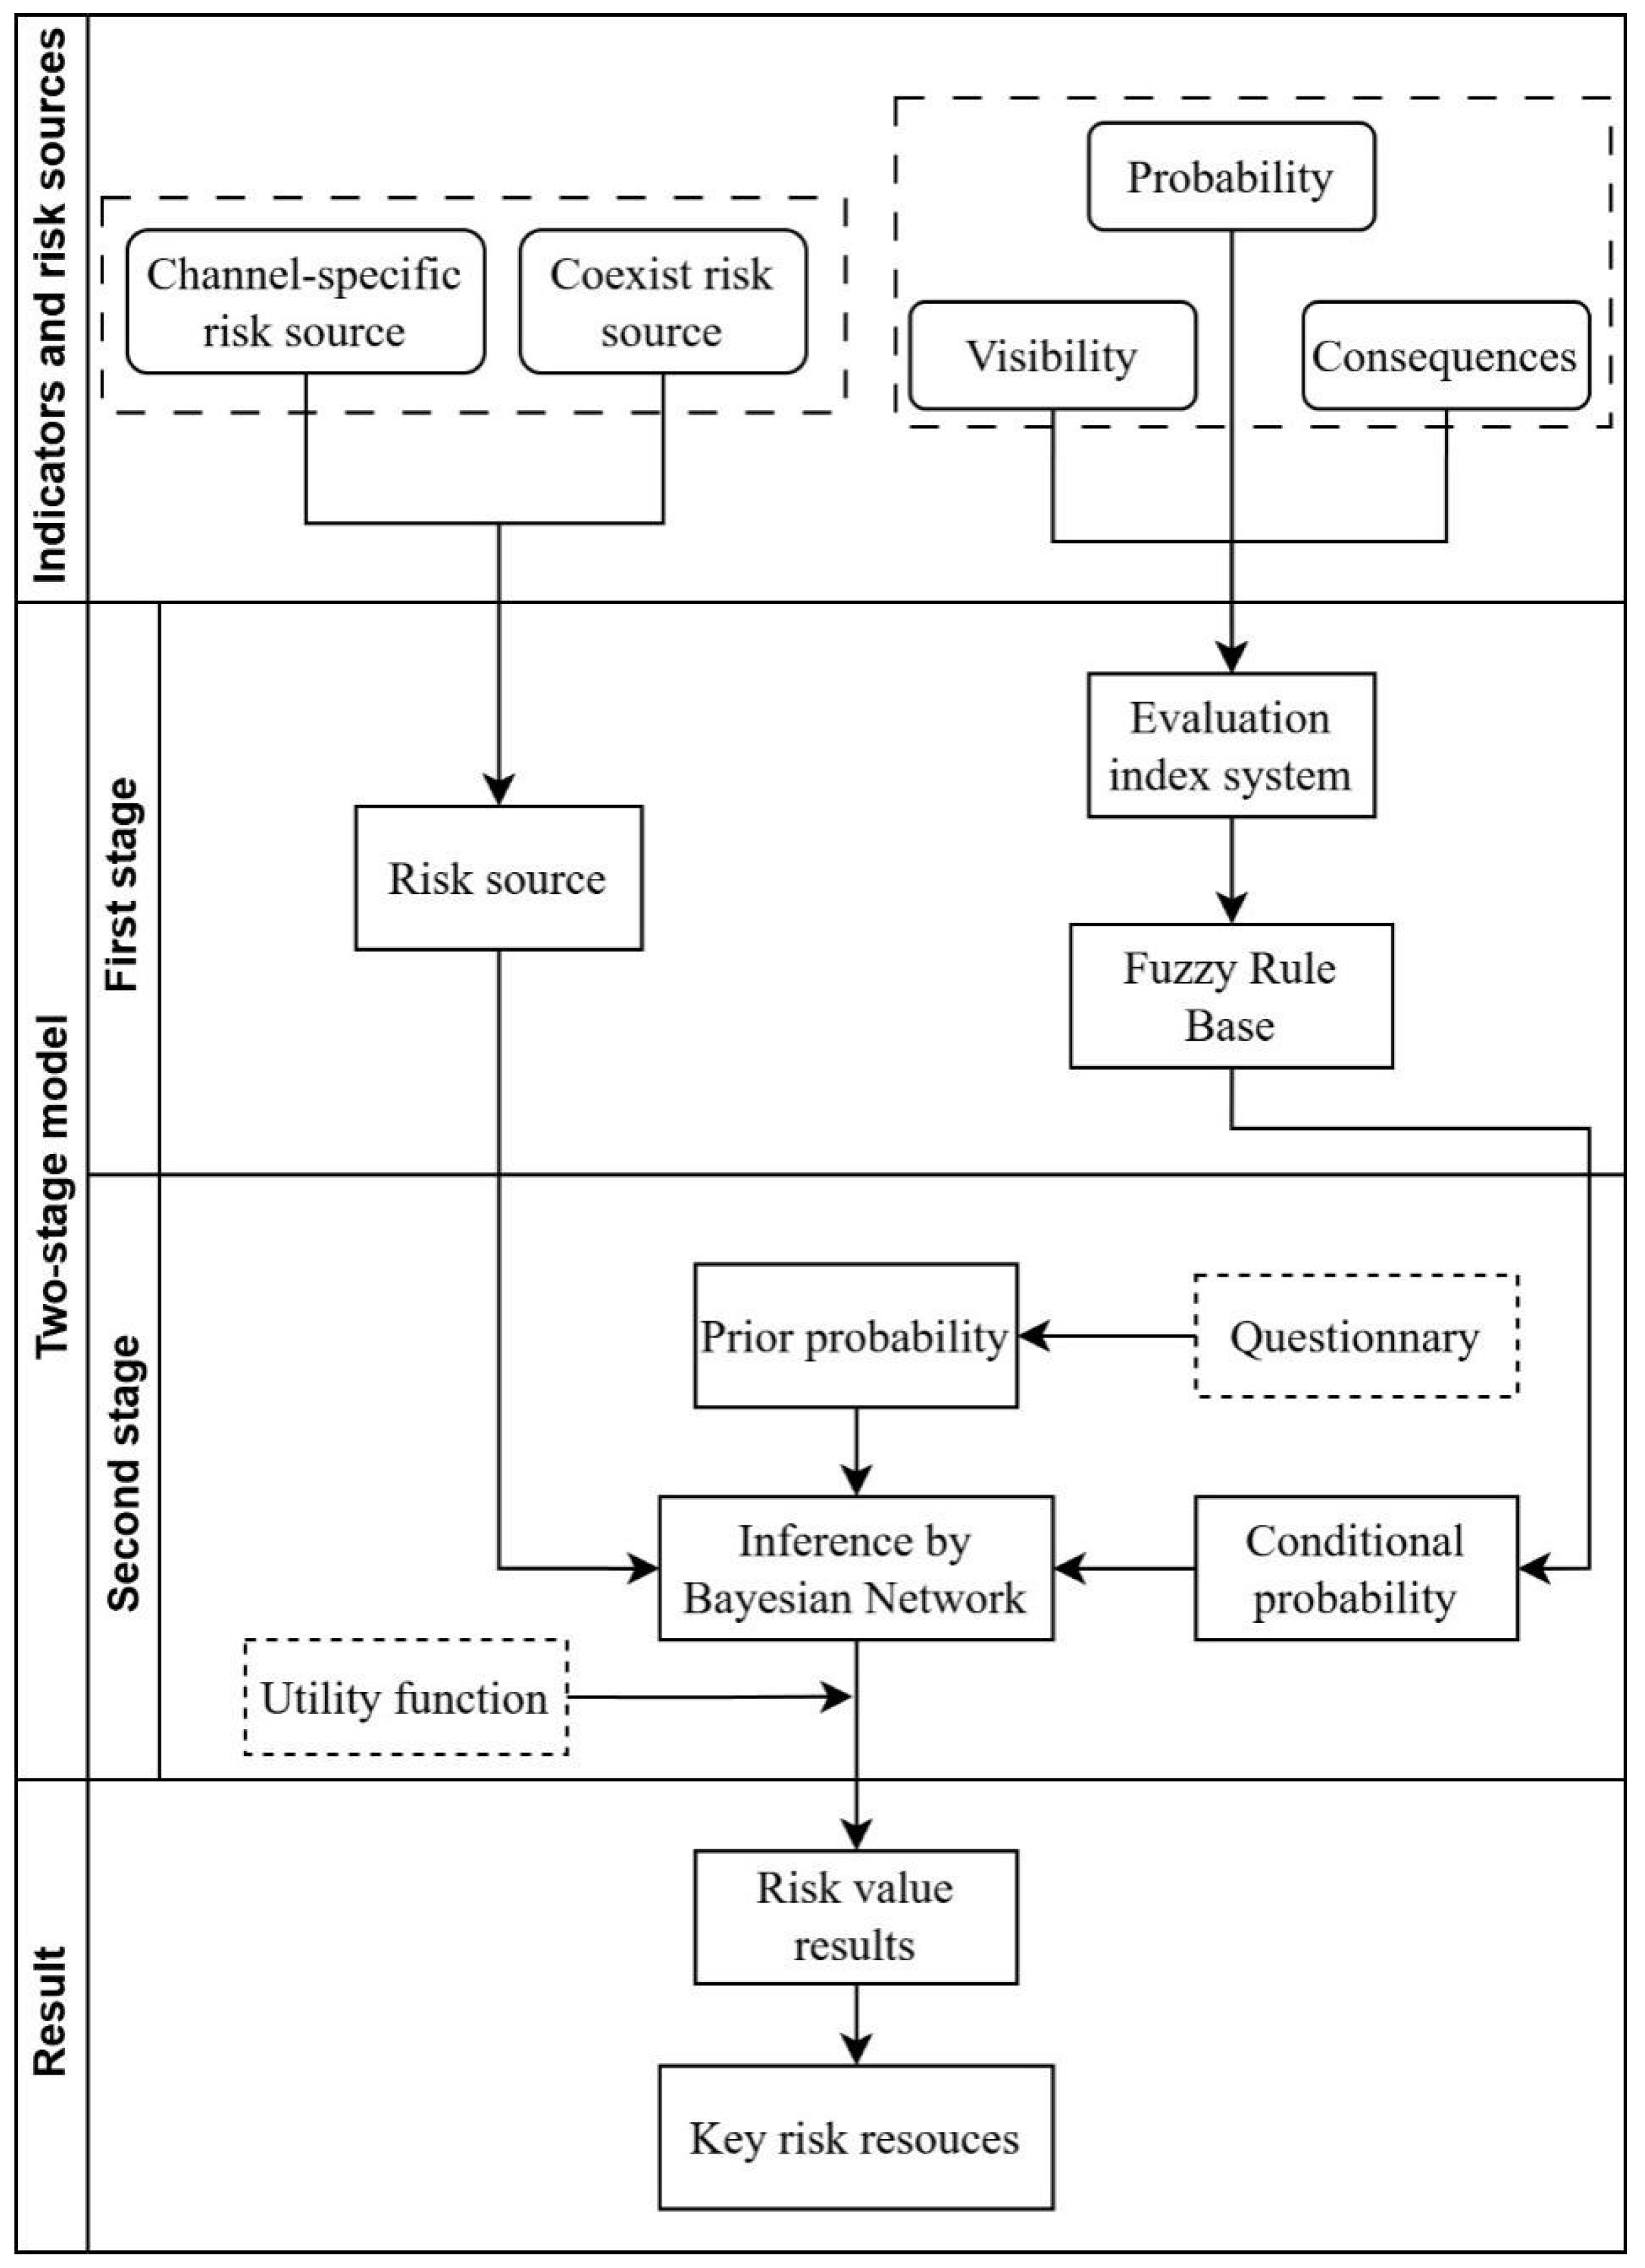
Typically, the choice of method in risk research hinges on several factors, including the availability of data (quantitative and qualitative information), the complexity of interrelationships among influencing factors, and the origins of uncertainty. A common challenge in inland waterway risk assessment is that the risk sources are constrained by many disparate factors, leading to varied outcomes. Given that this article plans to discuss the upper, middle, and lower reaches of the Yangtze River mainline separately, each with distinct characteristics, the system in question is exceedingly complex. Moreover, the relatively small sample size of ship traffic accidents necessitates the reliance on expert judgment for system assessment, introducing a degree of uncertainty. Consequently, this paper proposes a two-stage method that combines a fuzzy rule base with a Bayesian network, considering the convenience of using linguistic variables in a fuzzy rule base, which does not depend on precise mathematical models and offers robustness that is well suited for addressing non-linear problems in process control. On the other hand, Bayesian networks excel in modeling randomness and capturing non-linear causal relationships, with the added benefit of enhancing the visibility of results. After the initial risk source fusion and assessment through fuzzy reasoning in the first stage, Bayesian inference in the second stage facilitates rule synthesis.
In summary, this article will employ a two-stage assessment model integrating a fuzzy rule base and Bayesian network, with the specific steps illustrated in
Figure 1.
3.1. Selection of Risk Evaluation Indicators for Inland Waterway Navigation Accidents
- (1)
Probability of risk source occurrence
The initial factor to consider is the probability of risk source occurrence, denoted as PR. Spanning several thousand kilometers, the Yangtze River mainline exhibits distinct characteristics along its upper, middle, and lower reaches, with the likelihood of the same risk source occurring varying by region. For instance, in the upper reaches of the Yangtze River, where the terrain is predominantly mountainous and hilly with higher elevations, fog is more common; hence, the probability of adverse weather conditions is higher compared to the middle and lower reaches. Conversely, in the lower reaches, the navigational conditions are generally favorable, particularly following the completion of the 12.5 m deep water channel project in Nanjing, which has significantly advanced the local water transport industry. The increased vessel traffic in this segment leads to a higher probability of risk sources related to vessel flow density compared to the upper reaches. Since a higher probability of risk source occurrence can lead to more accidents, this paper selects PR as an evaluative indicator. This indicator is categorized into five levels, which are very low, low, medium, high, and very high, with the lowest level indicating the most favorable evaluation for navigational safety. For specific descriptions of these grades, refer to
Table 1.
- (2)
Visibility of risk source
The second evaluative indicator selected in this study is the visibility of the risk source, represented by V. Visibility refers to the ease with which a risk source can be anticipated during routine management. In daily navigational management, some risk sources are visible, such as adverse weather conditions, which crew members can often predict simply based on experience. However, other risk sources, such as crew personality and psychological defects or the improper management of affiliated vessels, typically require comprehensive and in-depth investigation and are not easily detectable. These less perceptible risk sources, when accumulated and combined with triggering conditions, can readily lead to maritime traffic accidents. Therefore, this study also includes the visibility of the risk source as an evaluative indicator. It is divided into five levels from high to low visibility as follows: very high, high, medium, low, and very low, with very high visibility indicating a higher level of safety for the vessel in this aspect. For specific descriptions of these grades, refer to
Table 2.
- (3)
Probability of risk source causing accidents
The third evaluative indicator selected in this paper is the probability of the risk source causing accidents, denoted by PA [
20]. During navigation, the likelihood of different risk sources leading to accidents varies; for instance, encountering natural disasters in the Yangtze River mainline may pose a higher risk of causing vessel traffic accidents compared to lower crew quality. The probability of an accident itself is also a crucial metric for evaluating risk sources. Therefore, this indicator has been included and categorized based on the impact on accident occurrence from low to high into five levels as follows: very low, low, medium, high, and very high. Lower levels indicate better safety performance on this indicator. For a detailed description of these grades, refer to
Table 3.
- (4)
Consequences of risk source
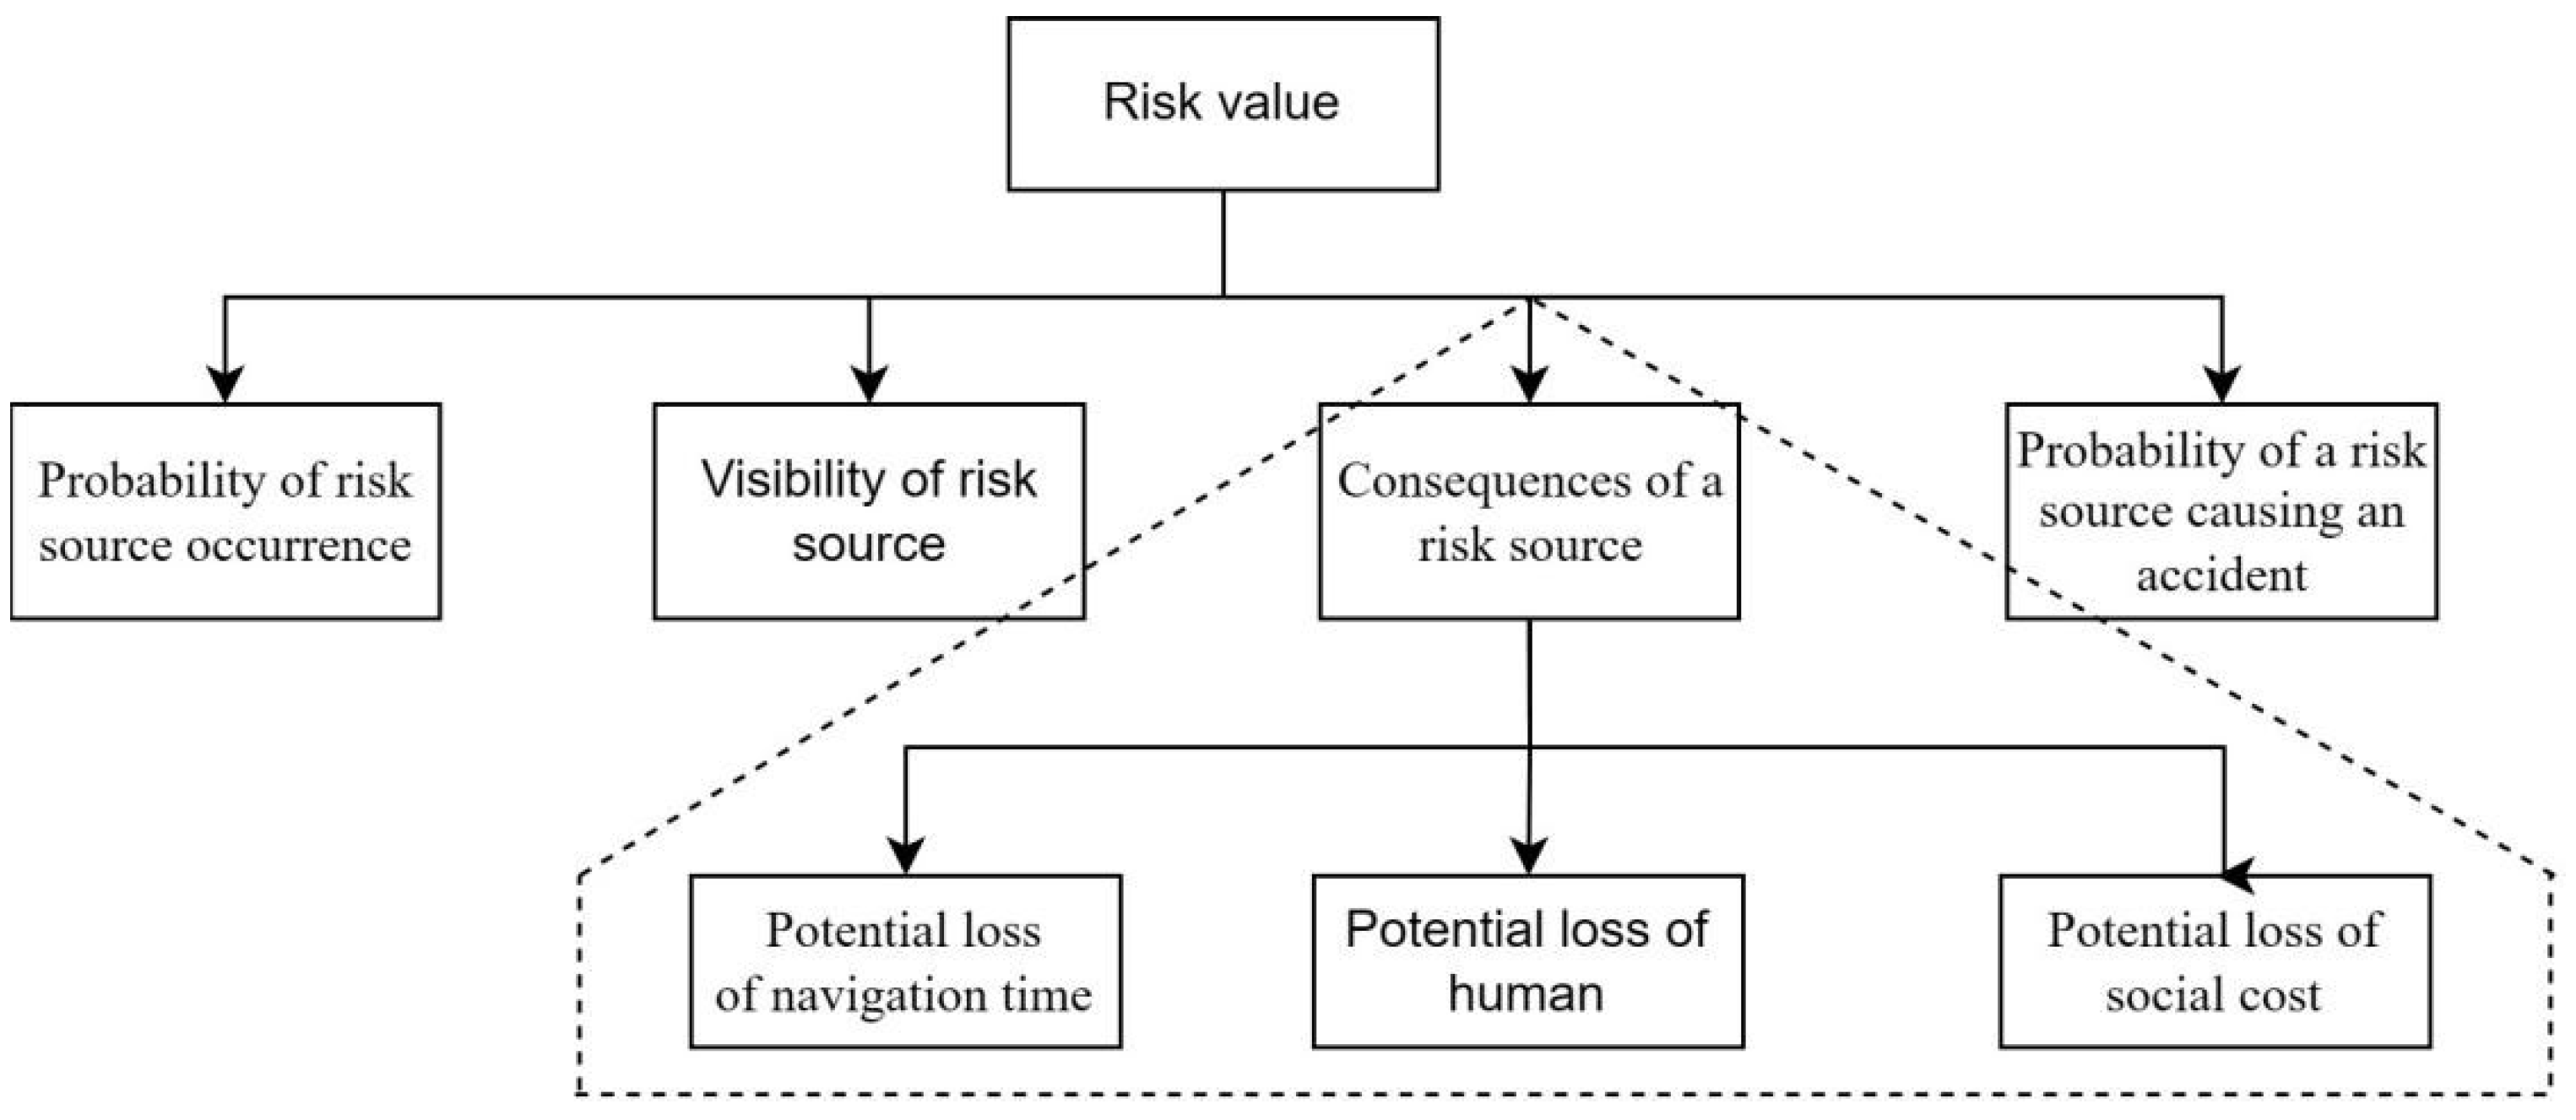
The fourth risk indicator selected is the consequences of risk source, denoted as CO. The specific consequences are further categorized into three types, namely the potential loss of navigation time, potential human casualties, and potential loss of social cost, represented by the symbols T, H, and C, respectively. In a general sense, consequences are a relatively broad concept that may encompass many different aspects. This paper refines the concept by classifying it into three categories, enhancing the assessment of the consequences caused by risk sources and providing a dual-layered risk parameter model for the construction of a fuzzy rule library from a methodological perspective.
The connection between risk sources and their consequences is in most cases based on the type of accidents that the risk sources may cause. For example, existing research indicates that changes in water flow in certain sections of the Yangtze River in Chongqing often lead to consequences such as collisions, groundings, or reef contacts, while the likelihood of incidents such as self-collision, reef contact, or wave damage is higher in rough weather conditions [
21]. Other studies combine extensive accident data with related analysis to directly identify the main risk factors for different types of accidents in certain sections, such as the influence of ship age and traffic density on sinking in the sections under the jurisdiction of the Wuhu Maritime Bureau, while crew composition is an important factor affecting fires. Navigation density is also crucial for contact incidents [
22]. Therefore, risk sources do not directly affect outcomes but establish a connection through the type of accidents. Different types of accidents result in different levels of consequences; for instance, under otherwise equal conditions, the consequences of sinking are often relatively more severe than those of contact or collision incidents.
- (a)
Potential loss of time
The first branch of the consequences of risk sources is the potential loss of navigation time, denoted by the symbol T. Navigation hindrance refers to a variety of activities and behaviors that impede vessel movement. This type of consequence is quite characteristic in inland navigation processes and is influenced by the dimensions of the waterway. It is a common occurrence in some of the shallower and more perilous channels of the Yangtze River mainline. Manifestations include the suspension of navigation or vessel congestion, with different types of accidents causing varying degrees of navigation hindrance. In this study, the time lost due to navigation hindrance is categorized from least to most severe into five levels, namely very low, low, medium, high, and very high. For detailed descriptions of these grades, refer to
Table 4.
- (b)
Potential human casualties
The second branch of the consequences of risk sources is the potential human loss due to accident types caused by the risk source, denoted by the symbol H. In the course of vessel navigation, navigational safety incidents can lead to injuries and in severe cases, may result in the death or disappearance of crew members. As evident from
Section 2 of this manuscript, human loss is a critical consequence of navigational risks. This study has consulted national safety management authorities’ standards for accident classification and grading, categorizing the extent of human loss from least to most severe into five levels, namely very low, low, moderate, high, and very high. For a detailed account of these grades, refer to
Table 5.
- (c)
Potential loss of social cost
The final branch of the consequences of risk sources is the potential social cost loss caused by accidents, indicated by the symbol C. Once an accident occurs during vessel navigation, it results in varying degrees of social cost loss. The extent of cost damage is often determined by the type of accident and the specific circumstances of the vessel involved. This study adheres to the accident classification and grading standards set by national safety management authorities, categorizing the magnitude of social cost loss from least to most severe into five levels as follows: very low, low, medium, high, and very high. For a detailed explanation of these grades, see
Table 6.
The six indicators collectively form the evaluation index system of this study, with their interrelationships depicted in
Figure 2. This framework is structured into two hierarchical levels; the first level consists of four fundamental evaluative indicators, while the second level is composed of three sub-parameters of consequence indicators. Through the application of a fuzzy rule base, this study examines the specifics of each indicator parameter and employs Bayesian networks to aggregate related rules. This approach facilitates the assessment and ranking of various risk sources while simultaneously enhancing the visibility of the results.
3.2. Construction of Risk Assessment Model for Inland Vessel Traffic Accidents
3.2.1. Two-Stage Risk Assessment Model
The core steps of the two-stage model for the risk assessment of inland waterway navigation accidents are the establishment of a fuzzy rule base and the Bayesian aggregation of rules. Fuzzy belief rules are used to logically model the relationship between risk indicators and risk sources by converting the rule base into conditional probabilities and then using Bayesian inference to evaluate the top-level objectives.
- (1)
Fuzzy Rule Base
Fuzzy rules are derived from fuzzy set theory and typically use “IF-THEN” rules to represent the mapping relationship between two domains. The general form of a fuzzy rule is as follows: if x is A, then y is B [
21].
A and B are fuzzy sets defined by linguistic values on the domains x and y, respectively. “x is A” is known as the premise, and “y is B” is the conclusion.
Since an absolute mapping relationship between linguistic values may not be established in practical applications, scholars have proposed fuzzy rules based on belief degrees as follows: if x is A, then y is B with a belief degree of β. Here, β represents the degree of belief in the conclusion “y is B” based on the premise “x is A”, with 0 ≤ β ≤ 1.
- (2)
Bayesian Network
Under normal circumstances, the probability of event A given that event B has occurred, and the probability of event B given that event A has occurred, are not the same. A Bayesian network is a statement of this relationship based on probability theory. It represents the probability of event A occurring given that event B has occurred, known as the conditional probability of event A given event B. The basic formula for solving this is shown in the following equation, where it represents two events in the basic event set E [
8]:
For events
and
, Equation (2) can be used.
The posterior probability formula is the basis for inference in Bayesian networks. Let the prior probability be
if the conditional probability
is known and
, then the Bayesian posterior probability formula is shown in Equation (3).
A Bayesian network’s structure is a directed acyclic graph
, where nodes represent variables
, and the relationships between variables are indicated by directed arcs
. The direction of an arc goes from a cause node to a consequent node, that is, from a parent node to a child node. Nodes that are not directly connected represent independence from each other. The parameters of a Bayesian network are the conditional probability tables (CPTs) that represent the relationships between variables, represented as
. They signify the inter-dependencies among variables. In other words, a Bayesian network is composed of a network structure with interdependent relationships between nodes and conditional probability tables that connect the variables. For directed edges
, the parent nodes of
are represented as
, and non-descendant nodes can be represented as
. Under the condition of given parent nodes, non-descendant nodes are conditionally independent of the parent nodes, as shown in Equation (4). From this, the joint probability can be obtained, as shown in Equation (5).
Therefore, the selection of nodes in a Bayesian network is a prerequisite for determining its structure. Once the structure of the Bayesian network is established, the related parameters of its nodes should be learned. There are two methods for Bayesian network learning; the first is based on expert experience, where questionnaires are distributed to obtain the weights of related indicators, and the conditional probability tables for each node are obtained through relevant calculations. The second method is data-driven, where relevant accident data are imported to train the model and acquire the probabilities for the respective nodes.
3.2.2. Establishment of Fuzzy Rule Base
Considering that the relationship between the selected indicators and the final safety evaluation result is not linear, this study proposes a fuzzy rule base method to analyze their connection, as discussed in the first section of this chapter. The establishment of the belief rule base is based on the following formula:
where PRk, Vk, PAk, Tk, Hk, and Ck represent the linguistic variable values of the indicators for the probability of accident occurrence, risk source visibility, potential navigational time loss caused by accidents, potential human casualties, and social cost loss caused by accidents, respectively, under the kth rule. At the same time, Rk represents the belief value of risk value R under these conditions. The belief values are also divided into five levels, corresponding to the impact size of the risk, namely very low, low, medium, high, and very high, represented as R1, R2, R3, R4, and R5, respectively.
When each indicator is assigned a definite outcome, the corresponding risk impact belief value will also generate respective results at each level, as shown in the following formula:
Rulek: if PRk and Vk and PA
k and Tk and Hk and Ck,
In this study, the proportional method is employed to obtain the distribution of degrees of belief in the final results, meaning the belief degree for a certain level in the THEN part is calculated by dividing the number of risk parameters by the corresponding level’s fuzzy membership function obtained from the IF part. Specifically, equal weight is given to the four primary indicators (PR, V, PA, and CO), and the three secondary indicators (T, H, and C) are also divided by the same weight. For instance, if the value of PR is very small (PR1), V is large (V2), PA is moderate (PA3), T is very small (T1), H is large (H4), and C is very large (C5), the resulting distribution of R values would be a belief degree of 33.33% for R1 (25% + 8.33%), 25% for R2, 25% for R3, 8.33% for R4, and 8.33% for R5. Consequently, a rule base comprising 15,625 (5^6) rules can be developed. This rule base will be applied to the risk assessment of traffic accidents in the Yangtze River mainline, with some of the functional relationships between antecedents and conclusions shown in
Table 7.
3.2.3. Risk Inference Using Bayesian Network
Upon completion of the fuzzy belief rule base construction for the risk analysis of vessel traffic accidents in the Yangtze River mainline, Bayesian networks can be utilized for risk inference. The rule base, endowed with a belief structure, will be combined with expert experience and represented in the form of conditional probabilities; that is, the rule base in
Table 7 will be modeled and transformed into a structure aggregated across seven nodes. These seven nodes will include six parent nodes (PR, V, PA, T, H, and C) and one child node (R). After transferring the rule base to the Bayesian network, the rule-based analysis will be simplified to the computation of the marginal probability of the child node R, denoted as NR.
The prior probability of the parent node in the Bayesian network mentioned above is actually based on the expert probability obtained from the questionnaire distributed in our paper. Therefore, the prior probabilities of each node can be expressed using the following formula:
Thus, we have effectively obtained the distribution of different risk sources across various levels. To facilitate a better comparison of these risk sources, it is necessary to introduce utility indicators to evaluate the different levels. The selection of different utility values will impact the calculation of the final risk value results. To reflect the progressive hierarchical relationship between the levels of the indicators, this study considers defining their utility distribution based on a linear distribution, with the given utility value distribution as shown in the following formula:
In summary, the final risk value size Rp for each risk source is defined as follows:
4. Results and Discussion
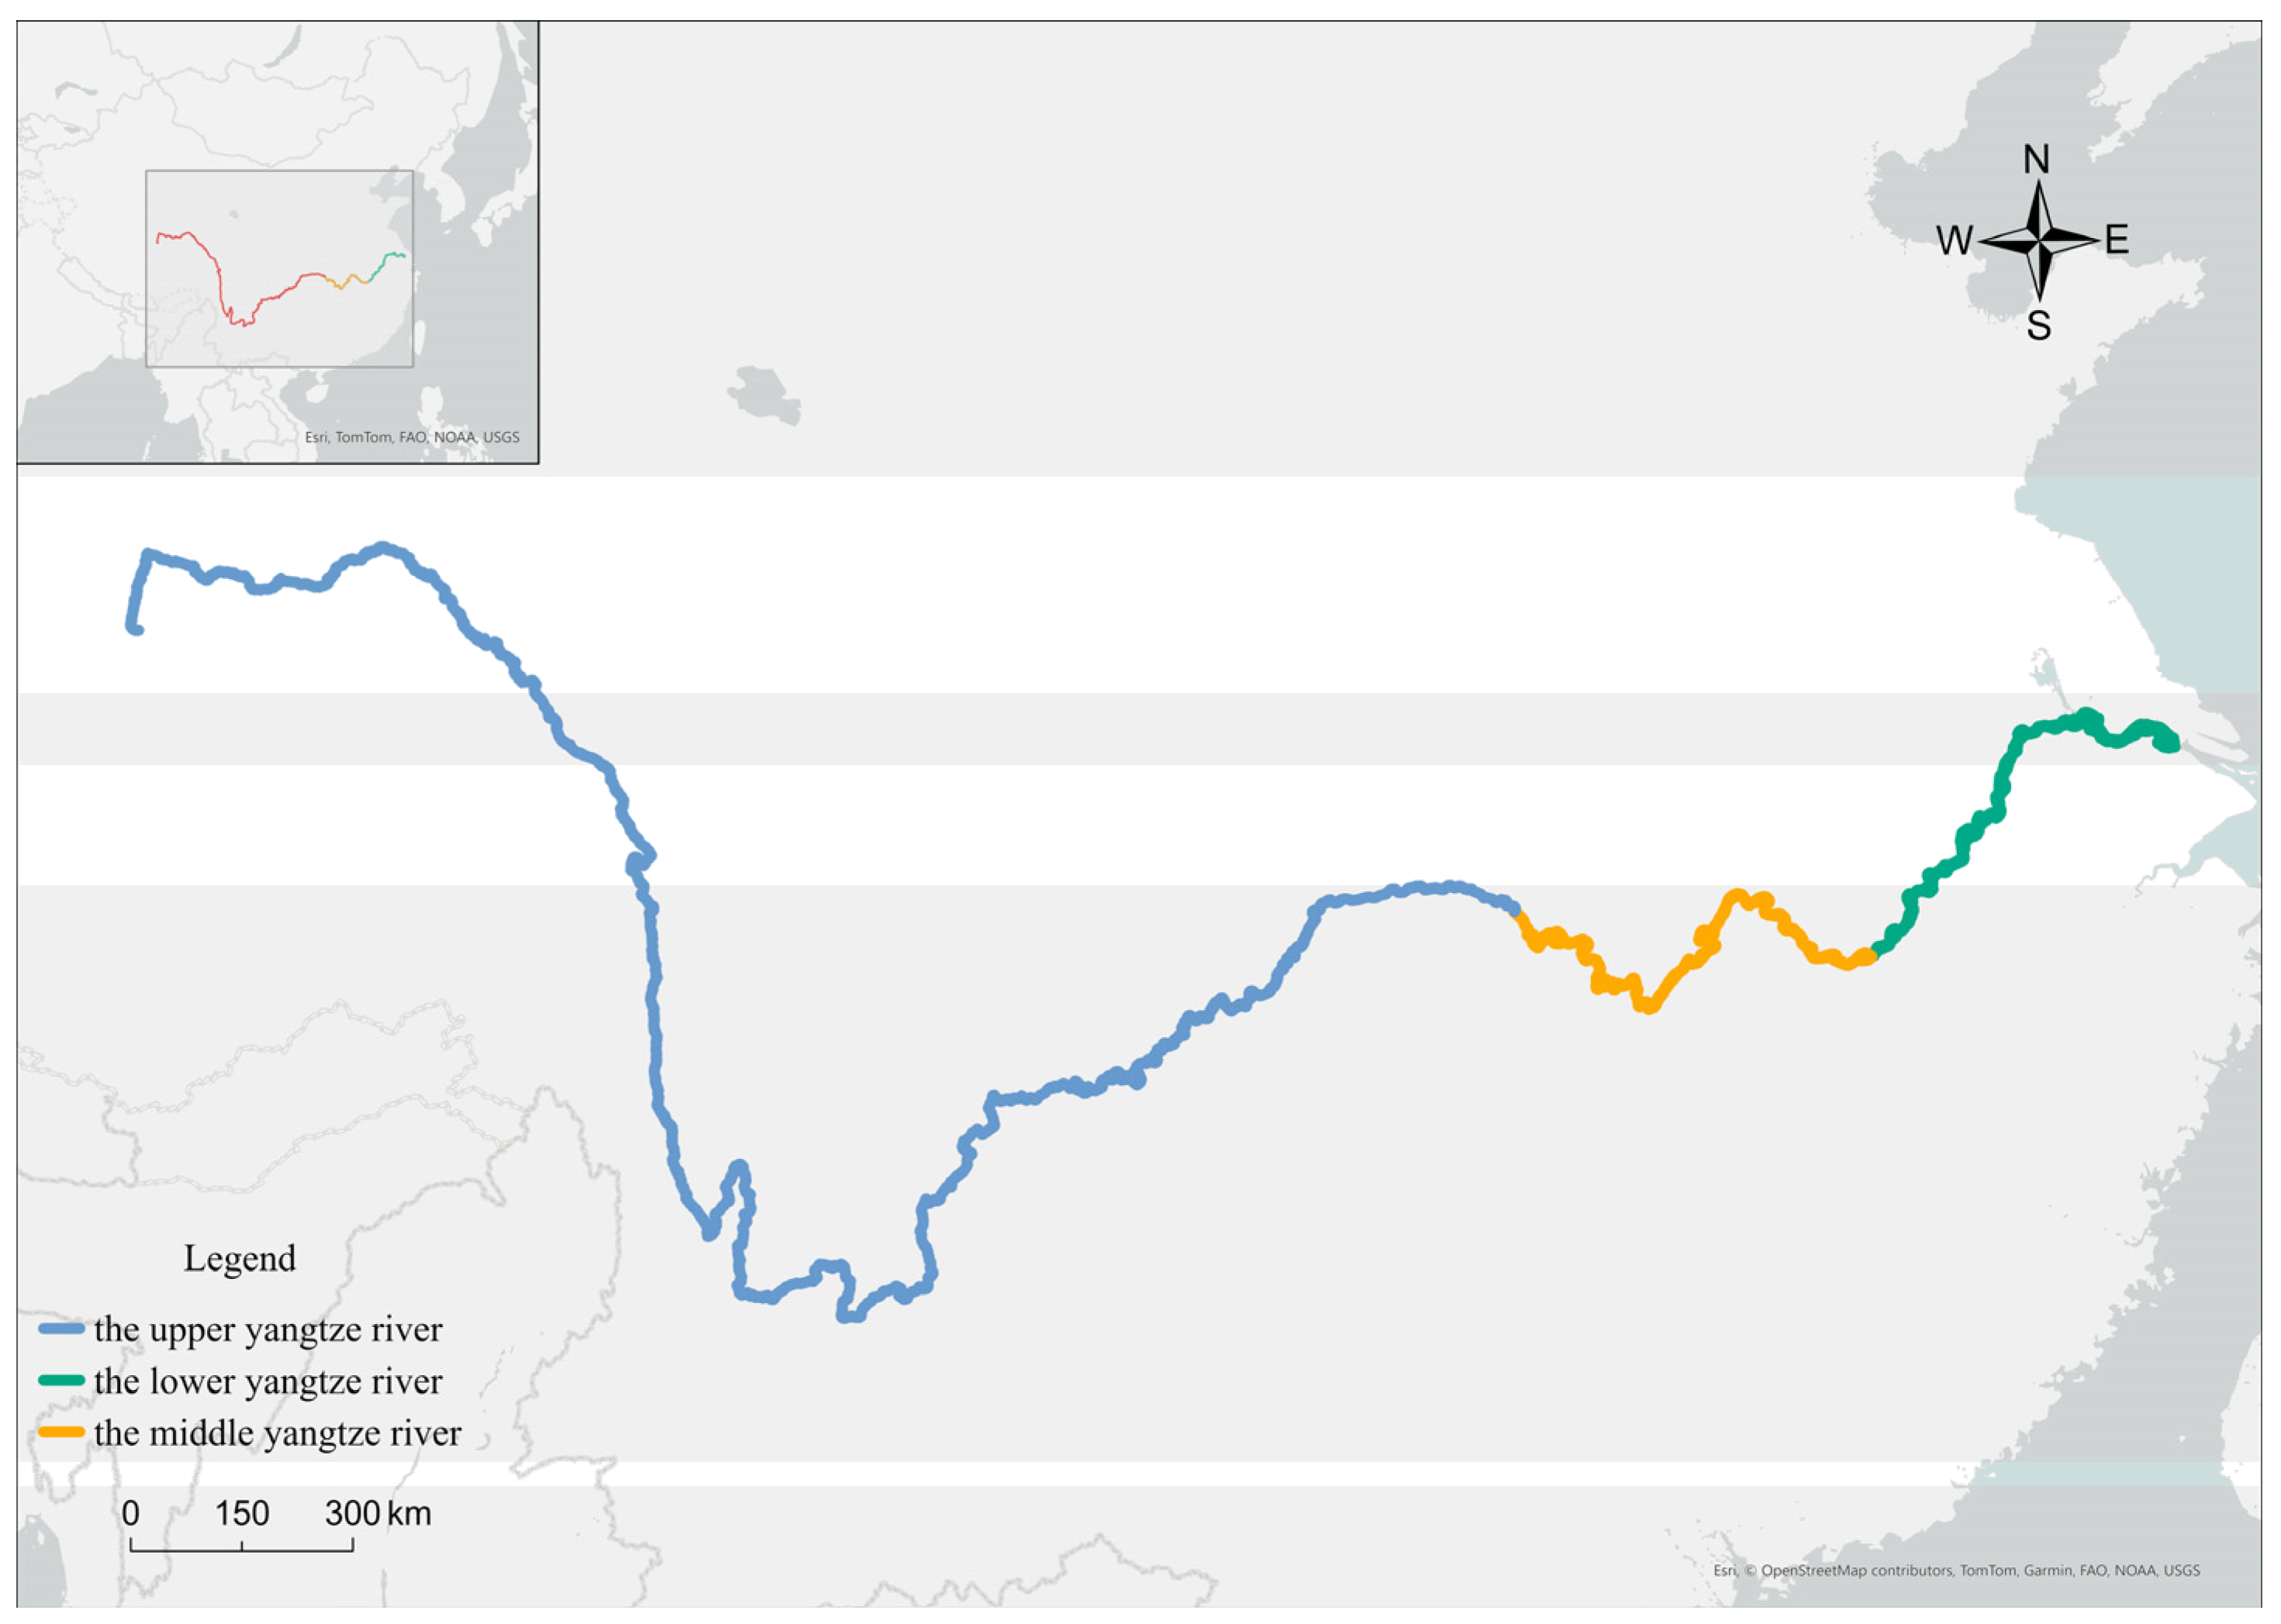
The origin of the Yangtze River mainline is located in Shuifu City, Yunnan Province, in the southwestern region of China, while its mouth enters the sea in Shanghai in the eastern part of the country, spanning a total length of over 6300 km. Based on the distinct characteristics of the river channel, the Yangtze River mainline can be divided into three sections, namely the upper, middle, and lower Yangtze River channels. The locations of these segments are illustrated in
Figure 3.
4.1. Identification of Risk Sources for Vessel Traffic Accidents on the Yangtze River Mainline
4.1.1. Analysis of Vessel Traffic Accident Characteristics on the Yangtze River Mainline
To gain an in-depth understanding of the characteristics of vessel traffic accidents on the Yangtze River mainline and to reveal the causes of these accidents, this chapter conducts a statistical analysis of maritime incidents that have occurred in recent years along the upper, middle, and lower reaches of the Yangtze River. It summarizes the characteristics of these accidents to identify risk sources for each navigational segment.
- (1)
Typical section of the upper Yangtze River
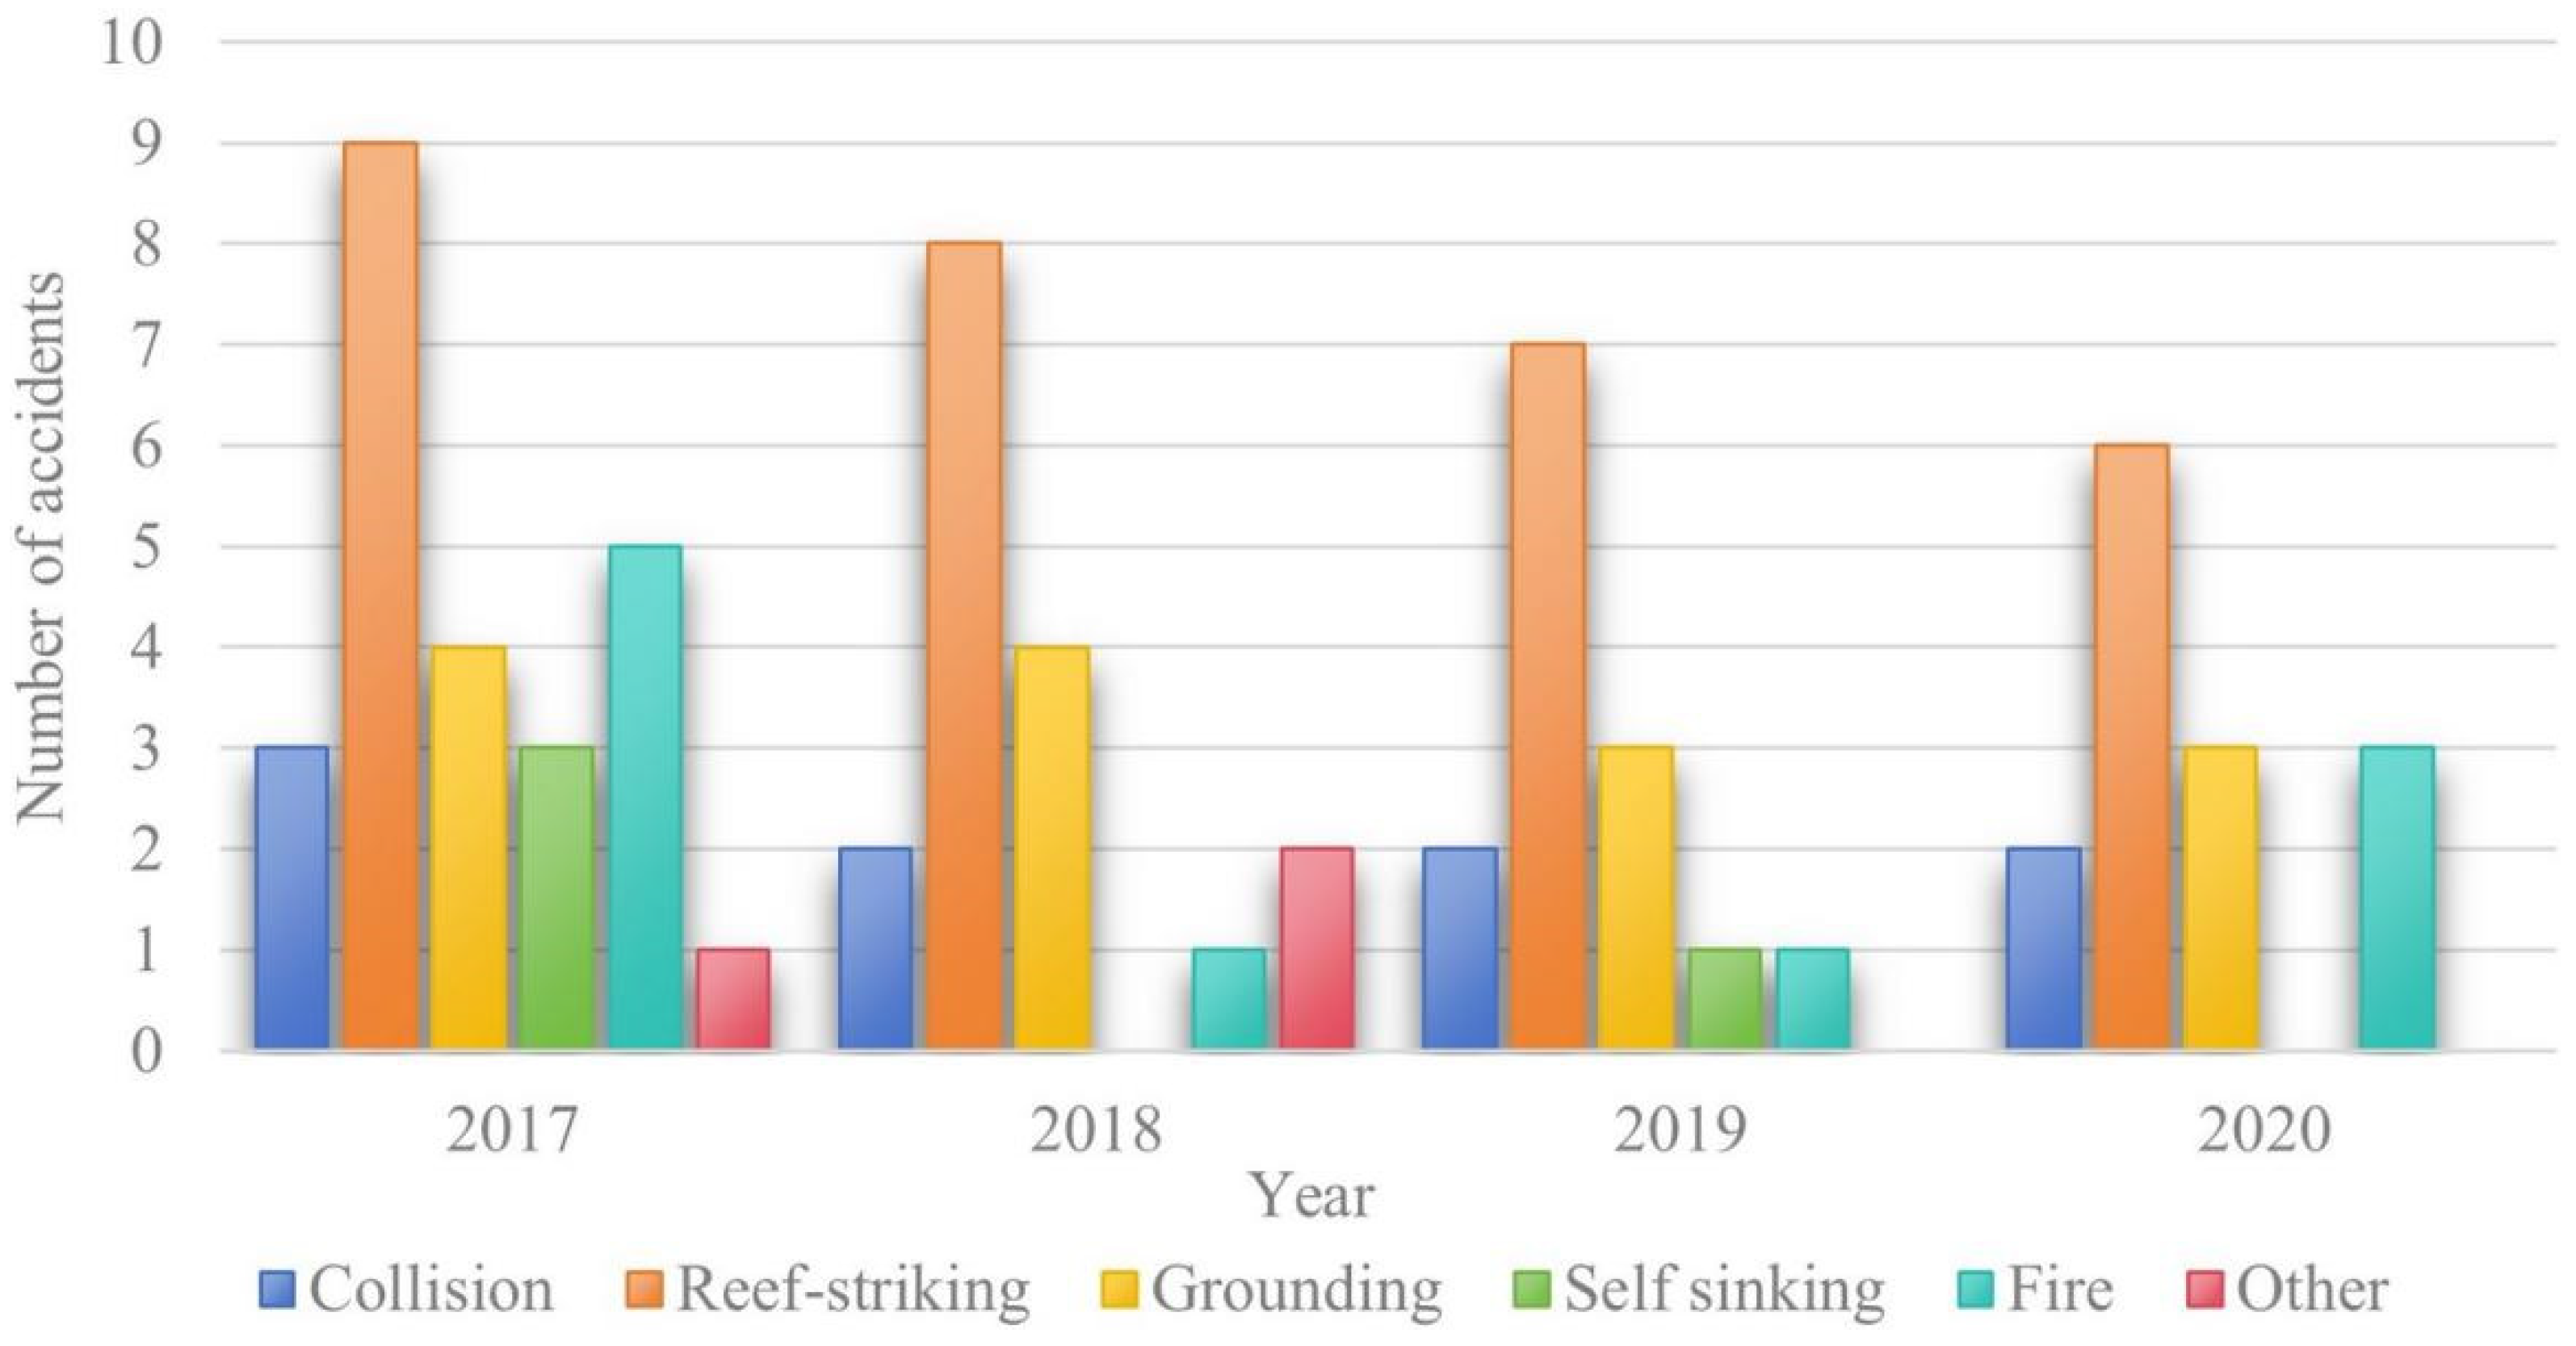
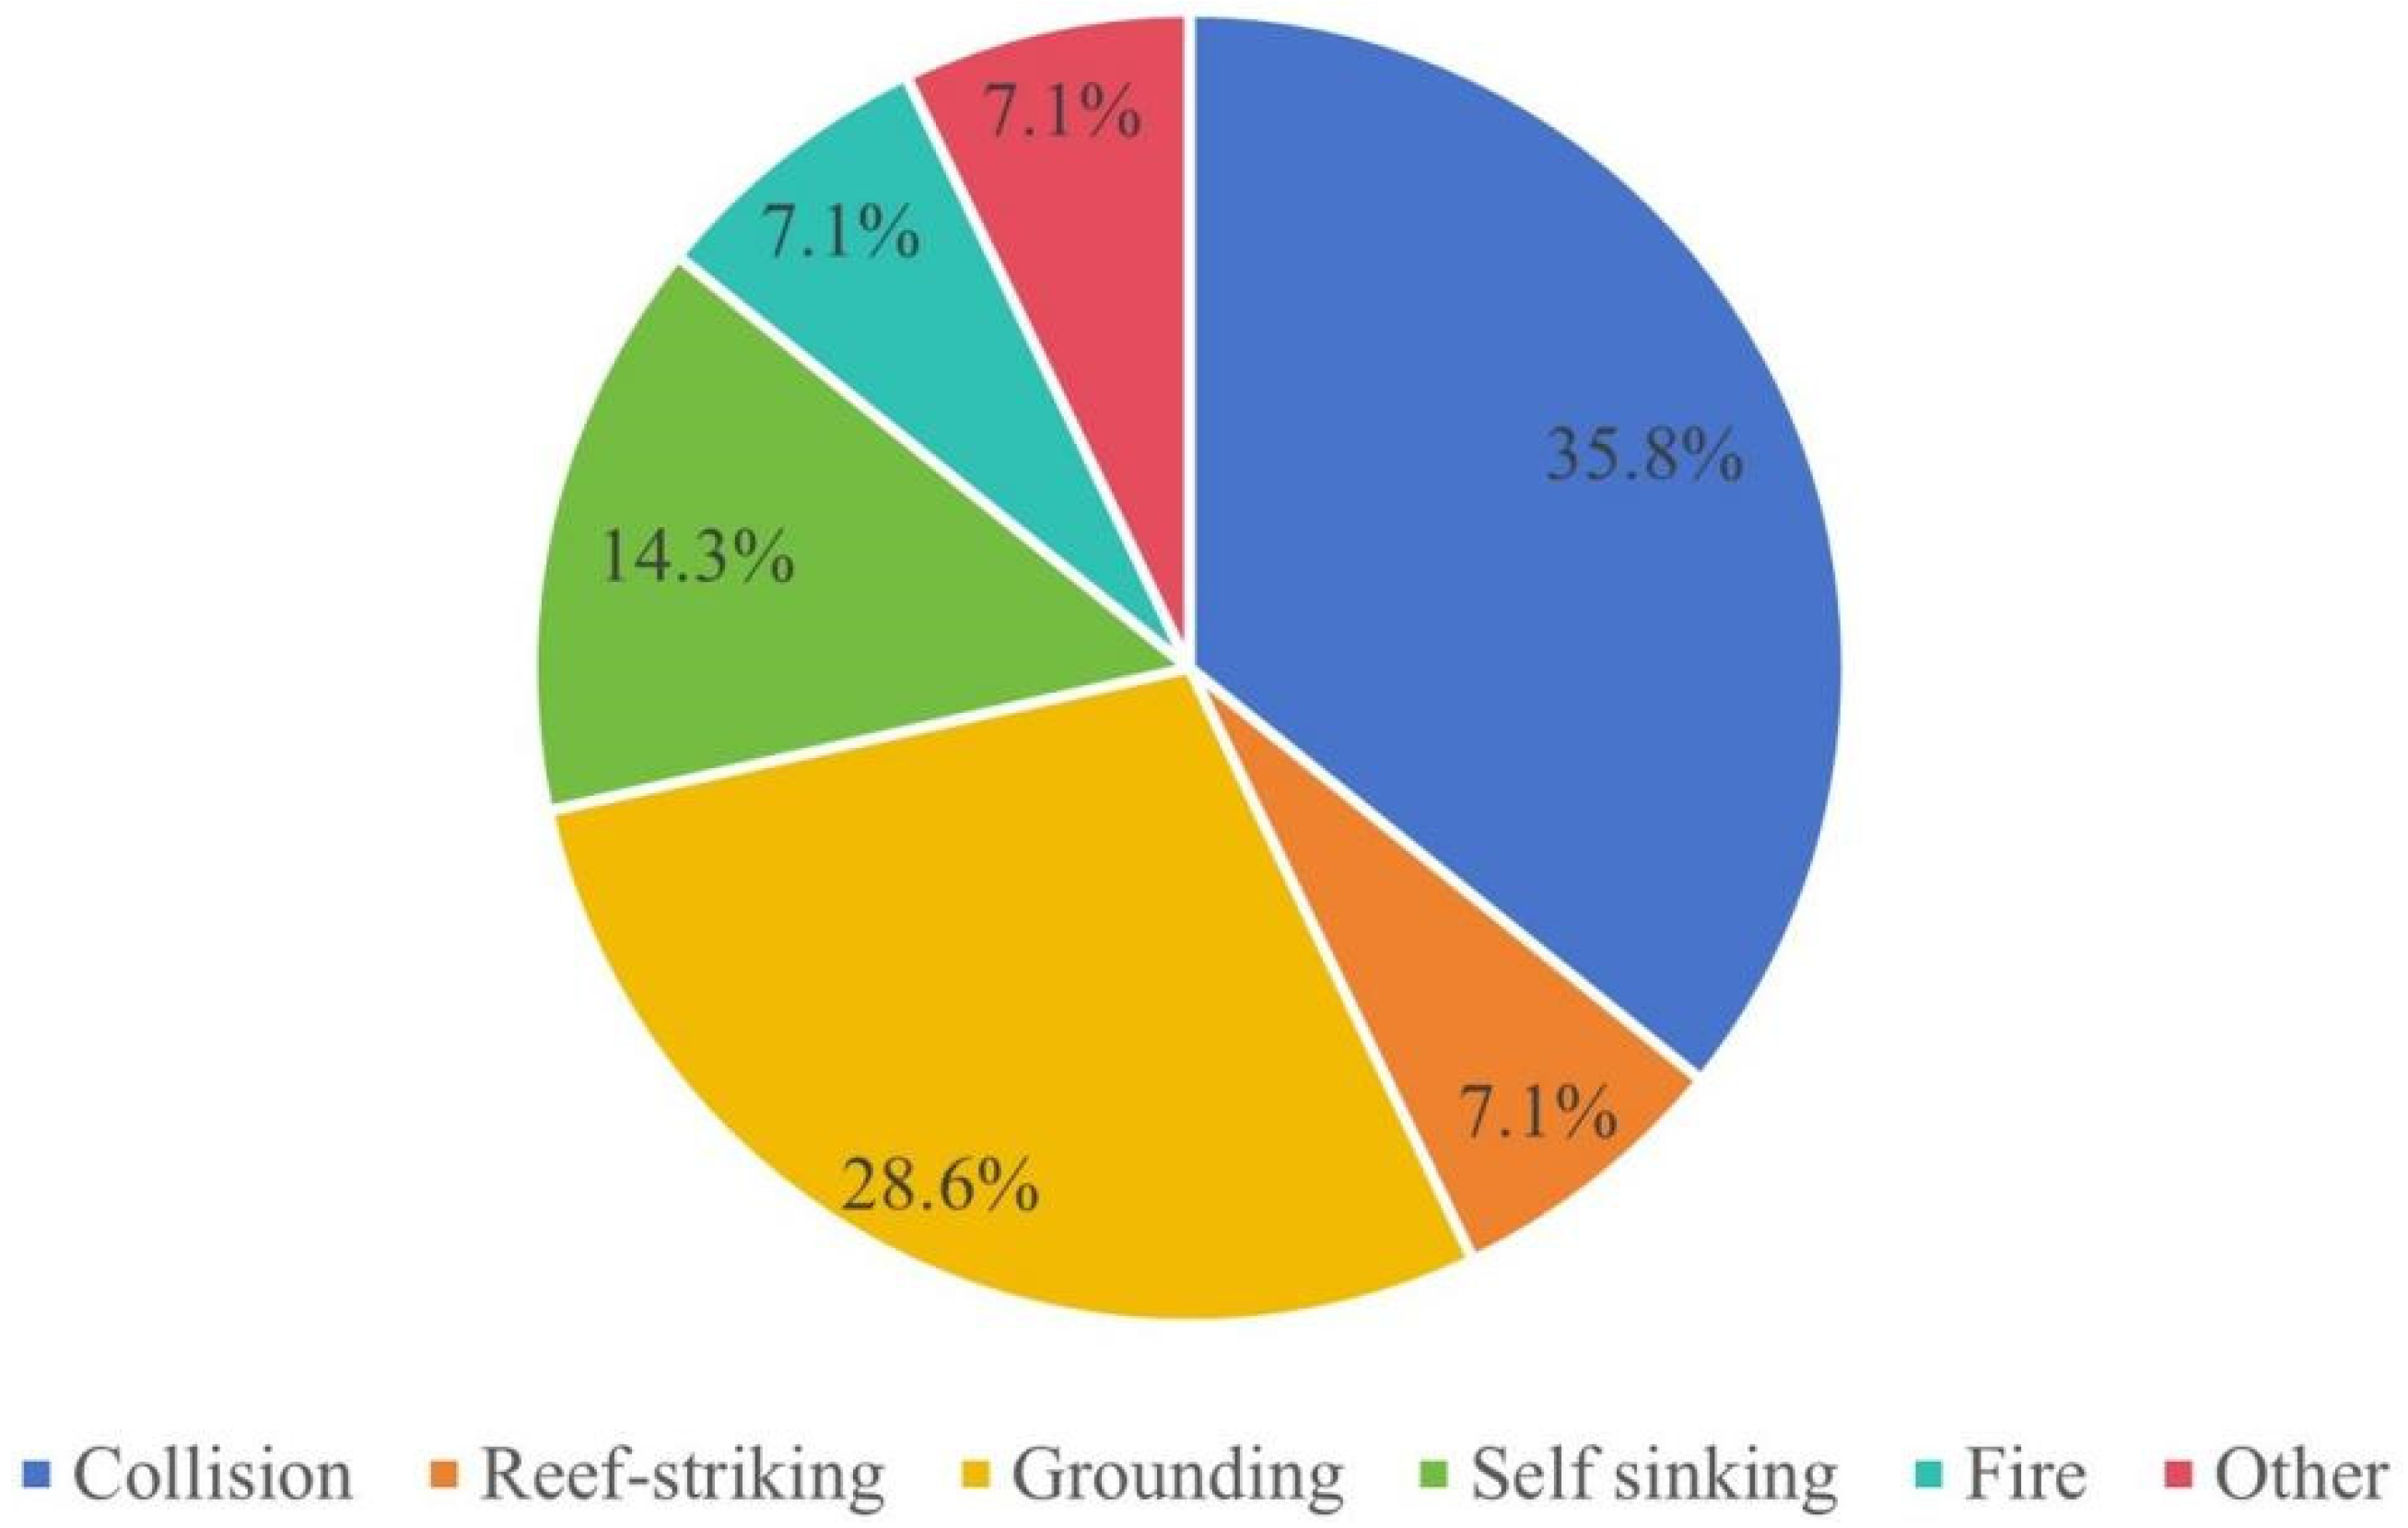
The distribution of various types of vessel traffic accidents in the waterway sections under the jurisdiction of the Chongqing Maritime Safety Administration from 2017 to 2020 is illustrated in
Figure 4.
An analysis of accident types within the Chongqing Maritime Safety Administration’s jurisdiction reveals a predominant occurrence of reef strikings, consistently leading in incident count over the past four years. The navigational conditions in the mountainous regions, characterized by narrow, shallow waterways with frequent sharp turns, significantly contribute to the high incidence of groundings. Additionally, fire accidents represent a substantial proportion of incidents, potentially attributable to inadequate management systems, warranting further investigation for specific causative factors.
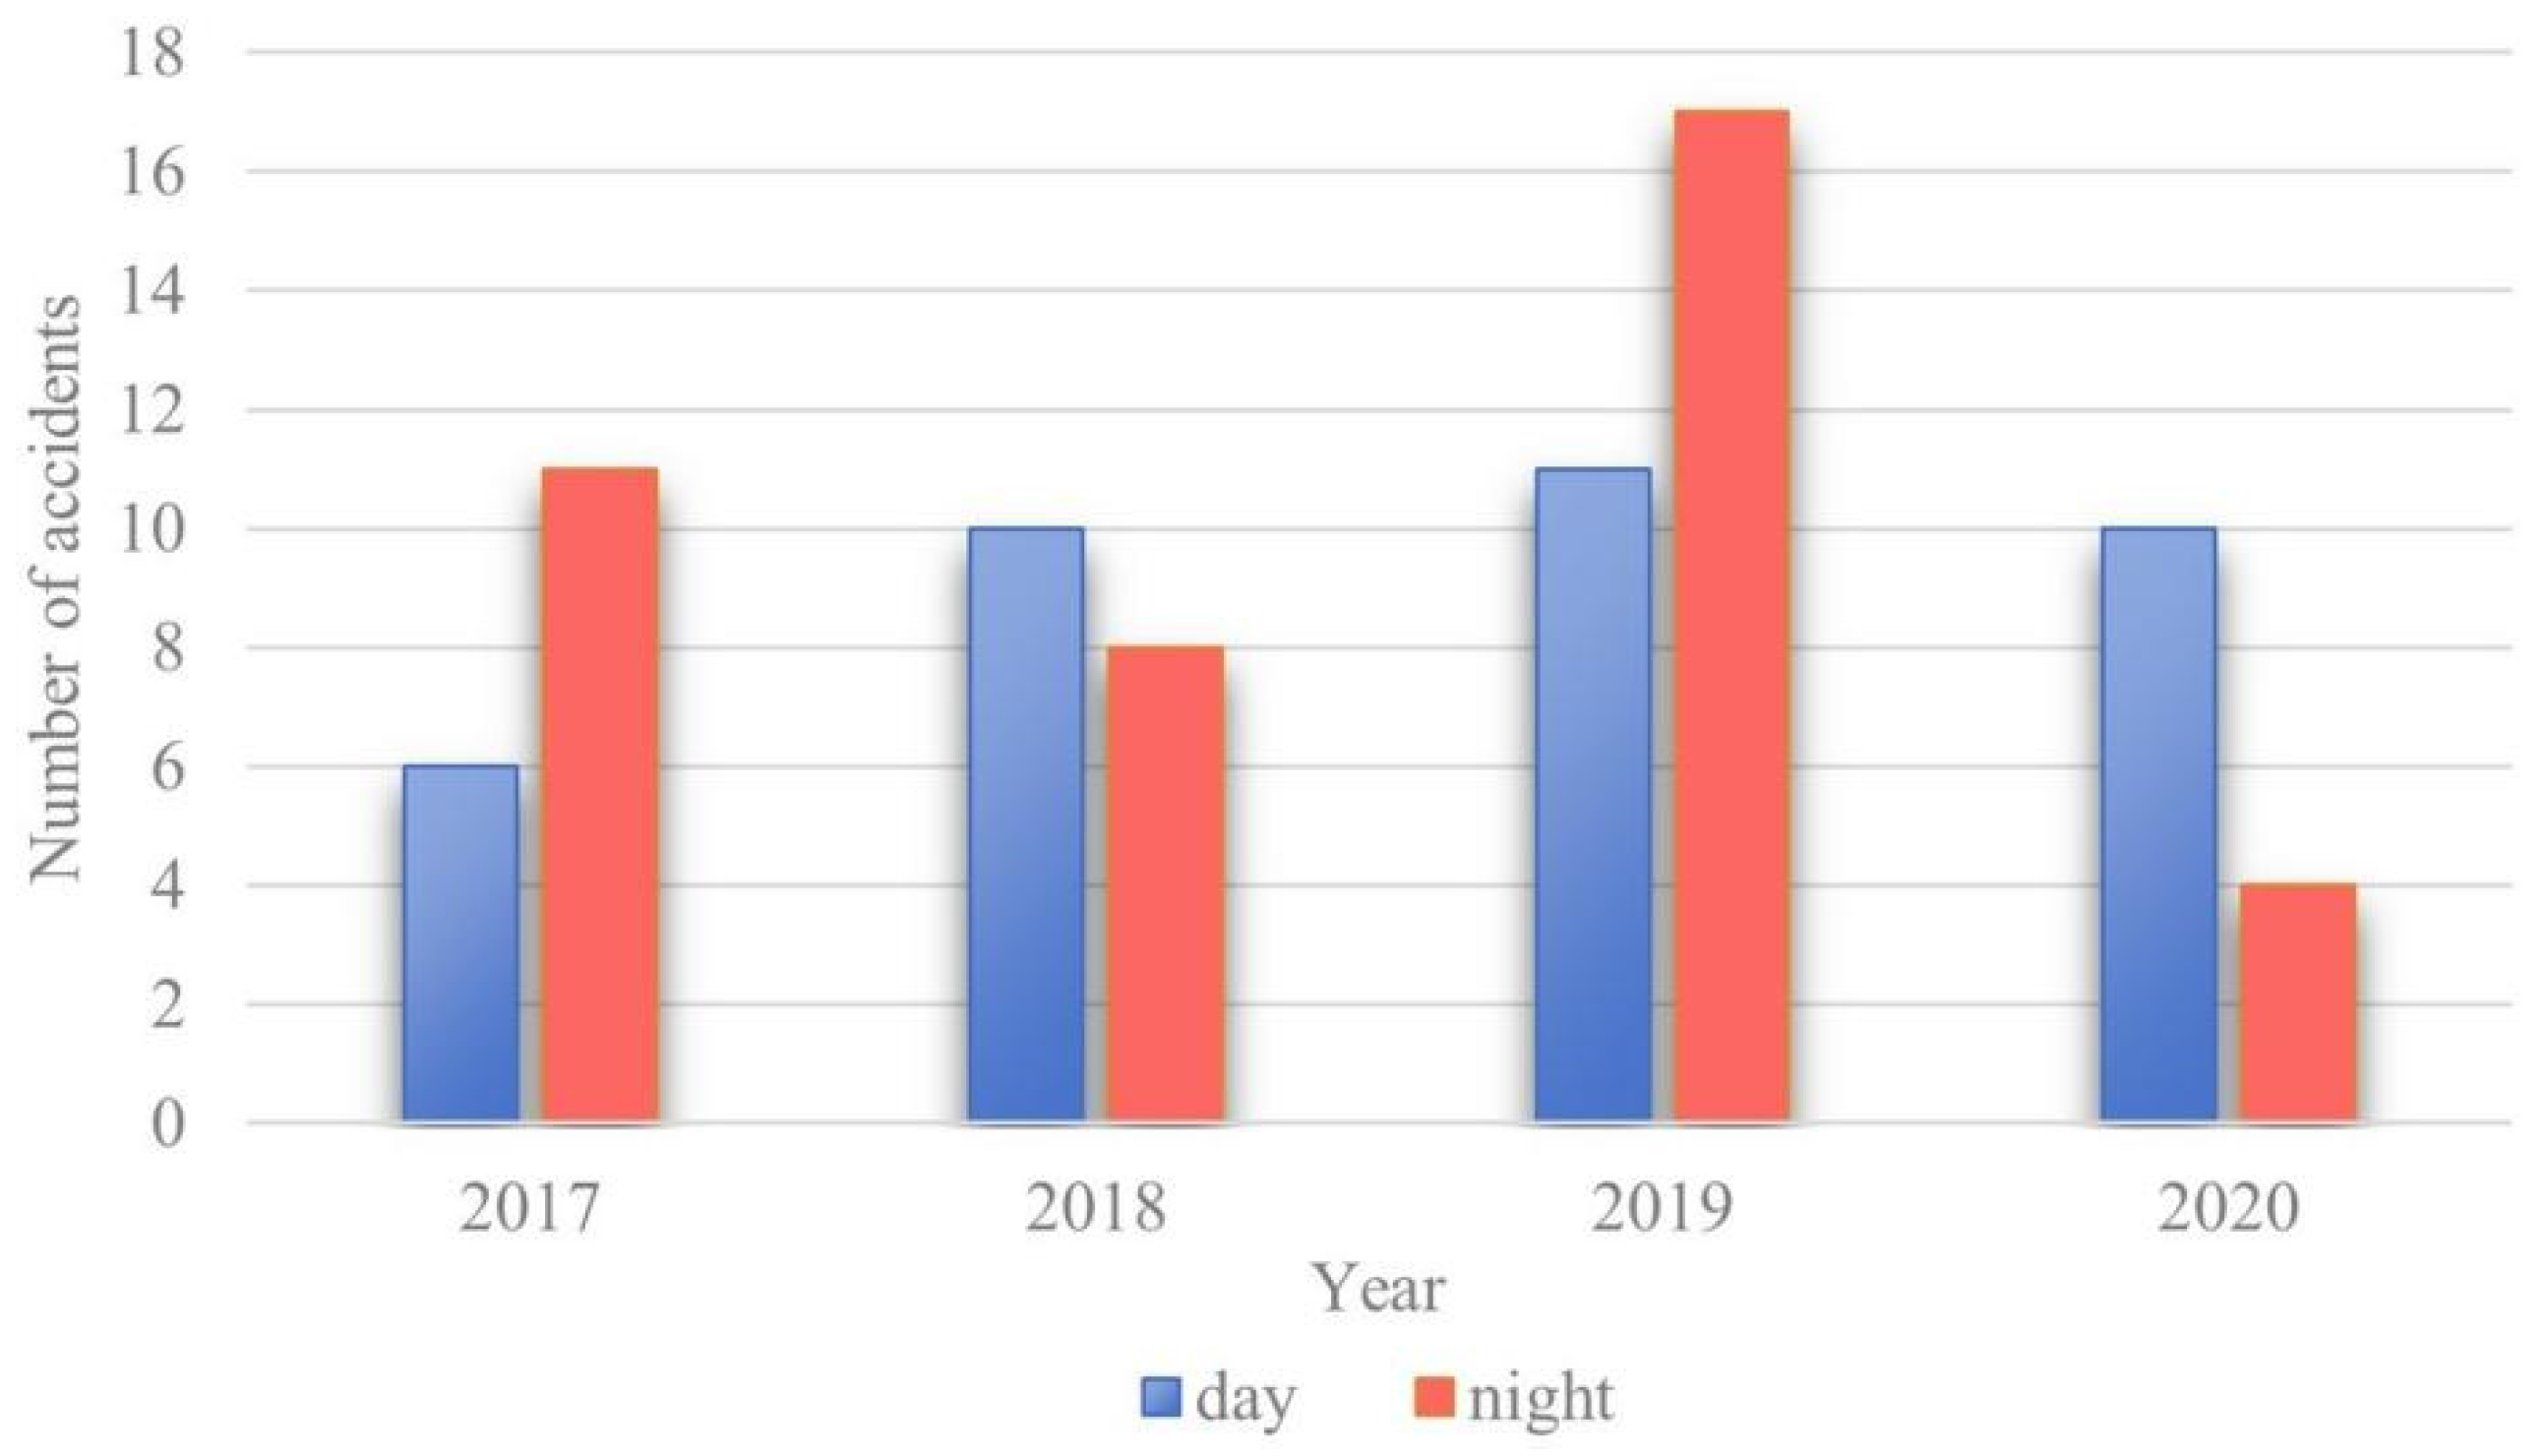
Over the most recent five years, the Chongqing Maritime Safety Administration has reported 70 accidents, with daylight incidents in 38 and nocturnal incidents in 32 incidents, the difference being marginal. However, given the higher volume of daytime maritime traffic, the data suggest a heightened risk of ship traffic accidents during the night (See
Figure 5).
- (2)
Typical section of the middle Yangtze River
Due to the absence of specific accident data for the middle Yangtze River navigational segments, this study synthesizes accident reports available on the official website of the Changjiang Maritime Safety Administration to analyze incidents in this area, as illustrated in
Figure 6.
An analysis of the distribution of accident types indicates that in contrast to the upstream channels where reef-striking incidents predominate, both collisions and groundings are significant risks in the middle reaches of the Yangtze River. Specifically, the Jingjiang waterways in the middle reaches, which have always been a focus for the Yangtze River’s mainline regulation, present unique challenges. These waterways are inherently narrow with shallow beds and inadequate depth, creating a high risk of grounding for fully laden vessels with deeper drafts.
- (3)
Typical section of the lower Yangtze River
The distribution of major accident types in this segment from 2017 to 2020 is shown in
Figure 7.
Considering the specific types of incidents, collisions remain the predominant accident type in the downstream segments, consistently representing the highest proportion in the annual reported accident data. Despite the downstream channels’ superior navigational conditions and larger scale compared to the upper and middle reaches of the Yangtze River, the significantly higher vessel traffic volume objectively increases the likelihood of collision incidents. Furthermore, incidents of grounding and self-sinking also occur from time to time, reflecting the complexity of risk factors in the lower Yangtze River.
Beyond the conventional distribution of accident types and vessel categories, there is a discernible difference in the number of accidents occurring during the day versus night, as illustrated in
Figure 8.
The analysis of the data depicted in the graph reveals that when considering the sheer number of vessels involved in accidents, there is no stark contrast between daytime and nighttime incidents. However, given that the volume of vessels navigating during daylight hours significantly exceeds that at night, it can be inferred that the risks associated with nighttime navigation are substantially greater and warrant increased attention.
It is evident that the upper, middle, and lower reaches of the Yangtze River each possess distinct navigational conditions and accident characteristics. Despite variations in vessel traffic volume, the similarity in the number of accidents occurring during both day and night highlights the elevated risks associated with nocturnal navigation. Moreover, in April and May, when seasonal rainfall causes significant water level fluctuations that directly impact navigational safety, there is a particular concentration of accidents in the middle reaches. This underscores the need for a heightened awareness of both the major risk factors specific to a given segment and the concurrent risks present across multiple segments.
4.1.2. Risk Source Screening in Vessel Traffic Accidents along the Yangtze River Mainline
Risk sources refer to potential safety hazards that could lead to risks or accidents, with a causal relationship between risk sources and accidents. Risk sources, which fluctuate and change, have a direct impact on the formation of accidents. Compared to the commonly mentioned risk factors, risk sources have a broader scope; a single risk source may encompass multiple risk factors.
By analyzing the statistics on the causes of ship accidents by the Changjiang Maritime Safety Administration, it is found that the maritime authorities have categorized the causes into 11 risk sources, as shown in
Table 8.
The 11 risk sources encompass the maritime administration’s unified classification of accident risk factors. For instance, improper operation includes inadequate emergency response, incorrect navigation practices, failure to use safe navigation speeds, and inappropriate following distances. Poor visibility encompasses conditions such as heavy rain, snow, and fog.
Building upon this foundation and after reviewing research on inland waterway navigation safety, it is found that most risk source classifications are based on the four aspects of humans, vessels, the environment, and management. Drawing on recent studies, similar risk source descriptions have been revised and standardized. For example, issues like a low educational level of a crew, poor training rates, and lack of compliance are unified under “low quality of crew”; insufficient channel width and narrow maintenance width are categorized as “insufficient channel width surplus”; visibility issues caused by heavy snow, fog, or rain are modified to “adverse weather”; and sudden mountain torrents, extreme drought, and extreme heat are collectively termed “natural disasters (landslides, earthquakes, extreme hydrological conditions, etc.)”. To facilitate risk source selection using expert experience, 16 relatively important risk sources that coexist in inland waterways are identified, creating a preliminary risk inventory. Additionally, it is necessary to compare and analyze the characteristics of different sections of the Yangtze River to select significant risk sources with segment-specific features.
Conventionally, channel width and carrying capacity are positively correlated with the size of transiting vessels, and both are inseparable from navigational safety. The wider the channel, the lower the probability of vessel collisions. The deeper the maintained depth, the lower the risk of vessels running aground due to contact with debris on the riverbed. For the entire Yangtze River mainline, the Yangtze River Navigation Administration maintains different width and depth standards for different segments. Considering the accident data, collisions and groundings account for the majority of recent vessel traffic accidents in the middle Yangtze River. Effective improvements in channel width and depth surplus could significantly enhance navigational safety. Therefore, “insufficient channel width surplus” and “insufficient channel depth surplus” are added to the risk inventory. The channel surplus width and depth can be represented as channel maintenance width/vessel actual width and channel maintenance depth/vessel actual draft, respectively.
The downstream Yangtze River channels are broad, with superior navigation conditions. However, due to their location in economically developed areas and rapid economic growth, the demand for shipping in riverside cities has greatly increased [
23], resulting in higher vessel traffic flow than the middle and upper reaches. This is the primary reason why, despite excellent channel conditions, collisions still constitute the largest proportion of accidents in the downstream Yangtze River. Consequently, “high vessel traffic density” is included in the risk inventory, culminating in a final list of 19 risk sources, as shown in
Table 9.
4.2. Data Collection
This study invited three experts each from the upper, middle, and lower reaches of the Yangtze River mainline, totaling nine experts, covering multiple fields such as traffic safety, traffic economy, and waterway engineering. Considering that these experts all have rich experience (with more than ten years in the field), their opinions are given equal weight. These experts from various fields will assess the different risk sources for each segment of the waterway based on their own experience, the actual conditions of the waterway, and associated uncertainties. Taking the risk source “S1 Crew personality and psychological defects” in a typical segment of the upper Yangtze River as an example, the three interviewed experts provided assessment results from six aspects, namely PR, V, PA, T, H, and C, as shown in
Table 10.
4.3. Risk Assessment and Identification of Key Risk Sources in Typical Segments of the Yangtze River
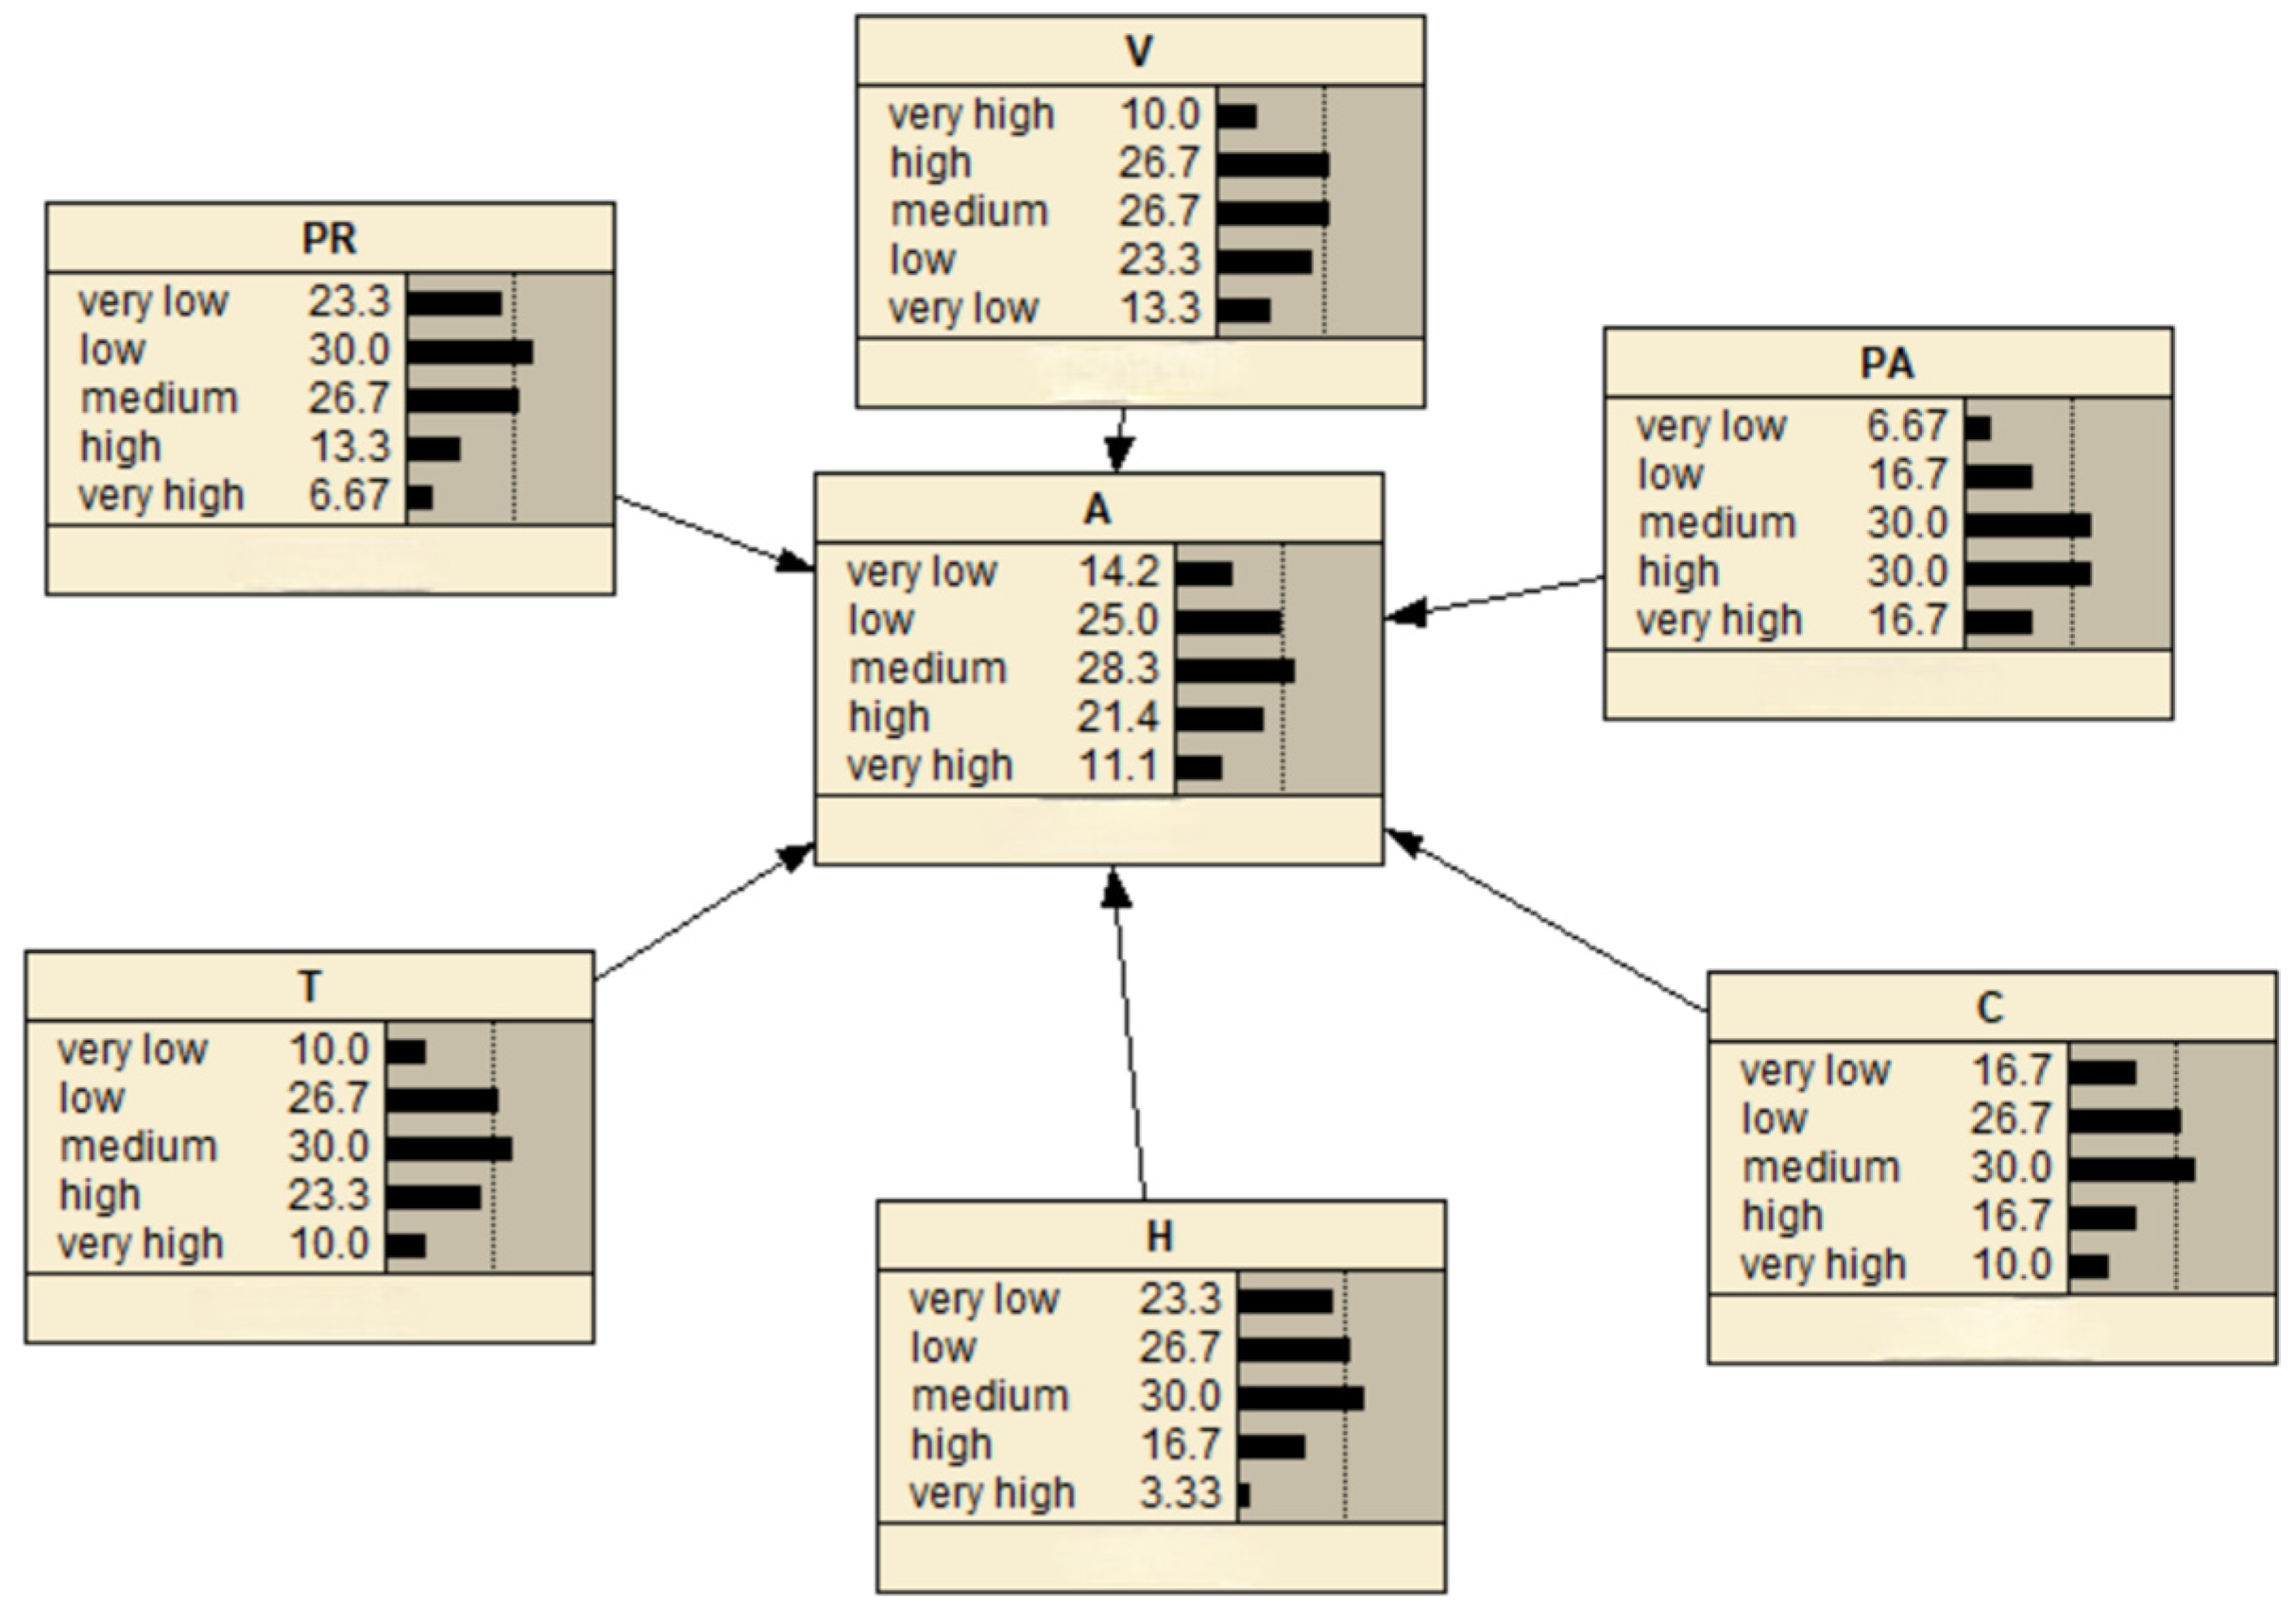
Based on the experts’ ratings and using Equation (9), belief values can be converted into prior probabilities to facilitate risk inference. Modeling is performed using the Bayesian software Netica 6.08, which enhances visibility and also facilitates calculations, as shown in
Figure 9. The results showed that in the upper Yangtze River segment, the belief value for S1 crew personality and psychological defects is 14.17% in a very low-risk state, 25% in a low-risk state, 28.33% in a medium-risk state, 21.39% in a high-risk state, and 11.11% in a very high-risk state. Subsequently, using Equation (11), it can be calculated that Rp(S5) = 0.475694.
Adopting the described approach allows for the modeling of the performance of 19 risk sources across the upper, middle, and lower reaches of the Yangtze River, resulting in the distribution of each risk source’s p(Rf). Upon obtaining the distribution results of the risk probabilities for each risk source in the upper Yangtze River segment, Formula (11) can be applied to calculate the corresponding risk values. The calculated risk values, Rp, are presented in
Table 11.
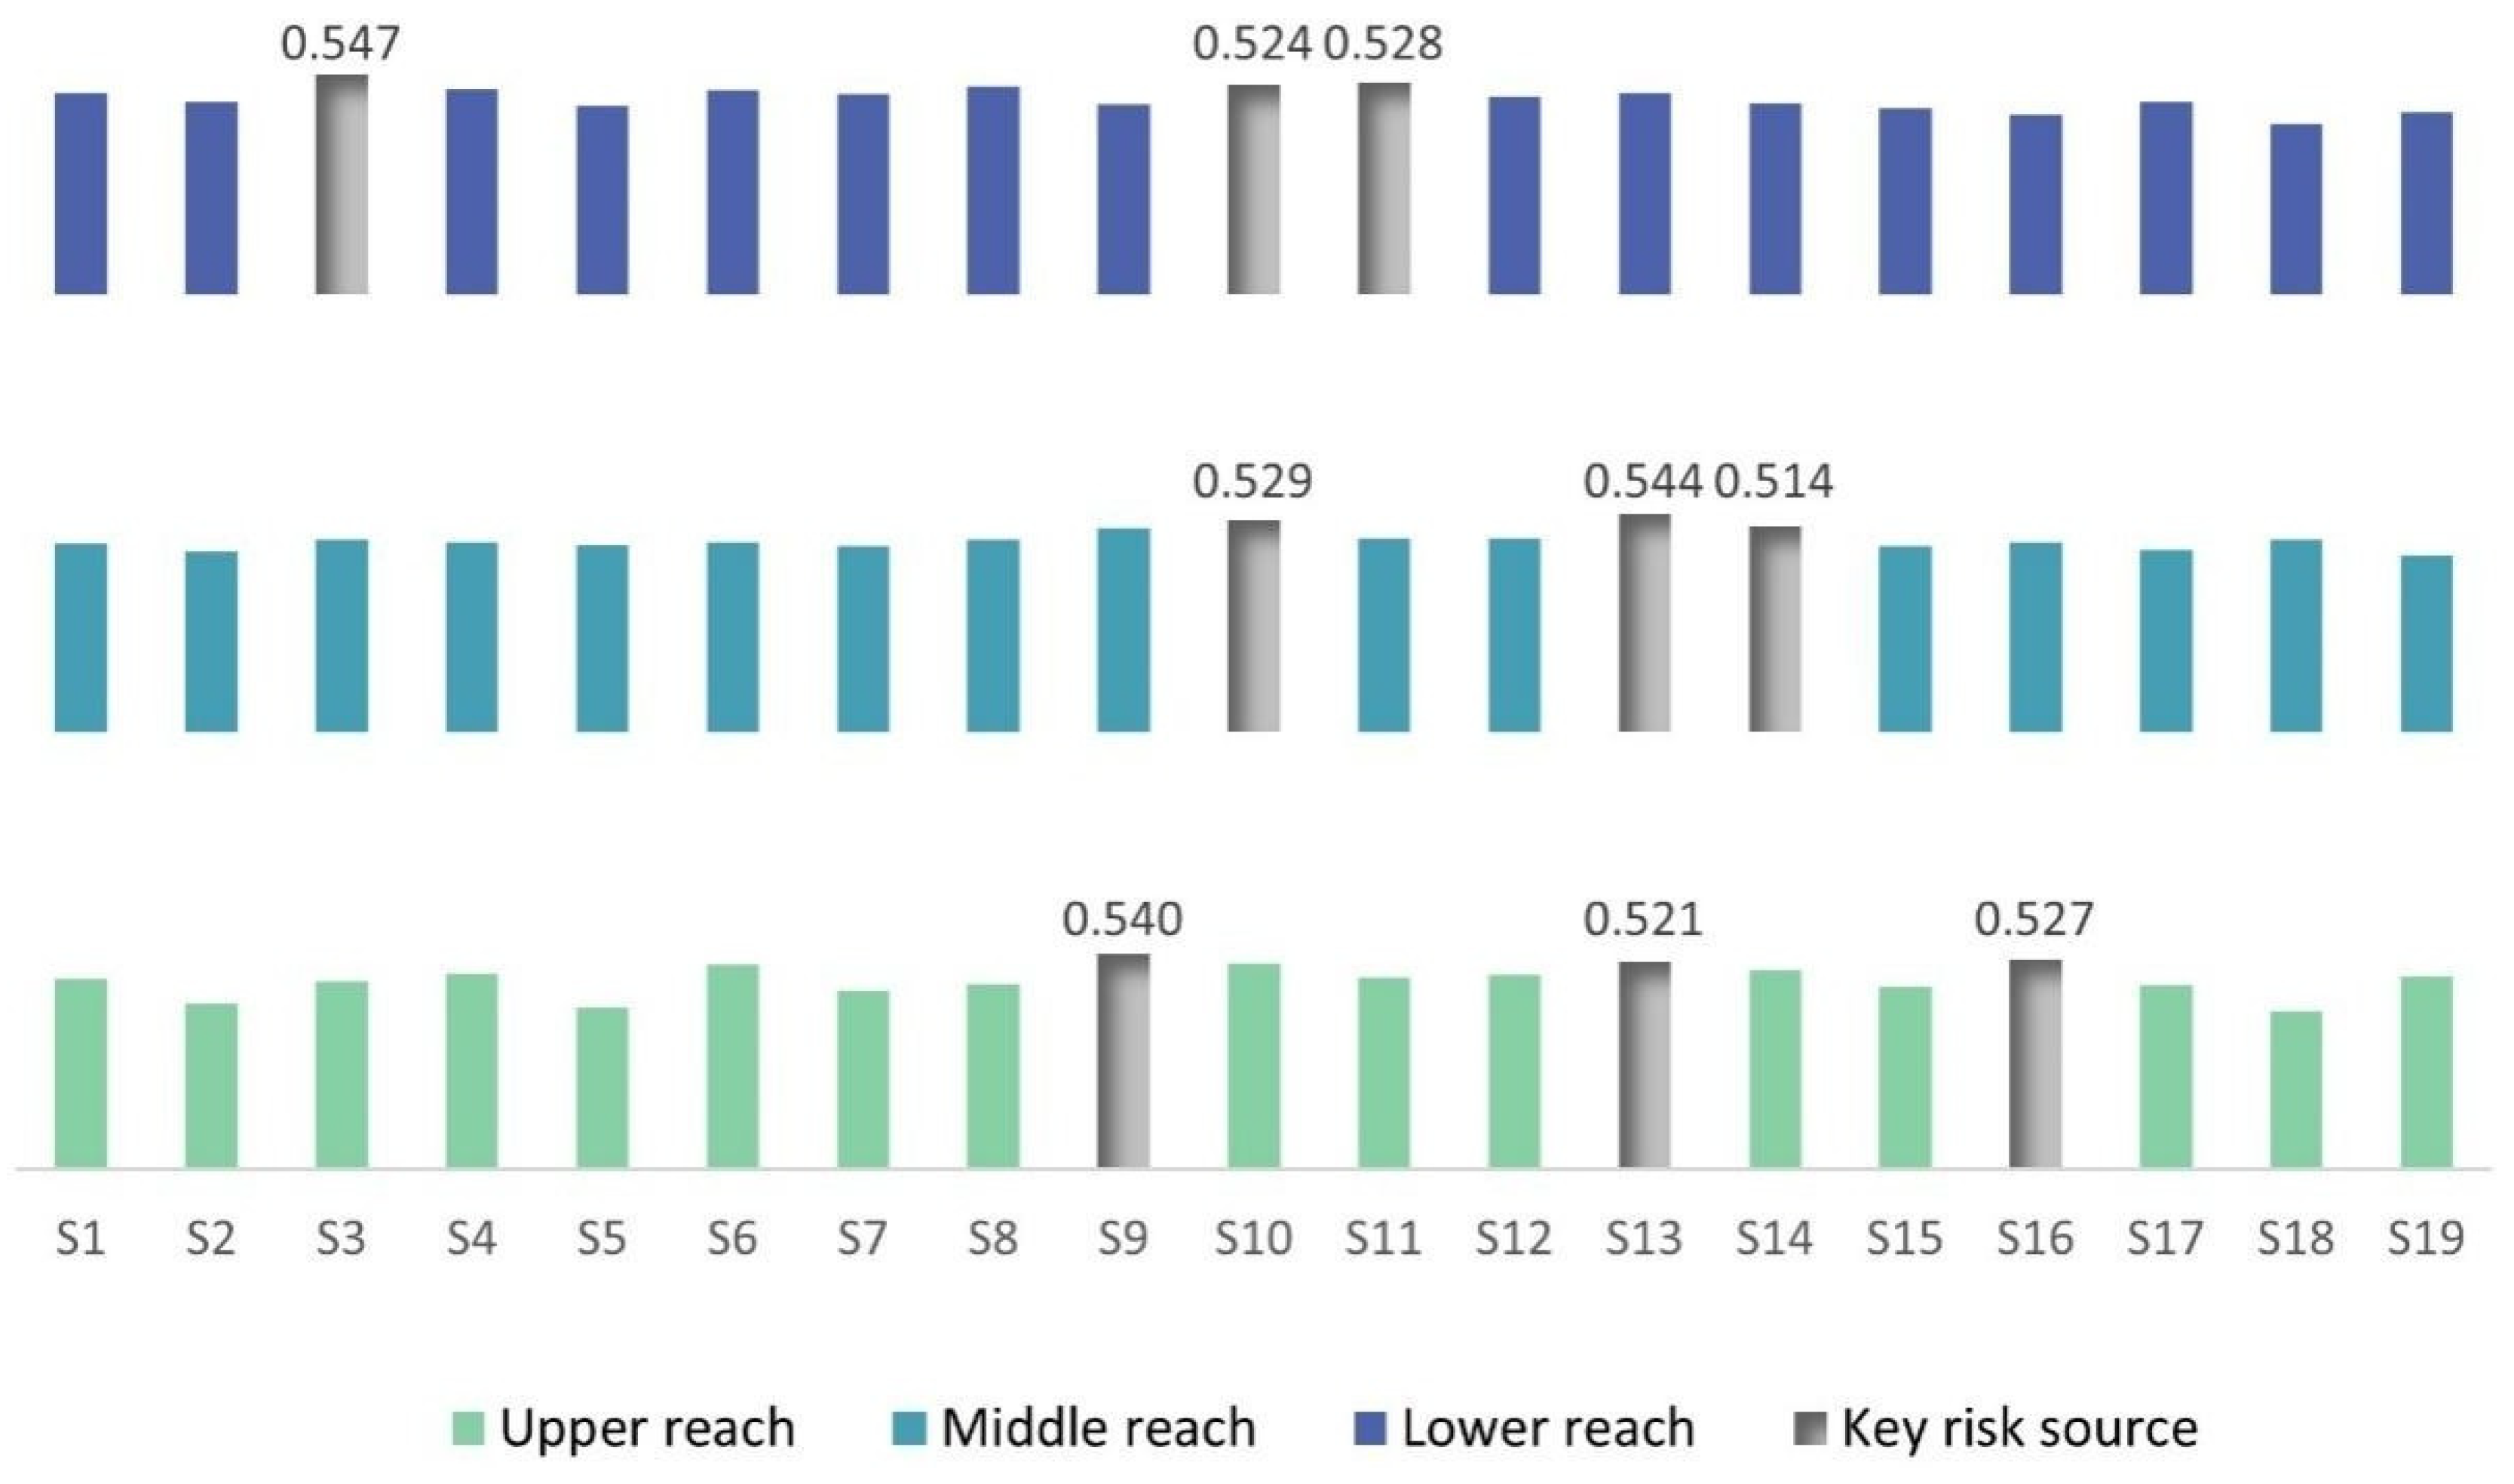
Selecting the top three risk sources by risk value rankings for each segment as the key risk sources, an analysis and assessment of the navigational risks on the Yangtze River were conducted. This revealed both common and segment-specific risks affecting the safety conditions of the Yangtze River, with the key risk sources depicted in
Figure 10. Natural disasters such as landslides, earthquakes, and extreme hydrological conditions (S10) are risk factors for both the middle and lower river regions, indicating a pervasive threat that necessitates vigilant monitoring and proactive mitigation strategies. Insufficient channel width surplus (S13) has been identified as a key risk in both the upper and middle reaches, reflecting the inherent geographical constraints challenging safe navigation. In the middle reaches, insufficient channel depth surplus (S14) poses a critical risk, significantly affecting the navigational safety of deep-draft vessels. Conversely, in the downstream region, despite favorable channel conditions, high vessel traffic density (S11) presents a clear challenge, increasing the likelihood of collisions.
These findings are consistent with the characteristics of navigational accidents in typical sections of the Yangtze River, validating the effectiveness of the analytical method used and providing a foundation for targeted safety interventions and policy formulation.
5. Conclusions
In this study, a novel model for the quantitative evaluation of inland waterway navigation risk under high uncertainty has been established, integrating fuzzy inference with a Bayesian network. The proposed model is further demonstrated in a real case study through a comparative analysis of the risk level of the upper, middle, and lower reaches of China’s Yangtze River mainline. Ship accident data and maritime policies are collected and processed to propose typical sources of risk for inland waterway shipping from the four dimensions of humans, vessels, the environment, and management. The risk inventory was further supplemented according to the safety characteristics of each segment, resulting in 19 final risk sources. The results indicate that the three most important risk sources in the upper, middle, and lower reaches of the Yangtze River are, respectively, adverse weather, the improper management of affiliated vessels, and insufficient channel width surplus in the upper reaches; insufficient channel width surplus, natural disasters (landslides, earthquakes, extreme hydrological conditions, etc.), and insufficient channel width surplus in the middle reaches; and a low quality of crews, high vessel traffic density, and natural disasters (landslides, earthquakes, extreme hydrological conditions, etc.) in the lower reaches.
Based on these findings, some insights can be provided for maritime authorities to prevent and control inland vessel traffic accidents. For example, to reduce the accident rate of vessels in the upper reaches, measures could include implementing improved information broadcasting platforms (climate–hydrology module), improving training and examination, regularly assessing the navigational skills of various company crews, and enhancing information broadcasting platforms (real-time monitoring module). In the middle reaches, risk sources could be addressed by restricting large vessel navigation in key segments, improving information broadcasting platforms (climate–hydrology module), and removing shallow banks. In the downstream reaches, feasible measures include strengthening the diversion channelization, restricting small vessel navigation during high traffic periods in key segments, and regular and irregular inspections by management authorities of vessel management companies.
To overcome the limitations of the current study, consideration could be given to analyzing the interrelationships between various risk sources, as it is challenging to ensure absolute independence among them, which could also improve the accuracy of the model. Additionally, a more detailed analysis of specific measures could be conducted, such as the applicability to different segments, with separate assessments based on the distinct characteristics of the upper, middle, and lower reaches. This could further clarify the risk control entities, enabling precise measures to enhance navigational safety.
Author Contributions
Conceptualization, Z.Y. and Y.C.; Methodology, Z.Y., Y.C. and C.W.; Software, Z.Y.; Validation, Y.C., T.W. and B.Z.; Formal analysis, Y.C. and T.W.; Investigation, T.W., B.T. and H.Z.; Resources, T.W. and B.T.; Data curation, T.W. and B.T.; Writing—original draft, B.Z.; Writing—review & editing, C.W. and B.Z.; Visualization, Z.Y.; Supervision, Y.C. and C.W.; Project administration, H.Z.; Funding acquisition, H.Z. All authors have read and agreed to the published version of the manuscript.
Funding
This research was supported by the National Key R&D Program of China (2023YFC3107900), the Fundamental Research Funds for the Central Universities (WUT: 104972024RSCrc0008, 2023IVB079), the Wuhan Pilot Construction of A Strong Transportation Country Science and Technology Joint Research Projects (NO. 2023-1-2), and the National Natural Science Foundation of China (51909202).
Institutional Review Board Statement
Not applicable.
Informed Consent Statement
Not applicable.
Data Availability Statement
The data that support the findings of this study are available from the corresponding author upon reasonable request.
Conflicts of Interest
Author Tao Wang was employed by the Chongqing Maritime Safety Administration of the People’s Republic of China. Author Baiyuan Tang was employed by the Wuhu Maritime Safety Administration of the People’s Republic of China. The remaining authors declare that the research was conducted in the absence of any commercial or financial relationships that could be construed as a potential conflict of interest.
References
- Wang, Z.Y.; Wu, Y.; Chu, X.M.; Liu, C.G.; Zheng, M. Risk Identification Method for Ship Navigation in the Complex Waterways via Consideration of Ship Domain. J. Mar. Sci. Eng. 2023, 11, 2265. [Google Scholar] [CrossRef]
- Kaplan, S.M.; Garrick, B.J. On The Quantitative Definition of Risk. Risk Anal. 1981, 1, 11–27. [Google Scholar] [CrossRef]
- Goerlandt, F.; Montewka, J. Maritime transportation risk analysis: Review and analysis in light of some foundational issues. Reliab. Eng. Syst. Saf. 2015, 138, 115–134. [Google Scholar] [CrossRef]
- Mazaheri, A.; Montewka, J.; Kujala, P. Modeling the risk of ship grounding—A literature review from a risk management perspective. WMU J. Marit. Aff. 2013, 13, 269–297. Available online: https://tigerprints.clemson.edu/all_dissertations/1141 (accessed on 2 May 2023). [CrossRef]
- Goerlandt, F.; Kujala, P. On the reliability and validity of ship-ship collision risk analysis in light of different perspectives on risk. Saf. Sci. 2014, 62, 348–365. [Google Scholar] [CrossRef]
- Chang, C.-H.; Xu, J.; Song, D.-P. An analysis of safety and security risks in container shipping operations: A case study of Taiwan. Saf. Sci. 2014, 63, 168–178. [Google Scholar] [CrossRef]
- Wang, K.; Wang, T.; Wu, B.; Yan, X. Trends and prospects of marine navigation and safety of sea transportation from TansNav 2017 conference. J. Transp. Inf. Saf. 2017, 35, 1–11. (In Chinese) [Google Scholar] [CrossRef]
- Yang, Z.L.; Bonsall, S.; Wang, J. Fuzzy rule-based Bayesian reasoning approach for prioritization of failures in FMEA. IEEE Trans. Reliab. 2008, 57, 517–528. [Google Scholar] [CrossRef]
- Wu, B.; Yan, X.; Wang, Y.; Soares, C.G. An Evidential Reasoning-Based CREAM to Human Reliability Analysis in Maritime Accident Process. Risk Anal. 2017, 37, 1936–1957. [Google Scholar] [CrossRef]
- Kandel, R.; Baroud, H. A data-driven risk assessment of Arctic maritime incidents: Using machine learning to predict incident types and identify risk factors. Reliab. Eng. Syst. Saf. 2024, 243, 109779. [Google Scholar] [CrossRef]
- Ma, Q.D.; Wang, Z.S.; Zhou, T.Q.; Liu, Z. Robust optimization method of emergency resource allocation for risk management in inland waterways. Brodogradnja 2024, 75, 75103. [Google Scholar] [CrossRef]
- Sun, Y.; Ling, J.; Chen, X.; Kong, F.; Hu, Q.; Biancardo, S.A. Exploring Maritime Search and Rescue Resource Allocation via an Enhanced Particle Swarm Optimization Method. J. Mar. Sci. Eng. 2022, 10, 906. [Google Scholar] [CrossRef]
- Ma, L.H.; Ma, X.X.; Wang, T.; Chen, L.G.; Lan, H. On the development and measurement of human factors complex network for maritime accidents: A case of ship groundings. Ocean Coast. Manag. 2024, 248, 106954. [Google Scholar] [CrossRef]
- Shi, K.; Fan, S.Q.; Weng, J.X.; Yang, Z.L. Seafarer competency analysis: Data-driven model in restricted waters using Bayesian networks. Ocean Eng. 2024, 311, 119001. [Google Scholar] [CrossRef]
- Zhou, K.W.; Xing, W.B.; Wang, J.B.; Li, H.H.; Yang, Z.L. A data-driven risk model for maritime casualty analysis: A global perspective. Reliab. Eng. Syst. Saf. 2024, 244, 109925. [Google Scholar] [CrossRef]
- Xia, G.Q.; Wang, X.J.; Feng, Y.W.; Cao, Y.H.; Dai, Z.C.; Wang, H.X.; Liu, Z.J. Navigational Risk of Inland Water Transportation: A Case Study in the Songhua River, China. ASCE-ASME J. Risk Uncertain. Eng. Syst. Part A Civ. Eng. 2023, 9, 04023042. [Google Scholar] [CrossRef]
- Zhang, J.F.; He, A.X.; Fan, C.L.; Yan, X.P.; Soares, C.G. Quantitative Analysis on Risk Influencing Factors in the Jiangsu Segment of the Yangtze River. Risk Anal. 2021, 41, 1560–1578. [Google Scholar] [CrossRef]
- Mou, J.M.; Chen, P.F.; He, Y.X.; Yip, T.L.; Li, W.H.; Tang, J.; Zhang, H.Z. Vessel traffic safety in busy waterways: A case study of accidents in western Shenzhen port. Accid. Anal. Prev. 2019, 123, 461–468. [Google Scholar] [CrossRef]
- Huang, X.; Wen, Y.; Zhang, F.; Sui, Z.; Cheng, X. A Comprehensive Risk Assessment Framework for Inland Waterway Transportation of Dangerous Goods. J. Mar. Sci. Eng. 2021, 9, 858. [Google Scholar] [CrossRef]
- Pristrom, S.; Yang, Z.L.; Wang, J.; Yan, X.P. A novel flexible model for piracy and robbery assessment of merchant ship operations. Reliab. Eng. Syst. Saf. 2016, 155, 196–211. [Google Scholar] [CrossRef]
- Zhang, D.; Yao, H.J.; Wan, C.P.; Liang, Z.; Zhang, M.Y. On the inland river navigation-safety assessment approach based on the fuzzy evidence reasoning approach. J. Saf. Environ. 2018, 18, 6. (In Chinese) [Google Scholar] [CrossRef]
- Kujala, P.; Hänninen, M.; Arola, T.; Ylitalo, J. Analysis of the marine traffic safety in the Gulf of Finland. Reliab. Eng. Syst. Saf. 2009, 94, 1349–1357. [Google Scholar] [CrossRef]
- Notteboom, T.; Yang, D.; Xu, H. Container barge network development in inland rivers: A comparison between the Yangtze River and the Rhine River. Transp. Res. Part A Policy Pract. 2020, 132, 587–605. [Google Scholar] [CrossRef]
- Zhou, R. Research on Risk Identification and Evaluation of ChongQing Waterage. Master’s Thesis, Chongqing Jiaotong University, Chongqing, China, 2020. [Google Scholar] [CrossRef]
- Shi, J. Research on Quality Evaluation of Crew of Dangerous. Master’s Thesis, Wuhan University of Technology, Wuhan, China, 2019. [Google Scholar] [CrossRef]
- Wang, Z.; Yin, J. Risk assessment of inland waterborne transportation using data mining. Marit. Policy Manag. 2020, 47, 633–648. [Google Scholar] [CrossRef]
- Pu, Y.Y. The Index System Design of Inland Shipping Safety Index Based on the Rough Sets. Master’s Thesis, Wuhan University of Technology, Wuhan, China, 2017. [Google Scholar]
- Gao, B. Assessment and Meliorative Counter Measure on the Safety Situation of the Navigation Environment in Chongqing Section of the Yangtze River. Master’s Thesis, Chongqing Jiaotong University, Chongqing, China, 2018. [Google Scholar]
- Chen, S.Z.; Wu, L.; Xie, C.; Zhou, L.; Wang, R.; Liu, Z.; Zhu, Q.L.; Zhu, L.Z. Risk Evaluation of Navigation Environment Based on Dynamic Weight Model and Its Application. J. Mar. Sci. Eng. 2022, 10, 770. [Google Scholar] [CrossRef]
- Han, D.D. Coupling Risk of Water Transport Safety. Master’s Thesis, Wuhan University of Technology, Wuhan, China, 2017. [Google Scholar]
- Zhang, G.M.; Zhang, H. Research on the risk of inland water transport safety. China Marit. Saf. 2019, 12, 22–24. [Google Scholar] [CrossRef]
Figure 1.
Flowchart of the research.
Figure 1.
Flowchart of the research.
Figure 2.
Hierarchy of evaluation indicators.
Figure 2.
Hierarchy of evaluation indicators.
Figure 3.
Location of the Yangtze River mainline.
Figure 3.
Location of the Yangtze River mainline.
Figure 4.
Distribution of accident types reported by the Chongqing Maritime Safety Administration.
Figure 4.
Distribution of accident types reported by the Chongqing Maritime Safety Administration.
Figure 5.
Day/night distribution of accidents reported by the Chongqing Maritime Safety Administration.
Figure 5.
Day/night distribution of accidents reported by the Chongqing Maritime Safety Administration.
Figure 6.
Distribution of accident types in the middle Yangtze River.
Figure 6.
Distribution of accident types in the middle Yangtze River.
Figure 7.
Distribution of accident types reported by the Wuhu Maritime Safety Administration.
Figure 7.
Distribution of accident types reported by the Wuhu Maritime Safety Administration.
Figure 8.
Day/night distribution of accidents reported by the Wuhu Maritime Safety Administration.
Figure 8.
Day/night distribution of accidents reported by the Wuhu Maritime Safety Administration.
Figure 9.
Risk assessment of the S1.
Figure 9.
Risk assessment of the S1.
Figure 10.
Comparison of key risk sources for typical navigation sections in the upper, middle, and lower Yangtze River.
Figure 10.
Comparison of key risk sources for typical navigation sections in the upper, middle, and lower Yangtze River.
Table 1.
Explanation of PR.
Table 1.
Explanation of PR.
| PR | Description | Representation |
|---|
| Very low | The probability of this risk source occurring is virtually non-existent. | PR1 |
| Low | The probability of this risk occurring is low. | PR2 |
| Medium | There is a certain possibility of this risk source occurring. | PR3 |
| High | This risk source occurs frequently. | PR4 |
| Very high | The occurrence of this risk source is very high, constituting a normal state. | PR5 |
Table 2.
Explanation of V.
Table 2.
Explanation of V.
| V | Description | Representation |
|---|
| Very high | This risk source is very easily identified in routine management. | V1 |
| High | This risk source is relatively easy to detect in daily management. | V2 |
| Medium | This risk source is of medium detectability in routine management, requiring careful scrutiny. | V3 |
| Low | There is a certain possibility of detecting this risk source in daily management. | V4 |
| Very low | This risk source is virtually undetectable in routine management. | V5 |
Table 3.
Explanation of PA.
Table 3.
Explanation of PA.
| PA | Description | Representation |
|---|
| Very low | The association between this risk source and the occurrence of accidents is very low; under the isolated influence of this risk source, vessel traffic accidents are unlikely to occur, and it is not a direct cause of accidents. | PA1 |
| Low | The correlation between this risk source and the occurrence of accidents is low; under the isolated effect of this risk source, there is a certain possibility of vessel traffic accidents occurring. | PA2 |
| Medium | The correlation between this risk source and the occurrence of accidents is medium; under the sole influence of this risk source, vessel traffic accidents are possible. | PA3 |
| High | The correlation between this risk source and the occurrence of accidents is high; under the isolated influence of this risk source, vessel traffic accidents are likely to occur. | PA4 |
| Very high | The correlation between this risk source and the occurrence of accidents is very high; under the sole influence of this risk source, vessel traffic accidents are very likely to occur. | PA5 |
Table 4.
Explanation of T.
Table 4.
Explanation of T.
| T | Description | Representation |
|---|
| Very low | In accidents influenced by this risk source, the impact on the navigability of the waterway is minimal; incidents such as fires are likely to occur but can be promptly addressed or do not affect navigation. | T1 |
| Low | Accidents resulting from the involvement of this risk source may cause short-term congestion or impaired navigation in the segment. Commonly induced accident types, such as minor contacts, require some time to manage. | T2 |
| Medium | Under the influence of this risk source, accidents can moderately affect the navigational capacity of the waterway for a certain period. Typical accidents include contacts or minor collisions that necessitate time to resolve. | T3 |
| High | When this risk source plays a role, it can impact the navigational capacity of the channel over a long period, such as causing a temporary suspension of navigation. Likely accidents include collisions, small ship reef contacts, or groundings that demand considerable rescue efforts. | T4 |
| Very high | With this risk source’s involvement, accidents can severely affect the waterway’s navigational capacity for an extended duration, leading to prolonged interruptions in navigation. The most susceptible accident types include sinking, large vessel groundings, or reef contacts, all requiring extensive rescue times. | T5 |
Table 5.
Explanation of H.
Table 5.
Explanation of H.
| H | Description | Representation |
|---|
| Very low | Accidents resulting from this risk source are apt to cause minor injuries to fewer than three individuals. | H1 |
| Low | Accidents attributable to this risk source are apt to result in serious injuries to fewer than three persons. | H2 |
| Medium | Accidents under the influence of this risk source are apt to cause fatalities involving fewer than three individuals. | H3 |
| High | Accidents associated with this risk source are apt to result in fatalities of more than three but fewer than ten individuals. | H4 |
| Very high | Accidents induced by this risk source are apt to lead to more than ten fatalities. | H5 |
Table 6.
Explanation of C.
Table 6.
Explanation of C.
| C | Description | Representation |
|---|
| Very low | Accidents resulting from the involvement of this risk source are apt to result in direct economic losses of less than CNY 100,000. | C1 |
| Low | Accidents resulting from the involvement of this risk source are apt to incur direct economic losses ranging from over CNY 100,000 to less than CNY 1,000,000. | C2 |
| Medium | Accidents resulting from the involvement of this risk source are apt to cause direct economic losses between CNY 1,000,000 and CNY 10,000,000. | C3 |
| High | Accidents resulting from the involvement of this risk source are apt to lead to substantial direct economic losses, ranging from over CNY 10,000,000 to less than CNY 50,000,000. | C4 |
| Very high | Accidents resulting from the involvement of this risk source are apt to result in direct economic losses exceeding CNY 50,000,000. | C5 |
Table 7.
Rule base of vessel traffic accident risk assessment.
Table 7.
Rule base of vessel traffic accident risk assessment.
| Rule | | | Input (Antecedent Attributes) | | | | Output (Risk Levels) | |
|---|
| | PR | V | PA | T | H | C | Very Low | Low | Mediu m | High | Very High |
|---|
| 1 | Very Low (PR1) | Very High (V1) | Very Low (PA1) | Very Low (T1) | Very Low (H1) | Very Low (C1) | 1 | 0 | 0 | 0 | 0 |
| 2 | Very
Low (PR1) | Very
High (V1) | Very Low (PA1) | Very
Low (T1) | Very
Low (H1) | Low (C2) | 0.917 | 0.083 | 0 | 0 | 0 |
| 3 | Very
Low (PR1) | Very
High (V1) | Very Low (PA1) | Very
Low (T1) | Very
Low (H1) | Medium (C3) | 0.917 | 0 | 0.083 | 0 | 0 |
| … | | | | | | | | | | | |
| 3126 | Very High (PR5) | Very Low (V5) | Very High (PA5) | Very High (T5) | Very Low (H1) | Very High (C5) | 0.083 | 0 | 0 | 0 | 0.917 |
| 3127 | Very
High (PR5) | Very
Low (V5) | Very
High (PA5) | Very
High (T5) | Low (H2) | Very
High (C5) | 0 | 0.083 | 0 | 0 | 0.917 |
| 3128 | Very
High (PR5) | Very
Low (V5) | Very
High (PR5) | Very
High (T5) | Medium (H3) | Very
High (C5) | 0 | 0 | 0.083 | 0 | 0.917 |
| … | | | | | | | | | | | |
| 15,623 | Very High (PR5) | Very Low (V5) | Very High (PA5) | Very High (T5) | Very High (H5) | Medium (C3) | 0 | 0 | 0.083 | 0 | 0.917 |
| 15,624 | Very
High (PR5) | Very
Low (V5) | Very
High (PA5) | Very
High (T5) | Very
High (H5) | High (C4) | 0 | 0 | 0 | 0.083 | 0.917 |
| 15,625 | Very
High (PR5) | Very
Low (V5) | Very
High (PA5) | Very
High (T5) | Very
High (H5) | Very
High (C5) | 0 | 0 | 0 | 0 | 1 |
Table 8.
Classification of accident risk sources by maritime authorities.
Table 8.
Classification of accident risk sources by maritime authorities.
| Human Factors | Vessel Factors | Environmental Factors | Management Factors |
|---|
| Improper operation | Improper loading | Poor visibility | Inadequate ship management |
| Violation of navigation regulations | Vessel equipment malfunction | Turbulent water flow | Inadequate company management |
| Inadequate watch keeping | Issues with vessel quality | Water flow changes | |
| Human Risk Sources | Vessel Risk Sources | Environmental Risk Sources | Management Risk Sources |
|---|
| S1 Crew personality and psychological defects [24] | S5 Excessive vessel age [27] | S9 Adverse weather [28] | S15 Unclear internal management systems of vessels [30] |
| S2 Unreasonable age structure or physical defects of personnel [25] | S6 Improper vessel maintenance [25] | S10 Natural disasters (landslides, earthquakes, extreme hydrological conditions, etc.) [28] | S16 Improper management of affiliated vessels [26] |
S3 Low quality of
crew [26] | S7 Structural
quality issues of vessels [27] | S11 High vessel traffic density [29] | S17 Inadequate
waterway management [31] |
| S4 Insufficient crewing on vessels [24] | S8 Malfunctioning vessel equipment [26] | S12 Changes in water periods [30] | S18 Inadequate supervision by maritime authorities [31] |
| | | S13 Insufficient channel width surplus [26] | S19 Inadequate emergency rescue capabilities [25] |
| | | S14 Insufficient channel depth surplus [29] | |
Table 10.
Expert evaluation results of the S1 typical segment in the upper Yangtze River.
Table 10.
Expert evaluation results of the S1 typical segment in the upper Yangtze River.
| Risk Indicator | Expert 1 | Expert 2 | Expert 3 | Results of Belief Value |
|---|
| PR | 0.00% | 40.00% | 30.00% | 23.33% |
| 30.00% | 30.00% | 30.00% | 30.00% |
| 30.00% | 30.00% | 20.00% | 26.67% |
| 20.00% | 0.00% | 20.00% | 13.33% |
| 20.00% | 0.00% | 0.00% | 6.67% |
| V | 0.00% | 0.00% | 30.00% | 10.00% |
| 30.00% | 20.00% | 30.00% | 26.67% |
| 30.00% | 20.00% | 30.00% | 26.67% |
| 30.00% | 30.00% | 10.00% | 23.33% |
| 10.00% | 30.00% | 0.00% | 13.33% |
| PA | 0.00% | 10.00% | 10.00% | 6.67% |
| 20.00% | 10.00% | 20.00% | 16.67% |
| 30.00% | 20.00% | 40.00% | 30.00% |
| 40.00% | 30.00% | 20.00% | 30.00% |
| 10.00% | 30.00% | 10.00% | 16.67% |
| T | 20.00% | 0.00% | 10.00% | 16.67% |
| 20.00% | 20.00% | 30.00% | 26.67% |
| 30.00% | 30.00% | 30.00% | 30.00% |
| 30.00% | 30.00% | 20.00% | 23.33% |
| 0.00% | 20.00% | 10.00% | 10.00% |
| H | 40.00% | 20.00% | 10.00% | 23.33% |
| 30.00% | 20.00% | 30.00% | 26.67% |
| 20.00% | 40.00% | 30.00% | 30.00% |
| 10.00% | 20.00% | 20.00% | 16.67% |
| 0.00% | 0.00% | 10.00% | 3.33% |
| C | 30.00% | 10.00% | 10.00% | 16.67% |
| 30.00% | 20.00% | 30.00% | 26.67% |
| 20.00% | 40.00% | 30.00% | 30.00% |
| 10.00% | 20.00% | 20.00% | 16.67% |
| 10.00% | 10.00% | 10.00% | 10.00% |
Table 11.
Risk value of risk sources in the upper, middle, and lower Yangtze River.
Table 11.
Risk value of risk sources in the upper, middle, and lower Yangtze River.
| Risk Resource | Risk Value in the Upper Yangtze River | Risk Value in the Middle Yangtze River | Risk Value in the Lower Yangtze River |
|---|
| S1 | 0.4757 | 0.4708 | 0.5021 |
| S2 | 0.4167 | 0.4514 | 0.4792 |
| S3 | 0.4715 | 0.4812 | 0.5472 |
| S4 | 0.4910 | 0.4743 | 0.5125 |
| S5 | 0.4076 | 0.4681 | 0.4715 |
| S6 | 0.5139 | 0.4743 | 0.5097 |
| S7 | 0.4479 | 0.4632 | 0.5007 |
| S8 | 0.4646 | 0.4801 | 0.5181 |
| S9 | 0.5402 | 0.5104 | 0.4722 |
| S10 | 0.5146 | 0.5285 | 0.5236 |
| S11 | 0.4799 | 0.4847 | 0.5278 |
| S12 | 0.4868 | 0.4833 | 0.4931 |
| S13 | 0.5208 | 0.5438 | 0.5014 |
| S14 | 0.5014 | 0.5139 | 0.4771 |
| S15 | 0.4583 | 0.4639 | 0.4625 |
| S16 | 0.5271 | 0.4736 | 0.4486 |
| S17 | 0.4625 | 0.4542 | 0.4806 |
| S18 | 0.3972 | 0.4792 | 0.4264 |
| S19 | 0.4840 | 0.4410 | 0.4535 |
| Disclaimer/Publisher’s Note: The statements, opinions and data contained in all publications are solely those of the individual author(s) and contributor(s) and not of MDPI and/or the editor(s). MDPI and/or the editor(s) disclaim responsibility for any injury to people or property resulting from any ideas, methods, instructions or products referred to in the content. |
© 2024 by the authors. Licensee MDPI, Basel, Switzerland. This article is an open access article distributed under the terms and conditions of the Creative Commons Attribution (CC BY) license (https://creativecommons.org/licenses/by/4.0/).


 ,
, 


