Article

Regional Analysis of the Potential Distribution of Heptacodium miconioides and Its Competitor Species in China

College of Geography and Environmental Science, Northwest Normal University, 967 Anning East Road, Lanzhou 730070, China
*
Author to whom correspondence should be addressed.
Sustainability 2024, 16(2), 752; https://doi.org/10.3390/su16020752
Submission received: 1 December 2023 / Revised: 27 December 2023 / Accepted: 4 January 2024 / Published: 15 January 2024
(This article belongs to the Section Sustainability, Biodiversity and Conservation)

Abstract

:
Heptacodium miconioides is listed by the International Union for Conservation of Nature (IUCN) as a rare and endangered plant which is being subjected to competition for environmental resources by Fraxinus insularis. The impact of competing species on the dispersal of H. miconioides across time and space is unclear, which hinders our ability to effectively protect rare and endangered species. Therefore, in this study, we performed a spatial analysis of the interactions between H. miconioides and F. insularis using the Maximum Entropy model (MaxEnt) coupled with the Spatio-temporal Geographic Weighted Regression Model. The results show that: Among the 20 environmental factors selected, Precipitation in Driest Quarter (Bio17) was the primary factor affecting H. miconioides and F. insularis. An expansion of H. miconioides and F. insularis habitats will be seen in future environments compared to current environments. Under the current climatic conditions, the ecological niche overlap has a D value of 0.7261 and an I value of 0.9188, and the ecological niche overlap will increase further in future environments. The distribution of F. insularis practically covered the area suitable for H. miconioides, and the influence of F. insularis’s suitability index on H. miconioides gradually increased. The region of negative impacts has changed, with distribution in the current environment in the southern part of Shaanxi, eastern Sichuan, and northern part of Zhejiang, China, moving to the southern part of Henan, and the junction between Zhejiang and Anhui in the 2050s. Sustainability is one of the important goals in global development today, and the conservation of rare and endangered plants is one of the most important elements of sustainable development. It is not only beneficial to the survival and health of human beings, but also helps to promote the sustainable development of ecologies, economies, and societies.

Graphical Abstract

1. Introduction

Plant interspecific interactions (competition or collaboration) have important implications for species composition and structure and the maintenance of their diversity in ecosystems [1]. Competition is an important phenomenon in the growth process of terrestrial plants [2]; it is a dominant factor in the formation of a community’s structure, and an important factor in determining the evolutionary pattern of species [3]. Environmental changes and human activities can lead to a more hostile environment for plant species to survive in [4,5,6]. For endangered plants, the spatial distribution of competing species and the impact of environmental changes on their distribution patterns are directly related to a plant population’s ability to reproduce [7]. Therefore, analyzing changes in the geographic distribution patterns of endangered plants and their competing species under current and future environmental patterns, and spatially exploring the impacts of competing species on endangered plants, will contribute to the conservation and utilization of endangered species.
The Species Distribution Model (SDM) is an important modeling tool based on the ecological niche theory which is to predict the fitness zones of species under current or future climatic conditions based on the known distribution points of the species and relevant environmental factors [8,9,10]. Among the models, the Maximum Entropy Model (MaxEnt) is more widely used [11]. MaxEnt has the advantages of a low sample size requirement [12], flexible variable handling [13], good noise reduction, and high budget accuracy [14]. The Geographical and Temporally Weighted Regression (GTWR) model intuitively detects the non-stationarity of spatial relationships [15], and takes geographic location and time into account in the regression model to more accurately predict and explain the relationships between variables [16,17,18].
Heptacodium miconioides is an endemic and endangered plant in China which is perennially distributed in hilly and low mountainous areas, which are cool and foggy and have a relative humidity that is often around 90% in summer; it is mainly found in southern China, usually grows to maturity over spring and summer, can flower profusely, and reproduces by seed. H. miconioides is listed as an endangered species (EN) by the World Conservation Union (IUCN) [19]. As an excellent ornamental tree, H. miconioides is scientifically valuable for studying the phylogeny of the Caprifoliaceae Juss. Some scholars have found that the main reasons for the endangerment of plant species are the negative effects of competing species and environmental changes. The main competing species within the vicinity of H. miconioides is the F. insularis [20,21]. Fraxinus insularis likes warm and humid climates, is not strict on the soil requirements, although well-drained, humus-rich slopes and woodlands are preferable; the range of F. insularis’ distribution is wide, and it basically occupies the same areas as H. miconioides [22]. Previous studies have not explored the distribution patterns of plants and competing species in large-scale spaces. Competing species can inhibit H. miconioides’ growth space and resource utilization, leading to changes in the spatial distribution pattern of the species; F. insularis may occupy more space in a given area, while H. miconioides retreats to smaller areas. Species competition prevents us from further improving the conservation of rare and endangered species. Based on this, in our study, we applied MaxEnt to analyze the potential distribution areas of H. miconioides and its competitor species under the current environmental model and their responses to the future environmental model. The results obtained from the MaxEnt model were also coupled with the GTWR model to explore the interactions between H. miconioides and competing species in the current and future environments to better protect the survival space of the rare and endangered species, H. miconioides.

2. Materials and Methods

2.1. ENMTools

ENMTools 1.0 is used for modeling ecological niches in the environment [23]. Additional support for model optimization is provided through the use of software packages that enable the use of simplified interfaces for variable selection and visualization of correlations between predicted values [24]. The ENMTools tool can automatically match the size of the environmental factor raster used for the analysis, and can remove redundant data within the same raster instead of removing the data based on the distance method; this is fast and efficient, and the results of the analysis are more reasonable [25].

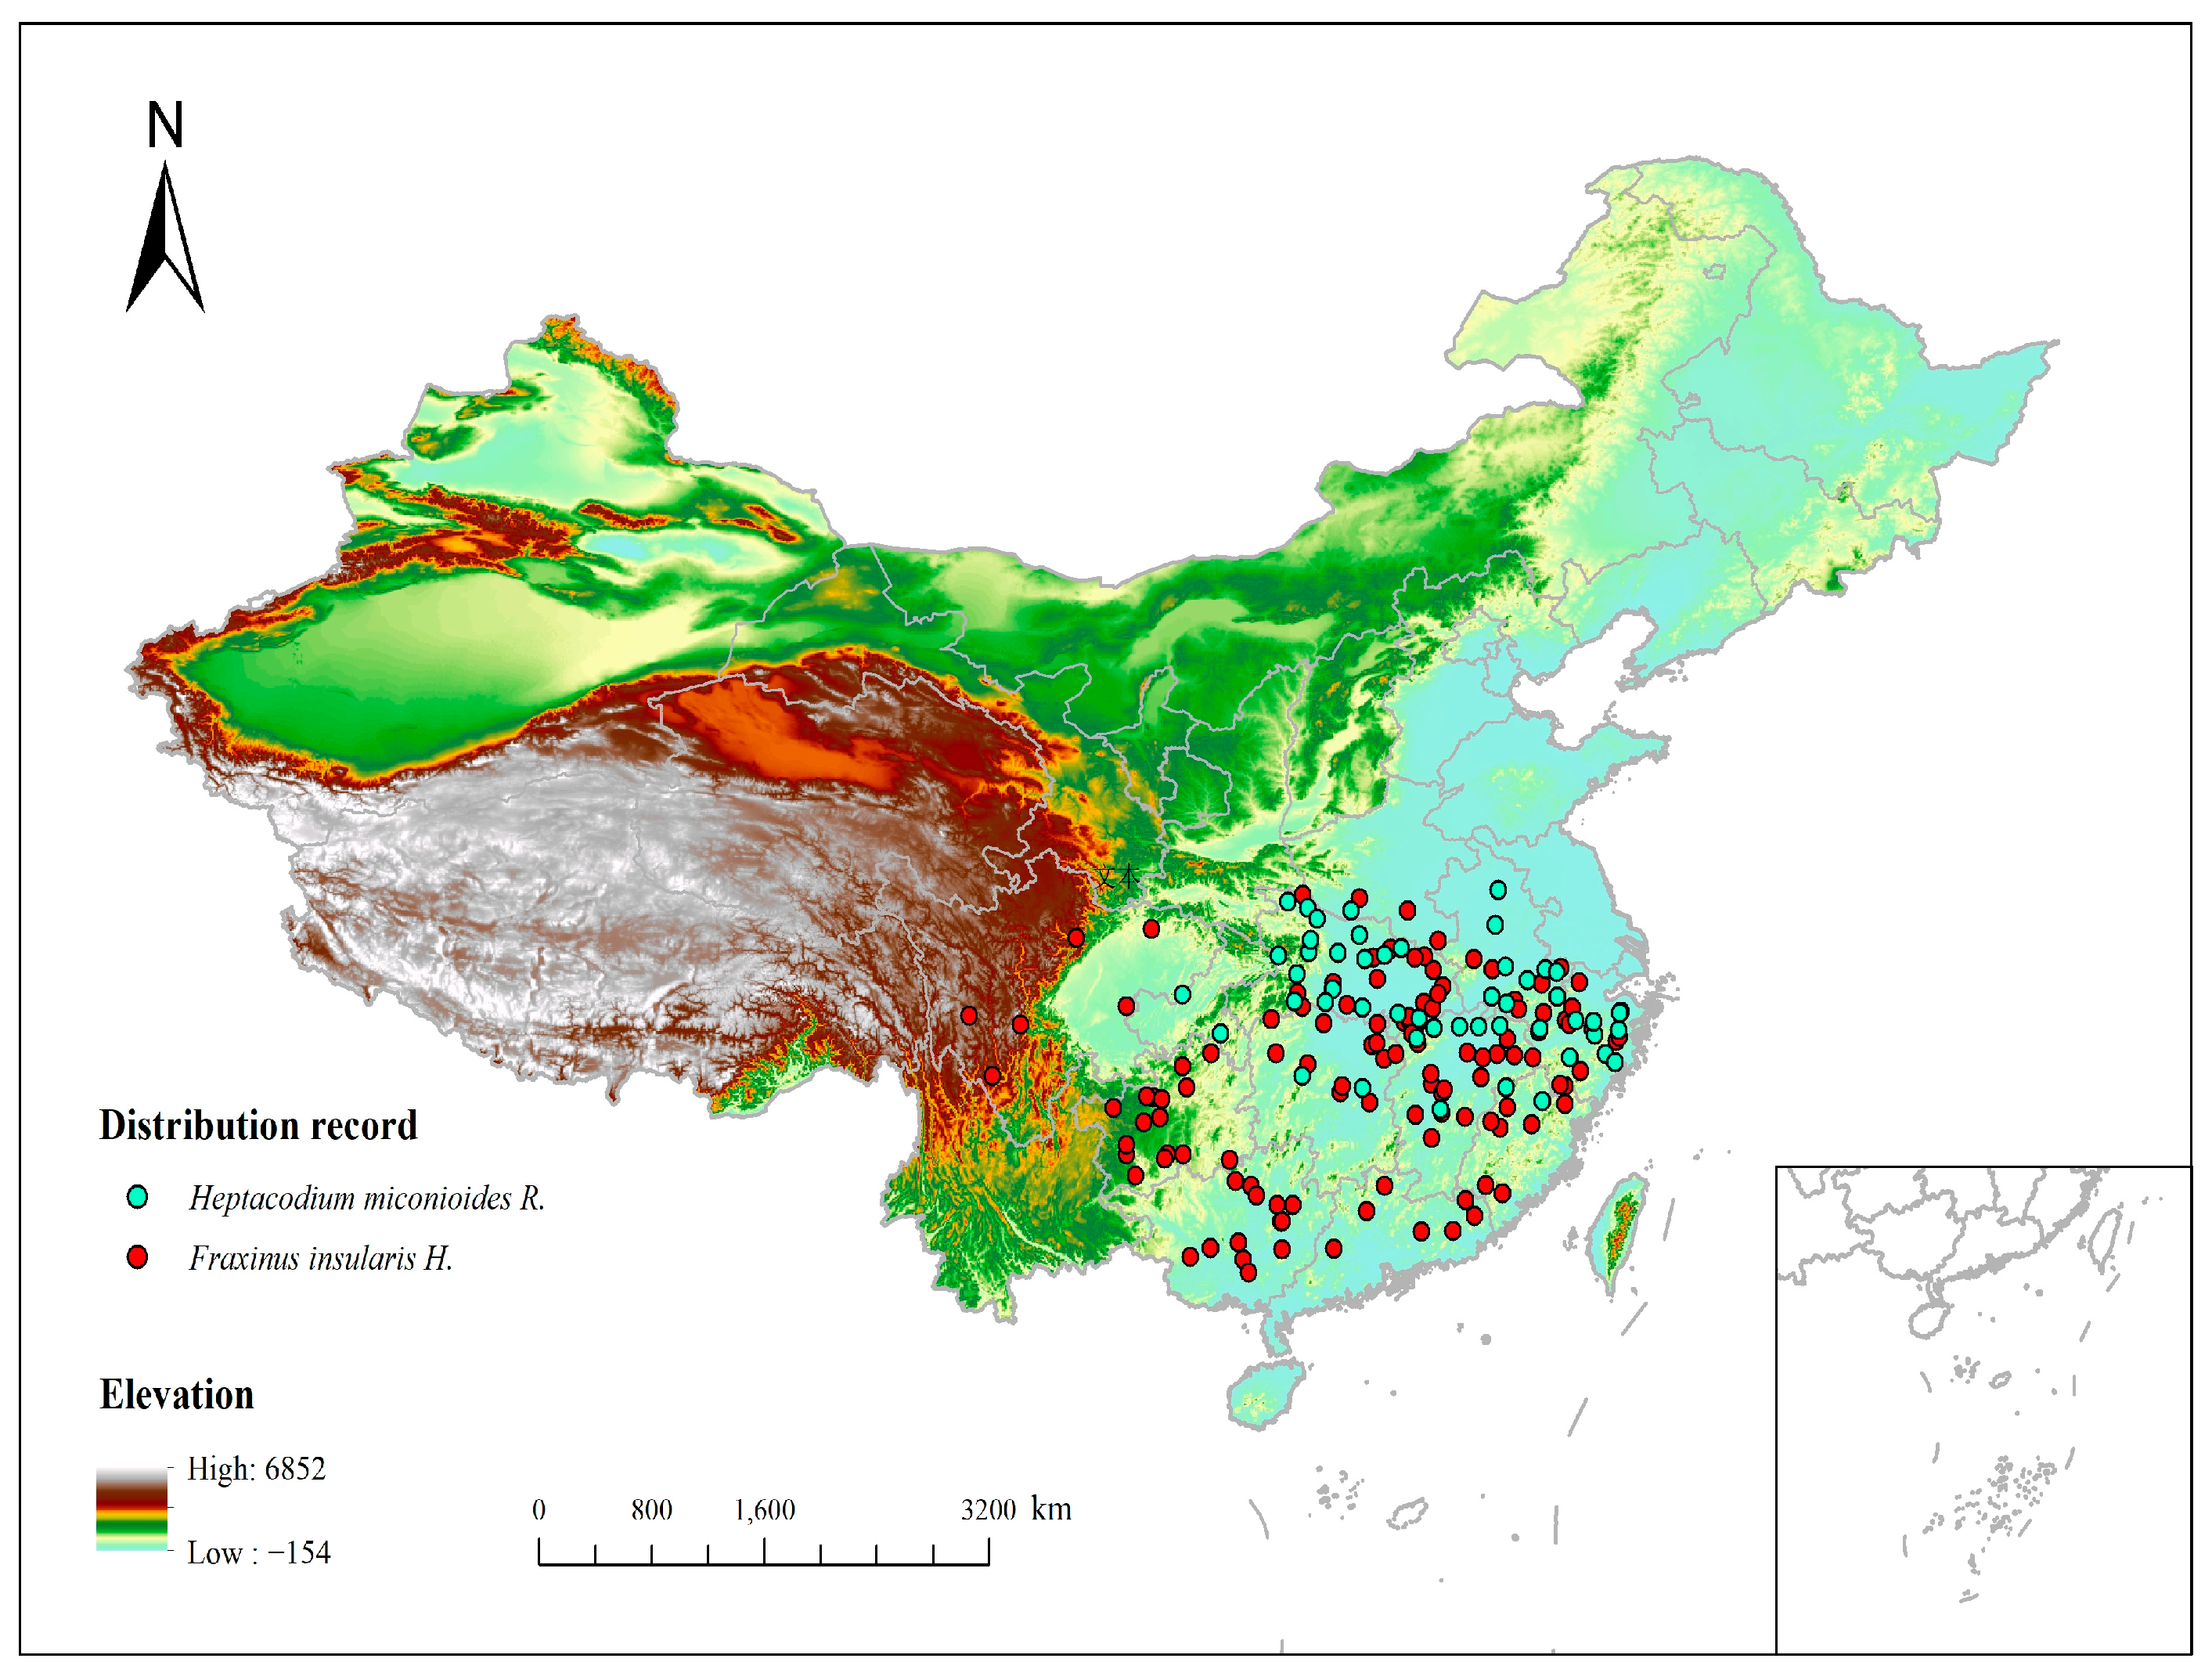
2.2. Species Distribution Data Sources and Processing

Species distribution data were obtained from GBIF (https://www.gbif.org/ (accessed on 30 November 2023)), the Chinese Plant Image Library (http://ppbc.iplant.cn/ (accessed on 30 November 2023)), and the records of plant coordinates for each location [26]. To prevent duplicated data in the same raster, this study eliminated the duplicated data within the highest resolution of a single raster with ENMTools, ensuring that there was only one distribution coordinate point within every 5 km, and finally obtained 45 data points for H. miconioides and 119 data points for F. insularis species (Figure 1).

2.3. Environmental Data and Processing

Bioclimatic variables downloaded from the WorldClimate WorldClim 2.0 database (http://www.worldclim.org/ (accessed on 30 November 2023)) were used to model predicted species distributions [27]. These variables include current climate data (1990–2020) and future climate data (2041–2060) at a resolution of 2.5 min, which includes four emission models (Table 1). Slope and aspect data derived from elevation data (from the Geospatial Data Cloud https://www.gscloud.cn/ (accessed on 30 November 2023)) were then extracted using ArcGIS 10.5 software. Land-Use and Land-Cover Change (LUCC) were obtained from the Ministry of Natural Resources (http://wwww.ngcc.cn (accessed on 30 November 2023)) and Normalized Difference Vegetation Index (NDVI) data were downloaded from the Resource and Environmental Science Data Center of the Chinese Academy of Sciences (http://www.resdc.cn (accessed on 30 November 2023)). These environmental variables play an increasingly important role in predicting climate change and related research, and in supporting climate policy decisions. Bivariate correlation analyses were performed using SPSS on environmental variables grouped together. If two variables |r| ≥ 0.85 were considered to be significantly correlated [28], 1 variable with relatively low biological significance was excluded to reduce model overfitting (Figure 2), and finally, 12 bioclimatic factors, 3 terrain factors, and 5 other environmental factors were selected (Table 2).

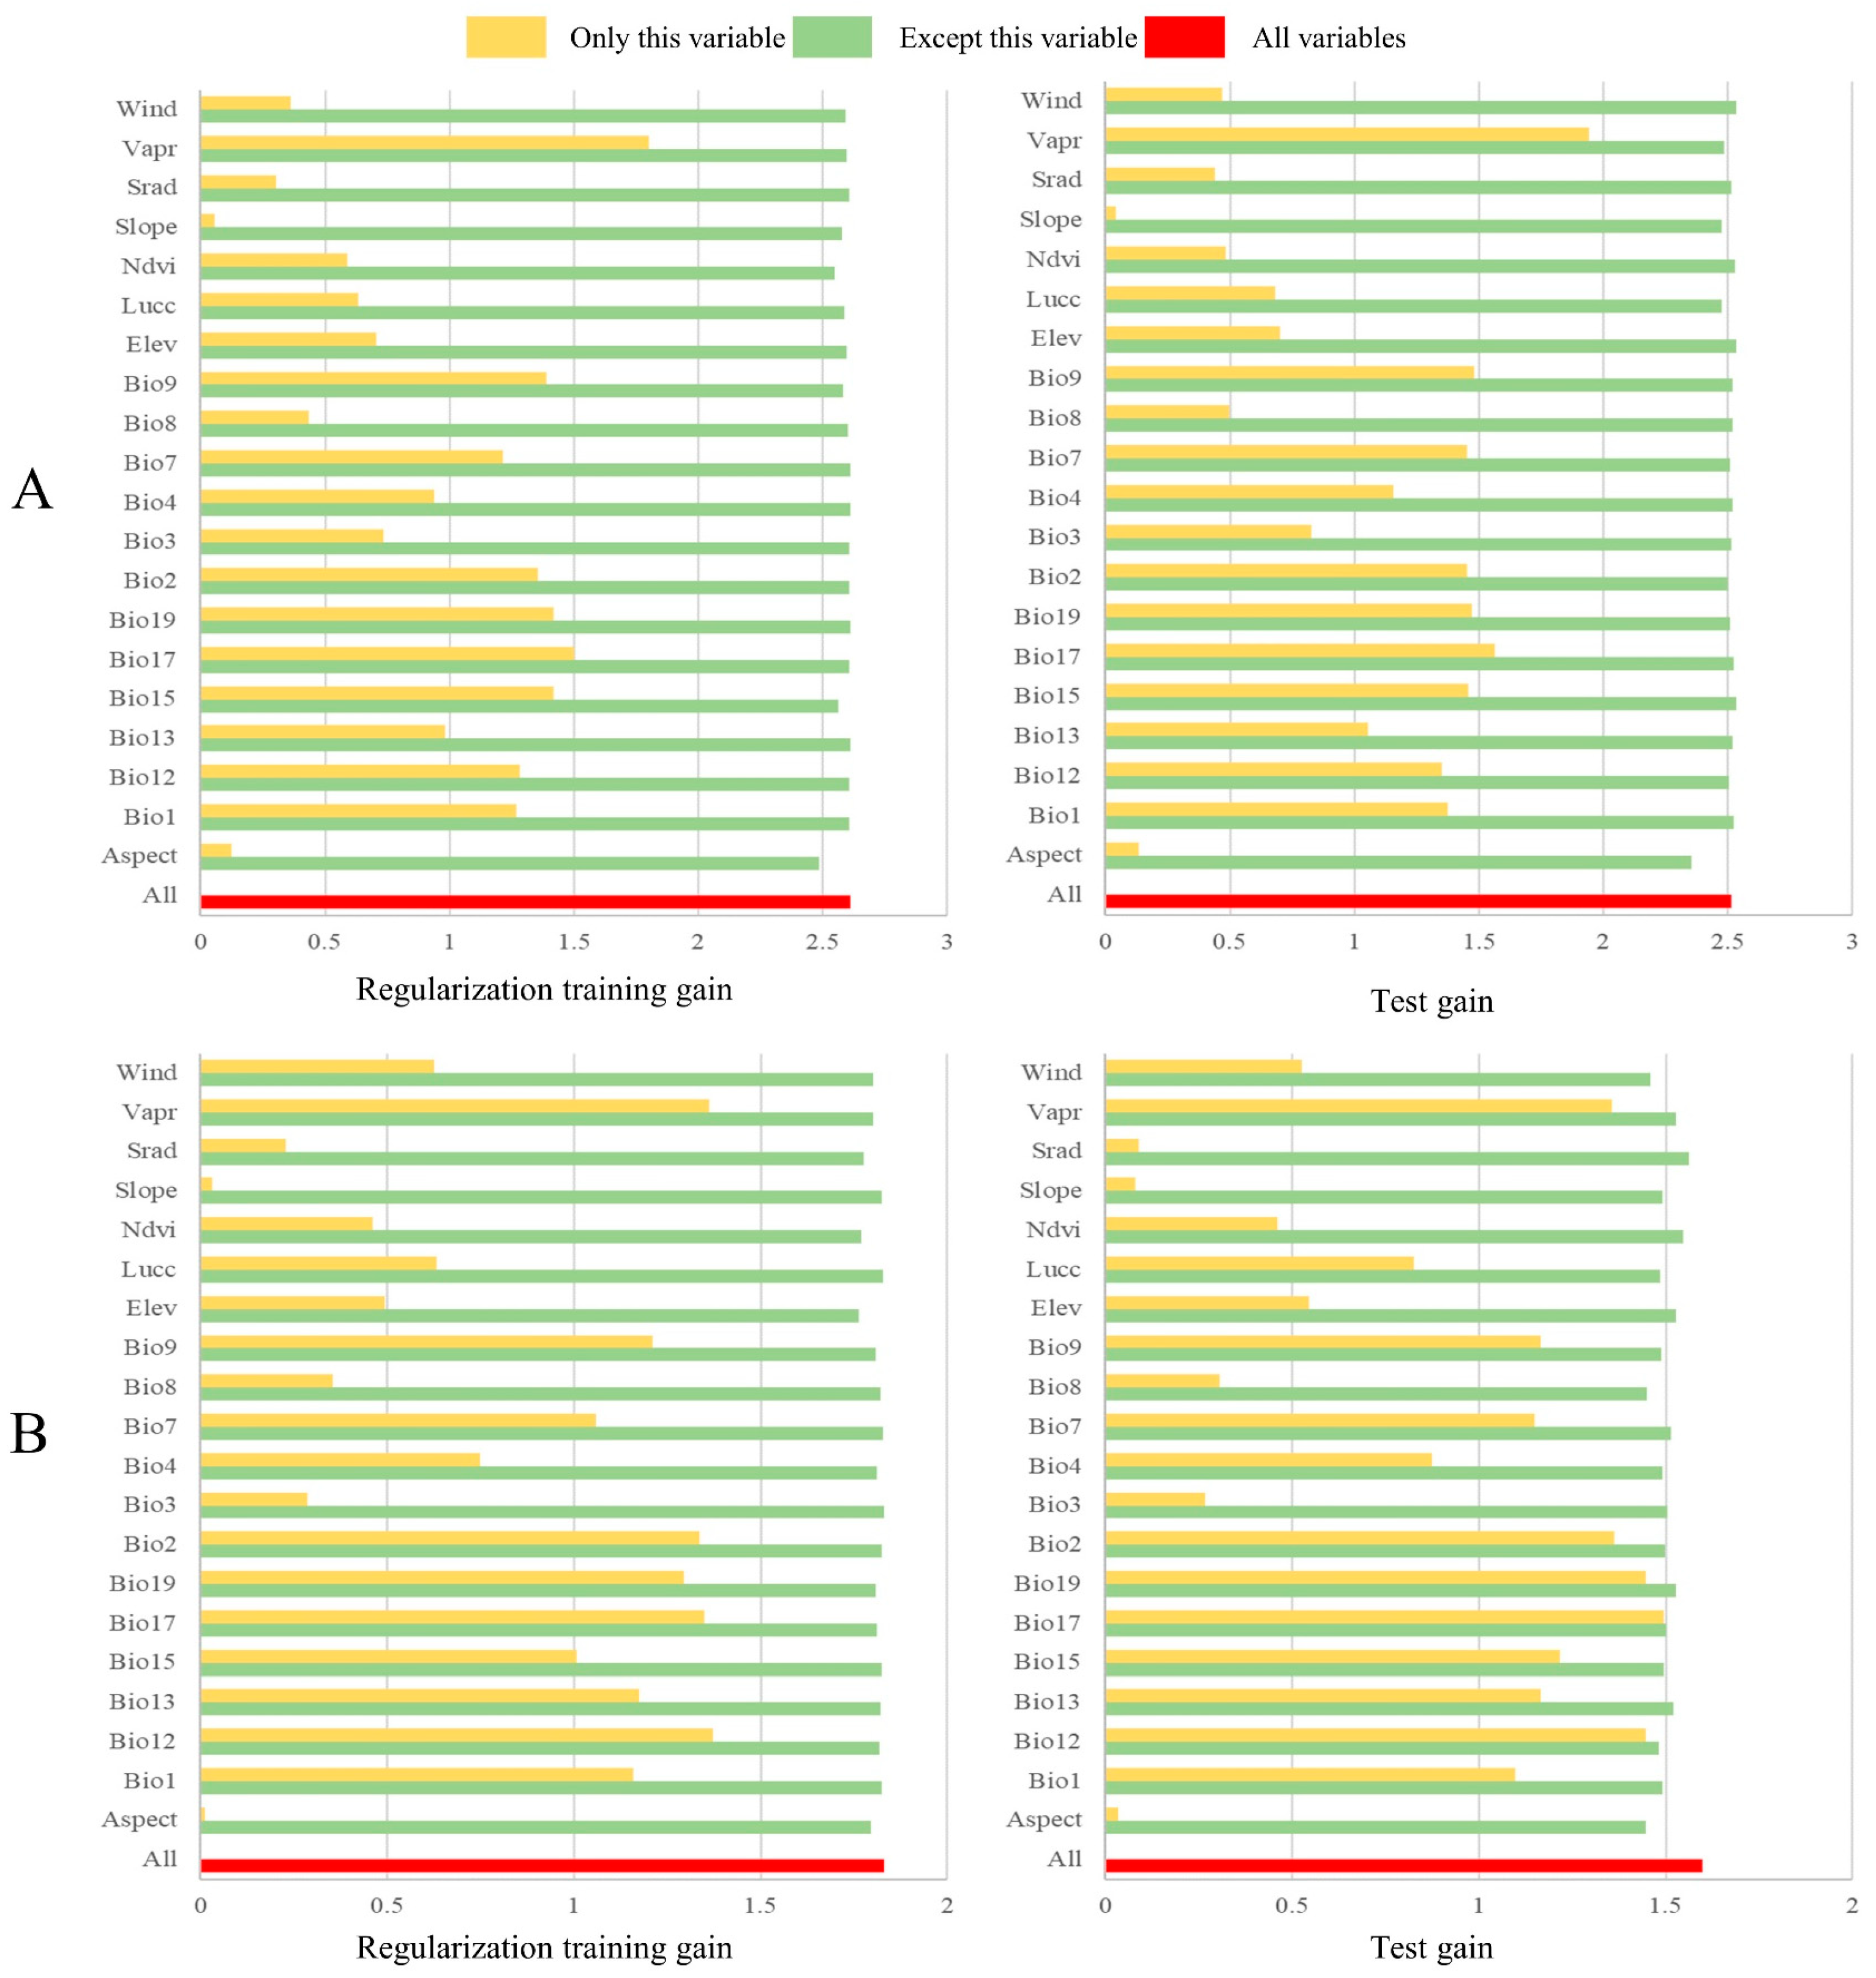
2.4. MaxEnt Modeling

The two most important parameters in MaxEnt are feature combination (FC) and regularization multiplier (RM), the optimal selection of which helps to significantly improve the prediction accuracy of the model. Among them, FC has five selectable options, namely linear (linear, L), quadratic (quadratic, Q), product (product, P), threshold (threshold, T), and fragmentation (hinge, H), which can produce 31 different combinations; the RM parameter is generally set to less than 4, and 1 is used for every interval of 0.1 from 0.1 to 4 RM, with a total of 40 RM values used. The principle of this model is to use the actual geographic distribution points of species and environmental variables to construct a fitness zone model to project the ecological needs of species and simulate the potential distribution of species [29,30]. The obtained distribution point coordinates and environmental variables of H. miconioides and F. insularis were imported into the MaxEnt model; 75% of the randomly selected distribution points were used for model construction, and the remaining 25% of the distribution points were used for model validation and testing with 500 iterations, and the other parameters were set to the default values [31]. The area of the Receiver Operating Characteristic Curve (ROC) (AUC value) assesses the accuracy of the simulation results [32]. When the AUC value is 0.7 to 0.8 it indicates average model accuracy, 0.8 to 0.9 is good, and an AUC value higher than 0.9 indicates excellent model accuracy [33]. The AUC values for F. insularis and H. miconioides were greater than 0.9, 0.949, and 0.980 (Figure 3), respectively, indicating that the predictions of the MaxEnt model were accurate and highly predictable.

2.5. Ecological Niche Overlap and Geographic Distribution Overlap Analysis

Ecological niche overlap refers to the similarities and competition between different species in the utilization of environmental resources, while geographic distribution overlap indicates the overlap of geographic distribution areas of different species [34]. Based on the results of the MaxEnt model, we analyzed the ecotope overlap and geographic distribution overlap of H. miconioides and F. insularis by using niche overlap and range overlap in ENMTools software. Ecological niche overlap was expressed by Schoener’s D (D) and Hellinger’s-based I (I) [35]:
D P x , P y = 1 1 2 i P x , i P y , i
I P x , P y = 1 1 2 i P x , i P y , i
where Px,i and Py,i represent the number of resources i utilized in species x and species y, respectively. D and I lie between 0 and 1, and the larger the value, the higher the degree of ecological niche overlap.

2.6. GTWR Model

The basic principle of geo-temporally weighted regression is to adjust the weights of each sample in the regression model by introducing weighting terms for geographic location and time factors [36]. In traditional regression analysis, individual samples are weighted equally. However, the Spatio-Temporal Geographic Weighted Regression Model gives more weight to samples that are close in distance or time by considering the effects of geographic location and time, thus better reflecting the actual situation [37]. The advantage of this model is that it can reflect the differences between different points in the region and can obtain more reasonable regression coefficients in different regions [38]. The basic formula is as follows:
Y i = φ 0 u i , v i , z i + j = 1 m φ j u i , v i , z i X ij + δ i
where Yi is the explanatory variable for i study area, Xij is the j explanatory variable for the i study area, (ui,vi) is the latitude and longitude coordinates of the i study area, φ0(ui,vi,zi) is the intercept, and φj(ui,vi,zi) is the j explanatory variable for the i study area. The regression coefficient of φ > 0 is the positive effect of the explanatory variable on the explanatory variables and vice versa.

3. Results

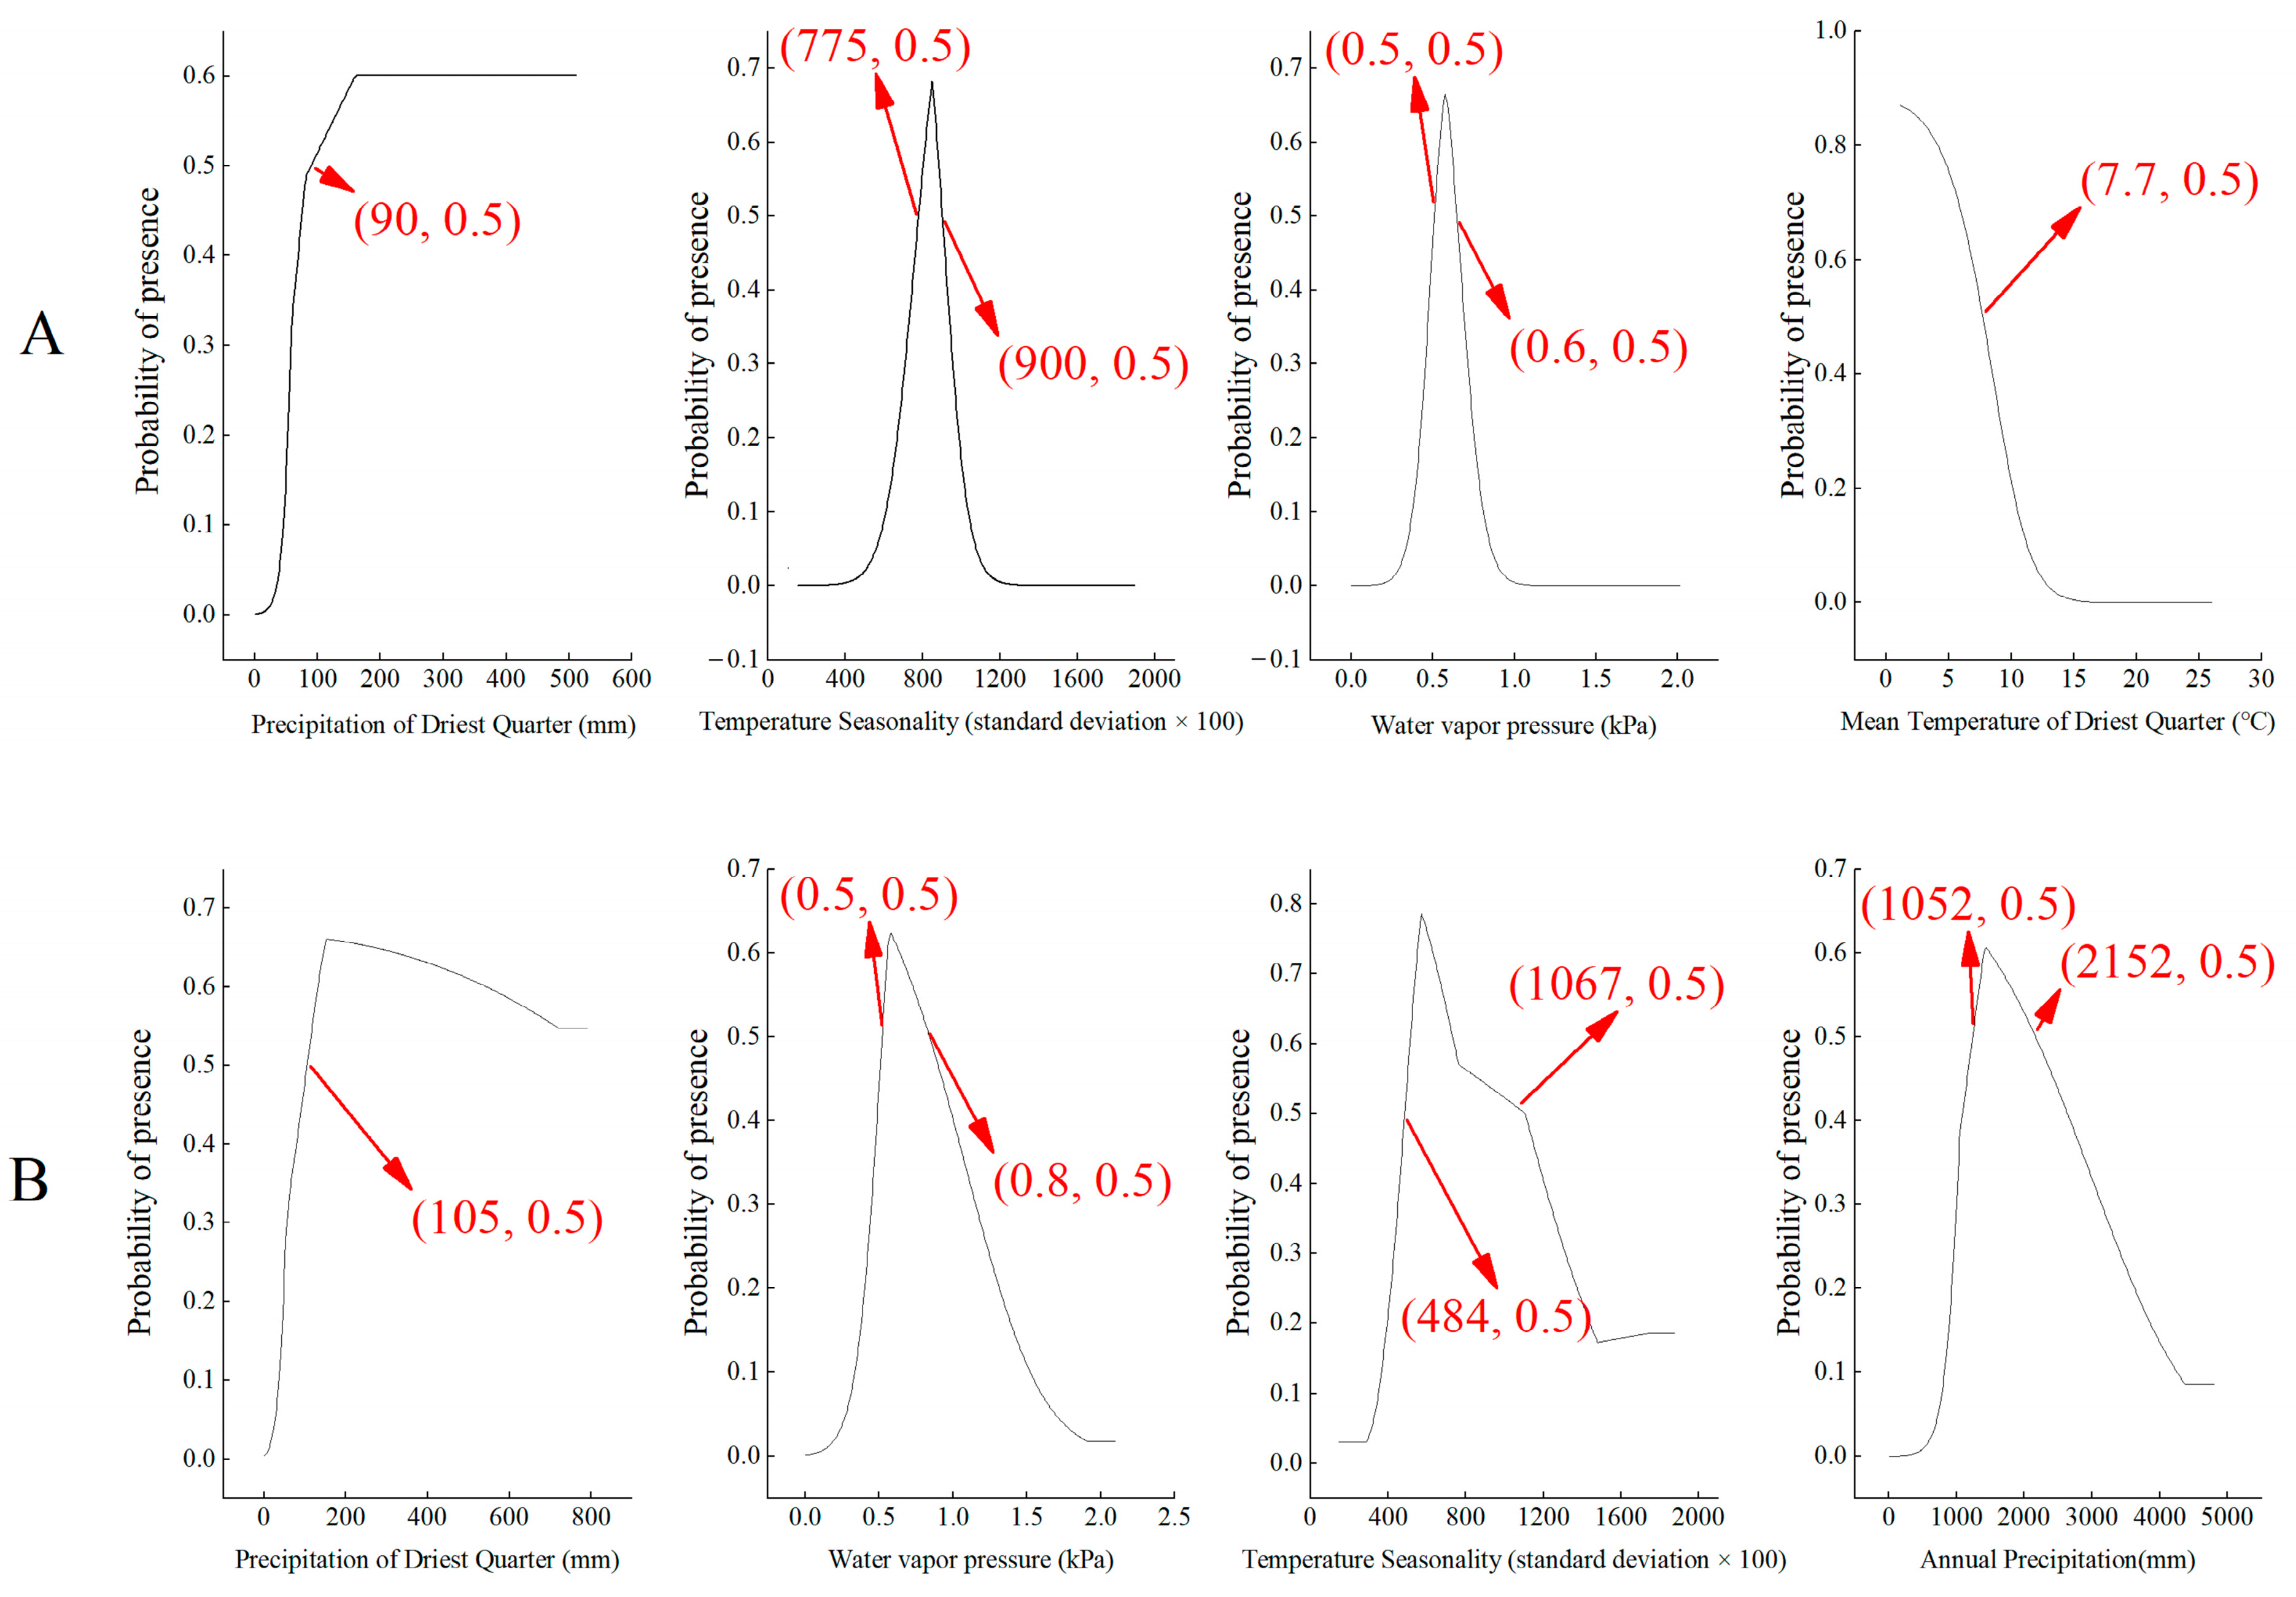
3.1. Environmental Characteristics of Suitable Areas

The environmental factors with the deepest influence on the potential areas of distribution for the two plants in order of contribution were (Figure 4), for H. miconioides: Precipitation in Driest Quarter (52.8%), Temperature Seasonality (13.1%), Water vapor pressure (10.4%), Mean Temperature in Driest Quarter (3.5%); the cumulative contribution of the four environmental factors is 79.8% (Table 3). It can be seen that the above four environmental factors are the dominant environmental factors affecting the potential distribution area of H. miconioides. For F. insularis, the most influential factors were: Precipitation in Driest Quarter (49.8%), Water vapor pressure (23.9%), Temperature Seasonality (4.4%), Annual Precipitation (3.6%). The cumulative contribution of the four environmental factors amounted to 81.7%, with the precipitation factor having the greatest effect on F. insularis. In this paper, we set the threshold to 0.5 based on our previous research and the principles of the MaxEnt modeling [39], and when the probability of these variables is greater than 0.5, the corresponding environmental variables are suitable for growth. When the Precipitation in Driest Quarter (Bio17) is greater than 90 mm, Temperature Seasonality (Bio4) is in the range of 775~900, Water Vapor Pressure (Vapr) is in the range of 0.5~0.6 kpa, and the Mean Temperature in Driest Quarter (Bio17) is lower than 7.7 mm, the environment is conducive to the survival of H. miconioides. When the Precipitation in Driest Quarter (Bio17) is greater than 105 mm in the driest season, Water Vapor Pressure (Vapr) is 0.5–0.8 kPa, Temperature Seasonality (Bio4) ranges from 484 to 1067, and Annual Precipitation (Bio12) ranges from 1052 to 2152 mm, the environment favors the survival of F. insularis (Figure 5).

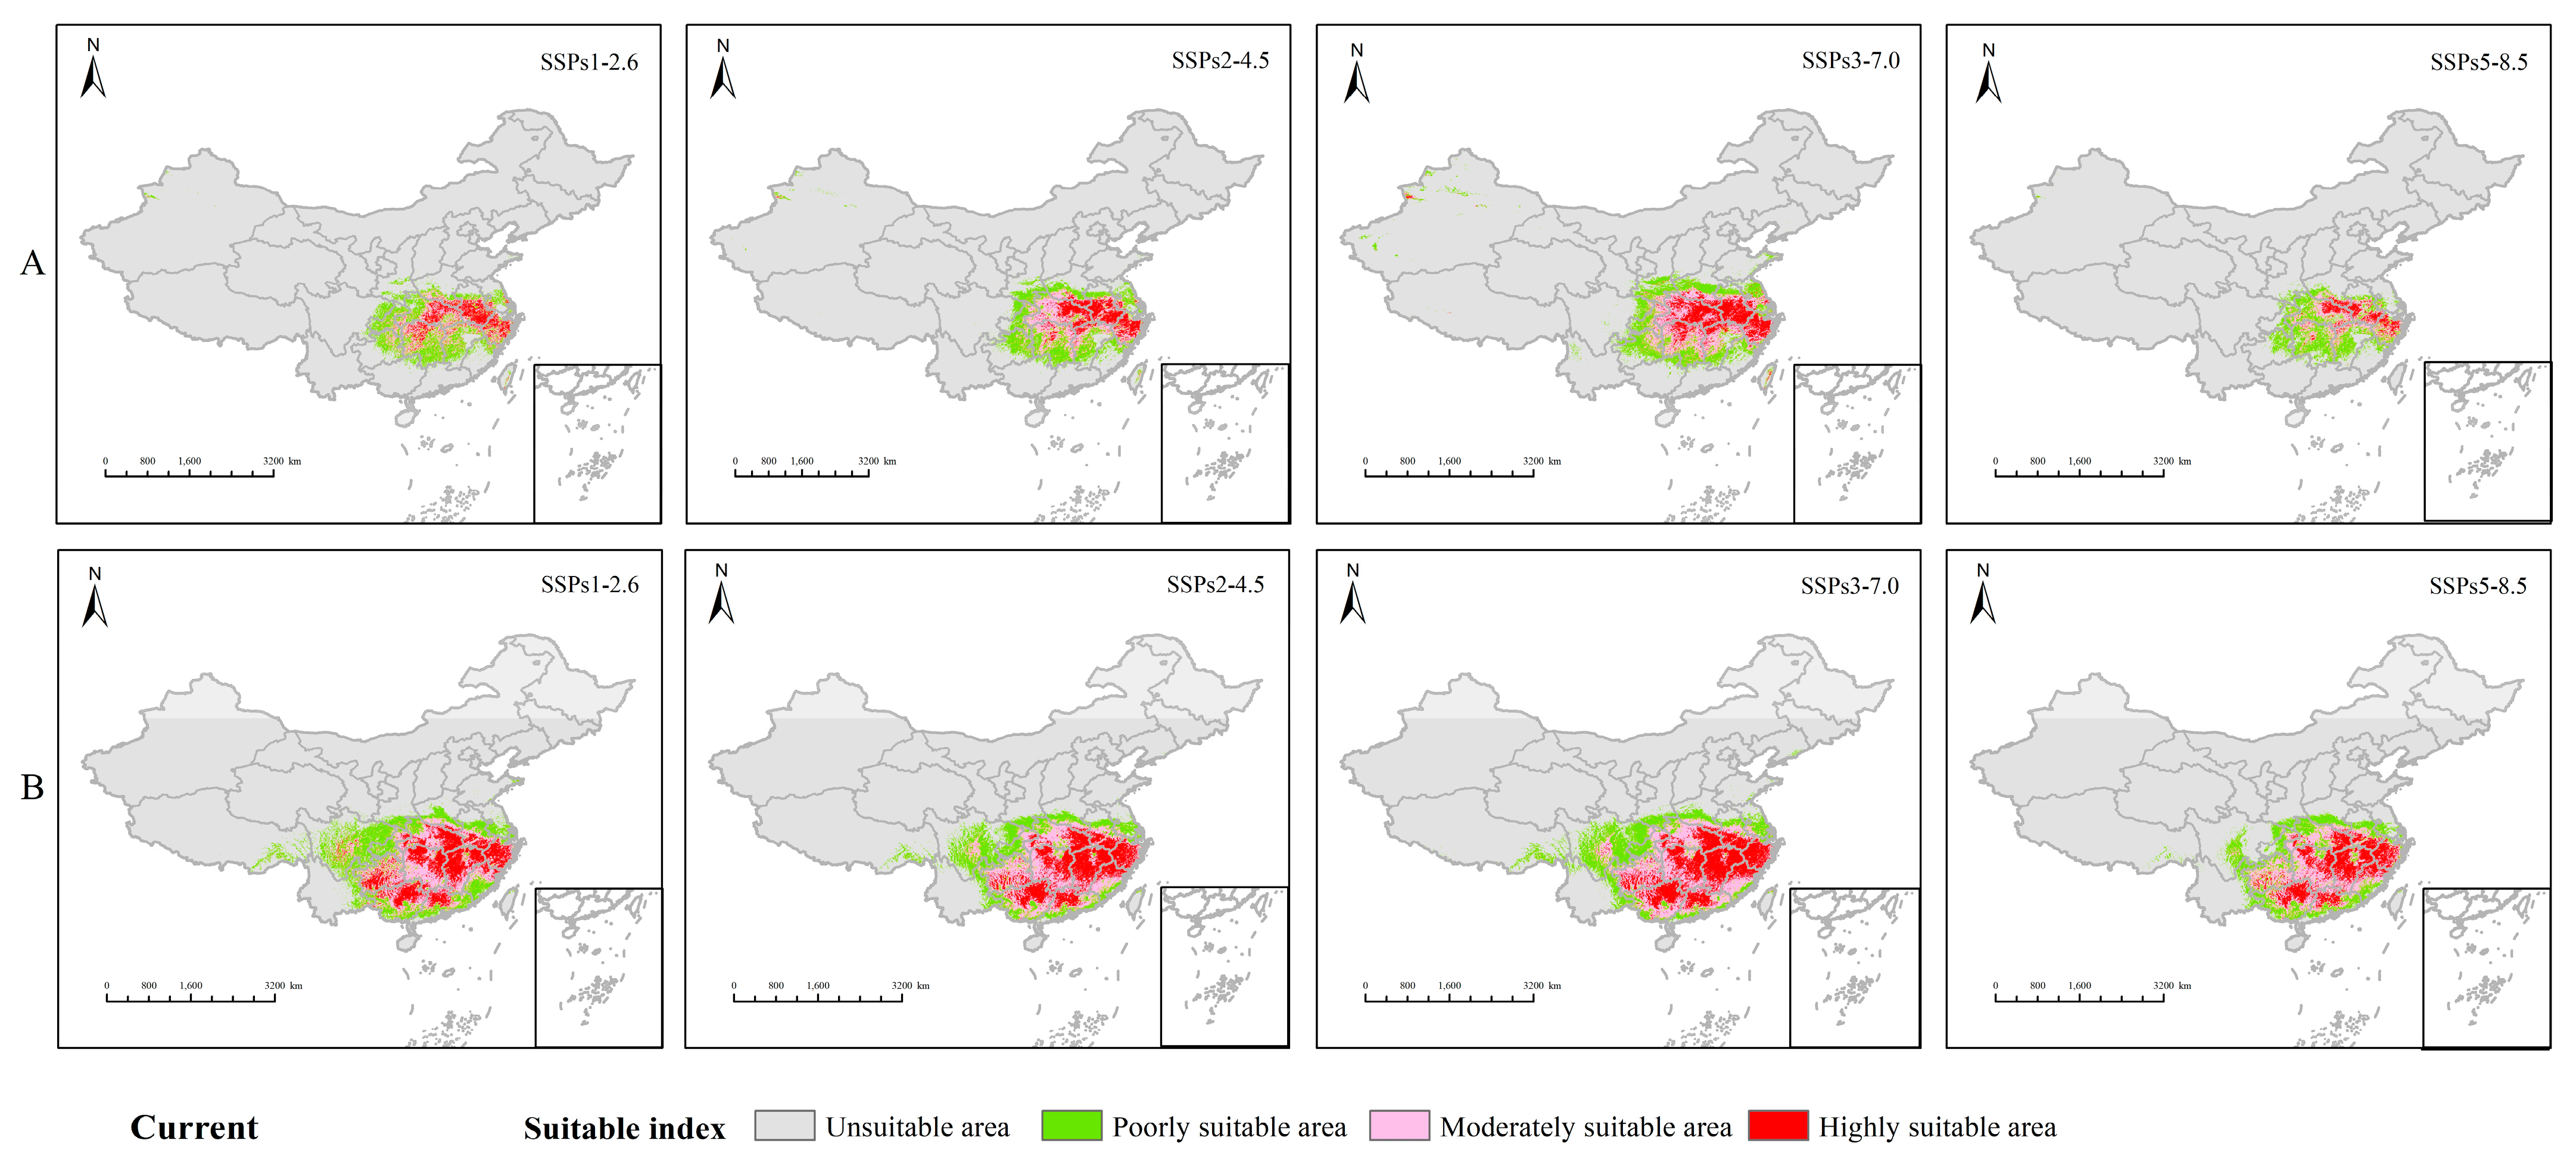
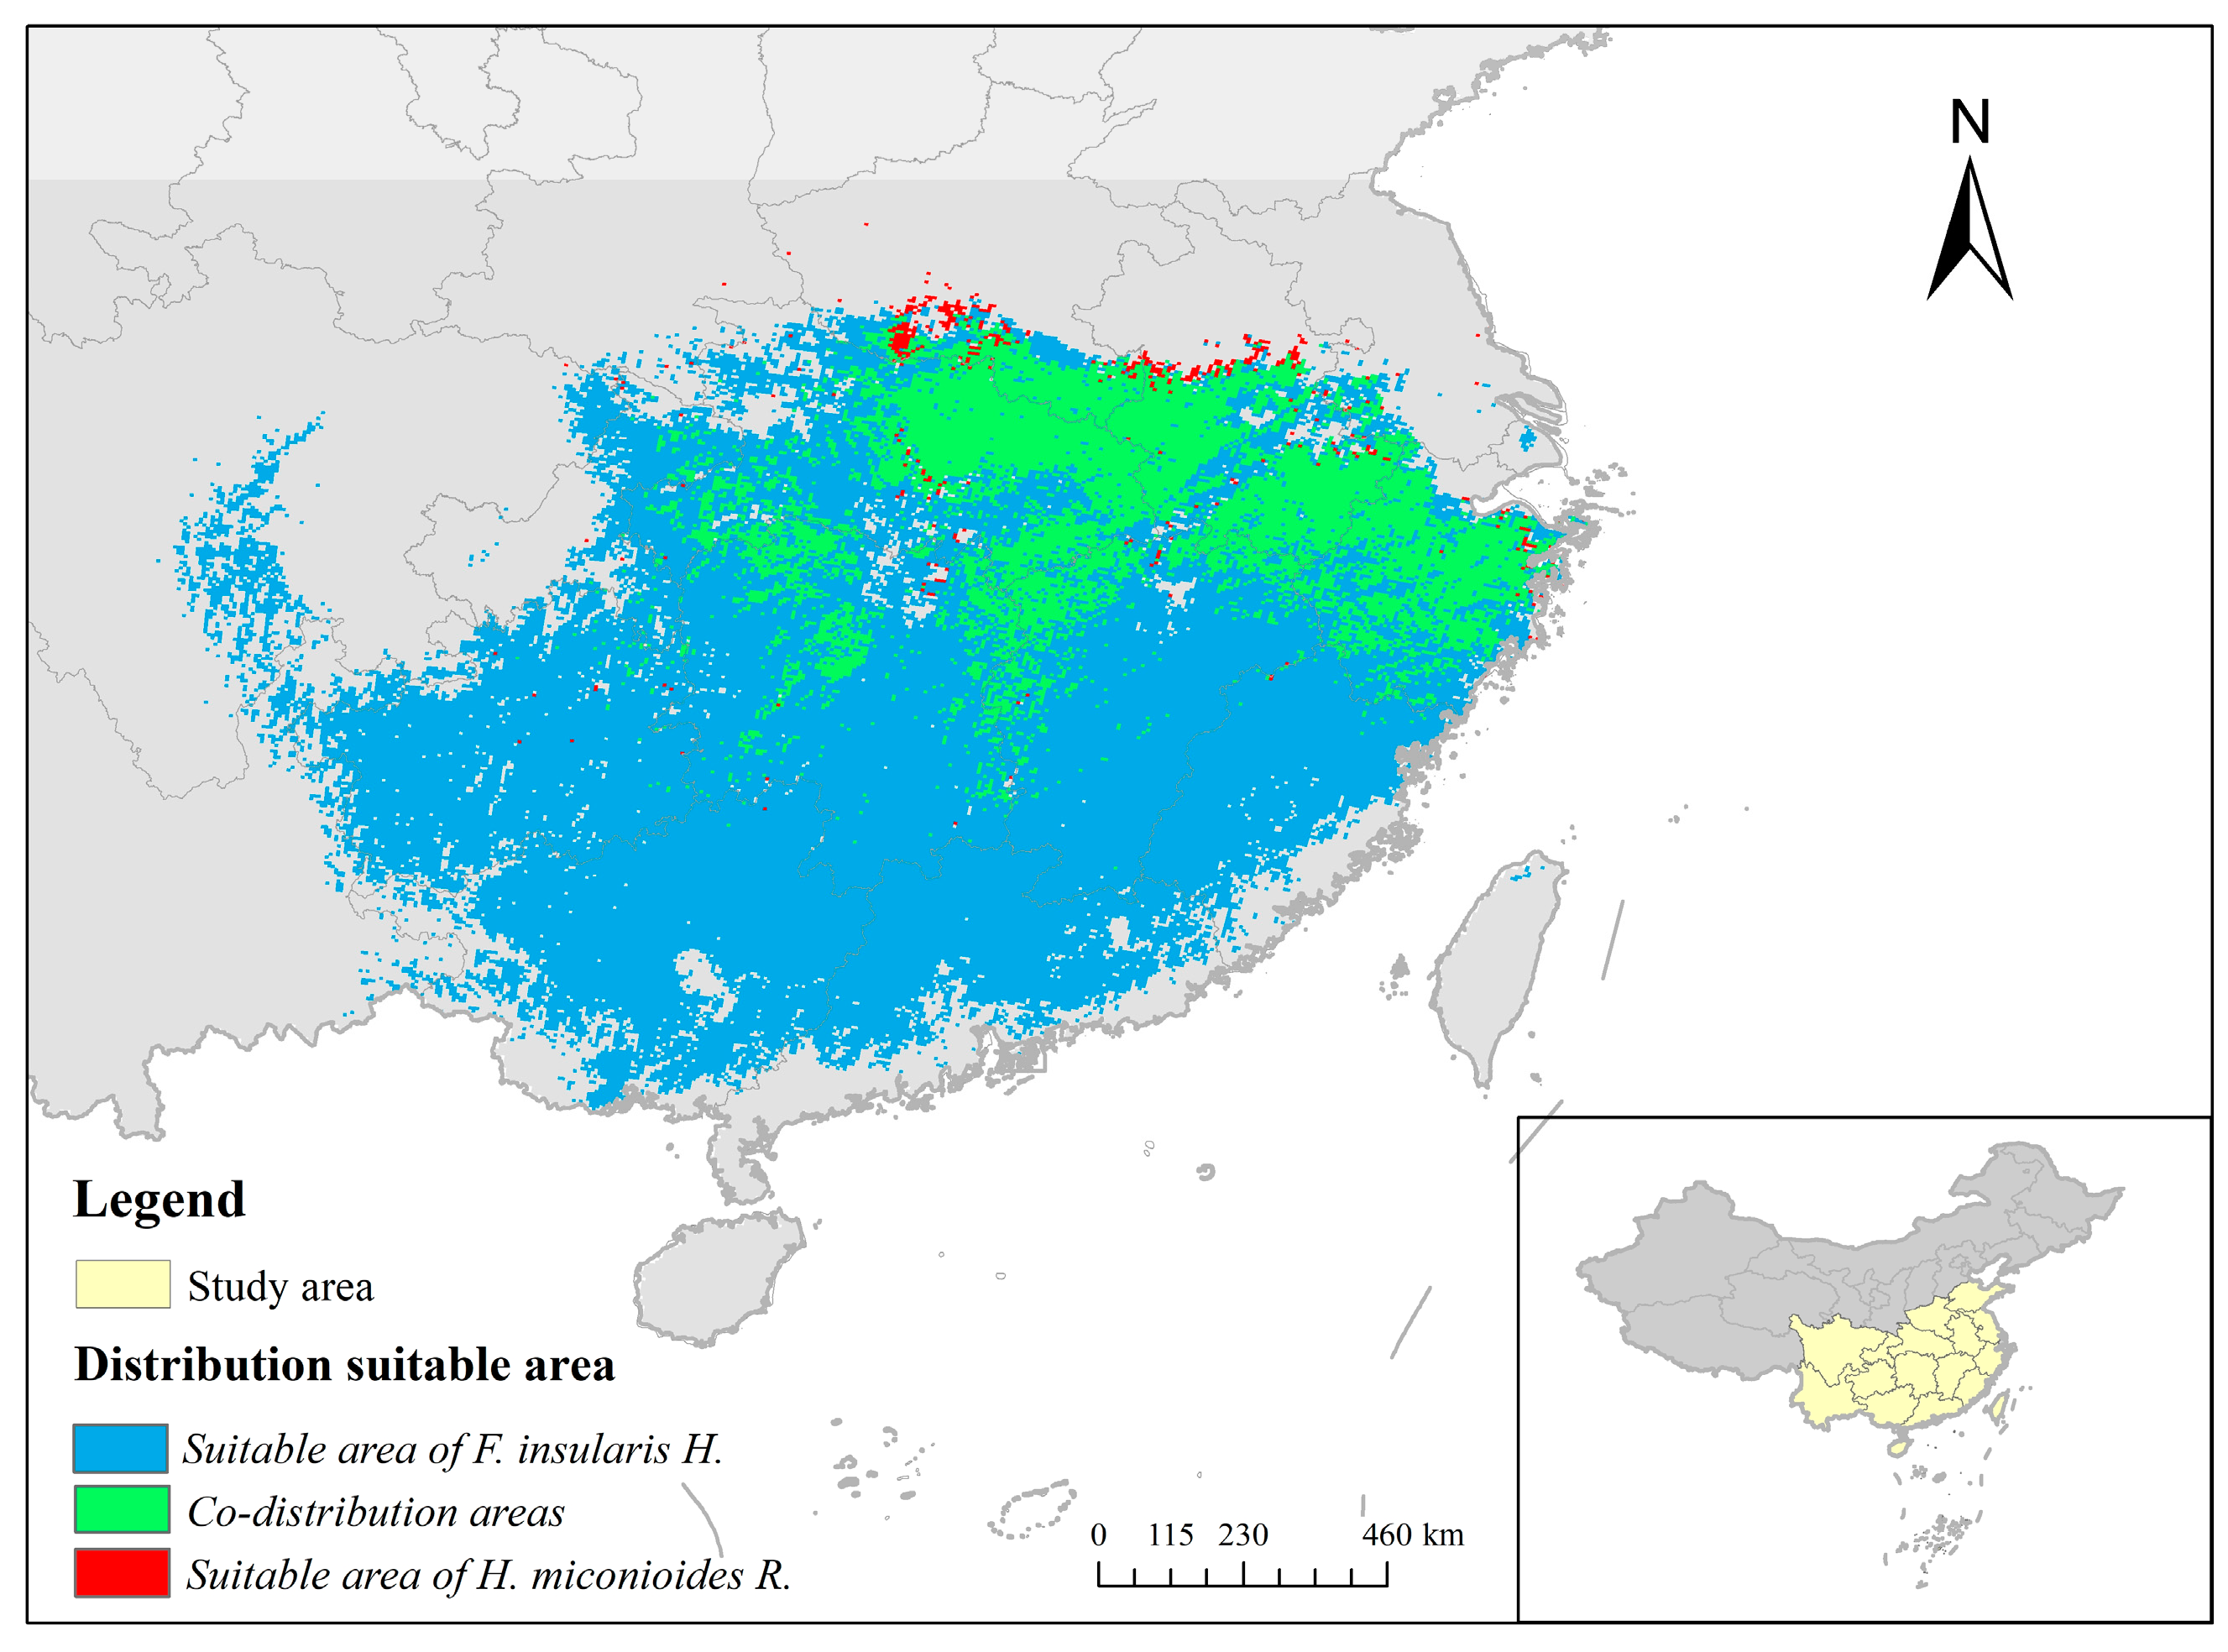
3.2. Analysis of the Distribution Pattern of H. miconioides and F. insularis under Current Environmental Patterns

Our calculation is based on the method of classifying the fitness classes, which can be obtained by reclassifying according to the thresholds set for the: non-viable zone (p < 0.08), low viable zone (0.08 ≤ p < 0.35), moderate viable zone (0.35 ≤ p < 0.65), and high viable zone (p ≥ 0.65) [40]. At the present stage, the main areas suitable for H. miconioides were in southeastern China (Figure 6A), with a total suitable area of (440.75~590.49) 104 km2 (Table 4) under the four models, of which an area of (61.91~155.91) 104 km2 was highly suitable. H. miconioides was mainly found in the southern part of the Henan Province, central Anhui Province, central Zhejiang Province, etc., with a small portion in Hunan, Hubei, and other provinces in China. The MaxEnt model simulation revealed that, under the current climate model, the main area suitable for F. insularis in China is between 23°~32° N, 106°~121° E (Figure 6B), with a total suitable area of (631.19~692.26) 104 km2, of which a highly suitable area of (171.54~222.15) 104 km2 is mainly located in the Sichuan Province, Hunan Province, Zhejiang Province, Fujian Province, and other areas.

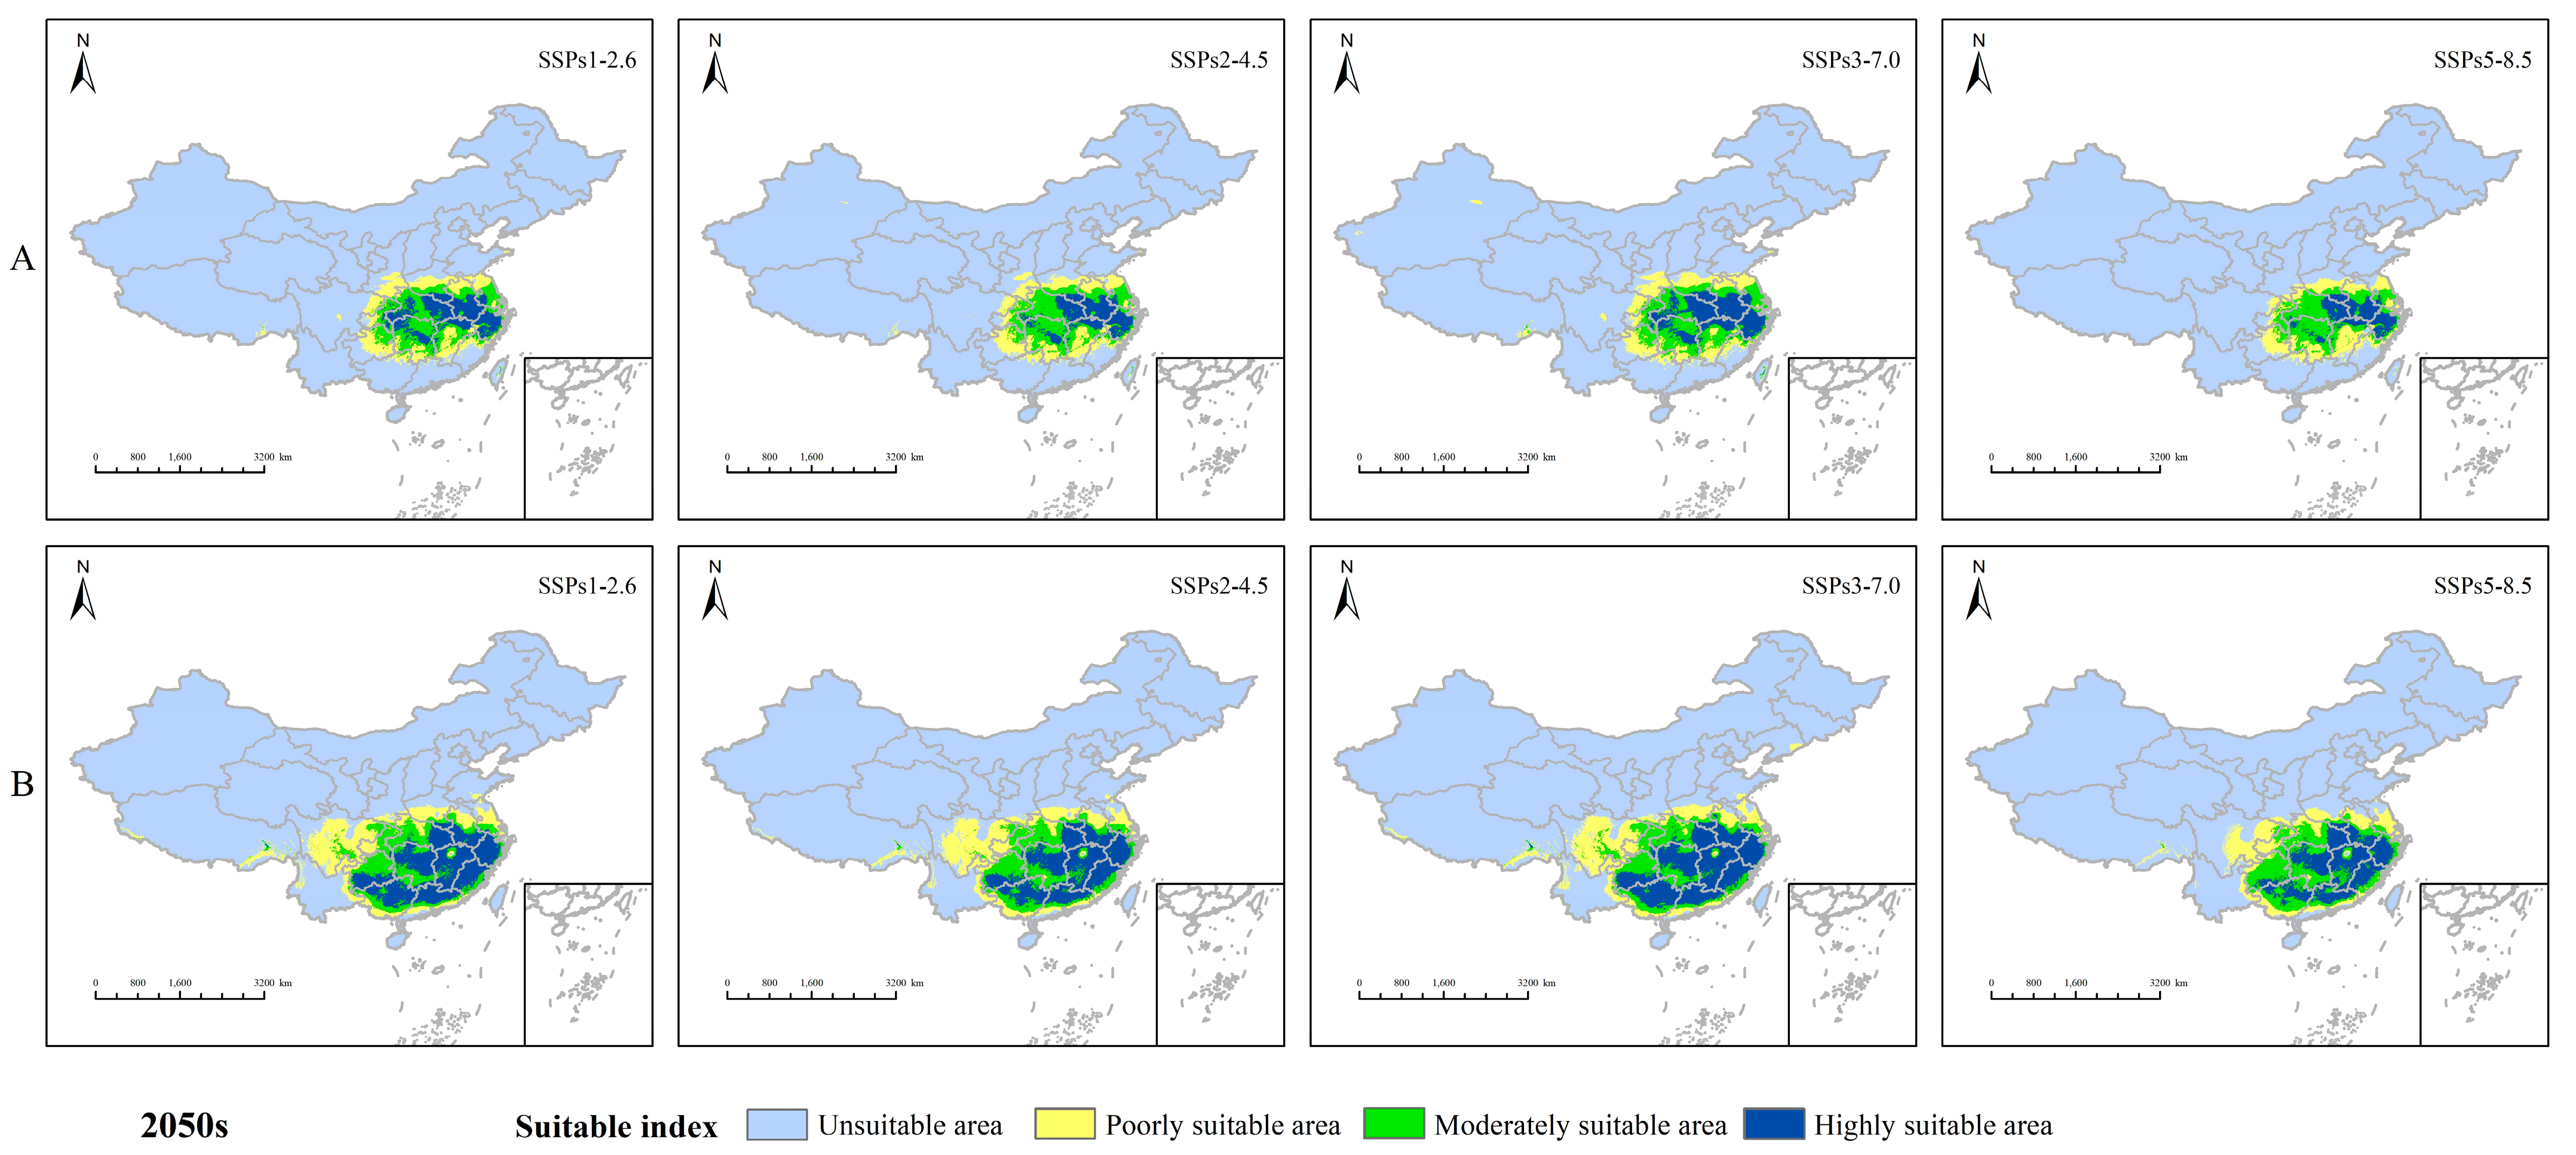
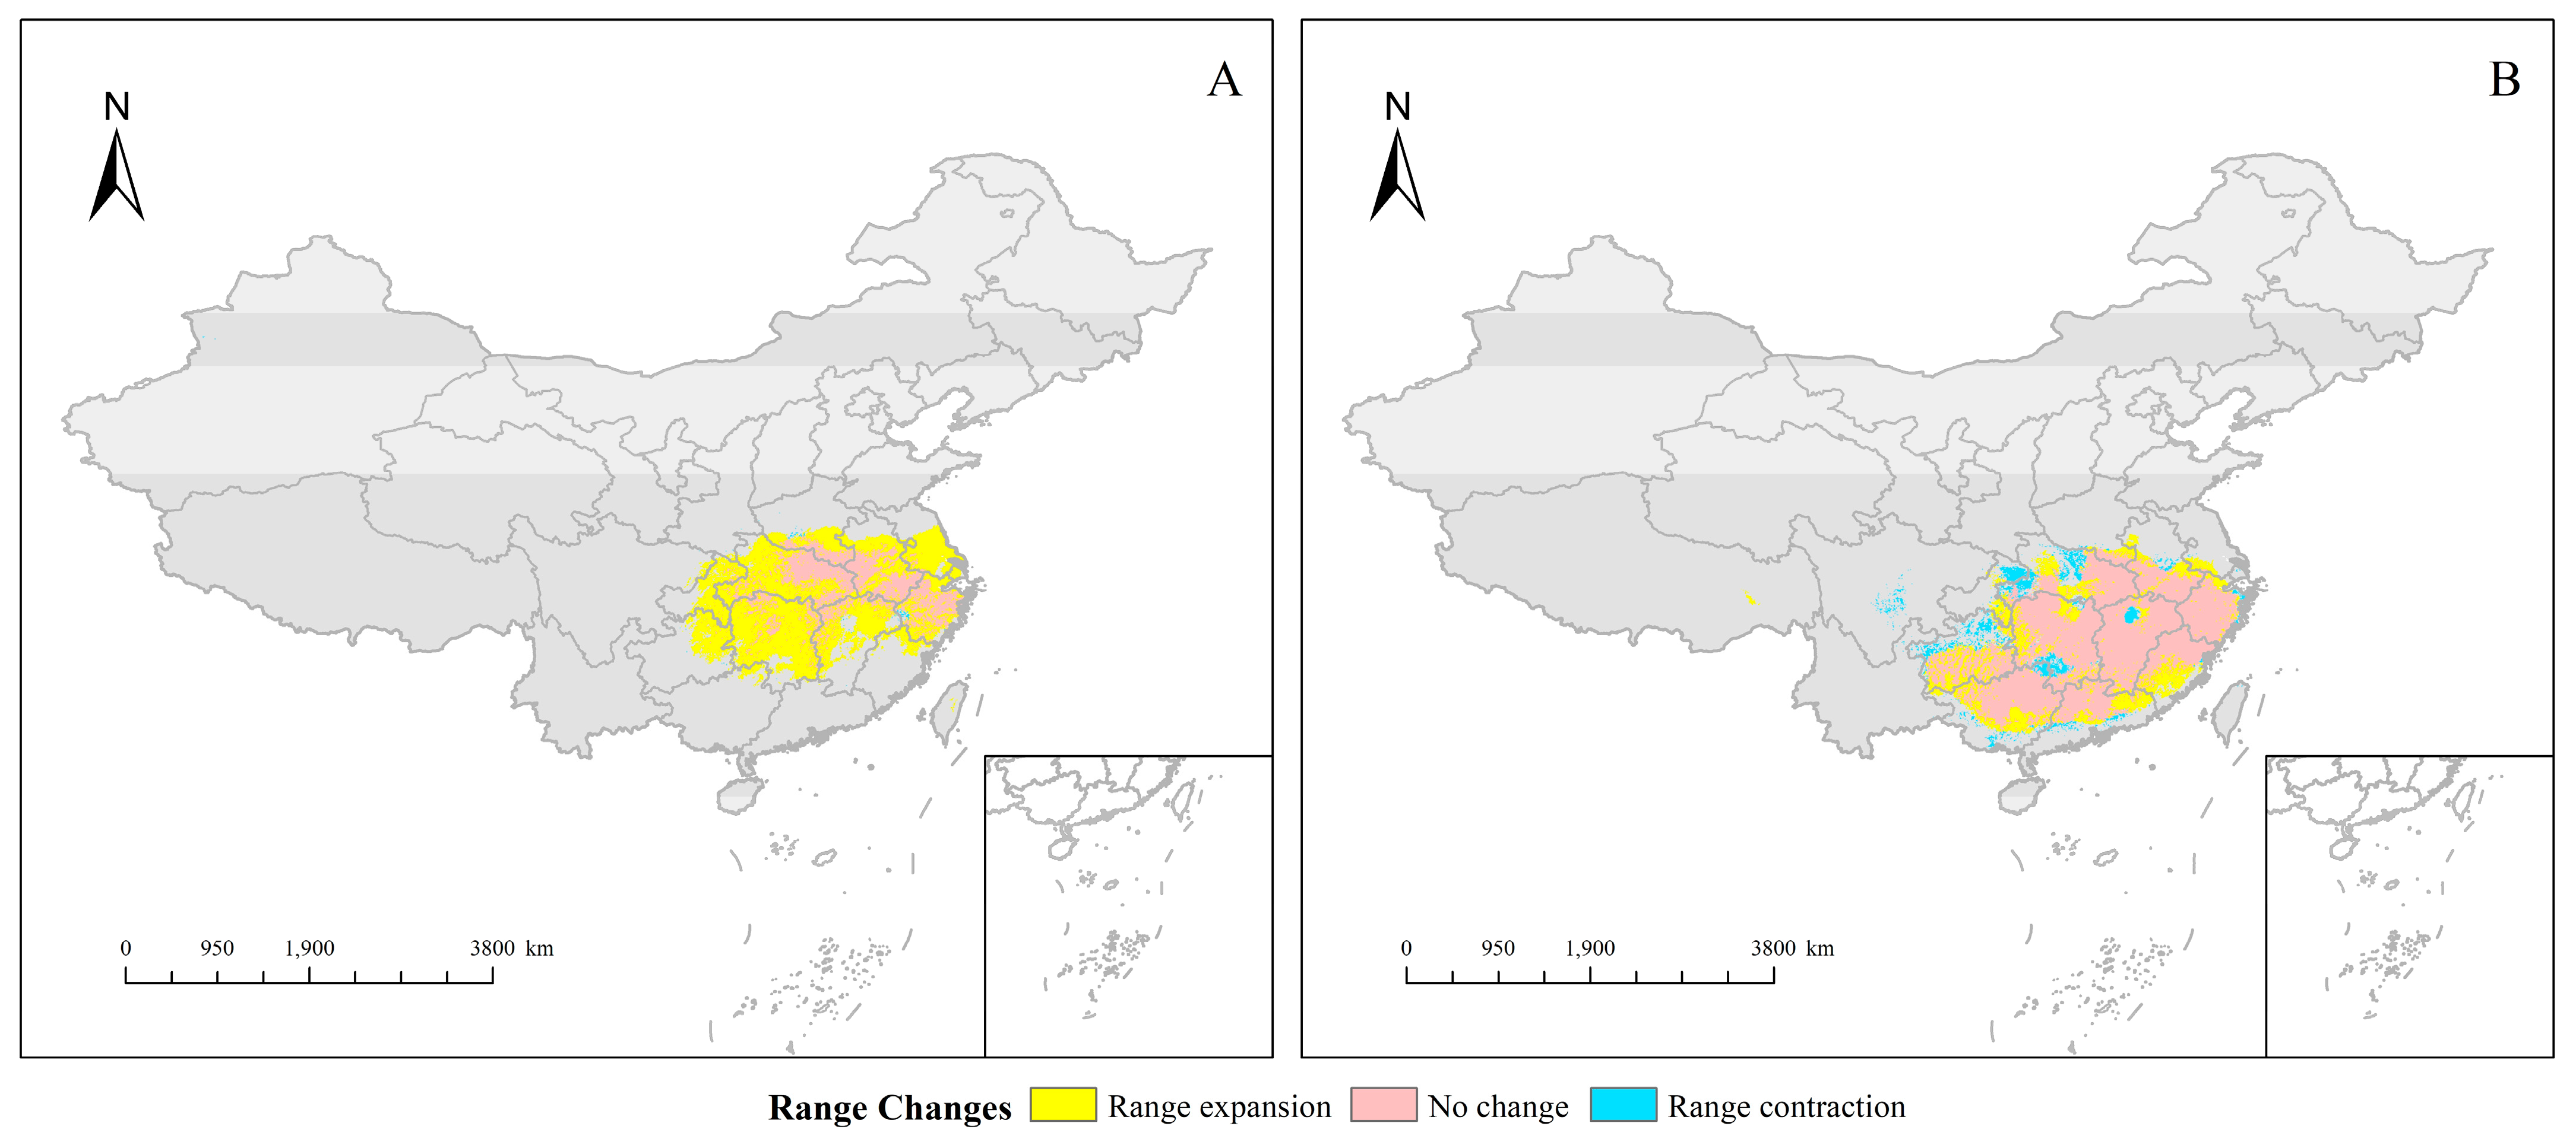
3.3. Habitat Changes under Future Environmental Models

Under the future climate scenarios, the distribution of suitable habitats for both species increased to different degrees (Table 5), and the total suitable area for H. miconioides under the four models was (582.63–601.79) 104 km2, of which the highly suitable area was (131.33–180.68) 104 km2. The total suitable area for F. insularis was (660.29~704.26) 104 km2, of which the highly suitable area was (224.84~281.18) 104 km2 (Figure 7). However, the trends of the changes in the spatial distribution pattern of suitable habitats for the different species still showed a large degree of variability. The ratio of future growth areas to total areas for H. miconioides is much greater than that for F. insularis (Figure 8). It is likely that environmental factors such as precipitation will be more favorable to Hepatica under future environmental conditions. H. miconioides is mainly expanding in Hunan, Hubei, Guizhou, and Chongqing in China, with an overall bias toward lower latitudes. The expansion area of F. insularis is mainly located in the southern regions of Guangdong and Fujian, China, with less latitudinal variation in the overall distribution area.

3.4. Ecological Niche and Geographic Distribution Analysis

Ecological niche overlap is the phenomenon of two or more species with similar ecological niches sharing or competing for common resources when they live in the same space [41]. In most cases, however, only partial overlap between ecological niches occurs, one part of the resource is co-utilized, while other parts are occupied individually [42]. Based on the predicted results from the ecological niche model, the ecological niche overlap and geographic distribution overlap of H. miconioides and F. insularis, respectively, were calculated to better analyze the competitive relationship between them. The higher the degree of ecological niche overlap, the more resource utilization is contested between the two species, leading to increased competition. When the geographic distribution threshold is taken as 0.6, the center of the distribution of H. miconioides will migrate southward in the future, while the center of the distribution of F. insularis will remain unchanged, and the competitive relationship between the two will remain strong; in the current environment, the ecological niche overlap between the two is 0.7261 for D and 0.9188 for I. The larger the overlap value, the more serious the competition between the two for local resources. In the future environment, the D and I values were 0.8048 and 0.9551, and the ecological niche overlap increased further; for H. miconioides, F. insularis is also an important factor affecting its survival. In addition, the current and future geographic overlap between the two was average, 0.5351 and 0.6209, respectively (Table 6). In the study, the ecological niche overlap and geographic distribution overlap of the two species increased further in the 2050s, which would affect the survival of H. miconioides. The area of spatial overlap between the two is mainly concentrated in southeastern China, and spatially, it can also be seen that F. insularis covers the area which is habitable by H. miconioides (Figure 9). It has been suggested that a nature reserve could be established to separately demarcate a suitable growing area for H. miconioides.

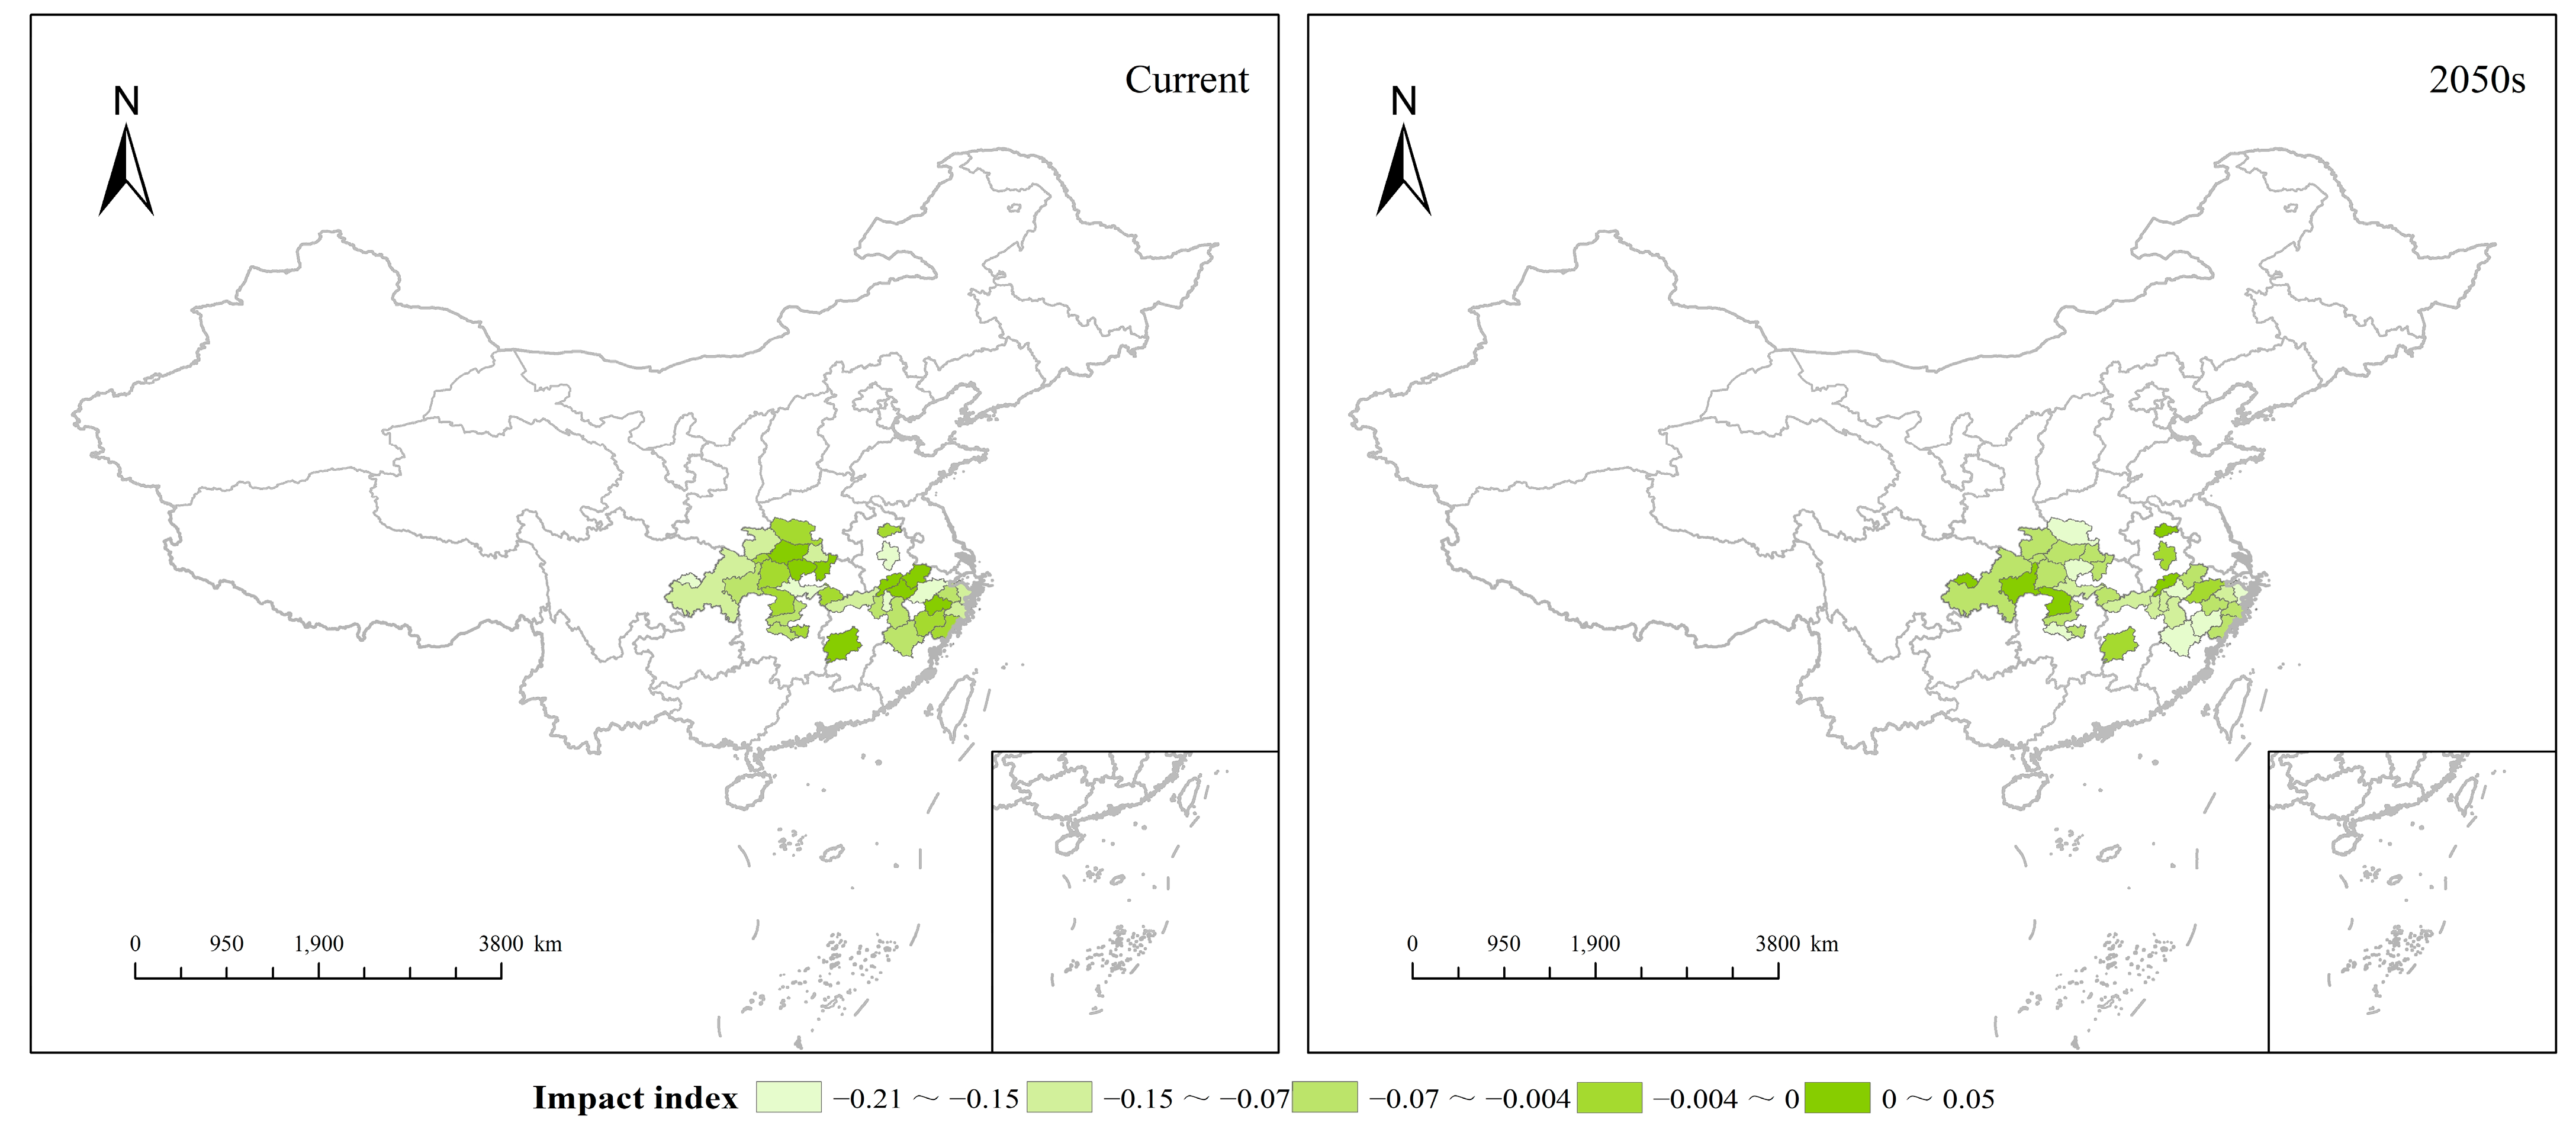
3.5. Temporal and Spatial Effects of F. insularis Wood on H. miconioides

Environmental changes and human activities are continuously affecting the spatial patterns of plant species, and the study of their spatial characteristics and driving mechanisms can better protect the survival of endangered plants [43]. We used the GTWR model with the H. miconioides fitness zone index as the dependent variable and the F. insularis fitness zone index as the independent variable. Before running the GTWR model, all the variables need to be standardized to avoid the overfitting phenomenon; the R2 and the corrected R2 are higher than 0.932, which shows that the GTWR regression model can explain the effect of the independent variables on the dependent variable to a high degree. There was spatial differentiation in the influence of the fitness index of F. insularis on H. miconioides at different times (Figure 10). Specifically, the overall influence of the F. insularis biodiversity index on H. miconioides has increased, but the range of the negative high-value areas has changed, and the negative high-value areas which were distributed in the southern part of Shaanxi, the eastern part of Sichuan, and the northern part of Zhejiang in the current environment, moved to the southern part of Henan and the junction between Zhejiang and Anhui in the 2050s; additionally, there was no high-value area in the positive direction, and the low-value area gradually moved to the western part of China.

4. Discussion

The MaxEnt model’s prediction accuracy is mainly determined by a combination of species distribution data and environmental factors involved in model construction [44]. Since H. miconioides mainly grows on cliffs ranging from 600 to 1000 m, not only were factors such as temperature and precipitation taken into account, but three topographic factors were also selected. It can be seen that the environmental factors selected for this study have a strong coupling with the species’ distribution points and could be better applied in a habitat suitability study of the two species.
According to the results for the contribution rate of the evaluation factors, the main factors affecting the living environment of H. miconioides and F. insularis are temperature and precipitation. The study by Rawat et al. [45] similarly found that the environmental factors most affecting endangered species in hilly terrain are temperature and precipitation, which is in agreement with the present study. The distribution of H. miconioides and F. insularis is more dependent on precipitation than factors such as temperature and topography. Precipitation in Driest Quarter (Bio17), a factor contributing up to 52.8% and 49.8%, was the most critical factor influencing the distribution of the fitness zones of H. miconioides and F. insularis. This is in line with Yi’s study [46], which examined the environmental influences on the endangered plant Homonoia riparia in southern China and found that the amount of Precipitation in Driest Quarter (Bio17) was likewise the most critical factor affecting the plant species. When the Precipitation in Driest Quarter (Bio17) exceeded 90 mm, the probability of fitness for H. miconioides increased with the increase in rainfall, and after exceeding 150 mm, the probability of fitness was practically unchanged, which is consistent with the characteristics of H. miconioides as it prefers wet climate in the dry period and is intolerant to flooding. The impact factor curve for F. insularis is similar to that of H. miconioides, and again Precipitation in Driest Quarter (Bio17) shows a decrease in the probability of fitness when it reaches 150 mm.
The present and future suitable areas are distributed in the subtropical climate zone within the range of 20°~40° N in China, and generally, the lower the latitude, the higher the temperature [47].
The prediction results from this study showed that the area which was suitable for H. miconioides was much smaller than that for F. insularis, and the distribution area of F. insularis was wide, but the highly suitable area was mainly concentrated in 25°~30° N, which indicated that the latitude might have some limiting effect on the distribution of F. insularis. Under the 2050 (2040–2060) climate, the potential areas that H. miconioides and F. insularis inhabit would expand, but human impacts on the habitats of both could not be ruled out. Under the future environmental change, the average annual precipitation in China will increase by 0 to 20%, especially in southwest and south China, and the surface temperature in China will increase by 2.7 to 2.9 °C [48]. The area of H. miconioides expansion has shifted significantly towards the west, which may be related to precipitation [49]. In contrast, the lower expansion of F. insularis is most likely related to local socioeconomic development [50]. Yang et al. [51] have studied Magnolia wilsonii, an endangered tree native to China. It has severely declined and become critically endangered in the last few years due to habitat loss and fragmentation. The future environment will be equally favorable for Magnolia wilsonii. The study by Huang et al. [52] Found, that for tall tree species, the future environment will be suitable for their survival and show a trend of expansion in suitable growth areas. These findings are also consistent with the results of this study.
The ecological niche overlap usually reflects the phenomenon that two or more species with similar ecological niches share or competition for common resources when they live in the same space [53]. Due to limited habitat resources, there may be an ecological niche overlap between species in the same geographical area, leading to increased competition among species [54]. The finite nature of resources and the non-isolated existence of individual organisms make competition an inherent part of biology that cannot be eliminated [55]. What should be of concern is not whether competition occurs or not, but rather how the different outcomes of the competition will affect the ecosystem as a whole, and in particular, the impact on species’ coexistence [56]. Mario et al. [57] concluded that the higher the value of ecological niche overlap between plant species and the stronger the response to the same environmental factors, the more intense the competition between species will be. Kermavnar et al. found that the greater the ecological niche overlap, the more intense the interspecific competition in types of forest vegetation [58]. As an endemic and endangered plant in China, the H. miconioides’ survival environment is severe, and in addition to the influence of environmental factors and anthropogenic activities, the influence of competition within its geographical distribution should also be considered [59,60].
The spatial distribution of the fitness Index of F. insularis, the main competitive species of H. miconioides, was highly and negatively correlated with H. miconioides. It was found that the negative effect of F. insulari’ fitness index on H. miconioides gradually increased, and the area of influence was gradually shifted to the east, and the shift in the area of competition was mostly caused by environmental and anthropogenic disturbances [61]. Future environments will result in an eastward shift in F. insularis’ habitat and a westward shift oinf H. miconioides’ habitat, thus slowing the pressure on western H. miconioides’ survival. In the Çoban study [62], a model of the current and potential future distribution of Quercus libani Olivier, a tree species in Turkey, was created to predict changes in its geographical distribution under different climate change scenarios, Quercus libani Olivier will also migrate westward in the future. For plant interspecific competitive relationships, Ma et al. [63]. argued that competitive suppression in plants leads to the severe impairment of nutritional and reproductive growth in vulnerable species and a significant reduction in their survival. Forest management practices can have a significant impact on woody plants in forests, and over-harvesting has led to the destruction of forest habitats, thus causing damage to the balance of forest ecosystems [64,65]. Environmental changes will lead to an expansion in the growing ranges of H. miconioides and F. insularis, which will cause an increase in the ecological niche overlap, and competition is likewise likely to be more intense. For other competing species, competition may become more intense under future environmental conditions. Through our research, we found that the future survival of Hepatica is also not optimistic. Therefore, we suggest 1. establishing nature reserves 2. promoting ecological restoration and habitat protection, and 3. conducting scientific research and monitoring.

5. Conclusions

In this study, temperature and precipitation were found to be the main environmental factors affecting H. miconioides and F. insularis, with the key environmental factor being Precipitation in Driest Quarter (Bio17). The current and future suitable growing environments of H. miconioides and F. insularis are both located in the southern part of China, and the suitable areas for both will increase in future environments. The growth area of F. insularis practically covers the survival space of H. miconioides, and their ecological niche overlap and geographic distribution overlap are at a high degree in the present and the future, with significant competition, and in the future, F. insularis will further affect the survival of H. miconioides in time and space, but the area of influence will be shifted. The future is grim for the endangered species H. miconioides, and although environmental conditions will be more suitable for H. miconioides in the future, the impacts of competing species and human activities cannot be ignored. Research work on H. miconioides is important because: 1. It can promote the sustainable development of the ecological environment and strengthen the protection and restoration of theecological environmental. 2. It also helps to promote the sustainable development of the economy; H. miconioides are not only conducive to the maintenance of the ecological balance, but also an important ornamental plant. 3. The protection of rare and endangered plants also contributes to the sustainable development of society. The protection of rare and endangered plants requires extensive social participation and support, which can enhance public awareness of protection and social participation and promote the harmonious development of society.

Author Contributions

M.L. and L.L.: Funding acquisition, Writing—Review and editing. L.J.: Conceptualization, Methodology, Software. F.W.: Writing—Original draft. All authors have read and agreed to the published version of the manuscript.

Funding

This work was supported by the National Natural Science Foundation of China (31760135) for providing financial support.

Institutional Review Board Statement

Not applicable.

Informed Consent Statement

Not applicable.

Data Availability Statement

The data supporting the findings of this study were derived from climate data and future climate data from the World Climate Database 2.0 (http://www.worldclim.org/ (accessed on 30 November 2023)), Slope and slope direction data from Geospatial Data Cloud (https://www.gscloud.cn/ (accessed on 30 November 2023)), Land use data from the Ministry of Natural Resources (http://wwww.ngcc.cn (accessed on 30 November 2023) NDVI (vegetation cover) data from the Data Center for Resource and Environmental Sciences, Chinese Academy of Sciences (http://www.resdc.cn (accessed on 30 November 2023)).

Acknowledgments

The authors thank technicians Kailiang and Zhao for their valuable contributions to this work.

Conflicts of Interest

The authors declare no conflicts of interest.

References

  1. Martorell, C.; Freckleton, R.P. Testing the roles of competition, facilitation and stochasticity on community structure in a species-rich assemblage. J. Ecol. 2013, 102, 74–85. [Google Scholar] [CrossRef]
  2. Zhai, L.; Xie, R.; Li, S.; Zhang, Z. Effects of Nitrogen and Plant Density on Competition between Two Maize Hybrids Released in Different Eras. Agron. J. 2017, 109, 2670. [Google Scholar] [CrossRef]
  3. You, Y.; Wang, J.; Huang, X.; Tang, Z.; Liu, S.; Sun, O.J. Relating microbial community structure to functioning in forest soil organic carbon transformation and turnover. Ecol. Evol. 2014, 4, 633–647. [Google Scholar] [CrossRef] [PubMed]
  4. Yi, X.; Huang, Y.; Ma, M.; Wen, Z.; Chen, J.; Chen, C.; Wu, S. Plant trait-based analysis reveals greater focus needed for mid-channel bar downstream from the Three Gorges Dam of the Yangtze River. Ecol. Indic. 2020, 111, 105950. [Google Scholar] [CrossRef]
  5. Buonincontri, M.P.; Luciano, B.; Smeraldo, S.; Chiusano, M.L.; Pasta, S.; Pasquale, G. Shedding light on the effects of climate and anthropogenic pressures on the disappearance of Fagus sylvatica in the Italian lowlands: Evidence from archaeo-anthracology and spatial analyses. Sci. Total Environ. 2023, 877, 162893. [Google Scholar] [CrossRef]
  6. Kress, W.J.; Krupnick, G.A. Lords of the biosphere: Plant winners and losers in the Anthropocene. Plants People Planet 2022, 4, 350–366. [Google Scholar] [CrossRef]
  7. Trtikova, M. Effects of competition and mowing on growth and reproduction of the invasive plant Erigeron annuus at two contrasting altitudes. Bot. Helv. 2009, 119, 1–6. [Google Scholar] [CrossRef]
  8. Remya, K.; Ramachandran, A.; Jayakumar, S. Predicting the current and future suitable habitat distribution of Myristica dactyloides gaertn. using maxent model in the eastern ghats, India. Ecol. Eng. 2015, 82, 184–188. [Google Scholar] [CrossRef]
  9. Jones, M.C.; Cheung, L. Multi-model ensemble projections of climate change effects on global marine biodiversity. Ices J. Mar. Sci. 2015, 72, 741–752. [Google Scholar] [CrossRef]
  10. Subedi, T.R.; Peréz-García, J.M.; Gurung, S.; Baral, H.S.; Virani, M.Z.; Sah, S.A.M.; Anadón, J.D. Global range dynamics of the bearded vulture (Gypaetus barbatus) from the last glacial maximum to climate change scenarios. Ibis 2023, 165, 403–419. [Google Scholar] [CrossRef]
  11. Boussouf, S.; Fernández, T.; Hart, A.B. Landslide susceptibility mapping using maximum entropy (MaxEnt) and geographically weighted logistic regression (GWLR) models in the Río Aguas catchment (Almería, SE Spain). Nat. Hazards 2023, 117, 207–235. [Google Scholar] [CrossRef]
  12. Zheng, S.M.; Feng, W.Q.; Wang, S.Q. Elastic properties of high entropy alloys by MaxEnt approach-ScienceDirect. Comput. Mater. Sci. 2018, 142, 332–337. [Google Scholar] [CrossRef]
  13. Zhao, Y.; Deng, X.; Xiang, W.; Chen, L.; Ouyang, S. Predicting potential suitable habitats of Chinese fir under current and future climatic scenarios based on Maxent model. Ecol. Inform. 2021, 64, 101393. [Google Scholar] [CrossRef]
  14. Zhou, Y.; Zhang, Z.; Zhu, B.; Cheng, X.; Liu, Y.; Gao, M.; Kong, R. MaxEnt Modeling Based on CMIP6 Models to Project Potential Suitable Zones for Cunninghamia lanceolata in China. Forests 2021, 12, 752. [Google Scholar] [CrossRef]
  15. Gao, Z.; Hou, Y.; Zaitchik, B.F.; Chen, Y.; Chen, W. A Two-Step Integrated MLP-GTWR Method to Estimate 1 km Land Surface Temperature with Complete Spatial Coverage in Humid, Cloudy Regions. Remote Sens. 2021, 13, 971. [Google Scholar] [CrossRef]
  16. Wang, H.; Zhang, B.; Liu, Y.; Xu, S.; Zhao, Y.; Chen, Y.; Hong, S. Urban expansion patterns and their driving forces based on the center of gravity-GTWR model: A case study of the Beijing-Tianjin-Hebei urban agglomeration. J. Geogr. Sci. 2020, 30, 297–318. [Google Scholar] [CrossRef]
  17. Wu, C.; Ren, F.; Hu, W.; Du, Q. Multiscale geographically and temporally weighted regression: Exploring the spatiotemporal determinants of housing prices. Int. J. Geogr. Inf. Sci. 2018, 33, 489–511. [Google Scholar] [CrossRef]
  18. Zhang, K.; Leeuw, G.D.; Yang, Z.; Chen, X.; Jiao, J. The Impacts of the COVID-19 Lockdown on Air Quality in the Guanzhong Basin, China. Remote Sens. 2020, 12, 3042. [Google Scholar] [CrossRef]
  19. Lu, H.P.; Cai, Y.W.; Chen, X.Y.; Zhang, X.; Gu, Y.J.; Zhang, G.F. High RAPD but no cpDNA sequence variation in the endemic and endangered plant, Heptacodium miconioides Rehd. (Caprifoliaceae). Genetica 2006, 128, 409–417. [Google Scholar] [CrossRef]
  20. Jin, Z.X.; Zhang, W.B. The quantitative relation of intraspecific and interspecific competition in endangered plant Heptacodium miconioides. Bulltin Bot. Res. 2004, 24, 53–58. [Google Scholar]
  21. Lobo, J.M.; Jiménez-Valverde, A.; Real, R. AUC: A misleading measure of the performance of predictive distribution models. Glob. Ecol. Biogeogr. 2008, 17, 145–151. [Google Scholar] [CrossRef]
  22. Liu, P.; Yang, Y.S.; Xu, G.; Hao, C. Physiological response of rare and endangered seven-son-flower (Heptacodium miconioides) to light stress under habitat fragmentation. Environ. Exp. Bot. 2006, 57, 32–40. [Google Scholar] [CrossRef]
  23. LaRue, M.A.; Nielsen, C.K. Modelling potential dispersal corridors for cougars in midwestern North America using least-cost path methods. Ecol. Model. 2007, 212, 372–381. [Google Scholar] [CrossRef]
  24. Su, K.; Yu, Q.; Yue, D.; Zhang, Q.; Sun, X. Simulation of a forest-grass ecological network in a typical desert oasis based on multiple scenes. Ecol. Model. 2019, 413, 108834. [Google Scholar] [CrossRef]
  25. Javier, O.; Ari, A.H.; Encinas, M.A.; Francisco, P.; Raghava, G.P.S. Assessing the Primary Data Hosted by the Spanish Node of the Global Biodiversity Information Facility (GBIF). PLoS ONE 2013, 8, e55144. [Google Scholar]
  26. Harte, J.; Newman, E.A. Maximum information entropy: A foundation for ecological theory. Trends Ecol. Evol. 2014, 29, 384–389. [Google Scholar] [CrossRef] [PubMed]
  27. Kafash, A.; Ashrafi, S.; Yousefi, M. Modeling habitat suitability of bats to identify high priority areas for field monitoring and conservation. Environ. Sci. Pollut. Res. 2022, 29, 25881–25891. [Google Scholar] [CrossRef]
  28. Mishra, S.N.; Gupta, H.S.; Kulkarni, N. Impact of climate change on the distribution of Sal species. Ecol. Inform. 2021, 61, 101244. [Google Scholar] [CrossRef]
  29. Yang, F.; He, D.H. Effects of habitat fragmentation on biodiversity. Annu. Rev. Ecol. Evol. Syst. 2003, 34, 487–515. [Google Scholar]
  30. Soares, J.R.S.; Ramos, R.S.; Silva, R.S.D.; Neves, D.V.C.; Picano, M.C. Climate change impact assessment on worldwide rain fed soybean based on species distribution models. Trop. Ecol. 2021, 62, 612–625. [Google Scholar] [CrossRef]
  31. Yuan, Y.; Tang, X.; Liu, M.; Liu, X.; Tao, J. Species distribution models of the Spartina alterniflora loisel in its origin and invasive country reveal an ecological niche shift. Front. Plant Sci. 2021, 12, 2159. [Google Scholar] [CrossRef] [PubMed]
  32. Xu, W.; Du, Q.; Yan, S.; Cao, Y.; Liu, X.; Guan, D.X.; Ma, L.Q. Geographical distribution of as-hyperaccumulator Pteris vittata in China: Environmental factors and climate changes. Sci. Total Environ. 2022, 803, 149864. [Google Scholar] [CrossRef] [PubMed]
  33. Ngarega, B.K.; Masocha, V.F.; Schneider, H. Forecasting the effects of bioclimatic characteristics and climate change on the potential distribution of Colophospermum mopane in southern Africa using Maximum Entropy (Maxent). Ecol. Inform. 2021, 65, 101419. [Google Scholar] [CrossRef]
  34. Arlinghaus, R.; Lucas, J.; Weltersbach, M.S.; Kmle, D.; Strehlow, H.V. Niche overlap among anglers, fishers and cormorants and their removals of fish biomass: A case from brackish lagoon ecosystems in the southern baltic sea. Fish. Res. 2021, 238, 105894. [Google Scholar] [CrossRef]
  35. Bellamy, C.; Boughey, K.; Hawkins, C.; Reveley, S.; Spake, R.; Williams, C.; Altringham, J.A. sequential multi-level framework to improve habitat suitability modelling. Landsc. Ecol. 2020, 35, 1001–1020. [Google Scholar] [CrossRef]
  36. Zhou, X.; Yu, Y.; Yang, F.; Shi, Q. Spatial-temporal heterogeneity of green innovation in China. J. Clean. Prod. 2021, 282, 124464. [Google Scholar] [CrossRef]
  37. Chen, Y.; Tian, W.; Zhou, Q.; Shi, T. Spatiotemporal and driving forces of ecological carrying capacity for high-quality development of 286 cities in China. J. Clean. Prod. 2021, 293, 126186. [Google Scholar] [CrossRef]
  38. Cui, L.; Li, R.; Zhang, Y.; Meng, Y.; Zhao, Y.; Fu, H. A geographically and temporally weighted regression model for assessing intra-urban variability of volatile organic compounds (vocs) in Yangpu district, Shanghai. Atmos. Environ. 2019, 213, 746–756. [Google Scholar] [CrossRef]
  39. Warren, D.L.; Seifert, S.N. Ecological niche modeling in maxent: The importance of model complexity and the performance of model selection criteria. Ecol. Appl. 2011, 21, 335–342. [Google Scholar] [CrossRef]
  40. Sarma, K.; Krishna, M.; Tripathi, O.P. Predicting suitable habitats for the vulnerable eastern hoolock gibbon, hoolock leuconedys, in india using the maxent model. Folia Primatol. 2015, 86, 387–397. [Google Scholar] [CrossRef]
  41. Lautenschleger, A.; Vizentin-Bugoni, J.; Cavalheiro, L.B.; Iserhard, C.A. Morphological matching and phenological overlap promote niche partitioning and shape a mutualistic plant-hawkmoth network. Ecol. Entomol. 2021, 46, 292–300. [Google Scholar] [CrossRef]
  42. Verdú, J.R.; Oliva, D.; Victoria, C.G.G.; Cortez, V. Differential ecophysiological syndromes explain the partition of the thermal niche resource in coexisting eucraniini dung beetles. Ecol. Entomol. 2022, 47, 689–702. [Google Scholar] [CrossRef]
  43. Thuiller, W.; Richardson, D.M.; Rouget, M.; Proche, K.; Wilson, J.R.U. Interactions between environment, species traits, and human uses describe patterns of plant invasions. Ecology 2006, 87, 1755–1769. [Google Scholar] [CrossRef]
  44. Robert, P.; Anderson, A.B.; Israel, G.J.A. Species-specific tuning increases robustness to sampling bias in models of species distributions: An implementation with maxent. Ecol. Model. 2011, 222, 2796–2811. [Google Scholar]
  45. Rawat, N.; Purohit, S.; Painuly, V.; Negi, G.S.; Bisht, M.P.S. Habitat distribution modeling of endangered medicinal plant Picrorhiza kurroa (Royle ex Benth) under climate change scenarios in Uttarakhand Himalaya, India. Ecol. Inform. 2022, 68, 101550. [Google Scholar] [CrossRef]
  46. Yi, Y.J.; Cheng, X.; Yang, Z.F.; Zhang, S.H. Maxent modeling for predicting the potential distribution of endangered medicinal plant (H. riparia Lour) in Yunnan, China. Ecol. Eng. 2016, 92, 260–269. [Google Scholar] [CrossRef]
  47. Huntley, B. How plants respond to climate change: Migration rates, individualism and the consequences for plant communities. Ann. Bot. 1991, 67, 15–22. [Google Scholar] [CrossRef]
  48. Yang, J.T.; Jiang, X.; Chen, H.; Jiang, P.; Liu, M.; Huang, Y. Predicting the potential distribution of the endangered plant magnolia wilsonii using maxent under climate change in China. Pol. J. Environ. Stud. 2022, 31, 4435–4445. [Google Scholar] [CrossRef]
  49. Jiang, D. Climate change over China with a 2 °C global warming. Chin. J. Atmos. Ences 2012, 10, 121–122. [Google Scholar]
  50. Zhang, B.; Cadotte, M.W.; Chen, S.; Tan, X.; Han, X. Plants alter their vertical root distribution rather than biomass allocation in response to changing precipitation. Ecology 2019, 100, e02828. [Google Scholar] [CrossRef]
  51. Brousse, C. A historical and ethnobotanic analysis of the connection between human activities and grassland vegetation. Fourrages 2011, 208, 245–251. [Google Scholar]
  52. Huang, Y.; Zeng, Y.; Jiang, P.; Chen, H.; Yang, J. Prediction of potential geographic distribution of endangered relict tree species Dipteronia sinensis in China based on maxent and gis. Pol. J. Environ. Stud. 2022, 31, 3597–3609. [Google Scholar] [CrossRef]
  53. Steinmüller, K. A model of niche overlap and interaction in ecological systems. Biom. J. 2011, 22, 211–228. [Google Scholar] [CrossRef]
  54. Geange, S.W.; Pledger, S.; Burns, K.C.; Shima, J.S. A unified analysis of niche overlap incorporating data of different types. Methods Ecol. Evol. 2011, 2, 175–184. [Google Scholar] [CrossRef]
  55. Nunes, L.A.; Pearson, R.G. A null biogeographical test for assessing ecological niche evolution. J. Biogeogr. 2017, 44, 1331–1343. [Google Scholar] [CrossRef]
  56. Fackovcova, M.G.A. Ecological niche conservatism shapes the distributions of lichens: Geographical segregation does not reflect ecological differentiation. Preslia 2017, 89, 63–85. [Google Scholar] [CrossRef]
  57. Suárez-Mota, M.E.; Villaseor, J.L. Ecological niche overlap among species of the genus Zaluzania (Asteraceae) from the dry regions of Mexico. Plant Ecol. Evol. 2020, 153, 337–347. [Google Scholar] [CrossRef]
  58. Kermavnar, J.; Kutnar, L.; Marinsek, A.; Babij, V. Are ecological niche optimum and width of forest plant species related to their functional traits? Flora 2023, 301, 152247. [Google Scholar] [CrossRef]
  59. Poloczanska, E.S.; Hawkins, S.J.; Southward, A.J.; Burrows, M.T. Modeling the response of populations of competing species to climate change. Ecology 2008, 89, 3138–3149. [Google Scholar] [CrossRef]
  60. Wang, W.; Shen, J.; Luo, Z. Partial survival and extinction in two competing species with impulses. Nonlinear Anal. Real World Appl. 2009, 10, 1243–1254. [Google Scholar] [CrossRef]
  61. López-Gómez, J. Coexistence and meta-coexistence for competing species. Houst. J. Math. 2003, 29, 483–536. [Google Scholar]
  62. Çoban, H.O.; Ömer, K.Ö.; Arslan, E.S. MaxEnt Modeling for Predicting the Current and Future Potential Geographical Distribution of Quercus libani Olivier. Sustainability 2020, 12, 2671. [Google Scholar] [CrossRef]
  63. Ma, X.; Li, A.; Dong, X.P.; Cai, Y.; Ma, M. The Interspecific Competition of Xanthium italicum Moretti Significantly Reduces the Growth of Helianthus annuus and the Yield and Quality of Its Seeds. Pol. J. Environ. Stud. 2023, 32, 199–206. [Google Scholar] [CrossRef]
  64. Dang, T.K.P. The Discourse of Forest Cover in Vietnam and Its Policy Implications. Sustainability 2022, 14, 10976. [Google Scholar] [CrossRef]
  65. Pasquale, G.D.; Saracino, A.; Bosso, L.; Russo, D.; Allevato, E. Coastal pine-oak glacial refugia in the Mediterranean basin: A biogeographic approach based on charcoal analysis and spatial modelling. Forests 2020, 11, 673. [Google Scholar] [CrossRef]
Figure 1. Locations from occurrence records of H. miconioides and F. insularis in China.
Sustainability 16 00752 g001
Figure 2. Heat map of environmental variable correlations.
Sustainability 16 00752 g002
Figure 3. AUC of the MaxEnt.
Sustainability 16 00752 g003
Figure 4. The jackknife test results for environmental factors affecting Heptacodium miconioides (A) and Fraxinus insularis (B) (ALL stands for all variables gain).
Sustainability 16 00752 g004
Figure 5. Response curves for the probability of the presence of variables affecting H. miconioides (A) and F. insularis (B).
Sustainability 16 00752 g005
Figure 6. Potential suitable areas of H. miconioides (A) and F. insularis (B) under current climate in China.
Sustainability 16 00752 g006
Figure 7. Potential Distribution of Heptacodium miconioides (A) and Fraxinus insularis (B) under future climates.
Sustainability 16 00752 g007
Figure 8. Changes in the potential geographical distribution of H. miconioides (A) and F. insularis (B) under climate change scenarios.
Sustainability 16 00752 g008
Figure 9. Overlapping survival areas between Heptacodium miconioides and Fraxinus insularis.
Sustainability 16 00752 g009
Figure 10. Spatial distribution of GTWR model’s regression coefficient.
Sustainability 16 00752 g010
Table 1. Four emission scenarios.
EmissionDescription
SSP1–2.6SSP1 (Low forcing scenario) Upgrade to RCP2.6 scenario based on (Radiative forcing reaches 2.6 W/m2 in 2100)
SSP2–4.5SSP2 (Medium forcing scenario) Upgrade to RCP4.5 scenario based on (Radia-tive forcing reaches 4.5 W/m2 in 2100)
SSP3–7.0SSP3 (Medium forcing scenario) New RCP7.0 emission path based on (Radia-tive forcing will reach 7.0 W/m2 in 2100)
SSP5–8.5SSP5 (High Forcing Scenario) Upgrade to RCP8.5 scenario based on (SSP5 is the only SSP scenario that can achieve radiative forcing to 8.5 W/m2 in 2100)
Table 2. Environmental data used in the research.
CodeDescription
Bio1Annual Mean Temperature (°C)
Bio2Mean Diurnal Range (Mean of monthly (max temp–min temp)) (°C)
Bio3Isothermality (BIO2/BIO7) (×100)
Bio4Temperature Seasonality (standard deviation × 100)
Bio7Temperature Annual Range (°C)
Bio8Mean Temperature in Wettest Quarter (°C)
Bio9Mean Temperature in Driest Quarter (℃)
Bio12Annual Precipitation (mm)
Bio13Precipitation in Wettest Month (mm)
Bio15Precipitation Seasonality (Coefficient of Variation)
Bio17Precipitation in Driest Quarter (mm)
Bio19Precipitation in Coldest Quarter (mm)
WindWind speed (m·s−1)
VaprWater vapor pressure (kPa)
SradSolar radiation (kJ·m−2·day−1)
ElevElevation (m)
SloSlope (°)
AspAspect
LuccLand-Use and Land-Cover Change
NdviNormalized Difference Vegetation Index
Table 3. Contribution rate of main environmental impact factors (Selected in the table are the top four contributing environmental variables).
Species Environmental FactorsContribution Rate
H. miconioidesPrecipitation of Driest Quarter 52.8%
Temperature Seasonality13.1%
Water Vapor Pressure10.4%
Mean Temperature of Driest Quarter3.5%
F. insularisPrecipitation of Driest Quarter 49.8%
Water vapor pressure 23.9%
Temperature Seasonality 4.4%
Annual Precipitation 3.6%
Table 4. Potential distribution areas of Heptacodium miconioides R. (A) and Fraxinus insularis H. (B) under current climate conditions (×104 km2).
SpeciesSSP1–2.6SSP2–4.5SSP3–7.0SSP5–8.5
Unsuitable areaA462.05428.26369.51519.26
B283.01290.31267.74328.81
Poorly suitable areaA240.96239.14236.06242.41
B262.17228.09234.05224.74
Moderately suitable areaA161.66180.09198.52136.42
B230.31239.81236.06234.91
Highly suitable areaA95.33112.51155.9161.91
B184.51201.79222.15171.54
Table 5. Potential distribution areas of Heptacodium miconioides (A) and Fraxinus insularis (B) under 2050s climate scenarios (×104 km2).
SpeciesSSP1–2.6SSP2–4.5SSP3–7.0SSP5–8.5
Unsuitable areaA377.37389.85362.11458.21
B262.65270.33255.74299.71
Poorly suitable areaA218.97223.58216.09335.39
B244.89244.89239.81215.42
Moderately suitable areaA196.32211.98201.12135.07
B186.55195.47183.27220.03
Highly suitable areaA167.34134.59180.68131.33
B266.01249.31281.18224.84
Table 6. Niche overlap and range overlap between H. miconioides and F. insularis.
TimeNiche OverlapRange Overlap
DI
Current0.72610.91880.5351
2050s0.80480.95510.6209
Disclaimer/Publisher’s Note: The statements, opinions and data contained in all publications are solely those of the individual author(s) and contributor(s) and not of MDPI and/or the editor(s). MDPI and/or the editor(s) disclaim responsibility for any injury to people or property resulting from any ideas, methods, instructions or products referred to in the content.

