Abstract
This study indicates that the volume and distribution of critical minerals’ final destination are essential for an objective decision to create a circular flow of critical minerals from national security and circular economy aspects in mineral resources policy. We demonstrate the estimation of critical minerals’ final destination and propose a decision flow framework to identify the prioritized products and their parts to be reused or recycled. We conclude that policymakers need to consider the final destination of critical minerals, not their economic importance or intermediate volumes or distributions alone, to implement effective actions to ensure critical minerals’ circularity. This study estimates the final destination of several critical minerals (lithium, cobalt, yttrium, lanthanum, cerium, neodymium and dysprosium) and base metals (iron, copper and aluminum) in the Japanese economy for 2015. A uniquely expanded and the latest input–output table is used for the estimation. The results reveal a detailed distribution of critical minerals and indicate prioritized implementation for creating and maintaining domestic and international circular flows of critical minerals. The developed decision flow framework provides a practical approach to national security and circular economy aspects for policymakers. For further actions, inclusive indicator development is required for policymakers to support the determination of implementation possibilities from social and technological aspects.
1. Introduction
Many countries have policy documents to secure mineral resources. These countries define the critical minerals for their national economies based on their expert judgment and uniquely developed methodologies (e.g., Australia [1], Canada [2] the European Union (EU) [3], Japan [4,5], Korea [6], the United Kingdom (UK) [7] and the United States (US) [8]). The policy documents have mainly focused on national security; however, recycling became one of the vital policy implementations both for national security and waste management after the late 2000s [9,10,11,12]. The EU, France, Germany, Japan, Korea, Spain and the UK emphasize recycling post-consumer products as a circular economy strategy to provide secondary materials for the cleaner production of raw materials in their mineral resources policies [6,13,14,15,16,17,18]. The low self-sufficient ratio of mineral resources is a background for such a compositive mineral resources policy.
After the Ellen MacArthur Foundation proposed a practical circular economy concept [19], many policymakers and researchers have covered it. Some review papers indicate that recycling is one of the circular economy strategies [20,21,22]. Circular economy strategies, also called circular actions, generally consist of reducing, reusing, repairing, refurbishing, remanufacturing, repurposing, recycling, recovering, etc. Recycling is defined as a strategy contributing to a value recovery and one of the circular economy strategies [23]. In the circular economy concept, people are required to maintain a circular flow of resources by recovering, retaining, or adding to their value while contributing to sustainable development. Christmann (2021) suggests that people need to act on developing a circular economy to reduce demand for primary minerals and metals, which are sourced from mines, secondary minerals and metals gained from recycling, for mineral resource governance in the 21st century [24]. Watari et al. (2020) show that recycling has been heavily examined as a circular economy strategy for critical materials in a review of 88 studies [25]. The objectives of mineral resources policy increasingly include recycling as a circular economy strategy as well as an aspect of traditional national security.
Recycling is not necessarily highly prioritized in the hierarchy of circular economy strategies [22,26]. Recycling, however, is a significant strategy next to the other circular economy strategies, such as remanufacturing, refurbishing, repairing, and reusing, from the perspective of mineral resources policy. Most studies on critical minerals focus on end-of-life recycling [25]. In the short term, the prioritized strategies, like reusing, are the opposite of recycling, since the more reusing is promoted, the less recycling occurs. All products reach a point when reusing is no longer possible and it is desirable to recycled the product efficiently rather than dispose of it. Recycling, including partial disposal, is required as a backup to the reusing system [27].
Post-consumer products containing many elements have been initially revalued as the secondary deposit of critical minerals, so-called “urban mining” [28,29,30]. The UNEP revealed the recycling rates of many metals in post-consumer products and proposes the importance of recycling [31,32,33]. Governments have not actively promoted the recycling of critical minerals for their national economies. In the case of Japan, the government has promoted the “3Rs (reducing waste generation, reusing and recycling)” concept in their legal system for the efficient use of mineral resources and waste management [34,35,36,37,38]. Based on the governmental research of materials flow analysis, these legal schemes do not improve the recovery of critical minerals for the Japanese economy [39,40,41]. Only some base metals (e.g., iron, aluminum and copper) and valuable metals (e.g., gold, silver, platinum and palladium) are highly recovered. The EU region also has a similar situation [42]. Commercially efficient recycling generally depends on the extensive collection of recyclable post-consumer products using abundant base metals and having high grades of valuable metals. Legal systems are required to support the extensive collection of post-consumer products and the development of advanced recycling technologies, such as comminution, dismantling, separation and sorting processes, for critical minerals.
The current mineral resources policy aims to cover multiple goals, such as national security and circular economy; however, the implementations do not coincide with the objectives in a circular economy context. The EU examined a detailed estimation of critical minerals landfilled; it did not identify prioritized post-consumer products and their parts to be collected and recycled [43]. The current mineral resources policies do not consider the quantitative potential of a secondary supply and the priority of post-consumer products and their parts to be collected and recycled in their documents. Policymakers need to adopt a comprehensive policy approach to transition from a linear economy to a circular economy besides national security. A decision-making tool is required for the circular flow of critical minerals as well as a criticality assessment to determine the critical minerals.
We quantitatively estimate the final destination of critical minerals as an annually accumulated social stock for a future secondary supply. We aim to show prioritized post-consumer products for recycling and other circular economy strategies. We use an input–output model to estimate the quantitative volume of critical minerals in the stock and the flow of intermediate and final products. The same model was adopted to estimate the quantitative volume of the final destination of some materials and elements [44,45,46,47]. The quantitative estimation of the final destination for battery materials (e.g., lithium and cobalt) and rare earths has rarely been examined with an input–output analysis to discuss mineral resources policy from an energy transitioning perspective. The methodology of this study is based on the input–output approach using a uniquely expanded input–output table. We adopt the latest high-resolution input–output table for the estimation, which the Japanese government provides. This study applies and discusses Japan’s case for the year 2015.
This study proposes a new decision flow framework of mineral resources policy for the circular flow of critical minerals based on the estimation of these critical minerals’ final destination.
2. Materials and Methods
2.1. Element Selection of Critical Minerals
Ten elements, lithium, cobalt, yttrium, lanthanum, cerium, neodymium, dysprosium, iron, copper and aluminum, were selected for analysis. Lithium and cobalt are significant elements as the raw materials for lithium-ion batteries in terms of energy storage. Lanthanum, neodymium and dysprosium are also significant for electric vehicles, wind turbines and other generators or motors from efficient power source aspects. The other elements were selected as references. Iron, copper and aluminum are abundantly consumed as primary materials. Yttrium and cerium are the major elements of rare earths next to the above rare earth elements. In this paper, “critical mineral” includes metallic and non-metallic elements, which are compounds or alloys in many cases [48].
2.2. Input–Output Analysis
This study was performed using an originally expanded input–output (IO) table to estimate the distribution of the selected elements in all consumer goods and infrastructures as social stocks in Japan. In an IO analysis approach, the domestic final demand represents the accumulated volume of such social stocks in a year. Each element’s annual stock volume and distribution are calculated from the domestic final demand volume of goods containing the selected elements. The WIO-MFA model provides a methodology to estimate the physical volume of elements distributed in the social stocks as the domestic final demand [45,46,47,49,50,51,52,53].
The model uses a hybrid IO table based on both flows of products in monetary units and physical units for analysis. The Ministry of Internal Affairs and Communications, Japan (MIC) provided an original IO table, which presents a 509 by 391 matrix of monetary units for 2015 [54]. The producer price evaluation table (basic classification) was selected from the input–output tables set for this study. The initial IO table is described as a competitive import type in which domestic production and import data are merged in an input. This is helpful for subdividing an import-specific sector from a merged domestic production and import sector.
The initial IO table (509 by 391 matrix in monetary units) was firstly squared down to a 390 by 390 matrix in monetary units and subsequently expanded and converted to a 443 by 443 hybrid square matrix for modeling. In the expanded hybrid IO table, the original 25 sectors were subdivided into 76 new sectors based on several governmental and association statistics [55,56,57,58,59,60,61,62,63,64,65,66] to supplement the low-resolution matrix of the initial IO table for analysis (Table 1). The domestic production volume of the subdivided sectors is according to the physical volume of each sector’s domestic production or import based on the statistics. These subdivided sectors are related to the selected elements such as rare earths, cobalt and lithium mentioned above. The 50 sectors of 76 newly subdivided sectors were converted from monetary to physical units. Each sector’s physical output data are fundamentally based on governmental and association statistics. The unit content ratios of the selected elements for the subdivided sectors are based on statistics, standard specifications, chemical composition formulas and atomic weights. Some subdivided sectors having no reliable statistics refer to hearing information about the relevant industries. Some subdivided sectors, such as scrap cemented carbide and scrap magnet, were included as no-domestic-production sectors in the expanded IO table. The domestic production data of the sectors were not officially or commercially confirmed.

Table 1.
Domestic production of the original and subdivided sectors.
The initial IO table describes the flows of scraps and by-products in Stone’s method. In the method, the generated volume of scraps and by-products is described as minus values and the demanded volume is described as plus values in the row of the IO table. This study converts the total minus values to plus and regards them as the domestic production value of scrap sectors.
The WIO-MFA model applies an inverse matrix (I − A)−1, calculated from the input coefficient matrix A, to analyze the ripple effects of demand changes. This inverse matrix is also called Leontief’s inverse matrix. In the model, the matrix A is multiplied by two filter matrixes, nonquantitative flows such as electricity and services (Φ), and yield losses generated as scrap during production (Γ). These two filter matrices adjust the initial input–output relationships described in monetary units to actual input–output relationships in physical units. The initial input–output relationships described in monetary units do not distinguish nonquantitative flows and yield losses. The filtered input coefficient matrix is calculated as follows:
where is the Hadamard product, which is an element-wise product.
The model categorizes all the sectors into three parts: raw materials, materials as a commodity and products (Table 2). The matrix of material composition of one monetary unit (million Japanese yen) of products () can be expressed by the coefficient matrix for the inputs of materials as a commodity to products () and that for the input of products to products (). The parts categorized as raw materials are not used for the ripple effect calculation in the model.
Table 2.
Subdivided sectors categorized into “raw materials” and “materials as a commodity” in the model.
The volume and distribution of elements in products for a final demand is calculated as follows:
where represents a vector for the final demand k, such as export and domestic final demand, of an element i. This vector is multiplied by a diagonalized composition matrix of the element i () and a hybrid vector of all sectors’ final demand k categorized into products ().
The image of the calculation flow mentioned above is shown in Figure 1.
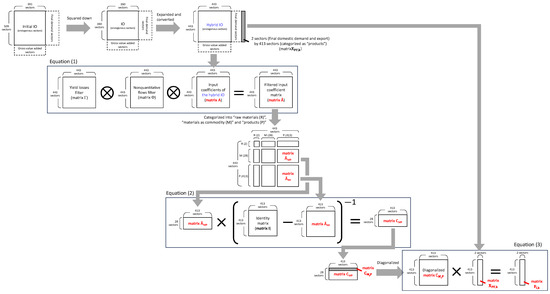
Figure 1.
Calculation flow of critical minerals’ final destinations.
3. Results and Discussion
3.1. Test of the Estimated Element Composition of Products ()
The generated results from the model are compared with actual data [59,66,67,68,69,70]. The column sum of gives the estimated element weight of products per unit (metric tonnage and unit for subdivided sectors and one million Japanese yen for other sectors). In previous research using the WIO-MFA model [45,52], less than one-tenth difference of a decimal place (mass fraction) was recognized as a good similarity for a value with a first decimal place. A difference of two to three-tenths is a good similarity for values with only a second decimal place (mass fraction). For values with only a third or fourth decimal places (mass fraction), a difference of two- to seven-fold is permissible as a good similarity. In the WIO-MFA model, the domestically demanded materials of “materials” sectors spread to the other “products” sectors as the result of ripple effect calculation. The total volume of spread elements to all the other “products” sectors depends on the domestically demanded and imported elements of the “materials” and “products” sectors. Relative differences between the estimated composition and actual data generally become large if the number of significant digits of demanded and imported elements in the “materials” sectors is small. Instead, absolute differences become large in this case because of smaller inputs in the “materials” sectors.
As major intermediate products using battery materials and rare earths, this study selected ternary catalysts, optical lenses, lithium-ion rechargeable batteries, LaCo magnets and NdFeeB magnets to test the correspondence between the estimated composition and the actual data. The estimated composition data on ternary catalysts are quite similar to the actual data (Table 3). The estimated composition data also fall within a permissible level for yttrium, lanthanum and cerium in optical lenses, lithium-ion rechargeable batteries, cemented carbide tools, LaCo magnets and NdFeB magnets.
Table 3.
Comparison between actual data and estimated composition in intermediate goods.
The “Passenger motor cars” sector was also tested as an example of complex final goods using various elements (Table 4). The result generated by the model shows a pretty good similarity to the actual data [68,70]. The estimated content ratio of copper and aluminum differs slightly from the actual data. The copper content is higher than the actual data, and the aluminum content is lower than the actual data. The actual data on copper and aluminum contents are based on the material proportions of dismantled cars collected in 2015 [68]. These end-of-life cars are assumed to be old cars manufactured ten to fifteen years previously if the average lifetime of cars is considered. The copper content has increased according to the automobile’s electrification, such as an increase in wire harnesses, powered windows and power steering. The current copper content of automobiles may have increased compared to the actual data from the early 2000s. The estimated aluminum content is lower than the actual data, even though the use of aluminum has increased in weight-saving aspects. In the expanded IO table, the “Rolled and drawn aluminum” and “Non-ferrous metal castings and forgings” sectors output most aluminum of automobiles to the “Passenger motor cars” sector through “Motor vehicle parts and accessories” and “Internal combustion engines for motor vehicles”, respectively. These input–outputs keep the original relationships between the sectors and are not modified at the expansion of the hybrid IO table. This difference requires an additional survey to analyze it in the future.
Table 4.
Comparison between actual data and estimated composition in passenger motor cars.
The neodymium and dysprosium content ratios are similar to the actual data [70] at the first decimal place (kg per unit). The amount of NdFeB magnets used for automobiles varies with the car types, such as engine displacements and brands. High-graded types and large-engine-displacement cars generally use many NdFeB magnets. The relationship between the type and amount of magnets with automobile types needs additional research and analysis.
Nakamura and Nakajima (2005) and Ohno et al. (2015) examined the estimated material composition of cars for 2000 and 2005 [45,52]. Regarding the content ratio of iron, copper and aluminum, Nakamura and Nakajima (2005) showed 0.877 (Fe), 0.023 (Cu) and 0.085 (Al), respectively (mass fraction). The mass fraction data of each element were not obtained in this study because the cars’ total weight was not estimated; however, each proportion of copper and aluminum to iron is available to test the difference between the previous research and this study. The previous research has not covered other minor elements like rare earths. In Nakamura and Nakajima (2005), the proportions of copper and aluminum to iron were 0.03 and 0.10, respectively. In this study, those proportions of data were calculated as 0.04 and 0.07, which shows quite a good similarity between the previous research and this study.
The estimated element composition and actual data strongly correlate positively (Figure 2). This result indicates that the actual data comprehensively supports the estimated element composition data despite the detailed difference between the estimated and actual data discussed above. The WIO-MFA model and other similar IO analysis models estimate only primary base metals (iron, copper, aluminum, lead and zinc) and additive elements of special steels (manganese, chromium, nickel, molybdenum, niobium, vanadium, tungsten, cobalt, platinum and neodymium) [45,47,51,52,53,73,74,75,76,77,78,79,80,81]. Battery materials and multiple rare earth elements have never been analyzed in an input–output approach. This study initially reveals the element composition, such as lithium, yttrium, lanthanum, cerium and dysprosium, using the input–output approach. The generated element composition data show the stock and flow of selected elements used for final goods as well as intermediate products. The quantitative volume of minor metals in intermediate products was also not estimated, excluding the bottom-up approach for dysprosium [82,83]. The newly estimated composition of some critical minerals contributes to analyzing the circular flow of critical minerals.
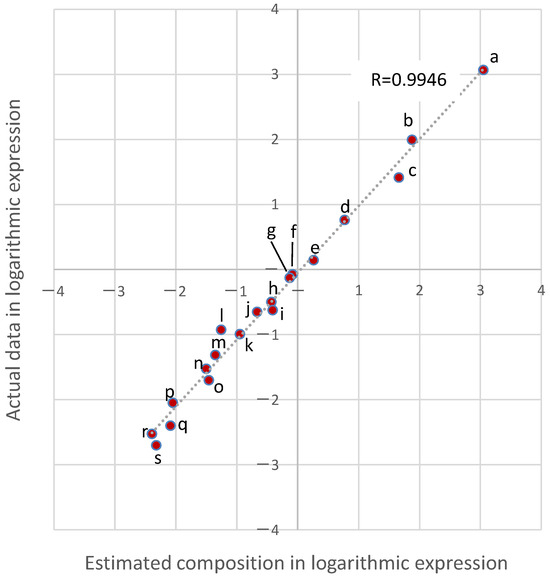
Figure 2.
Correlation between the estimated composition and actual data. Note: The composition of each estimated element and actual data in intermediate goods (Table 3) and automobiles (Table 4) is shown here. In the figure, a: Fe in passenger motor cars; b: Al in passenger motor cars; c: Cu in passenger motor cars; d: Co in lithium-ion rechargeable batteries; e: Li in lithium-ion rechargeable batteries; f: Fe in LaCo magnets; g: Fe in NdFeB magnets; h: Ce in ternary catalysts; i: Nd in passenger motor cars; j: Nd in NdFeB magnets; k: La in LaCo magnets; l: Dy in passenger motor cars; m: Co in cemented carbide tools; n: Dy in NdFeB magnets; o: La in optical lenses; p: Co in LaCo magnets; q: Y in optical lenses; r: La in ternary catalysts; s: Y in ternary catalysts.
3.2. Final Destination (Domestic Final Demand and Export) of Critical Minerals as Annually Accumulated Social Stocks
We estimated the final destination of the selected elements quantitatively with the calculated element composition of products (). The input volume of materials as a commodity (see Table 2) and the estimated volume of final destination (domestic final demand and export) for each selected element are shown in Figure 3. The final destination was larger than each input for copper, aluminum, cobalt, yttrium, lanthanum, neodymium and dysprosium. In particular, the final domestic demand was larger than the input for neodymium and dysprosium. This result indicates that these two rare earth elements have much potential for a secondary supply from post-consumer products and their parts in Japan. The proportion of domestic final demand in the input can show the maximum limitation of the secondary supply in a country at the time. The other selected elements, especially iron, lithium, cobalt and cerium, show a gap between the input and the final domestic demand. This gap means the development of a new primary supply is still required to meet increased demand, and their circular flows are required to expand overseas.
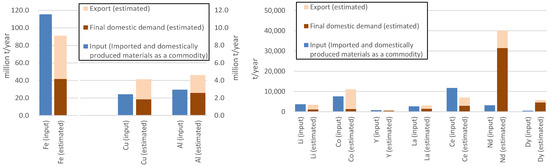
Figure 3.
Input and estimated final domestic demand and export in this study (left: base metals. right: selected critical minerals). Note: “Input” includes imported and domestically produced materials as a commodity for the analysis.
Regarding battery materials, lithium and cobalt are used for lithium-ion rechargeable batteries, which include lithium cathodes and electrolytes, and are predominantly exported to foreign markets (Figure 4). This indicates that domestic recycling minimally impacts securing secondary lithium and cobalt for battery manufacturers in Japan. Considering the lifetime and accumulated volume of lithium-ion rechargeable batteries in the present and future, the primary provision of battery materials is strongly required for the time being. In addition to this viewpoint, the technological trend of cathodes requires consideration in estimating the future stock of recyclable battery materials. Lithium-ion rechargeable battery cathode types vary with the energy and discharge capacities. Lithium-ion rechargeable batteries in the portable electronics market have mainly adopted lithium cobalt oxide (LCO) as a cathode due to its superb energy content per unit volume [72]. Lithium-ion batteries’ energy capacity and ignition danger vary with cathode types [84]. Lithium-ion rechargeable batteries currently use other cathodes, such as lithium nickel–manganese–cobalt oxide (NMC), lithium nickel–cobalt–aluminum oxide (NCA), lithium manganese oxide (LMO) and lithium ferro-phosphate (LFP). The cathode type is generally decided based on the required energy capacity, the cost of raw materials, safety and environmental burdens. Based on the estimated volume of domestically accumulated battery materials and technological trends, policymakers need to consider the possible impacts of policy implementation to promote recycling end-of-life lithium-ion rechargeable batteries. Furthermore, policymakers are required to create intergovernmental cooperation for a global circular flow of lithium-ion batteries since most batteries are exported to foreign countries. In the context of a comprehensive mineral resources policy, the advanced forecast of technical trends of cathode types and the geographically estimated distribution of battery materials are required for policymakers. Nansai et al. (2014) and Nakajima et al. (2018) estimated global distribution for some critical minerals, such as iron, copper, nickel, cobalt, neodymium and platinum, with the WIO-MFA model, but not for lithium [75,77]. For the creation of an international circular flow of critical minerals, the quantitative estimation of overseas destinations is required.
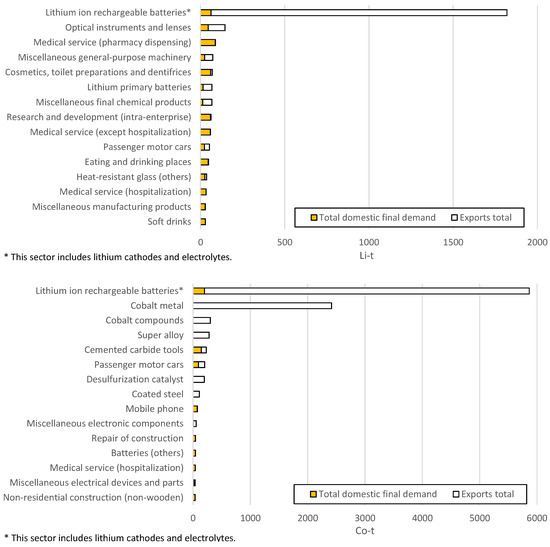
Figure 4.
Estimated domestic final demand of lithium (Li) and cobalt (Co) in Japan for 2015.
Regardless of difficulties in developing the recycling technology and advanced forecasts in cathode types, anode recycling can be recognized as a prioritized issue. Despite varied cathode types, the anode of lithium-ion batteries is typically natural graphite [72]. Natural high-grade graphite occurs predominantly in China [85]. Some countries, like the United States, the European Union and Japan, define graphite as one of their critical minerals [3,4,86]. Recycling graphite has a meaning for national security.
The estimated final destination of rare earth elements (yttrium, lanthanum, cerium, neodymium and dysprosium) depends on their main applications (Figure 5). The applications of rare earth elements are shown in Table 5, which varied with the expected function of each element based on electrons in partially filled 4f orbitals [87]. A common feature of the selected rare earth elements is that passenger motor cars are one of the most highly ranked final destinations as a more significant application. The application of rare earth elements with the most increased demand is permanent magnets [88], which were included as LaCo ferrite magnets and NdFeB magnets in this study. Lanthanum, neodymium and dysprosium increased their demand for permanent magnets because of vehicle electrification, the growth of household electric equipment in developing countries and the growing demand for wind turbines. Dysprosium, one of the heavy rare earth elements, is a rare earth element that improves high-temperature performance and resistance to demagnetization [89], which is used in such rapidly increasing applications as electric vehicles and wind turbines.
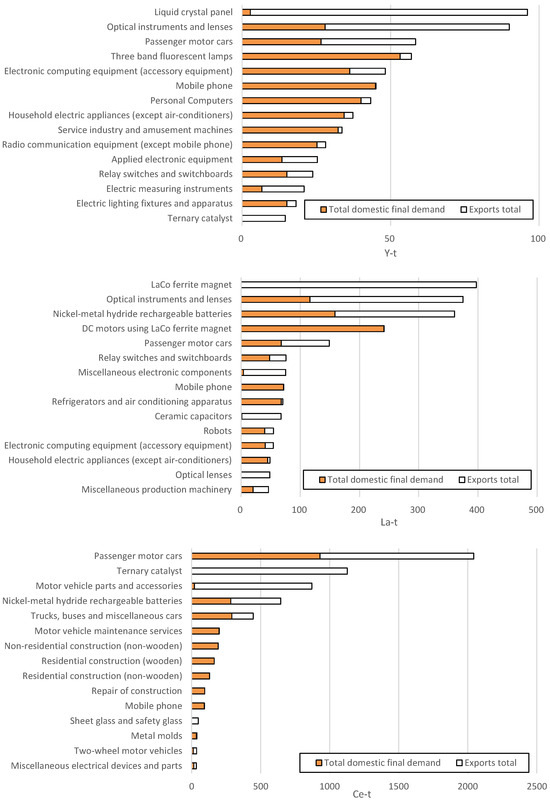
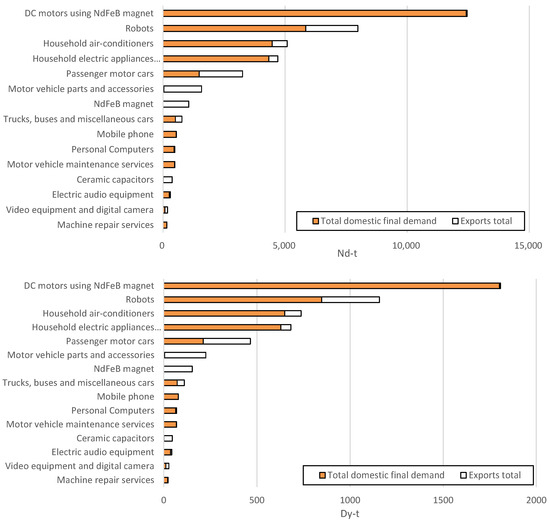
Figure 5.
Estimated domestic final demand of yttrium (Y), lanthanum (La), cerium (Ce), neodymium (Nd) and dysprosium (Dy) in Japan for 2015.
Table 5.
Major applications of rare earth elements.
Of the selected rare earth elements, yttrium and cerium have been generally over-supplied if the material balance is considered between the supply and demand of each rare earth element. Ginya Adachi shows the global demand for each rare earth element for 2008 as 129,175 t in oxide equivalent, with yttrium, lanthanum, cerium, neodymium, and dysprosium accounting for 9.0, 29.9, 32.9, 18.5 and 1.0 (mass fraction in oxide equivalent), respectively [87]. The annual mine production of rare earths is estimated to be 124,000 t in oxide equivalent for 2008 [90]. The largest global rare earth mine is the Baiyan Obo (Baiyun Obo) mine, located in the Inner Mongolia region of China [89]. The grades of each rare earth element in crude ore are 0.20, 26.50, 50.80, 15.40 and 0.10 for yttrium, lanthanum, cerium, neodymium and dysprosium (mass fraction in oxide equivalent), respectively [89,91]. The largest rare earth mines outside China are Mount Weld in Western Australia and Mountain Pass in California [89]. Ota (2010) shows that the grades of each rare earth element in the crude ore of Mount Weld are 0.25 (yttrium), 25.50 (lanthanum), 46.74 (cerium), 18.50 (neodymium) and 0.12 (dysprosium), and the grades of Mount Pass are 0.10 (yttrium), 33.20 (lanthanum), 49.10 (cerium), 12.00 (neodymium) and trace (dysprosium), respectively (mass fraction in oxide equivalent) [91]. Some rare earth elements, like yttrium and cerium, are strongly assumed to be over-supplied.
Rare earth elements are generally regarded as representative critical minerals [2,3,4,6,12,13,86,92]. The global demand volume of total rare earth elements is just 300,000 t in oxide equivalent [85]. This volume is minimal if compared with the production volume of base metals, such as iron, copper and aluminum ores. Considering the tiny market volume of rare earths in the world, the development of new applications is adversely required to balance the supply and demand of each rare earth element and improve the feasibility of newly developed mines. A detailed criticality assessment of each individual rare earth element is needed for further discussion in mineral resources policy.
Table 6 shows the relationship between legally promoted applications (post-consumer products) and highly prioritized rare earth elements (lanthanum, neodymium and dysprosium) for recycling in Japan. Mobile phones and PCs, cars and household electric appliances are in the scope of related recycling promotion acts [35,36,37,38]. The recycling of optical instruments, construction, robots, nickel–metal hydride batteries and DC motors as post-consumer products are not covered by the current legal systems in Japan. Additional policy support is required for a circular flow of these rare earth elements. The post-consumer products rich in these rare earth elements are not commercially collected and recycled yet [41]. In the context of mineral resources policy, these post-consumer products need to be covered in a new legal system and policy implementation to be collected and recycled.
Table 6.
Major domestic final demands of each selected rare earth element in final and intermediate products.
3.3. Decision Flow Framework of Mineral Resources Policy from National Security and Circular Economy Aspects
This study identifies prioritized parts and final products for creating a circular flow of critical minerals discussed concerning the case of Japan. For lithium and cobalt, abundant volumes of lithium and cobalt are exported overseas through lithium-ion rechargeable batteries, lithium cathodes and electrolytes. For the creation of the circular flow of lithium and cobalt, an international circular flow is required in the case of Japan. Regarding prioritized rare earth elements, DC motors using LaCo magnets and NdFeB magnets, and the other related applications, such as robots, household air conditioners, household electric appliances and passenger motor cars, are highly prioritized for public collection to create circular flows of lanthanum, neodymium and dysprosium. For lanthanum, nickel–metal hydride rechargeable batteries, optical instruments and lenses are also highly prioritized next to permanent magnet-related applications. These applications require an additional legal system to promote the efficient collection of post-consumer products and parts in the country. International cooperation is required for export-dominant parts and final products, such as passenger motor cars, nickel–metal hydride rechargeable batteries, LaCo magnets, optical instruments and lenses.
Figure 6 shows the similarity structure relationship between domestic and international circular flows from a comprehensive mineral resources policy viewpoint. Additional legal systems and policy support are required to create a domestic circular flow of critical minerals in the final products that are dominantly demanded in a country (Scope 2 shown in Figure 6). Based on the hierarchy of circular economy strategies [22], discarded final products in good condition are recommended to be reused, repaired, refurbished, remanufactured or repurposed rather than recycled. Some export-dominant final products and parts need to be part of international circular flows (Scope 3 shown in Figure 6). A new custom clearance system facilitates the adequate circulation of parts and scraps, which are uniquely identified as “circular goods” with international traceability systems.
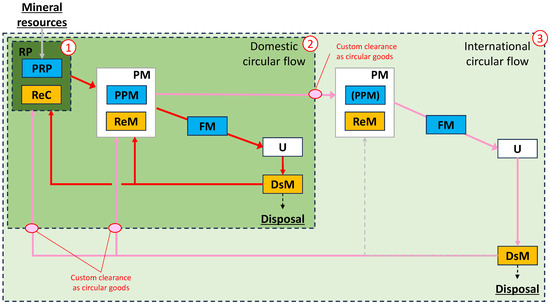
Figure 6.
Similarity structure between domestic and international circular flow of critical minerals from mineral resources policy. Note 1: RP: raw materials production; PRP: primary raw materials production; ReC: recycling; PM: parts manufacturing; PPM: primary parts manufacturing; ReM: repurposing, remanufacturing, refurbishing, repairing and reusing; FM: final products manufacturing; DsM: dismantling, comminution, separating and sorting; U: users. Note 2: Scope 1: suppliers of mineral resources as raw material producers; Scope 2: sphere of domestic circular flow; Scope 3: sphere of international circular flow.
Our results provide a quantitative decision-making tool to identify the prioritized parts and final products for creating the circular flows of critical minerals in the field of mineral resources policy. The current mineral resources policy mainly focuses on criticality alone and does not include identifying prioritized post-consumer products and their parts to be collected and recycled to create a circular flow. Figure 7 suggests a decision flow framework on individual minerals in mineral resources policy for policymakers. The existing research reviews effective methodologies for determining the critical minerals for countries [93,94,95]. Policymakers can identify their critical minerals based on the developed methodologies. Our developed framework supplements policymakers’ decision making from a circular economy perspective. As mentioned above, commercially efficient recycling, besides reusing and remanufacturing, depends on the extensive collection system of recyclable post-consumer products and advanced technologies in comminution, dismantling, separation and sorting. We indicate that the quantitative estimation of critical minerals’ final destination is significant for deciding circular economy implementation in mineral resources policy (shown as “social stock (volume of final destination)” in Figure 7). Furthermore, evaluating implementation possibilities is required to crystalize the content of new legal systems and technological development (shown as “implementation possibility” in Figure 7). Social and technological difficulties also need to be considered for extensive collection, efficient comminution, dismantling, separation and sorting.
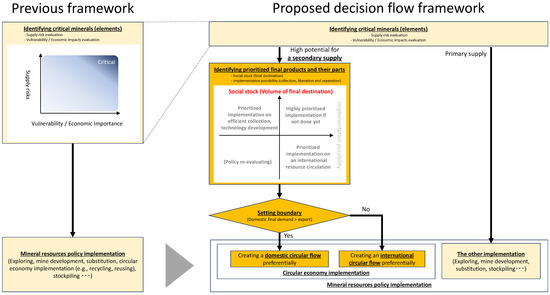
Figure 7.
Decision flow framework of the mineral resources policy for a circular flow of critical minerals.
Additional legal systems facilitate the extensive collection of post-consumer products rich in critical minerals. Innovative technologies on the liberation and separation of critical minerals contribute to the commercial feasibility of circular economy strategies. Owada et al. (2013) proposed “device separation” for an efficient physical separation process with electrical disintegration in this context [96]. Under the concept of circular economy strategies, efficient evaluation technologies are also needed for determining the priority of reusing, repairing, refurbishing, remanufacturing, repurposing or recycling post-consumer products and their parts, in good condition or not. Developing the impact evaluation methodology for policies and legal systems is essential for deciding effective policy implementation for policymakers. The concept of evidence-based policymaking is expected to provide a solution to this issue. The development of indicators for circular design in the sight of liberation and separation, which are based on the current and future expected technologies, is significantly required for policymakers to identify the socially and technologically prioritized parts and final products for circular economy strategies. These indicators also contribute to determining better technologies to be supported.
4. Conclusions and Outlook
In summary, we estimate the final destination of the selected critical minerals (lithium, cobalt, yttrium, lanthanum, cerium, neodymium and dysprosium) and show gaps between the current and expected policy implementation for the circular flow of critical minerals in the case of Japan. This study indicates that evaluating the final destination of critical minerals supplements the current mineral resources policy to implement effective actions for critical minerals’ circularity.
For our estimation, we have uniquely expanded the initial IO table on the Japanese economy from a monetary matrix of 509 by 391 to a hybrid matrix of 443 by 443 with actual data and statistics on the selected critical minerals. The results provide the domestic and overseas distribution of the selected critical minerals and indicate the importance of evaluating the final destination. For creating an international circular flow of critical minerals, international cooperation, such as new custom clearance systems and international traceability systems, is needed to facilitate adequate circulation of parts and scraps, uniquely identified as “circular goods”. We suggest a decision flow framework on comprehensive mineral resources policy for policymakers. The framework supports policymakers in identifying prioritized post-consumer products and their parts using critical minerals for circular economy strategies. In addition, it contributes to the implementation of creating domestic and international circular flows of critical minerals.
Indicator development for implementation possibilities, such as inclusive indicators evaluating an extensive collection of post-consumer products and efficient liberation and separation of them, is required to crystalize the content of new legal systems and technological development. This study is based on the latest high-resolution input–output table available as of 2015. More dynamic analysis is needed to discuss the latest situation with fresher and multi-year data in the future.
Author Contributions
Conceptualization, K.S.; Methodology, K.S.; Formal analysis, K.S.; Investigation, K.S.; Resources, K.S.; Data curation, K.S.; Writing—original draft, K.S.; Writing—review & editing, K.S.; Visualization, K.S.; Supervision, S.O.; Project administration, S.O. All authors have read and agreed to the published version of the manuscript.
Funding
This research received no external funding.
Institutional Review Board Statement
Not applicable.
Informed Consent Statement
Not applicable.
Data Availability Statement
Data are contained within the article.
Acknowledgments
The authors appreciate the three anonymous reviewers for their comments.
Conflicts of Interest
Author Kotaro Shimizu was employed by the company Mitsubishi UFJ Research and Consulting Co., Ltd. The remaining authors declare that the research was conducted in the absence of any commercial or financial relationships that could be construed as a potential conflict of interest.
References
- Australian Government. Australian Critical Minerals Prospectus 2020; Australian Trade and Investment Commission: Sydney, Australia, 2020.
- Canadian Government. Canada’s Critical Minerals Strategy. 2022. Available online: https://www.canada.ca/en/campaign/critical-minerals-in-canada/canadian-critical-minerals-strategy.html (accessed on 28 November 2023).
- European Commission. 2020 EU Critical Raw Materials List. EU (European Union). 2020. Available online: https://eur-lex.europa.eu/legal-content/EN/TXT/PDF/?uri=CELEX:52020DC0474&from=EN (accessed on 28 November 2023).
- METI (Ministry of Economy Trade and Industry Japan). Initiatives to Ensure Stable Supply of Critical Minerals. Tokyo. 2023. Available online: https://www.meti.go.jp/policy/economy/economic_security/metal/torikumihoshin.pdf (accessed on 3 December 2023).
- Malala, O.N.; Adachi, T. Japan’s critical metals in the medium term: A quasi-dynamic approach incorporating probability. Miner. Econ. 2022, 35, 87–101. [Google Scholar] [CrossRef]
- Korean Government. New National Strategies for Securing Strategic Minerals for Korea. Korea. 2023. Available online: https://www.korea.kr/briefing/pressReleaseView.do?newsId=156554864 (accessed on 29 November 2023).
- British Geological Survey. UK Criticality Assessment of Technology Critical Minerals and Metals: Decarbonisation & Resource Management; British Geological Survey: Nottingham, UK, 2021. [Google Scholar]
- US Government. Critical Minerals and Materials: US Department of Energy’s Strategy to Support Domestic Critical Mineral and Material Supply Chains. United States of America. 2021. Available online: https://www.energy.gov/sites/prod/files/2021/01/f82/DOE%20Critical%20Minerals%20and%20Materials%20Strategy_0.pdf (accessed on 28 November 2023).
- NRC (National Research Council). Minerals, Critical Minerals, and the U.S. Economy; National Academies Press: Washington, DC, USA, 2008. [Google Scholar] [CrossRef]
- European Commission. Raw Materials Initiative. EU (European Union). 2008. Available online: https://eur-lex.europa.eu/legal-content/EN/TXT/?uri=CELEX:52008DC0699 (accessed on 28 November 2023).
- Japan Cabinet Office. Guidelines for Securing Resources; Japan Cabinet Office: Tokyo, Japan, 2008.
- Japanese Government. Procurement Strategy of Rare Metals. Japan. 2009. Available online: https://warp.da.ndl.go.jp/info:ndljp/pid/6086248/www.meti.go.jp/press/20090728004/20090728004.html (accessed on 28 November 2023).
- UK Government. Resilience for the Future: The UK’s Critical Minerals Strategy. UK. 2023. Available online: https://www.gov.uk/government/publications/uk-critical-mineral-strategy/resilience-for-the-future-the-uks-critical-minerals-strategy (accessed on 28 November 2023).
- Japanese Government. Sixth Strategic Energy Plan—2050 Carbon Neutral. Japan. 2022. Available online: https://www.meti.go.jp/english/press/2021/1022_002.html (accessed on 28 November 2023).
- French Government. Resources for France Plan. France. 2018. Available online: https://www.ecologie.gouv.fr/sites/default/files/FREC%20-%20Plan%20Ressources%20pour%20la%20France%202018.pdf (accessed on 28 November 2023).
- European Commission. European Action Plan on Critical Raw Materials. EU (European Union). 2020. Available online: https://eur-lex.europa.eu/legal-content/EN/TXT/?uri=CELEX:52020DC0474 (accessed on 28 November 2023).
- German Government. Raw Materials Strategy of the Federal Government: Securing a Sustainable Supply of Non-Energy Mineral Raw Materials for Germany, Updated. 2019. Available online: https://www.bmwk.de/Redaktion/DE/Publikationen/Industrie/rohstoffstrategie-der-bundesregierung.pdf?__blob=publicationFile&v=4 (accessed on 3 December 2023).
- Spanish Government. Roadmap for the Sustainable Management of Mineral Raw Materials. Spain. 2021. Available online: https://www.miteco.gob.es/es/prensa/ultimas-noticias.html (accessed on 28 November 2023).
- Ellen MacArthur Foundation. Circular Economy Towards the Economic and Business Rationale for an Accelerated Transition. 2013. Available online: https://emf.thirdlight.com/file/24/xTyQj3oxiYNMO1xTFs9xT5LF3C/Towards%20the%20circular%20economy%20Vol%201%3A%20an%20economic%20and%20business%20rationale%20for%20an%20accelerated%20transition.pdf (accessed on 3 December 2023).
- Lewandowski, M. Designing the Business Models for Circular Economy—Towards the Conceptual Framework. Sustainability 2016, 8, 43. [Google Scholar] [CrossRef]
- Ghisellini, P.; Cialani, C.; Ulgiati, S. A Review on Circular Economy: The Expected Transition to a Balanced Interplay of Environmental and Economic Systems. J. Clean. Prod. 2016, 114, 11–32. [Google Scholar] [CrossRef]
- Potting, J.; Hekkert, M.; Worrell, E.; Hanemaaijer, A. Circular Economy: Measuring Innovation in the Product Chain Policy Report. 2017. Available online: https://www.pbl.nl/sites/default/files/downloads/pbl-2016-circular-economy-measuring-innovation-in-product-chains-2544.pdf (accessed on 4 December 2023).
- ISO/DIS 59004; Circular Economy—Terminology, Principles and Guidance for Implementation. ISO: Geneva, Switzerland, 2023. Available online: www.iso.org (accessed on 4 December 2023).
- Christmann, P. Mineral Resource Governance in the 21st Century and a sustainable European Union. Miner. Econ. 2021, 34, 187–208. [Google Scholar] [CrossRef]
- Watari, T.; Nansai, K.; Nakajima, K. Review of critical metal dynamics to 2050 for 48 elements. Resour. Conserv. Recycl. 2020, 155, 104669. [Google Scholar] [CrossRef]
- Kirchherr, J.; Reike, D.; Hekkert, M. Conceptualizing the circular economy: An analysis of 114 definitions. Resour. Conserv. Recycl. 2017, 127, 221–232. [Google Scholar] [CrossRef]
- Murakami, S.; Shimizu, K.; Tokoro, C.; Nakamura, T. Role of Resource Circularity in Carbon Neutrality. Sustainability 2022, 14, 16408. [Google Scholar] [CrossRef]
- Nanjo, M. Urban Mine, New Resources for the Year 2000 and Beyond. Bull. Res. Inst. Miner. Dress. Metall. Tohoku Univ. 1988, 43, 239–251. Available online: http://hdl.handle.net/10097/00114635 (accessed on 2 December 2023).
- Halada, K.; Ijima, K.; Shimada, M.; Katagiri, N. A Possibility of Urban Mining in Japan. J. Jpn. Inst. Met. Mater. 2009, 73, 151–160. [Google Scholar] [CrossRef]
- Nakamura, T.; Halada, K. Urban Mining Systems; Springer: Berlin/Heidelberg, Germany, 2015; Available online: http://www.springer.com/series/8884 (accessed on 4 December 2023).
- UNEP IRP (United Nations Environment Programme. International Resource Panel). Metal Recycling: Opportunities, Limits, Infrastructure. 2013. Available online: https://www.resourcepanel.org/sites/default/files/documents/document/media/e-book_metals_report2b_recyclingopportunities_130919.pdf (accessed on 3 December 2023).
- UNEP (United Nations Environment Programme). Mineral Resource Governance in the 21st Century; Edmund Nickless (Formerly: The Geological Society of London): London, UK, 2019. [Google Scholar]
- UNEP (United Nations Environment Programme). Recycling Rates of Metals: A Status Report. 2011. Available online: https://wedocs.unep.org/handle/20.500.11822/8702;jsessionid=5C35A81523510792764FE348EBB6CFAA (accessed on 24 December 2023).
- National Diet of Japan. Basic Act on Establishing a Sound Material-Cycle Society. Japan. 2000. Available online: https://www.japaneselawtranslation.go.jp/ja/laws/view/3799 (accessed on 3 December 2023).
- National Diet of Japan. Act on the Promotion of Effective Utilization of Resources. Japan. 1991. Available online: https://www.japaneselawtranslation.go.jp/ja/laws/view/3819 (accessed on 27 November 2023).
- National Diet of Japan. Act on Recycling of Specified Kinds of Home Appliances. Japan. 2012. Available online: https://elaws.e-gov.go.jp/document?lawid=410AC0000000097_20200401_429AC0000000061 (accessed on 27 November 2023).
- National Diet of Japan. Act on Promotion of Recycling of Small Waste Electrical and Electronic Equipment. Japan. 2012. Available online: https://www.japaneselawtranslation.go.jp/ja/laws/view/3209 (accessed on 27 November 2023).
- National Diet of Japan. Act on Recycling of End-of-Life Automobiles. Japan. 2002. Available online: https://www.japaneselawtranslation.go.jp/ja/laws/view/3829 (accessed on 27 November 2023).
- MURC (Mitsubishi UFJ Research and Consulting). Stock and Flow Analysis on Mineral Resources: Lithium and Nickel. Tokyo. 2023. Available online: https://mric.jogmec.go.jp/wp-content/uploads/2023/05/survey_mineral_recycling_flow_stock_r4.pdf (accessed on 3 December 2023).
- MURC (Mitsubishi UFJ Research and Consulting). Stock and Flow Analysis on Mineral Resources: Copper and Rare Earths’. Tokyo. 2022. Available online: https://mric.jogmec.go.jp/wp-content/uploads/2022/04/survey_mineral_recycling_flow_stock.pdf (accessed on 3 December 2023).
- JOGMEC (Japan Organization for Metals and Energy Security). Material Flows of Mineral Resources 2021. Tokyo. 2023. Available online: https://mric.jogmec.go.jp/report/?category%5B%5D=material_flow (accessed on 3 December 2023).
- European Commission; Joint Research Centre. Towards Recycling Indicators Based on EU Flows and Raw Materials System Analysis Data: Supporting the EU-28 Raw Materials and Circular Economy Policies through RMIS. 2018. Available online: https://publications.jrc.ec.europa.eu/repository/handle/JRC112720 (accessed on 4 December 2023).
- European Commission. Report on Critical Raw Materials and the Circular Economy. 2018. Available online: https://publications.jrc.ec.europa.eu/repository/handle/JRC108710 (accessed on 4 December 2023).
- Murakami, S.; Yamanoi, M.; Adachi, T.; Mogi, G.; Yamatomi, J. Material Flow Accounting for Metals in Japan. Mater. Trans. 2004, 45, 3184–3193. [Google Scholar] [CrossRef]
- Nakamura, S.; Nakajima, K. Waste Input–Output Material Flow Analysis of Metals in the Japanese Economy. Mater. Trans. 2005, 46, 2550–2553. [Google Scholar] [CrossRef]
- Ohno, H.; Fukushima, Y.; Matsubae, K.; Nakajima, K.; Nagasaka, T. Revealing Final Destination of Special Steel Materials with Input-Output-Based Material Flow Analysis. ISIJ Int. 2017, 57, 193–199. [Google Scholar] [CrossRef]
- Ohno, H.; Matsubae, K.; Nakajima, K.; Nansai, K.; Fukushima, Y.; Nagasaka, T. Consumption-based accounting of steel alloying elements and greenhouse gas emissions associated with the metal use: The case of Japan. J. Econ. Struct. 2016, 5, 1–17. [Google Scholar] [CrossRef]
- ISO/TMB Strategic Advisory Group on Critical Minerals, ‘ISO/TMB-Strategic Advisory Group on Critical Minerals Phase 2 Final Report. 2023. Available online: https://isotc.iso.org/livelink/livelink/fetch/-15620806/15620808/15623592/17584461/SAG_on_Critical_minerals.pdf?nodeid=22165610&vernum=-2 (accessed on 28 December 2023).
- Nakamura, S.; Nakajima, K.; Kondo, Y.; Nagasaka, T. The Waste Input-Output Approach to Materials Flow Analysis Concepts and Application to Base Metals. J. Ind. Ecol. 2007, 11, 50–63. [Google Scholar] [CrossRef]
- Nuss, P.; Ohno, H.; Chen, W.-Q.; Graedel, T. Comparative analysis of metals use in the United States economy. Resour. Conserv. Recycl. 2019, 145, 448–456. [Google Scholar] [CrossRef]
- Ohno, H.; Matsubae, K.; Nakajima, K.; Nakamura, S.; Nagasaka, T. Unintentional Flow of Alloying Elements in Steel during Recycling of End-of-Life Vehicles. J. Ind. Ecol. 2014, 18, 242–253. [Google Scholar] [CrossRef]
- Ohno, H.; Matsubae, K.; Nakajima, K.; Kondo, Y.; Nakamura, S.; Nagasaka, T. Toward the efficient recycling of alloying elements from end of life vehicle steel scrap. Resour. Conserv. Recycl. 2015, 100, 11–20. [Google Scholar] [CrossRef]
- Ohno, H.; Nuss, P.; Chen, W.-Q.; Graedel, T.E. Deriving the Metal and Alloy Networks of Modern Technology. Environ. Sci. Technol. 2016, 50, 4082–4090. [Google Scholar] [CrossRef]
- MIC (Ministry of Industrial Affairs and Communications Japan). 2015 Input-Output Table for Japan, 2015th ed.; Ministry of Industrial Affairs and Communications: Tokyo, Japan, 2020.
- CMAJ (Catalyst Manufacturers Association Japan). Catalyst Statistics 2015; CMAJ: Tokyo, Japan, 2016. [Google Scholar]
- EMAJ (Electronic Materials Manufacturers Association of Japan). Table of Permanent Magnet Applications; EMAJ: Tokyo, Japan, 1997. [Google Scholar]
- JOGMEC (Japan Organization for Metals and Energy Security). Material Flows of Mineral Resources 2016; JOGMEC: Tokyo, Japan, 2017.
- JSNM (Japan Society of Newer Metals). Rare Earths Demand Statistics 2015; JSNM: Tokyo, Japan, 2016. [Google Scholar]
- METI (Ministry of Economy Trade and Industry Japan). Current Survey of Supply and Demand of Non-ferrous Metals 2015; METI: Tokyo, Japan, 2016.
- METI (Ministry of Economy Trade and Industry Japan). Current Survey of Production 2015—Mineral Resources, Petroleum Products, Ceramics and Building Materials; METI: Tokyo, Japan, 2016.
- METI (Ministry of Economy Trade and Industry Japan). Current Survey of Production 2015—Machinery; METI: Tokyo, Japan, 2016.
- METI (Ministry of Economy Trade and Industry Japan). Current Survey of Production 2015—Iron and Steel, Non-Ferrous Metals and Fabricated Metals; METI: Tokyo, Japan, 2016.
- METI (Ministry of Economy Trade and Industry Japan). Current Survey of Production 2015—Chemical Industry; METI: Tokyo, Japan, 2016.
- METI (Ministry of Economy Trade and Industry Japan). Census of Manufactures 2015; METI: Tokyo, Japan, 2017.
- MOF (Ministry of Finance Japan). Trade Statistics 2015; MOF: Tokyo, Japan, 2016.
- Rare Metal News. Industrial Rare Metals Annual Review 2016; Rare Metal News: Tokyo, Japan, 2016. [Google Scholar]
- Kobayashi, Y. Felite magnet. Spec. Steel 2019, 68, 6. [Google Scholar]
- METI (Ministry of Economy Trade and Industry Japan); MOE (Ministry of the Environment Japan). Draft Framework of an Incentive System for Automobiles using Advanced Recycled Materials; METI: Tokyo, Japan, 2017.
- MURC (Mitsubishi UFJ Research and Consulting). Domestic Demand-Supply Structure of Non-Ferrous Metals and Current Industry Status of Major Resource Countries; MURC: Tokyo, Japan, 2010. [Google Scholar]
- Yano Research Institute. Current State of Metals Recycling Originated from End-of-Life Vehicles; Yano Research Institute: Tokyo, Japan, 2015. [Google Scholar]
- MURC (Mitsubishi UFJ Research and Consulting). Current Distribution of Rare Metals; MURC: Tokyo, Japan, 2020. [Google Scholar]
- Olivetti, E.A.; Ceder, G.; Gaustad, G.G.; Fu, X. Lithium-Ion Battery Supply Chain Considerations: Analysis of Potential Bottlenecks in Critical Metals. Joule 2017, 1, 229–243. [Google Scholar] [CrossRef]
- Nakajima, K.; Ohno, H.; Kondo, Y.; Matsubae, K.; Takeda, O.; Miki, T.; Nakamura, S.; Nagasaka, T. Simultaneous Material Flow Analysis of Nickel, Chromium, and Molybdenum Used in Alloy Steel by Means of Input–Output Analysis. Environ. Sci. Technol. 2013, 47, 4653–4660. [Google Scholar] [CrossRef] [PubMed]
- Nakajima, K.; Nansai, K.; Matsubae, K.; Tomita, M.; Takayanagi, W.; Nagasaka, T. Global land-use change hidden behind nickel consumption. Sci. Total. Environ. 2017, 586, 730–737. [Google Scholar] [CrossRef] [PubMed]
- Nakajima, K.; Daigo, I.; Nansai, K.; Matsubae, K.; Takayanagi, W.; Tomita, M.; Matsuno, Y. Global distribution of material consumption: Nickel, copper, and iron. Resour. Conserv. Recycl. 2018, 133, 369–374. [Google Scholar] [CrossRef]
- Nakamura, S.; Kondo, Y.; Nakajima, K.; Ohno, H.; Pauliuk, S. Quantifying Recycling and Losses of Cr and Ni in Steel Throughout Multiple Life Cycles Using MaTrace-Alloy. Environ. Sci. Technol. 2017, 51, 9469–9476. [Google Scholar] [CrossRef] [PubMed]
- Nansai, K.; Nakajima, K.; Kagawa, S.; Kondo, Y.; Suh, S.; Shigetomi, Y.; Oshita, Y. Global Flows of Critical Metals Necessary for Low-Carbon Technologies: The Case of Neodymium, Cobalt, and Platinum. Environ. Sci. Technol. 2014, 48, 1391–1400. [Google Scholar] [CrossRef]
- Nansai, K.; Nakajima, K.; Kagawa, S.; Kondo, Y.; Shigetomi, Y.; Suh, S. Global Mining Risk Footprint of Critical Metals Necessary for Low-Carbon Technologies: The Case of Neodymium, Cobalt, and Platinum in Japan. Environ. Sci. Technol. 2015, 49, 2022–2031. [Google Scholar] [CrossRef]
- Nansai, K.; Nakajima, K.; Suh, S.; Kagawa, S.; Kondo, Y.; Takayanagi, W.; Shigetomi, Y. The role of primary processing in the supply risks of critical metals. Econ. Syst. Res. 2017, 29, 335–356. [Google Scholar] [CrossRef]
- Nansai, K.; Kondo, Y.; Giurco, D.; Sussman, D.; Nakajima, K.; Kagawa, S.; Takayanagi, W.; Shigetomi, Y.; Tohno, S. Nexus between economy-wide metal inputs and the deterioration of sustainable development goals. Resour. Conserv. Recycl. 2019, 149, 12–19. [Google Scholar] [CrossRef]
- Ohno, H.; Matsubae, K.; Nakajima, K.; Kondo, Y.; Nakamura, S.; Fukushima, Y.; Nagasaka, T. Optimal Recycling of Steel Scrap and Alloying Elements: Input-Output based Linear Programming Method with Its Application to End-of-Life Vehicles in Japan. Environ. Sci. Technol. 2017, 51, 13086–13094. [Google Scholar] [CrossRef]
- Shi, W.; Daigo, I.; Matsuno, Y.; Adachi, Y. Substance Flow Analysis of Dysprosium in Japan. J. Jpn. Inst. Met. Mater. 2010, 74, 758–765. [Google Scholar] [CrossRef][Green Version]
- Seo, Y.; Morimoto, S. Comparison of dysprosium security strategies in Japan for 2010–2030. Resour. Policy 2014, 39, 15–20. [Google Scholar] [CrossRef]
- Aoki, Y.; Kawai, H.; Okuyama, A. The Safety and Evaluation Test of Lithium-Ion Secondary Battery. In Proceedings of the Microelectronics Symposium 2012, Osaka, Japan, 30 September–2 October 2012; Available online: https://www.jstage.jst.go.jp/article/mes/22/0/22_187/_pdf/-char/ja (accessed on 4 December 2023).
- US Geological Survey. Mineral Commodity Summaries, 2023rd ed.; US Geological Survey: Reston, VA, USA, 2023. Available online: https://www.usgs.gov/centers/national-minerals-information-center/commodity-statistics-and-information (accessed on 4 December 2023).
- US Government. Final List of Critical Minerals 2018. 2018. Available online: https://www.federalregister.gov/documents/2018/05/18/2018-10667/final-list-of-critical-minerals-2018 (accessed on 3 December 2023).
- Adachi, G. Introduction to Chemistry of Rare Earth; Kagaku-Dojin Publishing Company, Inc.: Kyoto, Japan, 2015. [Google Scholar]
- US Geological Survey. Mineral Yearbook Volume I—Metals and Minerals, 2023rd ed.; US Geological Survey: Reston, VA, USA, 2022. Available online: https://www.usgs.gov/centers/national-minerals-information-center/minerals-yearbook-metals-and-minerals (accessed on 4 December 2023).
- US Geological Survey. Critical Mineral Resources of the United States—Economic and Environmental Geology and Prospects for Future Supply; US Geological Survey: Reston, VA, USA, 2017. Available online: https://pubs.usgs.gov/publication/pp1802 (accessed on 5 December 2023).
- US Geological Survey. Mineral Commodity Summaries, 2009th ed.; US Geological Survey: Reston, VA, USA, 2009. Available online: https://www.usgs.gov/centers/national-minerals-information-center/commodity-statistics-and-information#R (accessed on 5 December 2023).
- Ota, T. Resource Economics on Rare Earths Industry. 2010. Available online: https://ndlonline.ndl.go.jp/#!/detail/R300000001-I000011114632-00 (accessed on 4 December 2023).
- Japanese Government. Procurement Strategy of Natural Resources. Japan. 2012. Available online: https://warp.da.ndl.go.jp/info:ndljp/pid/8556468/www.enecho.meti.go.jp/policy/shinenseisaku2.pdf (accessed on 28 November 2023).
- Achzet, B.; Helbig, C. How to evaluate raw material supply risks—An overview. Resour. Policy 2013, 38, 435–447. [Google Scholar] [CrossRef]
- Helbig, C.; Wietschel, L.; Thorenz, A.; Tuma, A. How to evaluate raw material vulnerability—An overview. Resour. Policy 2016, 48, 13–24. [Google Scholar] [CrossRef]
- Schrijvers, D.; Hool, A.; Blengini, G.A.; Chen, W.-Q.; Dewulf, J.; Eggert, R.; van Ellen, L.; Gauss, R.; Goddin, J.; Habib, K.; et al. A review of methods and data to determine raw material criticality. Resour. Conserv. Recycl. 2020, 155, 104617. [Google Scholar] [CrossRef]
- Owada, S.; Komuro, T.; Ono, T.; Hayashi, R. Concentration of Minor Rare Metals Form E-scraps by Combining New Comminution and Physical Separation Processes. In Proceedings of the 12th International Symposium on East Asian Resources Recycling Technology (EARTH2013), Changsha, China, 24 August 2013. [Google Scholar]


Disclaimer/Publisher’s Note: The statements, opinions and data contained in all publications are solely those of the individual author(s) and contributor(s) and not of MDPI and/or the editor(s). MDPI and/or the editor(s) disclaim responsibility for any injury to people or property resulting from any ideas, methods, instructions or products referred to in the content. |
© 2024 by the authors. Licensee MDPI, Basel, Switzerland. This article is an open access article distributed under the terms and conditions of the Creative Commons Attribution (CC BY) license (https://creativecommons.org/licenses/by/4.0/).