1. Introduction
Education is an essential “engine” for development and is crucial for achieving sustainable social progress [
1]. The sustainable development of education can promote social equity and harmony by enhancing the fairness of educational resources and reducing educational inequality among regions and groups. As an essential component of the education system, the spatial distribution and accessibility of compulsory primary education play an important role in promoting educational equity and sustainable development.
The issue of education equity has always been extensively studied. Dai optimized the spatial distribution of schools using random mechanisms to ensure equal educational opportunities [
2]; Al-Sabbagh employed the GIS location allocation model to enhance primary school enrollment opportunities in Mansura, Egypt [
3]; Kim, in South Korea, evaluated the educational equity of rural commuting distances following the closure of elementary schools [
4]; and Iraegui utilized qualified education accessibility to explore spatial equity [
5].
Researching educational equity by assessing the actual accessibility of primary schools is an effective approach. Accessibility refers to the ease of obtaining services from a specific location via a transportation system. It evaluates the spatial interaction between service supply and demand, considering transportation costs, the appeal of supply-side services, and the distribution of demand-side services [
6]. In 1959, Hanson introduced the concept of spatial accessibility and used it to measure the ease of travel between two points in space [
7]. Foreign scholars have widely adopted this concept and its associated methods to examine the spatial configurations of educational facilities. This research covers a range of topics, such as the partitioning and planning of school districts [
8], traffic cost analyses for educational facility accessibility [
9,
10], analyses of primary school clustering patterns in spatial layouts [
11], comparisons of primary school accessibility across different cities [
12], and the economic and social impacts resulting from changes in school accessibility [
13]. Since the 21st century, domestic scholars have endeavored to integrate spatial accessibility into the analysis of educational facilities, particularly in their distribution and balance across various educational institutions, such as kindergartens, primary schools, middle schools, and high schools.
The common methods of spatial accessibility include the distance method, the cumulative opportunity method [
14], the two-step floating catchment area (2SFCA) method and its improved forms [
15,
16], and the potential model and its improved forms [
17,
18]. Among them, the distance method solely takes into account distance factors and does not consider other factors, such as the size of supply and demand points. This makes it challenging to visually analyze the supply and demand situation of primary school facilities. The cumulative opportunity method expresses the accessibility of school facilities in terms of cumulative opportunity, taking into account factors, such as the transportation system and land use. However, it does not consider the impact of distance decay. The potential model adopts a decay function that considers both supply-side and distance factors but does not consider demand-side factors. The conventional 2SFCA accounts for multiple factors, such as supply and demand sides, distance, and more. However, its inefficiency in terms of repeated calculations limits its ability to comprehensively consider multiple modes of transportation behavior. Furthermore, coupled with the uncertainty of distance thresholds, there can be variations in the results obtained in practical research.
According to existing research, there are two key areas that require improvement. Firstly, traditional education facility planning predominantly relies on total and per capita indicators, overlooking crucial factors, such as actual population demand and the spatial distribution of facilities [
19]. There is a lack of quantitative assessments of the “spatial matching degree” between the spatial distribution of education facilities and the distribution of a residential population [
20]. The second area that requires improvement is the selection of the research scale, which often faces challenges regarding scope and precision. For instance, research areas may be too narrowly defined, leading to insufficient spatial precision. Numerous studies have focused on individual streets, regions, or schools as their research domains. As such, they are limited in their ability to assist in the allocation of educational facilities on a wider scale. Additionally, in terms of spatial precision, existing studies often utilize streets and communities as the smallest population scale unit, but this level of precision may not be sufficient and is susceptible to uncertainty [
21,
22].
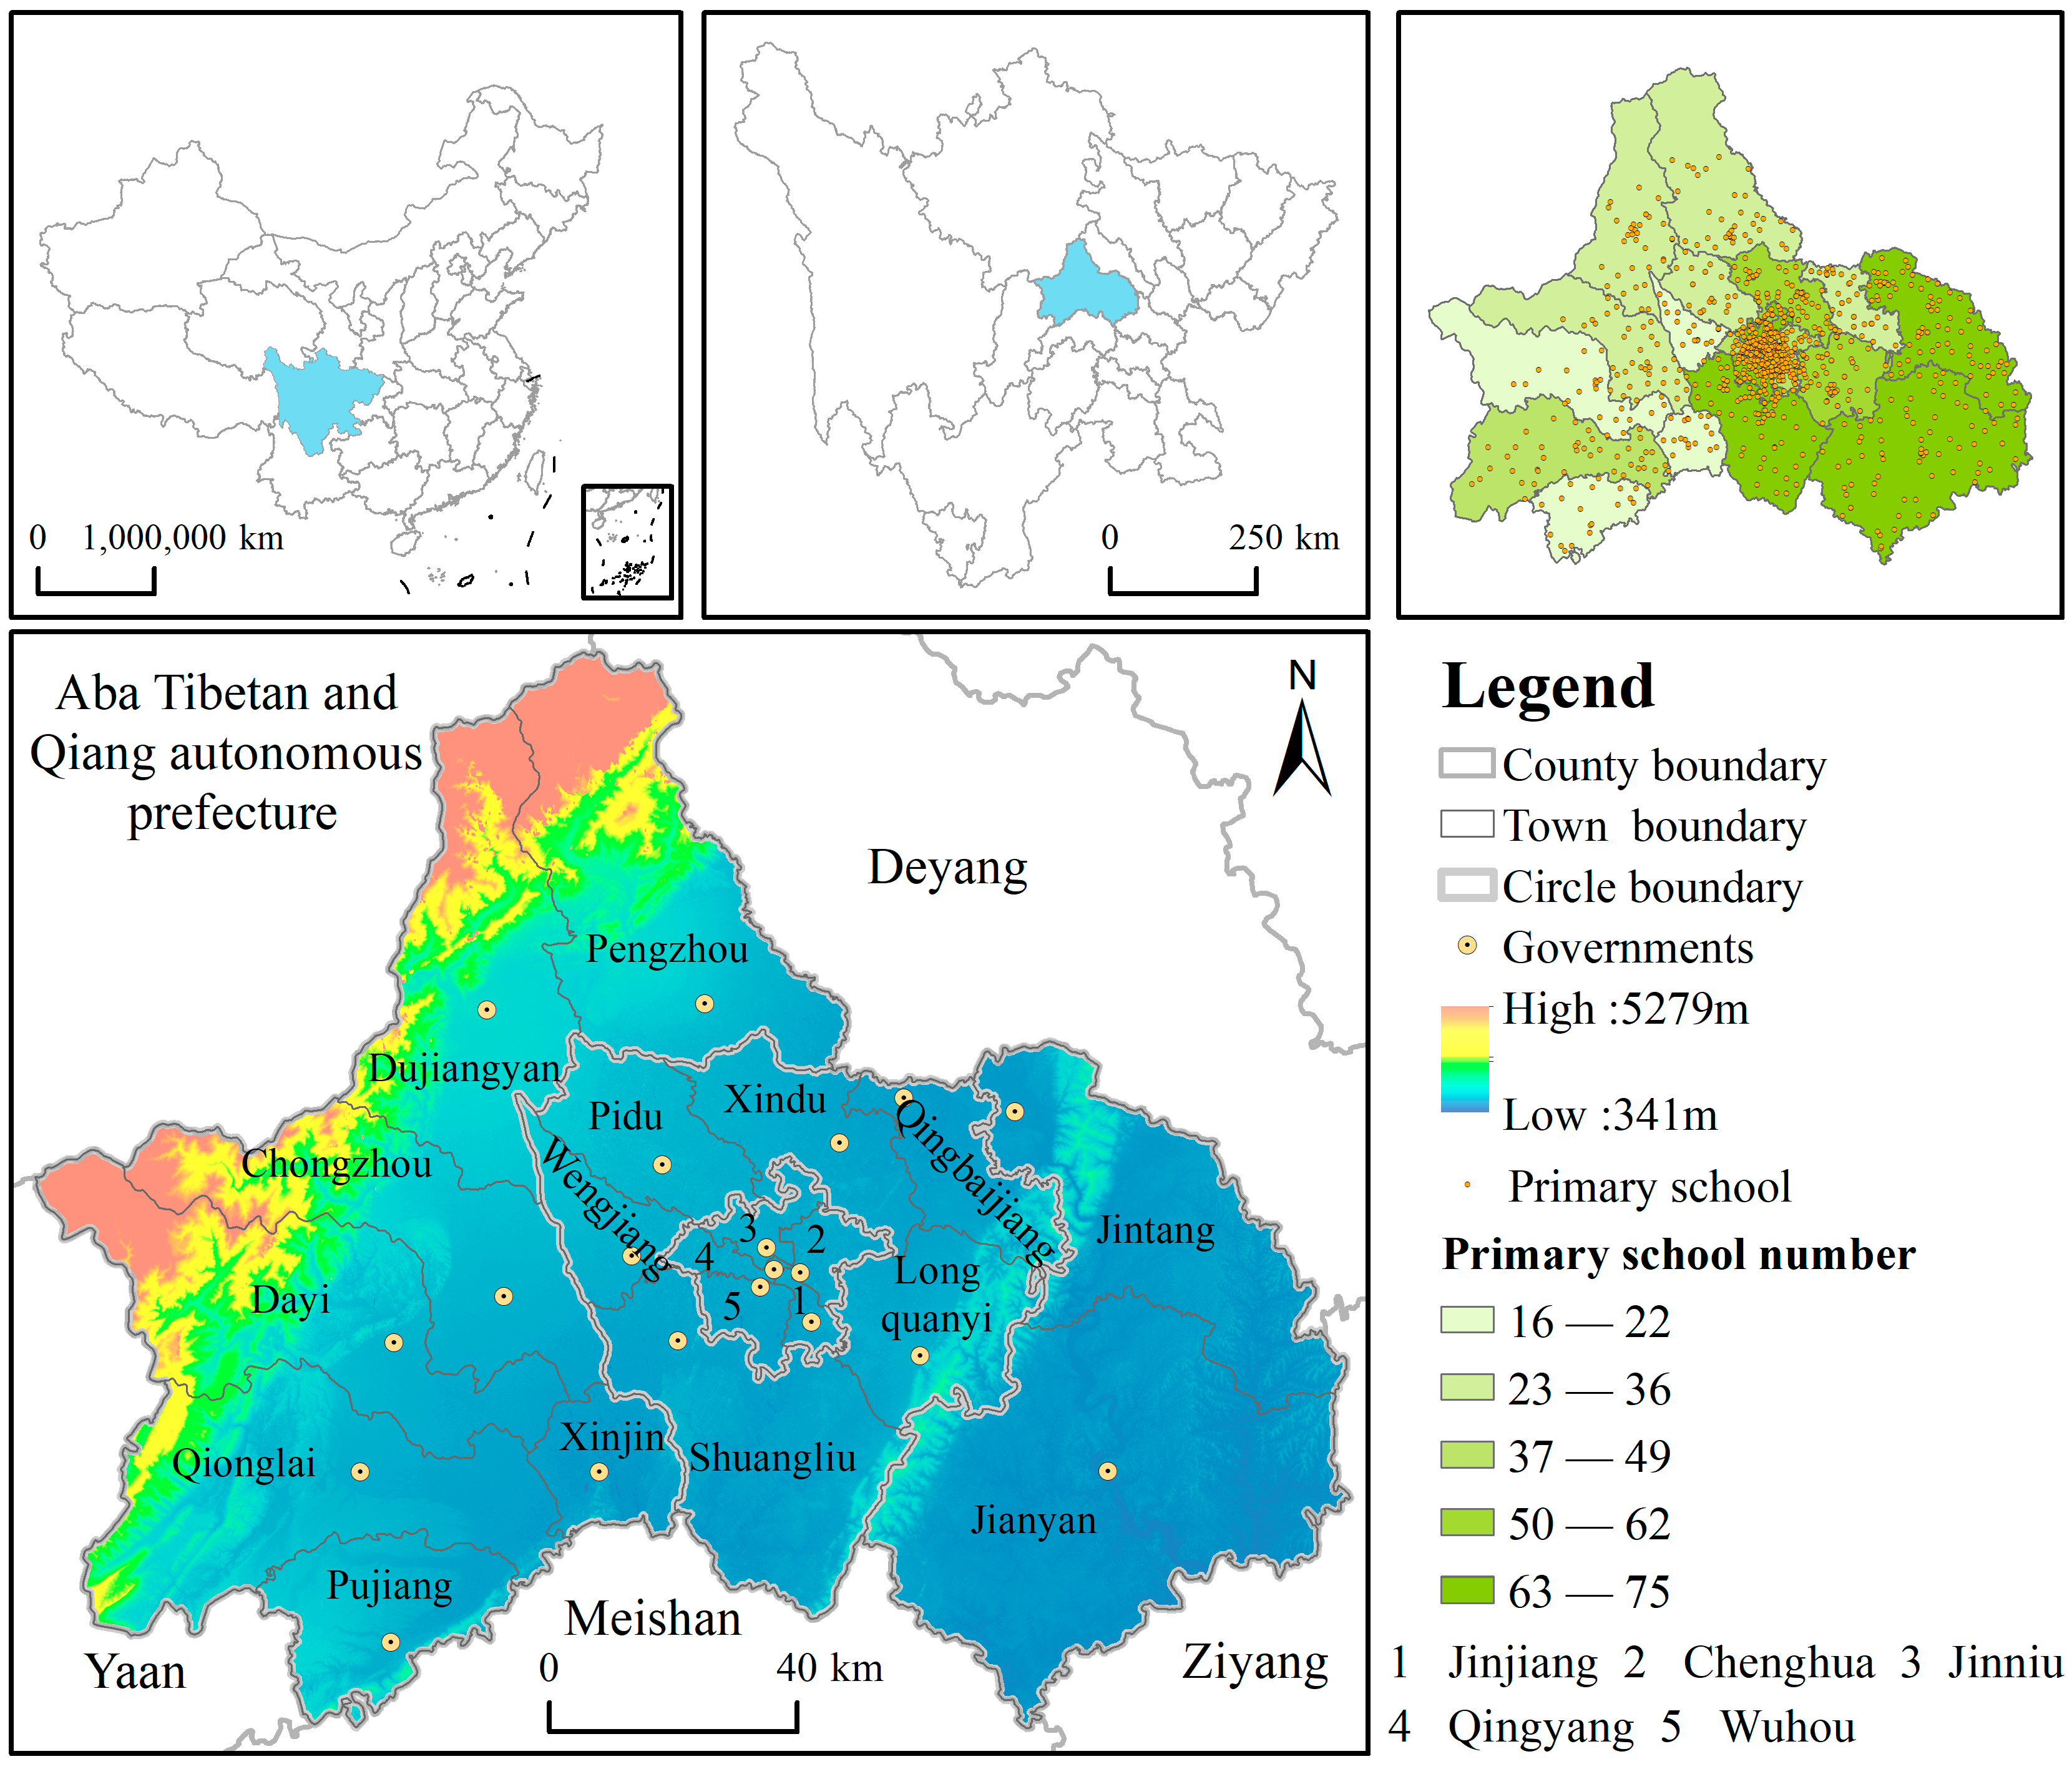
In response to the aforementioned issues, to enhance the analysis of the spatial distribution and accessibility of primary school facilities, this study conducted the following experiments: (1) analysis of the distribution of permanent residents and school-age children in Chengdu through population spatialization; (2) analysis of the spatial distribution and balance of primary school facilities in Chengdu through a kernel density analysis and imbalance index analysis; (3) using the multi-traffic model two-step floating catchment area (MM2SFCA) method, the accessibility of primary school facilities in Chengdu was analyzed from the perspective of supply and demand; (4) use of the spatial autocorrelation analysis to verify the results of spatial accessibility of primary schools and to interpret and analyze them.
3. Analytical Methods
3.1. Spatialization of Population
The random forest is an extension of the Bagging method for ensemble learning. It combines multiple decision trees into a basic learner by introducing randomization rules. By combining several weak classifiers, the final result can be voted on or averaged, improving the accuracy and generalization performance of the model. This approach achieves good results in the final effect.
The correlation between population density and each variable factor was calculated using SPSS 22.0 software, and the factor with a strong correlation with the population density (r ≥ 0.6) was determined as an independent variable after a comparative analysis. Through factor selection, factors, such as the Point of Interest kernel density value, mean value of night light brightness, land-use index, road network density, and elevation, were identified as independent variables, with the street population density as dependent variables [
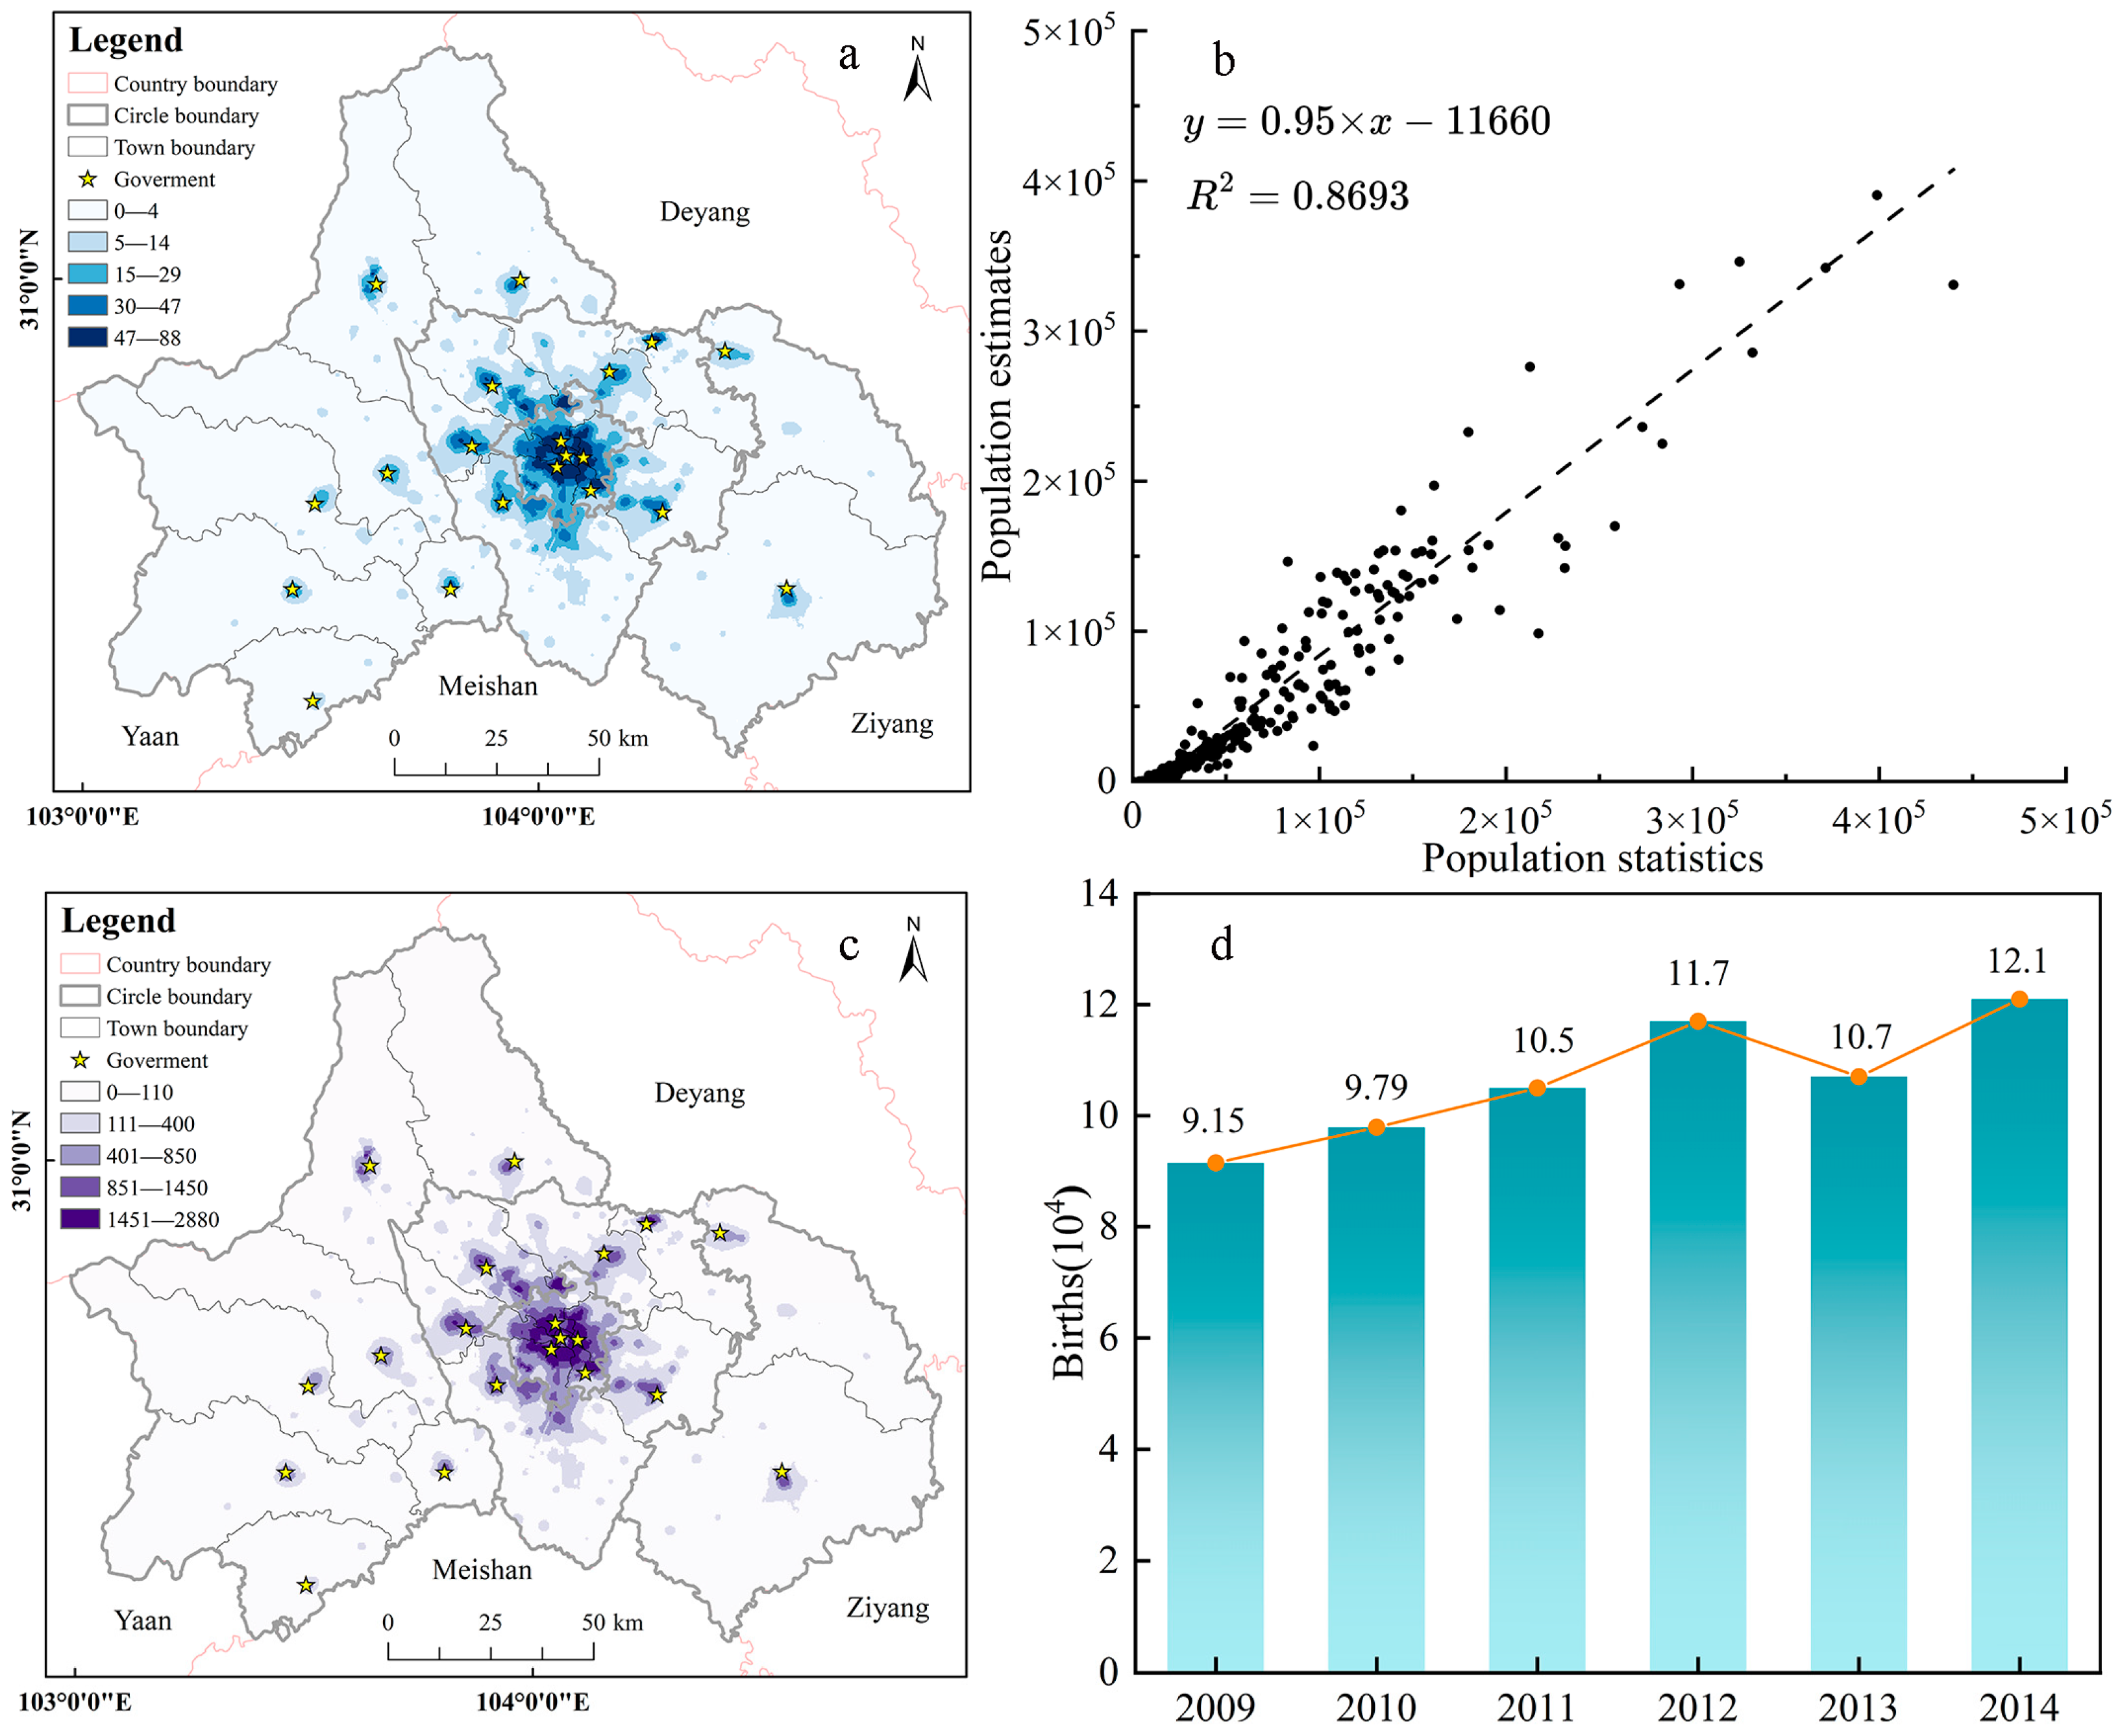
23], and a random forest model was constructed to simulate the spatial distribution of the population on a 250 m grid in Chengdu [
24,
25,
26]. The random forest model was run on the R language platform with the following parameter settings: ntree = 500, mtry = 3, and other default settings. The calculation is shown in Equation (1):
where
Rpop′ji is the estimated population in grid
i of the
jth district and county after total control;
Rpopji is the estimated population in grid
i of the
j district and county;
Realj is the actual population in the
jth district and county;
Rredictj is the total estimated population in the
j district and county.
To judge the accuracy of the population grid assignment results, 259 streets in Chengdu were divided into a test set and a training set at a 2:8 ratio. When dividing the dataset, 20% of the street population was used as the test set to verify the model’s regression accuracy, and the accuracy of the model results was evaluated using the coefficient of determination (
R2), as shown in Equation (2).
where
Popi is the actual population value of the street,
Pop′i is the estimated population value of the street, and
is the average value of the actual population of all streets.
3.2. Kernel Density Estimation
Kernel density estimation [
27,
28] does not assume anything about the distribution of the sample data, and it studies the prediction method of the data distribution characteristics; let the sample data
x1,
x2, …,
xn be the collected sample data with independent identical distribution [
29], and then, the kernel density function
F(
x) at any arbitrary point
x is estimated as shown in Equation (3).
where
F(
x) is the kernel density function;
h is the distance decay threshold,
n is the number of point elements within the search distance,
K is the spatial weight function, and
x − xi is the distance from point
x to point
xi.
3.3. Imbalance Index Method
The imbalance index method is used to measure the differences in the spatial distribution of primary schools in different districts and counties [
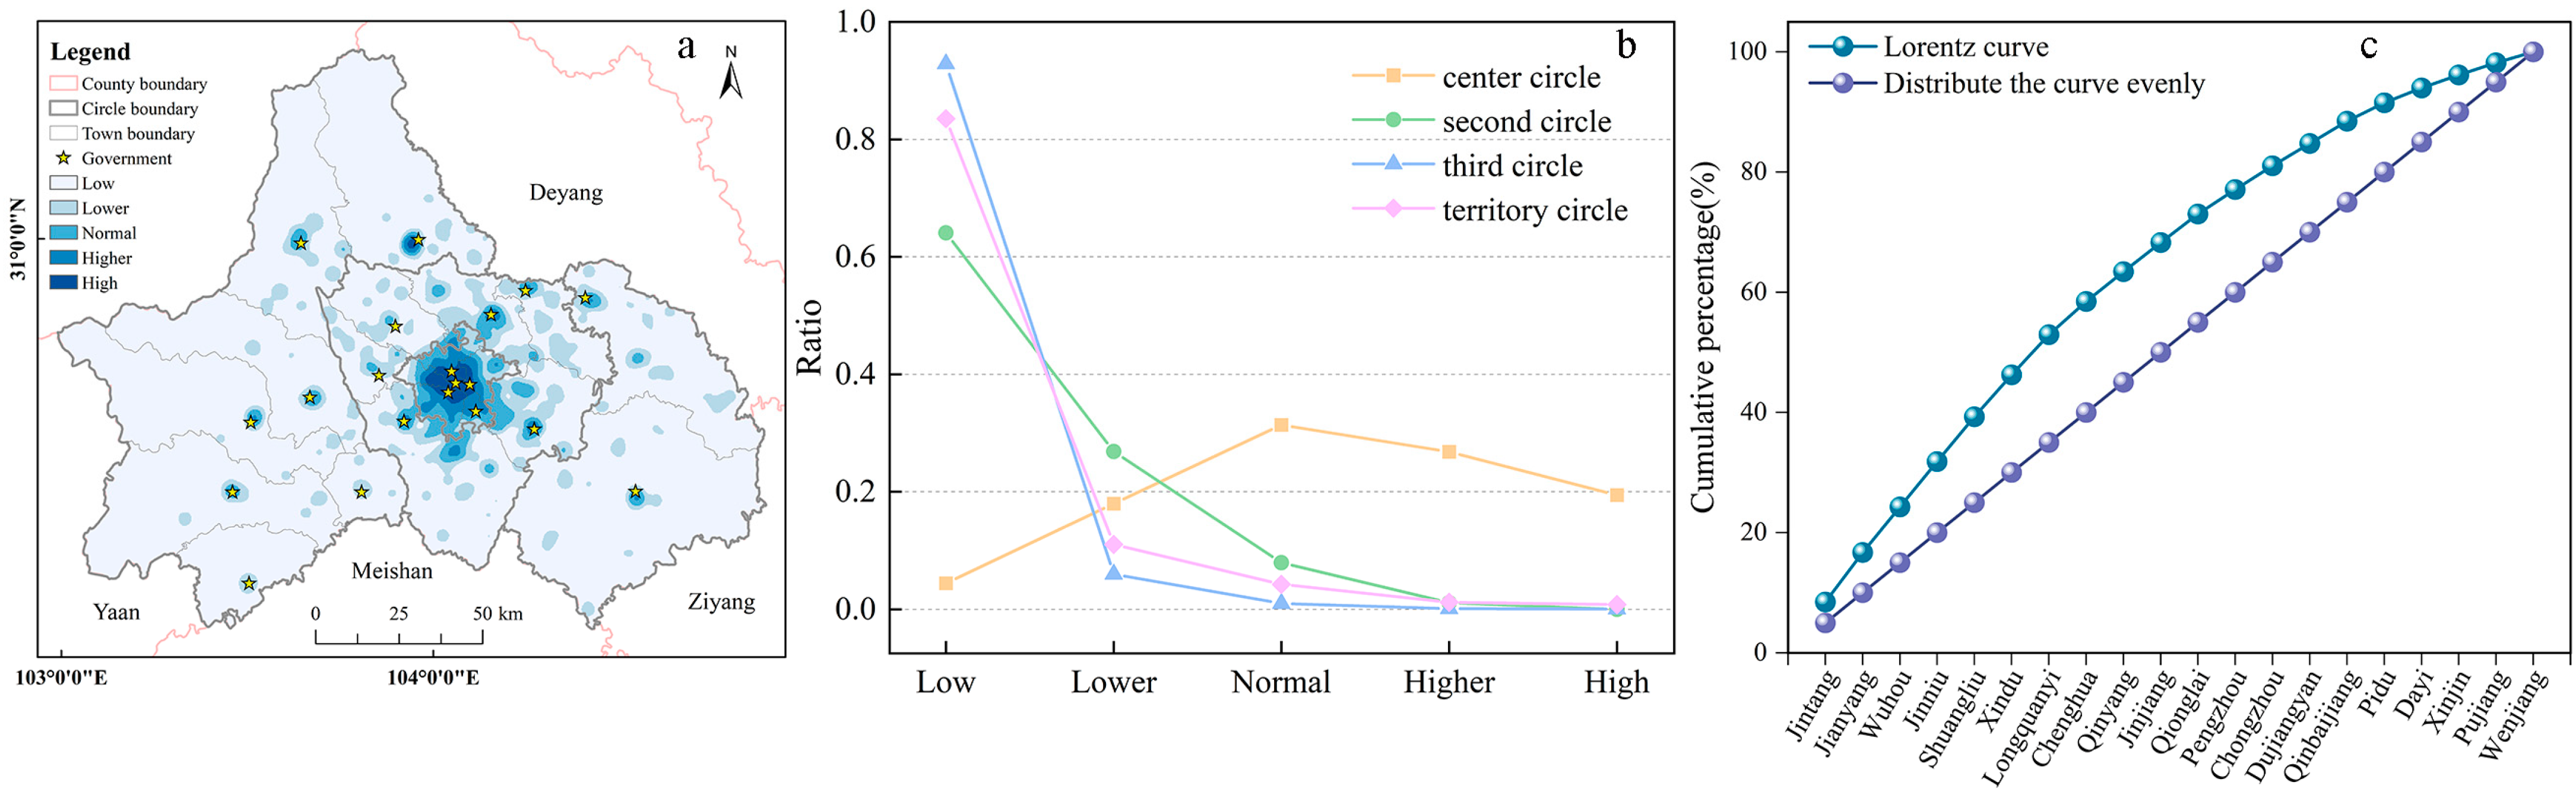
30], and in this paper, the concentration index model of the Lorenz curve is chosen to analyze the degree of balance in the distribution of primary schools, as shown in Equation (4).
where
S is the imbalance index,
n is the number of study areas, and
Yi is the
ith cumulative percentage of the number of primary schools in the study area as a proportion of the total number of primary schools in the city, ranked from largest to smallest. If 0 <
S < 1, it means that primary schools are unevenly distributed in the study area; if
S = 0, it means a balanced distribution; and if
S = 1, it means that primary school are concentrated in a particular study area.
3.4. The MM2SFCA Method
The traditional 2SFCA method utilizes a predetermined travel distance or time threshold as the search radius and searches by moving twice and compares the number of resources or facilities that residents can access within the threshold; the higher the value, the better the accessibility [
31,
32]. In this study, the road data network of Chengdu city is used to calculate the travel cost, and the combination of multiple transportation modes is added to the traditional 2SFCA method. This approach is more aligned with the transportation modes commonly utilized by residents for travelling and schooling at this stage. Specifically, walking is preferred for close schooling, followed by the use of electric motorbikes, and some residents opt for cars for the long-distance transportation of children.
The selection of a reasonable critical value is an important basis for the quality of the accessibility analysis. According to the Urban Residential Area Planning and Design Standards, the service radius of a primary school should not exceed 800 m. However, in practice, over 80% of the primary school facilities in the second and third circles were not accessible, except for the five urban areas in the center of Chengdu, which was not in line with the actual situation. To address this situation, this study used buffer analysis to determine the appropriate service radius; each primary school was taken as the center, and a buffer zone was established. Through a comparison, it is found that when the buffer radius is 5000 m, the buffer coverage can reach the degree of 98%, so this study selected 5000 m as the search radius. Based on the impact of traffic lights on travel paths and the transportation modes used by children for commuting, it was established that the maximum distance for children to walk to school is 500 m, the distance range for choosing electric motorcycles as a mode of transportation to school spans from 500 m to 2500 m, while the distance range for opting for cars is between 2500 m and 5000 m.
The MM2SFCA method is divided into two steps: in the first step, the supply/demand ratio Rj is calculated for the demand point, settlement I, within the search range of the supply point school j under different transport modes Mn.
The priority order of transportation modes is walking (
M1), electric motorcycles (
M2), car (
M3). To avoid accumulating and repeatedly calculating the population of residential areas under different traffic modes, the population of residential areas covered by the previous preferred traffic mode needs to be deducted when calculating the population of residential areas under the next preferred traffic mode; see Equations (5) and (6).
where
Pi(
Mn) denotes the number of the demand population of settlement
i within the search radius in the
Mn traffic pattern,
P′i(
Mn) is the number of the population of all demand points in the
Mn traffic pattern minus the number of demand points within the search radius in the priority
Mn-1 traffic pattern,
Gij(
Mn) is the weight of the selection of settlement
i to school
j in the
Mi traffic pattern, and
g(
dij(
Mn)) is the distance attenuation function (Equation (7)).
In the second step, following the same calculation, the supply–demand ratio
Rn of school
j within the search radius of each settlement
i under the
Mn traffic pattern is calculated. Then, the supply/demand ratio of each school within the search area is scaled and accumulated to ultimately obtain the accessibility
Ai of each settlement
i (Equation (8)).
3.5. Spatial Autocorrelation Analysis
Spatial autocorrelation analysis is a spatial statistical method used to determine whether a variable exhibits a spatial correlation. If a variable becomes more similar at any time as the measurement distance decreases, this indicates that this variable exhibits a positive spatial correlation and vice versa [
33,
34,
35].
This study used the local binary Moran spatial autocorrelation method (MSAM) to analyze the clustering relationship between accessibility to primary school facilities and population distribution. MSAM is a measure of the similarity between a spatial unit and its domain. It indicates the degree to which each local unit obeys the global general trend and can be used to represent spatial heterogeneity through LISA diagrams to illustrate how spatial dependence varies with the location. The calculation is shown in Equation (9).
where
Iap is the bivariate global autocorrelation index,
N is the total number of spatial cells,
Wij is the spatial weight matrix,
Zia is the normalized value of the accessibility of the
ith gridded primary school, and
Zjp is the normalized value of the population size of the
jth street.
5. Discussion
5.1. Population Change with a “One Point, Many Cores” Pattern
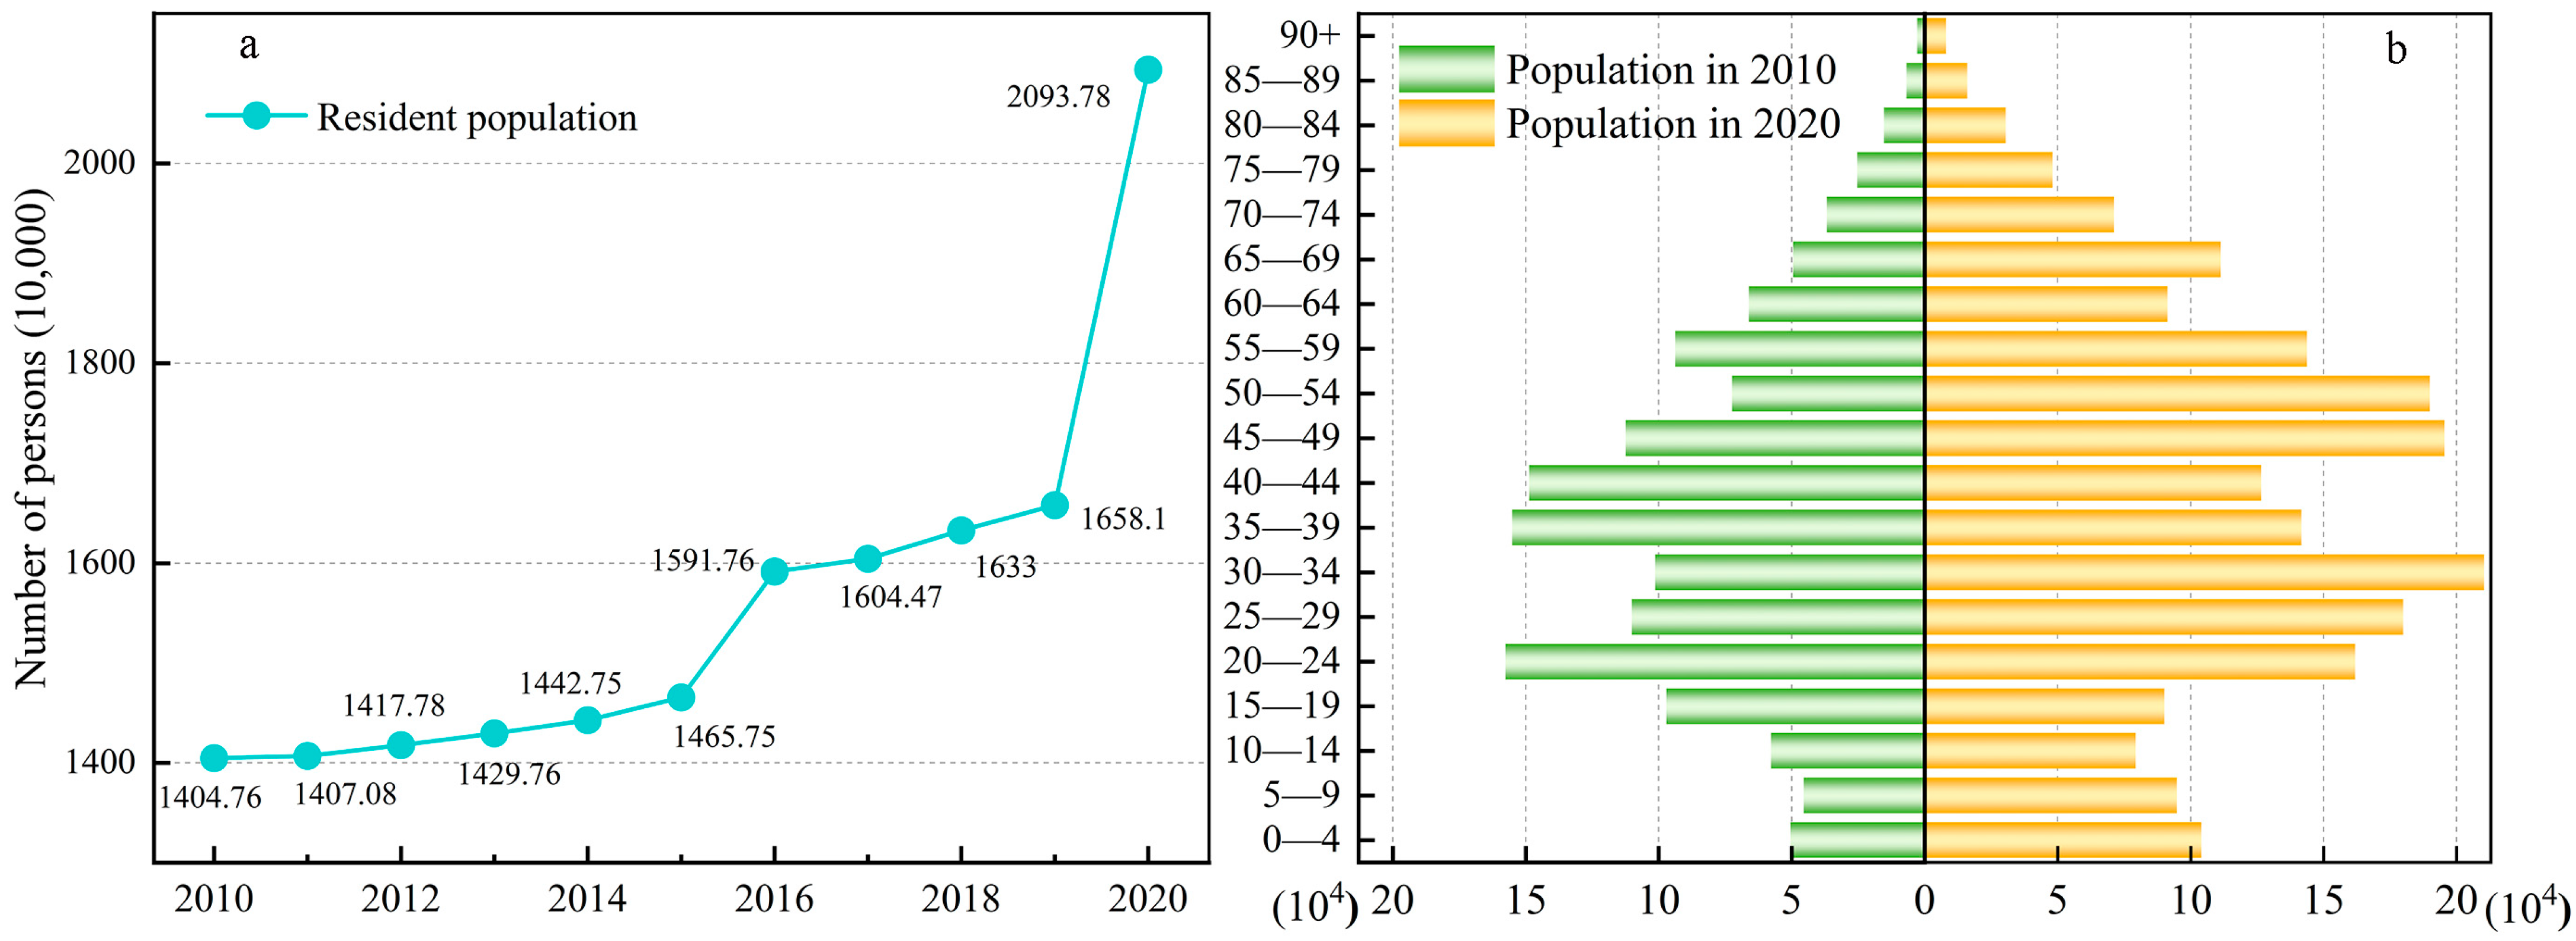
The year 2010 was the sixth population census of Chengdu, and 2020 was the seventh population census of Chengdu. Analyzing the population changes over the 10-year period and comparing the age structure, the total population of Chengdu was large, with a total resident population of 20,937,800 in 2020, accounting for 25.02 per cent of Sichuan Province, an increase of 6,890,200 compared with 2010, a growth rate of 49.04 per cent, and a huge increase in the 10-year period.
In terms of the age composition of the population, the data from the Seventh Population Census show that the structure of the population has changed in an elongated ‘U’ shape, i.e., the proportion of the population in the younger and older age groups has increased, and the proportion of the population in the middle working-age group has decreased. Census data show that the number of children aged 0–14 increased by 1,487,000 compared to in 2010, an increase of 3.9 percentage points, indicating that the number of children of primary school age has continued to grow significantly in recent years and will continue to do so in the coming years.
From the perspective of spatial distribution, the current population distribution in Chengdu City shows a trend of centralized and differentiated development [
36]. The population decreases from the center to the periphery. The overall distribution of primary school-age children shows a decentralized pattern of “one point and multiple nuclei”, where “one point” was the central circle composed of Chengdu’s earliest urban areas, including Jinjiang, Chenghua, Wuhou, Qingyang, and Jinniu districts, which have a long history of development, strong economic strength, and well-developed transportation and various types of infrastructure, attracting a large number of foreigners to move in and settle, forming a high degree of aggregation of primary school-age children in the central urban area; here, “Multi-core” was the central urban areas of the second and third circles, which are generally located in the economically developed central urban areas, which have proposed preferential policies to attract enterprises to invest in the development of the region, promote the development of the economy, and form the characteristics of a single point of primary school-age children agglomeration. Among them, most of the urban areas in the third circle were transferred from the Chengdu Municipality in recent years. The distribution of primary school-age children is low due to various factors, such as the topography, economy, and transportation. They are mainly concentrated in the lower part of the mountain range in the Chengdu Plain area.
At the same time, we have found that the distribution of primary school facilities in Chengdu was similar to the distribution of the population of primary school-age children, with the characteristics decreasing from the center to the outside, with the central circle having the highest density and the second and third circles having gradually decreasing densities. The central circle has a rich developmental history, high population density, and comprehensive infrastructure. The areas with higher density in the second and third circles are mostly concentrated in the urban center and are more complete due to the concentration of the population [
37].
5.2. Spatial Accessibility of Primary Schools Is Closely Linked to the Distribution of School-Age Children by Population
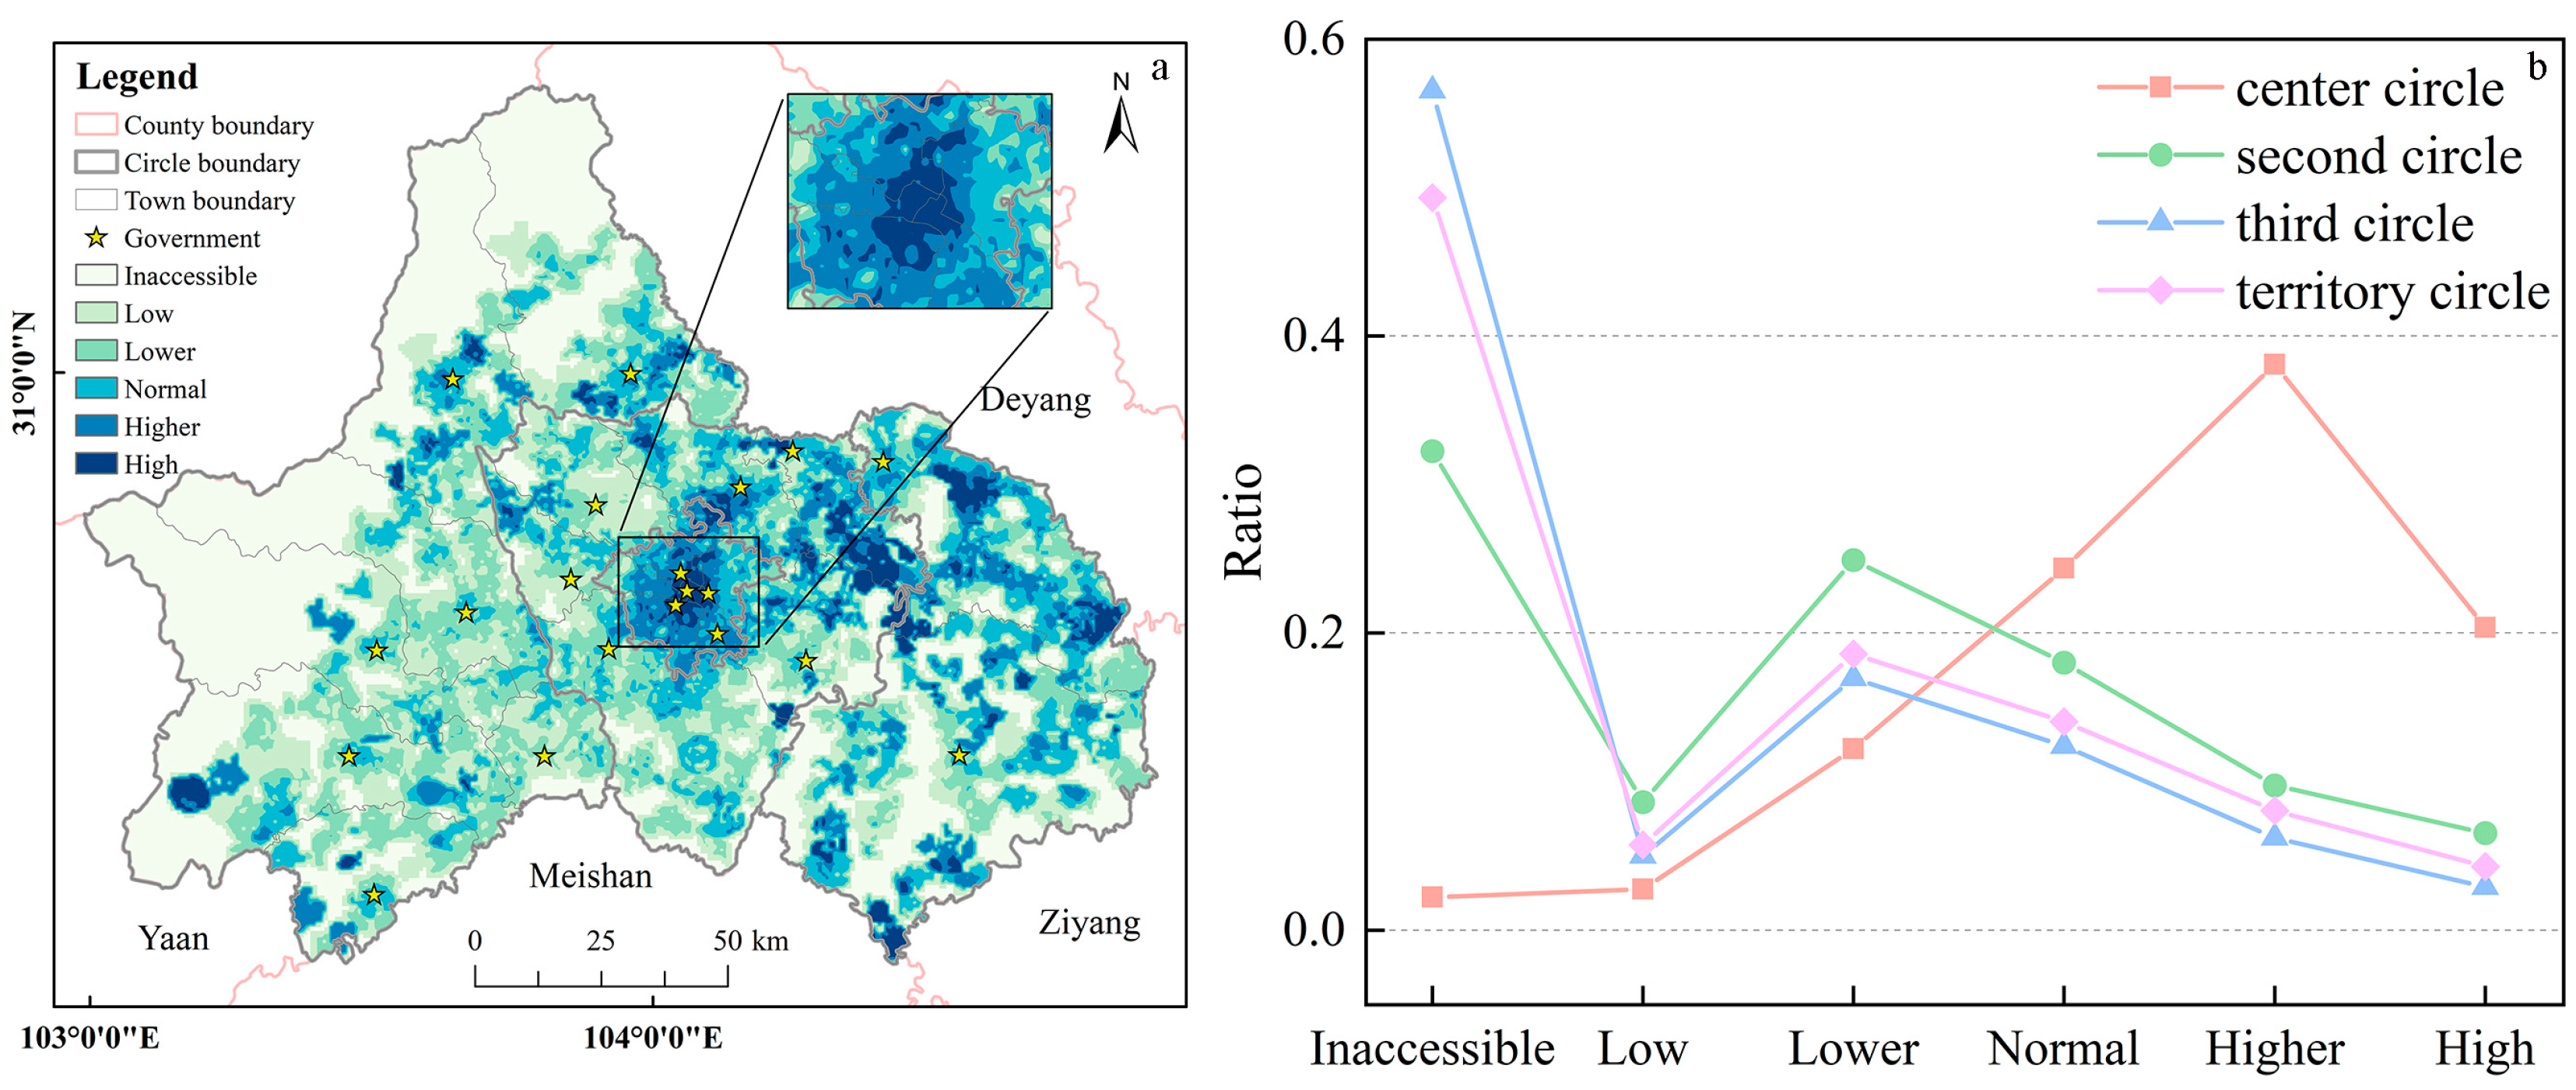
Overall, the accessibility of Chengdu’s central city and the central cities of its districts and counties was good. However, there was still significant variability across regions and circles.
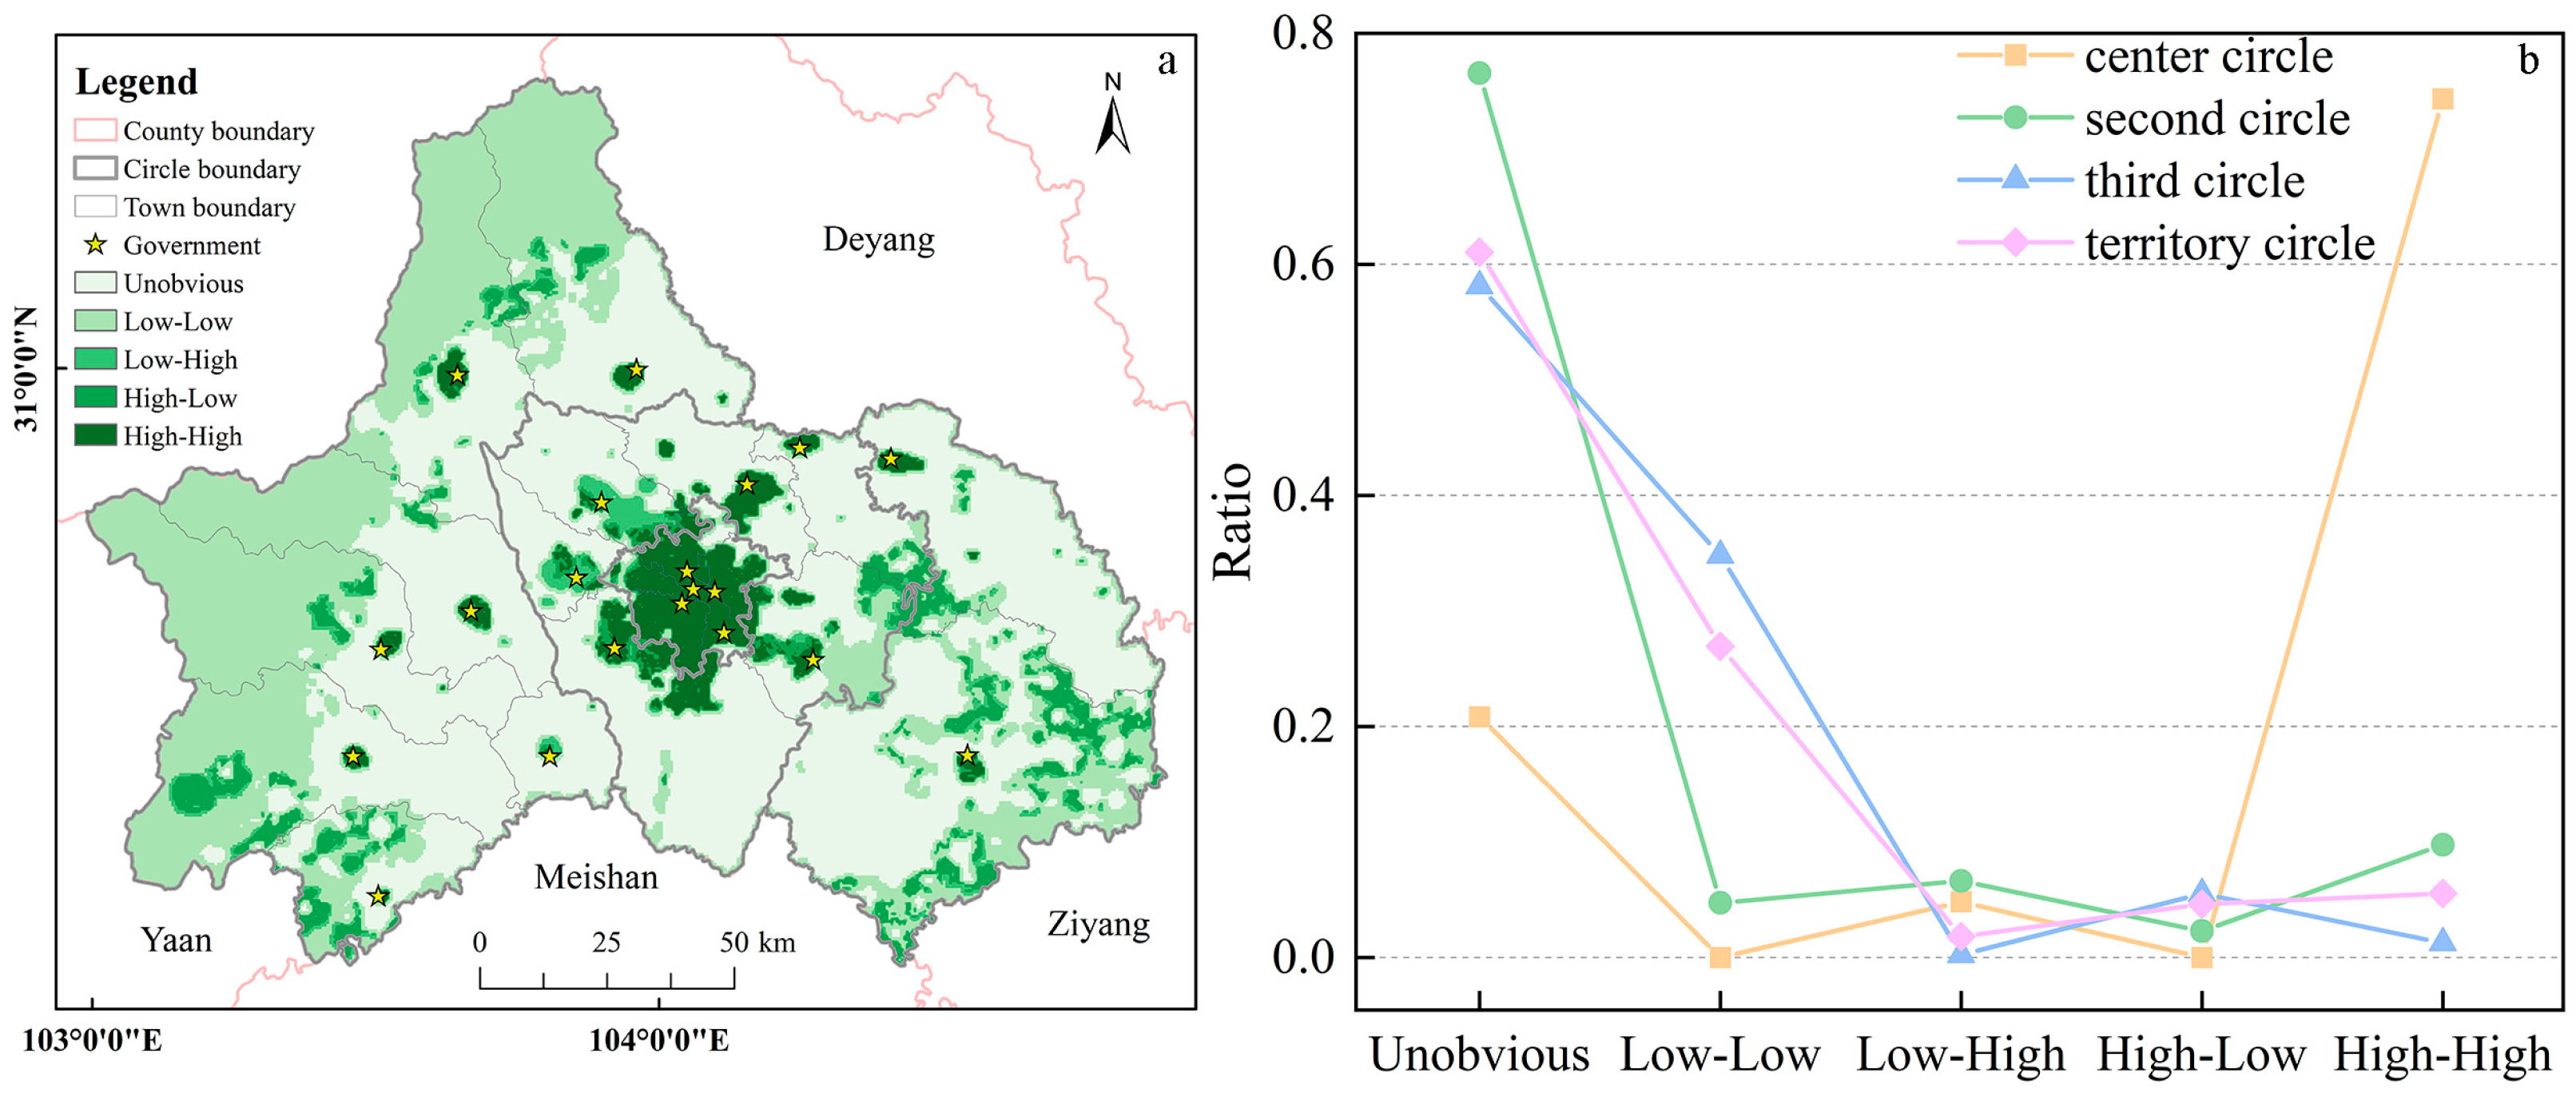
Highly accessible and relatively highly accessible areas were mainly distributed in the city center and the district and county centers of the second and third circles. These areas have better economic development, a dense population distribution, and sufficient primary education resources, so they have higher accessibility. The highly accessible areas are also found in the right-hand edge areas of the Longmen Mountain in the western edge of Chengdu, the rural areas of Jianyang City, and the Longquanyi section of the Qingbaijiang urban forest park. The analysis combined the accessibility results with the correlation of the population. The findings indicate that these areas have a remote geographical location, sparse population distribution, and a larger service range of primary schools compared to the city center. However, due to the impact of transportation and road networks and the study’s set 5000 m search distance, fewer people are eligible within the primary school service range, resulting in higher accessibility. This created a high-low clustering situation, which highlights a mismatch between the distribution of primary school facilities and the population.
The low-high clustering areas represented regions with lower accessibility to primary schools but high population densities, mainly located in the Pidu, Wenjiang, Shuangliu, and Longquanyi districts. These areas were located in the second circle of Chengdu, which had good transportation and was in a rapid development stage. The population of the five central urban districts was oversaturated, and an increasing number of residents were choosing to live in the second circle. With a large influx of population, the original primary school resources in the second circle were inadequate to support the impact of rapid population growth, resulting in a low-high clustering situation with low accessibility but a high population density.
The low-low clusters are widely distributed in the Longmen Mountain area in the western part of Chengdu City [
38], as well as in the rural areas of Pujiang County, the border area between Jianyang City and Ziyang City, and the intersection of Longquanyi District, Qingbaijiang District, and Jintang County. Considering the higher altitude of the western area and the simultaneous existence of several nature reserves and scenic spots, this results in a lower distribution of primary school facilities and population in the western part of the area. The border and peripheral areas of Pujiang County and Jianyang City are affected by the geological environment, the influence of transportation and road networks, and the lower distribution of the population, which resulted in a lower accessibility of primary school facilities [
39].
5.3. Uncertainties and Limitations
This paper simulated the population distribution of Chengdu city on a 250 m grid, used kernel density estimation and an imbalance index to analyze the spatial distribution characteristics and balance of primary school facilities in Chengdu city, measured the accessibility of primary school facilities in Chengdu city, and finally analyzed the correlation between the spatial distribution of primary school-age children and the accessibility of primary school facilities by using Moran’s spatial autocorrelation variable [
20]. The presented methodology can serve as a reference for evaluating the spatial equity of other public service facilities in cities. However, this paper has some limitations. Firstly, this study combined multi-source data to simulate the distribution of primary school-age children in a 250 m grid in Chengdu, and although the accuracy was improved compared to most studies, there was still room for further improvement. Secondly, this study did not distinguish well between quality education and general education in primary schools, and this needs further improvements.
Therefore, future studies should evaluate the spatial distribution and accessibility of primary school facilities in a more practical and refined manner, taking into account the actual schooling situation and the needs of different areas and residents. This will provide more accurate suggestions for the allocation of primary school facilities. Additionally, it is important to study the causes and effects of educational resource equity [
16].
6. Conclusions
The significance of education in social development is becoming increasingly prominent. Vigorously promoting educational equity and promoting the sustainable development of education are conducive to the sustained, stable, and healthy development of the national economy, improving people’s living standards and quality, promoting social equity and justice, and reducing poverty and inequality.
We used population spatialization to analyze the distribution of the resident population and the population of primary school-age children in Chengdu, measure the balance of primary school facilities, and finally analyze the correlation between the primary school-age children and accessibility by combining spatial autocorrelation [
40]. The population of Chengdu has been growing rapidly in the most recent ten years, and the number of primary school-age children was also increasing. The overall distribution of primary school-age children in Chengdu shows a decentralized pattern of “one point, many nuclei”, with the population decreasing from the center to the periphery, which mainly depends on the economic strength and the degree of development of transportation and various types of infrastructure, which can attract a large number of foreigners to move in and settle down. The distribution of primary school facilities was similar to the distribution of the population, mainly built around the population; with an imbalance index of 0.257, there was a certain imbalance, which was mainly represented by a larger number of primary school facilities in the east-central part of the city and a smaller number in the west.
Furthermore, the central area of Chengdu boasts excellent accessibility and a high population density. The accessibility and population of the second ring were mainly concentrated in the urban development center. However, due to the rapid growth of population and the lack of a timely increase in educational resources, the accessibility and population of the second ring also presents a low-high clustering situation. The third circle presents a low accessibility and low population situation as a whole, but due to the influence of transportation networks and population spatial gridlization, some grid populations were extremely low, resulting in a high supply–demand ratio calculated within the search radius, showing a high accessibility and low population relationship in some marginal areas [
38].
This study attempted to analyze the spatial distribution and accessibility of primary school facilities in Chengdu from a holistic perspective, highlighting the imbalance and accessibility of primary school facilities in Chengdu, as well as the correlation between accessibility and the population of primary school-age children, in order to provide ideas and suggestions for the allocation of relevant educational facilities.

