1. Introduction
Cities are experiencing a considerable rise in population and an increase in the number of automobiles. Studies to understand traffic characteristics are essential to facilitate efficient flow. The behavior of traffic flow on arterial roads is quite dynamic and more challenging than on rural highways. This is because urban roads have more complex topologies, a variety of vehicles, different driver behavior, and traffic flow, among other factors [
1]. In developing countries, the presence of non-adherence of lane discipline and heterogeneous traffic flow have a significant impact on how vehicles travel in the traffic stream. The various types of vehicles plying on the roads have diverse static and dynamic characteristics [
2]. Vehicles tend to travel on any part of the road instead of traversing according to a lane discipline. Traffic signals at intersections necessitate vehicles to move as a group of vehicles on urban road sections [
3]. The state of traffic flow can be divided into three distinct states: free-flow conditions, intermediate traffic conditions, and congested traffic conditions. In free-flow conditions, vehicles can travel at or close to their desired speed with minimal interruptions or delays. Intermediate traffic conditions refer to a state where there is moderate traffic volume, some level of congestion or slowdowns, and still relatively smooth vehicle movement. Congested traffic conditions, on the other hand, occur when there is heavy traffic volume, limited spacing between vehicles, and decreased speeds. In congested traffic conditions, vehicles may experience significant delays, stop-and-go movement, and overall reduced traffic flow. The vehicles traveling on urban roads can be generally categorized into two types, namely, following vehicles (platooned vehicles) and non-following vehicles (free vehicles) [
4]. In the following condition, the subject vehicle’s speed is impeded by the presence of the vehicle ahead [
5]. But in the case of the non-following vehicles, the subject vehicle has no interaction with the preceding vehicle. In order to comprehend the behavior of vehicles in group or individual vehicles, there is a prerequisite to study the vehicle interaction in the stream. Vehicle interaction is a term used to describe the extensive range of interactions between all vehicles on the roadway, regardless of their position in the group or platoon. In heterogeneous traffic conditions, the interaction between the vehicles and their behavior is influenced by the area occupied and the maneuverable capabilities of different vehicle classes [
6]. The development of a framework to define the interaction of vehicles within the traffic stream is pivotal to identifying vehicle platoons.
The concept of vehicle platooning has recently attracted significant attention due to its potential to optimize traffic flow, infrastructure planning, and design; its potential use in intelligent transportation systems; and the potential to understand the interaction between autonomous vehicles and driver-driven vehicles. A platoon is defined as a group of vehicles traveling together, either by choice or because of signal control, geometric factors, or other factors [
7]. Vehicle platooning offers a promising path toward a more sustainable and efficient transportation system by reducing emissions, improving traffic flow and road safety, and optimizing fuel usage [
8]. Understanding the dynamics of how vehicles interact in a platoon allows for the development of advanced technologies and strategies for traffic management. The investigation into platoon-related studies commenced in the 1950s [
9], and numerous researchers have documented the application of such studies to reduce fuel consumption and emissions, alleviate traffic congestion, enhance traffic flow, optimize traffic signals, facilitate autonomous driving, and optimize freight and logistics [
10]. Taweesilp et al. [
11] studied the behavior of platoons under various traffic volumes on multi-lane highways, and platoon parameters were employed to evaluate road performance. The level of service (LOS) for two-lane roads was forecasted using vehicular platooning variables [
12]. Gaur et al. [
13] developed a model to detect vehicle platoons in real time, which facilitates the real-time adjustment of signal timings. The majority of these investigations were conducted under homogeneous traffic conditions. In the case of heterogeneous traffic conditions, Gunasekaran et al. [
3] suggested platoon-based aggregation for the capacity estimation of urban roads. Praveen et al. [
14] estimated the passenger car unit for urban arterial roads under platooning conditions. Singh et al. [
15] studied the impact of commercial vehicles on vehicle platoons to understand the traffic flow characteristics of a highway. Badhrudeen et al. [
16] analyzed the platoon dispersion behavior under Indian traffic conditions.
Although earlier research has focused on various aspects of vehicle platoon studies, there have been limited studies on recognizing vehicle platoons on urban arterial roads. Studies conducted under homogeneous traffic conditions primarily depend on time headway as the primary parameter for identifying vehicle platoons [
5,
11,
17,
18]. But in the case of non-lane-based traffic conditions with a mixture of different types of vehicles, the movement of vehicles occurs both longitudinally and laterally. Therefore, it is imperative to take into account the impact of lateral clearance when identifying platoons. To address this issue, the present study has devised a three-step strategy for identifying vehicle platoons in the urban road network. This strategy enables us to examine the characteristics of vehicle platoons and their influence on the flow of traffic.
The subsequent section of this document is structured in the following manner.
Section 2 presents a comprehensive overview of the relevant research.
Section 3 delineates the framework of platoon recognition.
Section 4 details the process of traffic data collection and the estimation of critical headway.
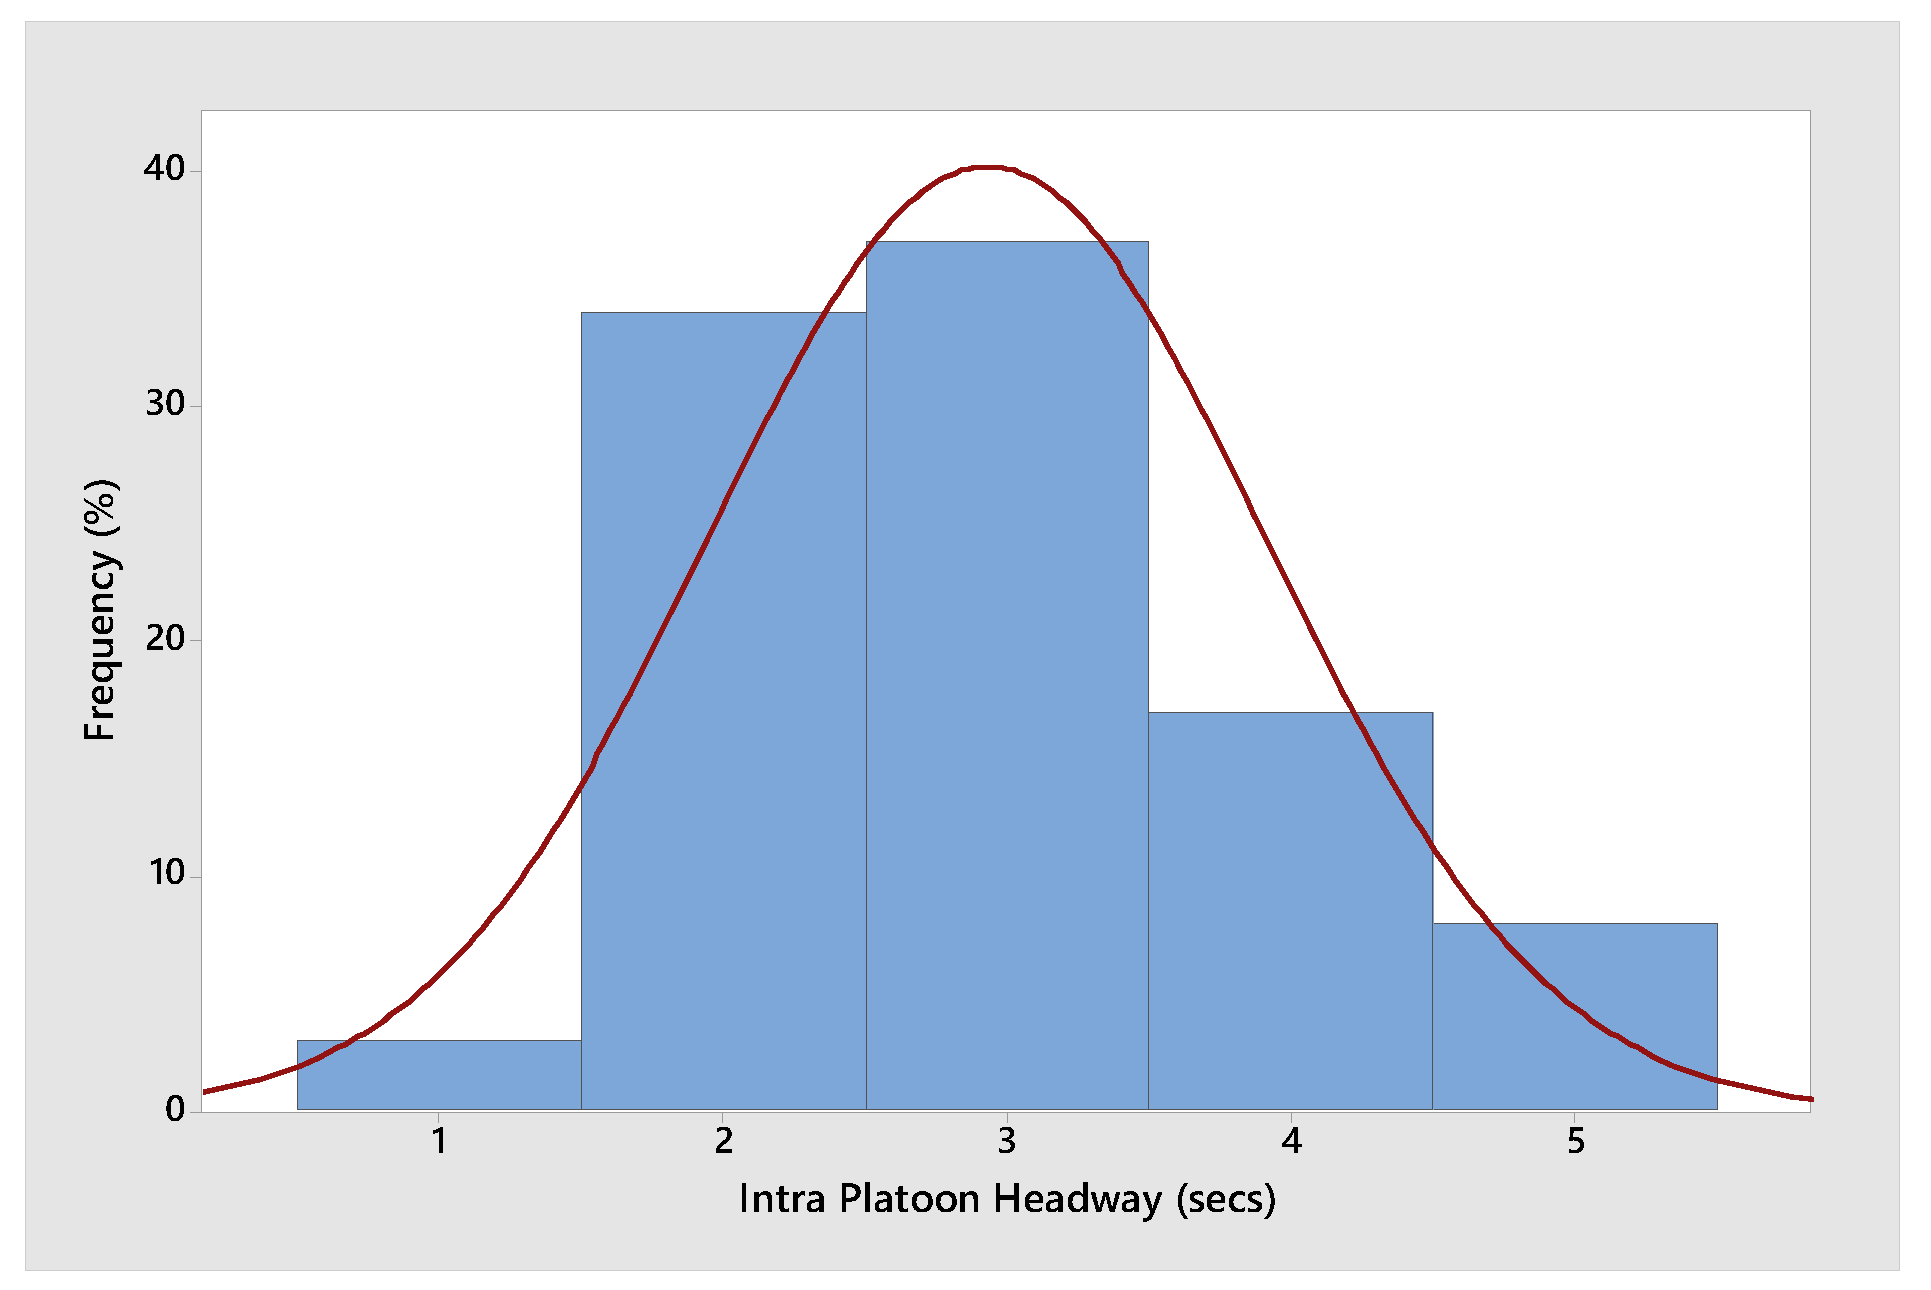
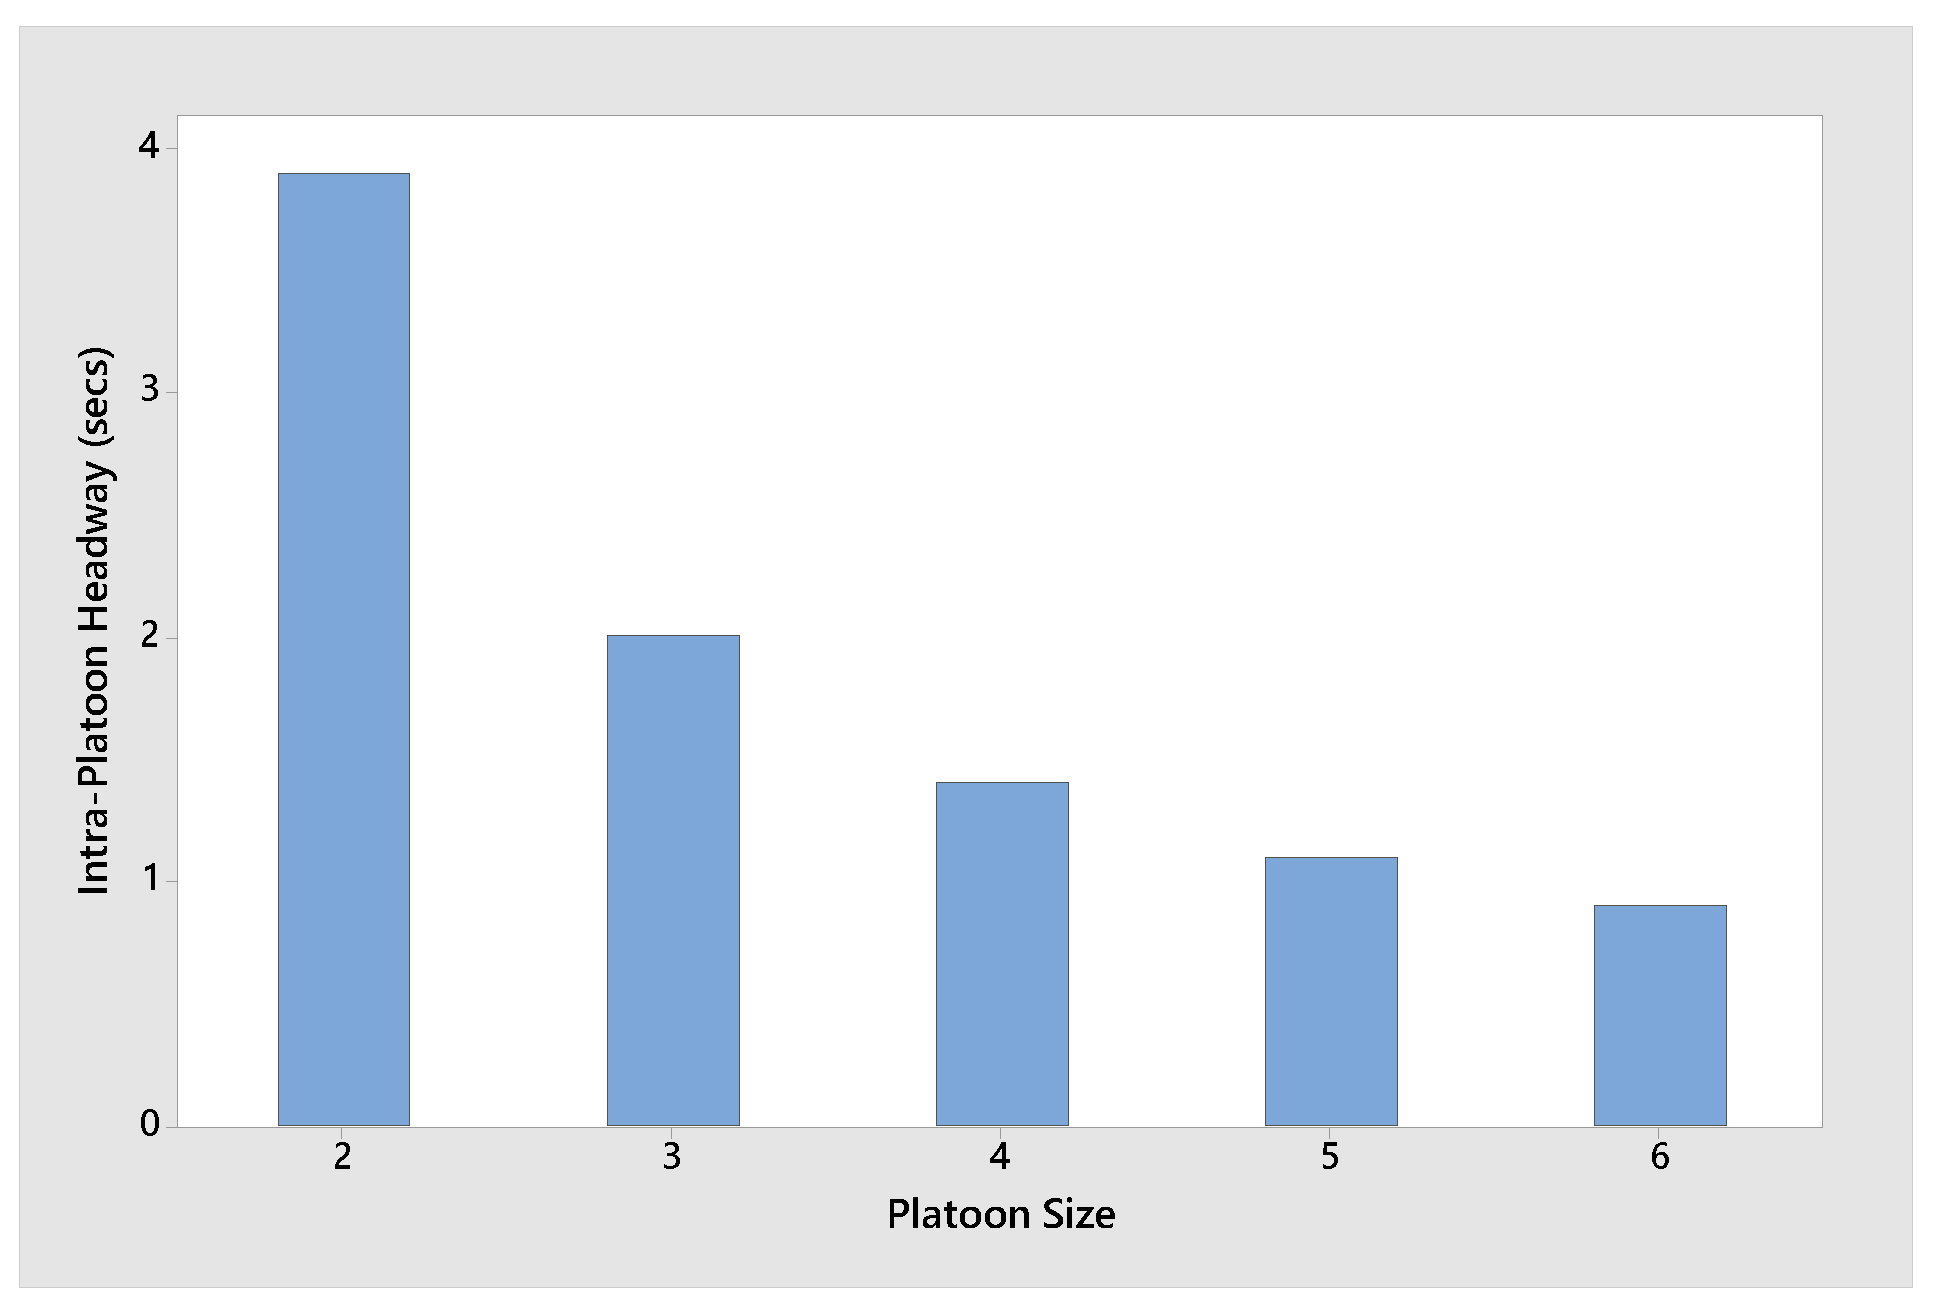
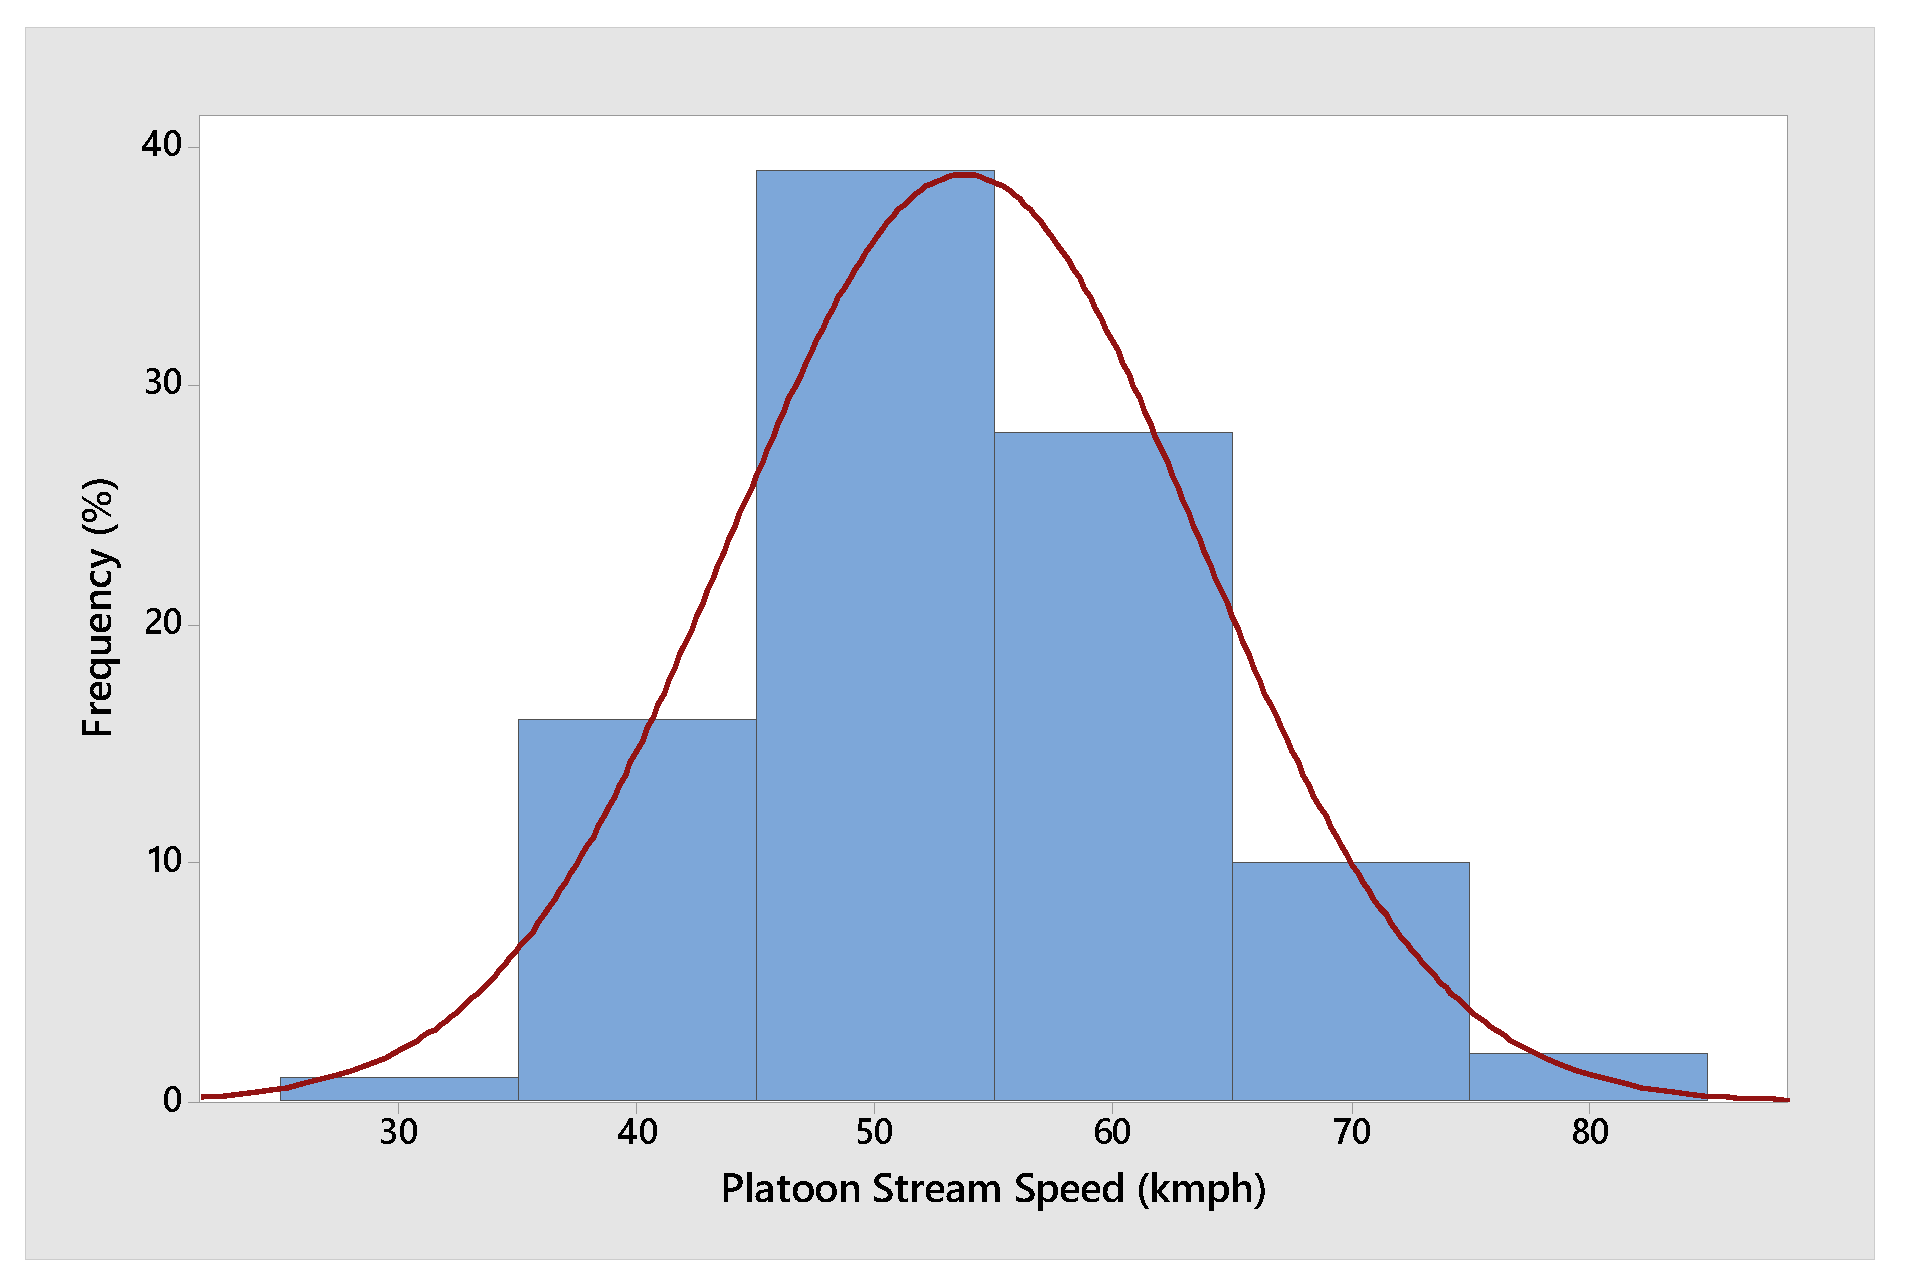
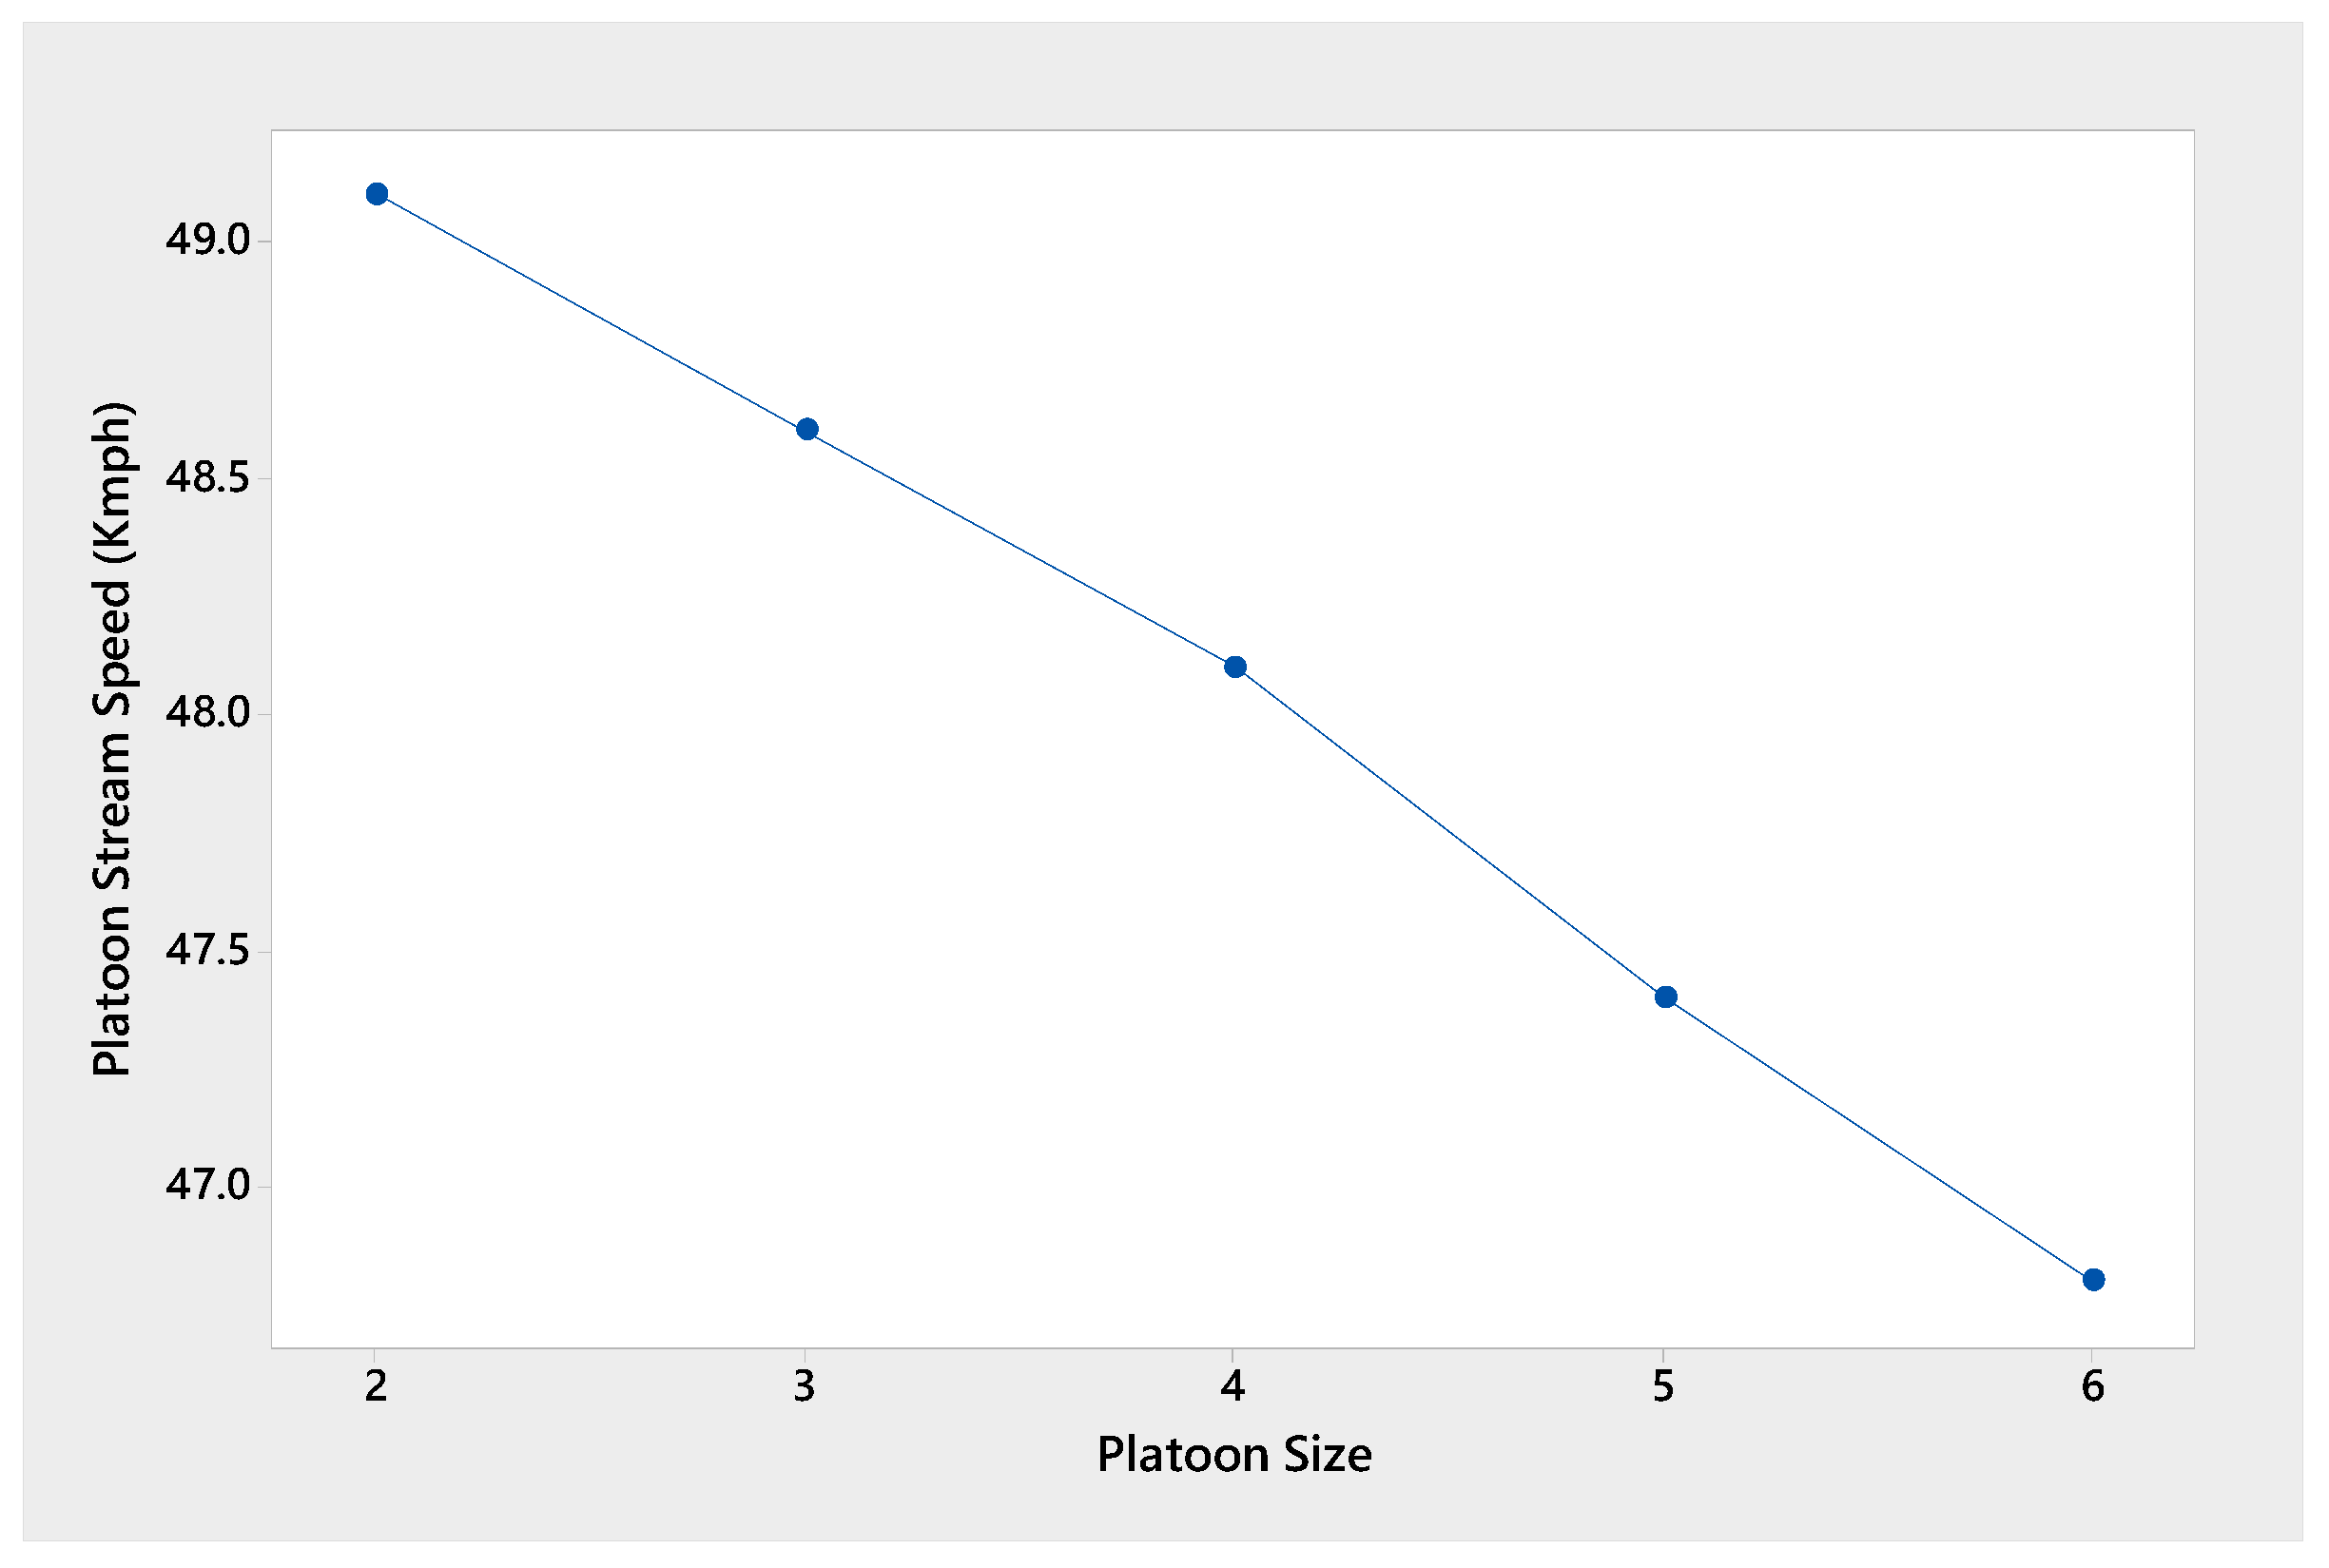
Section 5 expounds upon the characteristics of vehicle platoons, which encompass platoon size, intra-platoon headway, platoon stream speed, and the percentage of platoon formation. Finally,
Section 6 concludes this investigation and proposes future research directions.
2. Research Background
The investigation of vehicle platoon studies is vital for understanding and managing traffic on urban arterial roads. The identification of vehicle platoons on urban roads has drawn more attention in recent years. However, comprehending the ways vehicles interact with one another is the initial step in investigating platooning. In developed countries, numerous studies [
19,
20,
21,
22] have been conducted to understand the following behavior of vehicles under homogeneous conditions. However, investigating vehicle-following behavior in heterogeneous traffic presents a formidable challenge due to the intricate nature of non-lane-based vehicle movements and the diverse mix of vehicles on the road. Several researchers have documented the following vehicle behavior in the context of heterogeneous traffic. Mohd Erwan Sanik et al. [
23] conducted a study on car-following headway on multilane highways, thereby revealing that a significant portion of drivers tend to closely follow the vehicles in front of them, with a considerable proportion of vehicles traveling at headways of less than five seconds. The traffic flow characteristics and vehicle interactions on inter-city roads have been investigated through the utilization of a developed traffic simulation model known as HETEROSIM. A study quantified vehicular interaction in terms of a passenger car equivalent (PCE) [
24]. The vehicle interactions of different types of vehicles and the lateral shift propensity in disordered heterogeneous traffic were investigated using trajectory data [
25]. Raju et al. [
26] investigated the following behavior of vehicles in Indian traffic conditions through an analysis of trajectory data and the hysteresis phenomenon. The study detected leader–follower pairs and a variety of following behaviors, including exact (lane-based), staggered (non-lane-based), vehicle-following, closing, and giving-up behavior. Gunay [
27] proposed a car-following model that incorporates the influence of lateral friction due to the interactions between vehicles. The simulation results demonstrated that the width of the travel path has an impact on the speed of the following vehicle, while the distance between the leader and follower is reduced when there is an increase in lateral separation. Gaurav Pandey et al. [
28] introduced a modified cellular automata model for determining the rate of interaction through the utilization of traffic flow data collected in the field. This model takes into account the preference of each vehicle type for its lateral position and introduces a parameter, denoted as “b”, which allows for a gradual shift towards the preferred position on the road. Ramezani Khansari et al. [
29] conducted a study on the driving behavior in both lane-based and non-lane-based traffic flows. The investigation explored the correlation between time headway (TH) and lateral distance in non-lane-based traffic.
Recently, most of the research on vehicle platooning has been conducted from the perspectives of advancing technology, optimizing traffic management, and enhancing overall transportation efficiency, safety, and sustainability in the realm of transportation. Tiaprasert et al. [
30] presented a platoon recognition algorithm using connected vehicle technology and onboard GPS devices. Akopov A.S et al. [
31] proposed a multi-agent fuzzy transportation system to enhance the maneuverability of both manned and unmanned ground vehicles within the transportation network. Linheng Li et al. [
32] proposed a novel platoon formation and optimization model combining graph theory and safety potential field theory for connected and automated vehicles (CAVs) under different vehicle distributions. Jicheng Chen et al. [
33,
34] used a vehicular ad hoc network (VANET) for the effective identification and coordination of vehicle platoons, thereby enhancing the safety and performance of platooning systems. Maglaras et al. [
35] proposed a new algorithm called Virtual Forces Vehicular Clustering (VFVC) to create stable clusters in urban environments by using combined metrics such as vehicle position, geometry, relative velocity, and vehicle lane.
Vehicle platoon identification is a crucial task in studies related to vehicle platoons. The study of vehicle platoons originated in the 1950s, with Greenshield [
9] defining platoons as vehicles with a space headway of less than 200 feet. Subsequently, many researchers used time headway [
3,
17,
36], free gap [
37,
38], space headway, and relative speed to identify the platoon followers and free vehicles. Time headway is a widely used and frequently used measure to identify vehicle platoons, known as critical headway. If the headway is less than the critical headway, the vehicle is considered to be in a platoon. Surasak et al. [
11] examined platoon behavior on multi-lane highways and employed two approaches to determine the critical headway: the mean relative speeds method and the exponential headway model. The study adopted a critical headway range of 3–4 s. Singh et al. [
39] estimated a critical headway of 4 s. The mean absolute relative speed and time headway were utilized as an indicator of variability to estimate the critical time headway. Jelena Kajalić et al. [
40] developed a logistic regression model to ascertain vehicle platoon membership; the model was assessed with different headway values (3 s, 2.5 s, and 2.1 s), and a critical headway of 2.1 s was selected for the study based on the analysis. Morral et al. [
41] identified platoons on two-lane rural roads by considering criteria such as headway and speed differences. The study aimed to evaluate the level of service by examining platoon parameters observed on Indian multi-lane highways. For this evaluation, a critical headway of 5 s was adopted to analyze various platoon characteristics [
42]. Bennett et al. [
43] proposed that both time headway and relative speeds are effective in identifying platoon vehicles. Shiomi et al. [
44] examined the relationship between time headway and correlation in the speeds of two successive vehicles. Based on their findings, a critical headway of 4 s was estimated. According to the U.S. Highway Capacity Manual (TRB 2010), following vehicles are those that follow slowly moving vehicles with a headway value of at least 3 s. The critical headway of 3 s was adopted in identifying vehicle platoons. Vogel [
36] established a threshold of 6 s to distinguish interacting vehicles from free vehicles in urban areas. Gunasekaran et al. [
3] adopted a minimum free headway of 7 s to define the vehicle platoons on urban roads. Badhrudeen et al. [
45] conducted a headway analysis for leader–follower pairs, and their study employed a headway threshold value of 5 s to investigate the interaction between vehicles. Raffaele Mauro et al. [
46] proposed a statistically based model for characterizing vehicle interactions and platoons’ formation on two-lane roads. A time headway threshold value of 3 s was used to distinguish between the free and non-free moving behaviors of vehicles on two-lane roads. Sudheer et al. [
47] proposed automated techniques for detecting platoons in heterogeneous traffic through the utilization of three distinct methodologies: a cluster-based approach, a modified Gaur and Mirchandani approach, and an image processing-based technique.
Based on the aforementioned literature, it is evident that the majority of researchers perceive time headway as a technique for identifying vehicle platoons, while some studies also include time headway and speed as criteria in this recognition process. In the context of mixed traffic conditions, vehicle-following maneuvers play a crucial role. However, detecting vehicle platoons in mixed traffic conditions poses a more intricate challenge when contrasted with homogeneous traffic scenarios. Hence, the current study developed a framework that considers various factors, including critical time headway, the width of the interacting region, and relative speed to recognize vehicle platoons in a mixed traffic stream.
3. Framework of Platoon Recognition
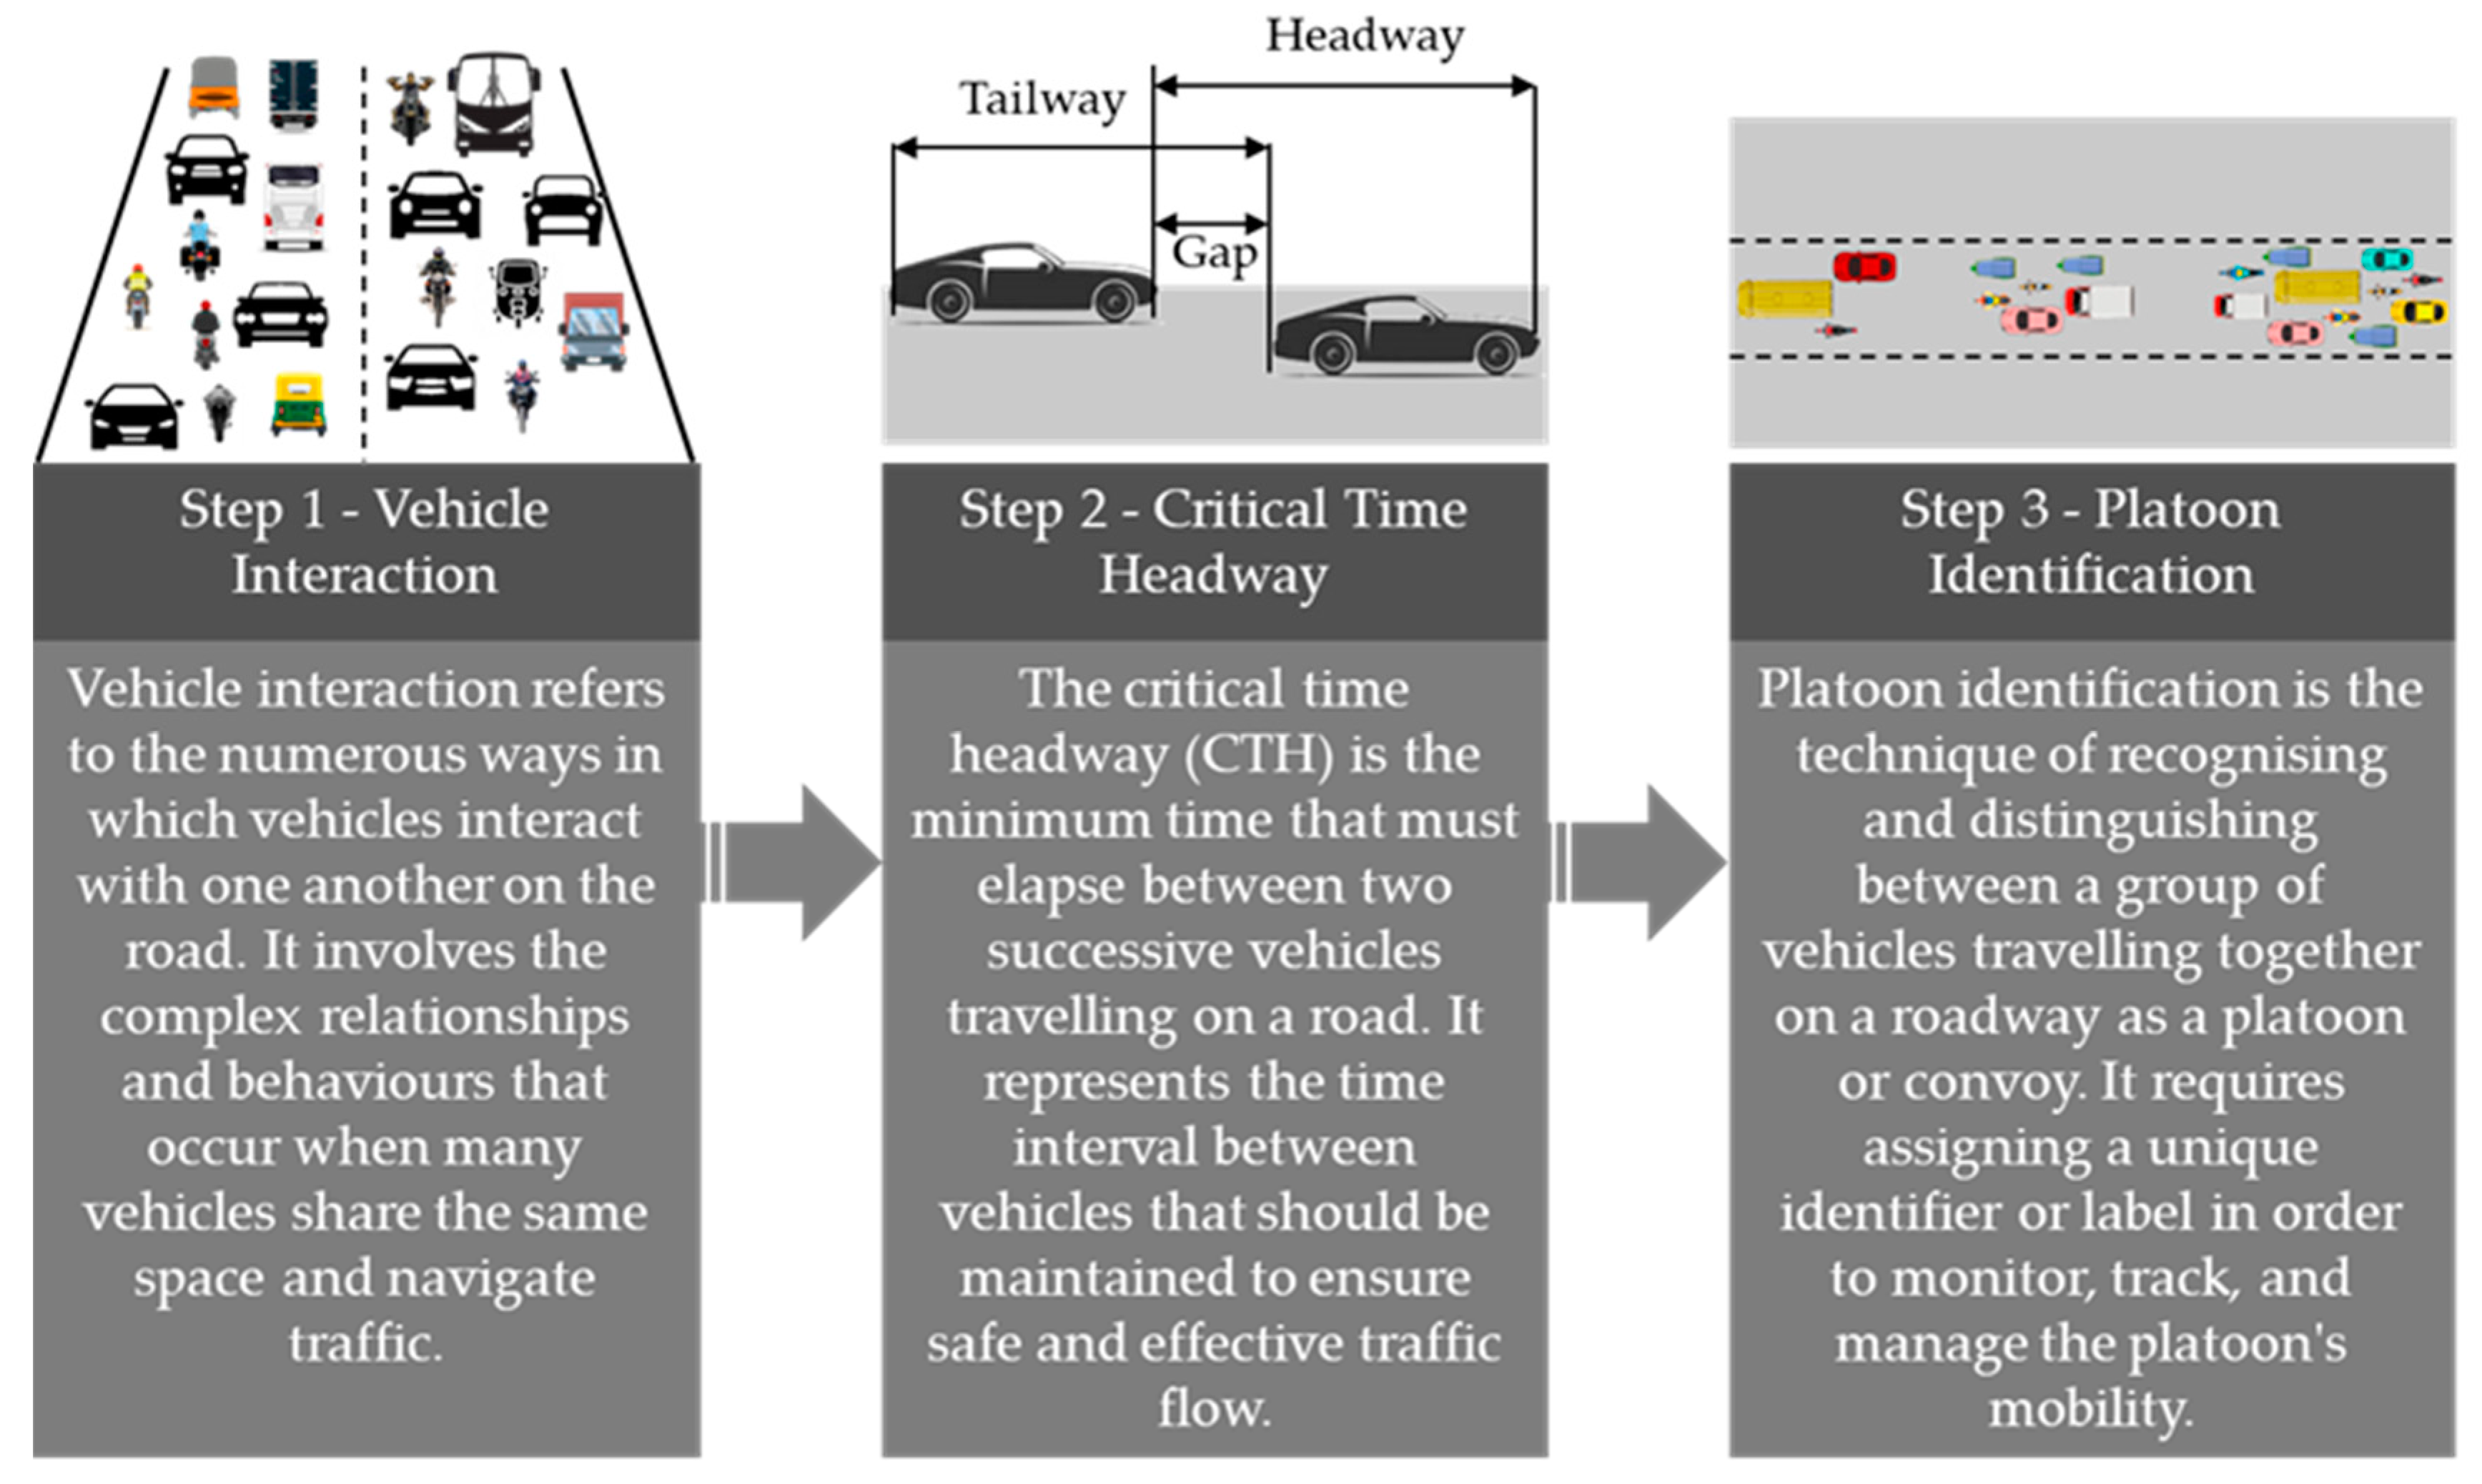
A traffic platoon is a group of vehicles that closely follow the leader vehicle maintaining a desirable spacing at a speed closer to the lead vehicle; in summary, they move as a group or convoy. Vehicle platoons are prevalent on city streets for a variety of reasons. One is that, unlike rural roads, traffic on urban roads can frequently be interrupted by signalized intersections. Another factor is that as traffic is heterogeneous, greater variances in the physical and operational features of vehicles (speed) cause the traffic stream to move in platoons when the chance of overtaking is nil. As the vehicles travel along the road section, the vehicles with substantially higher operational speeds tend to disengage from the platoon and combine with the next moving platoon. This occurrence continues until the next upstream intersection. Many scholars have examined platoon dispersion along signalized corridors, but relatively few have attempted to identify vehicle platoons in diverse traffic situations. The primary objective of this research is to acquire a better understanding of how vehicles interact with preceding vehicles and to investigate the circumstances behind the platoon formation that occurs in a mixed traffic stream. The current study provides a three-step strategy for identifying vehicle platoons in mixed traffic conditions. The graphic (
Figure 1) depicts a flow chart for platoon identification, which highlights three stages: vehicle interaction, critical time headway, and platoon identification.
3.1. Step 1: Vehicle Interaction
In heterogeneous traffic conditions, different vehicle types and sizes share the road and interact with one another. This heterogeneous traffic consists of a wide range of vehicles, including cars, motorized two-wheelers, motorized three-wheelers, light commercial vehicles (LCVs), medium commercial vehicles (MCVs), buses, and bicycles. Due to the distinct characteristics and maneuvering capabilities of each vehicle type, the driver tends to go anywhere along the road section and engages in longitudinal and lateral interactions with the leading vehicle. The degree of heterogeneity present in a traffic stream significantly impacts the speeds of the vehicles. Quantification of the level of interaction between moving vehicles becomes complex. Car-following models, simulation models, and cellular automata models were proposed in many studies to represent the interaction between two succeeding vehicles. These interactions are governed by various factors, such as the type of vehicle, speed, position, and driver behavior. Some eloquent studies [
2,
24,
26,
48,
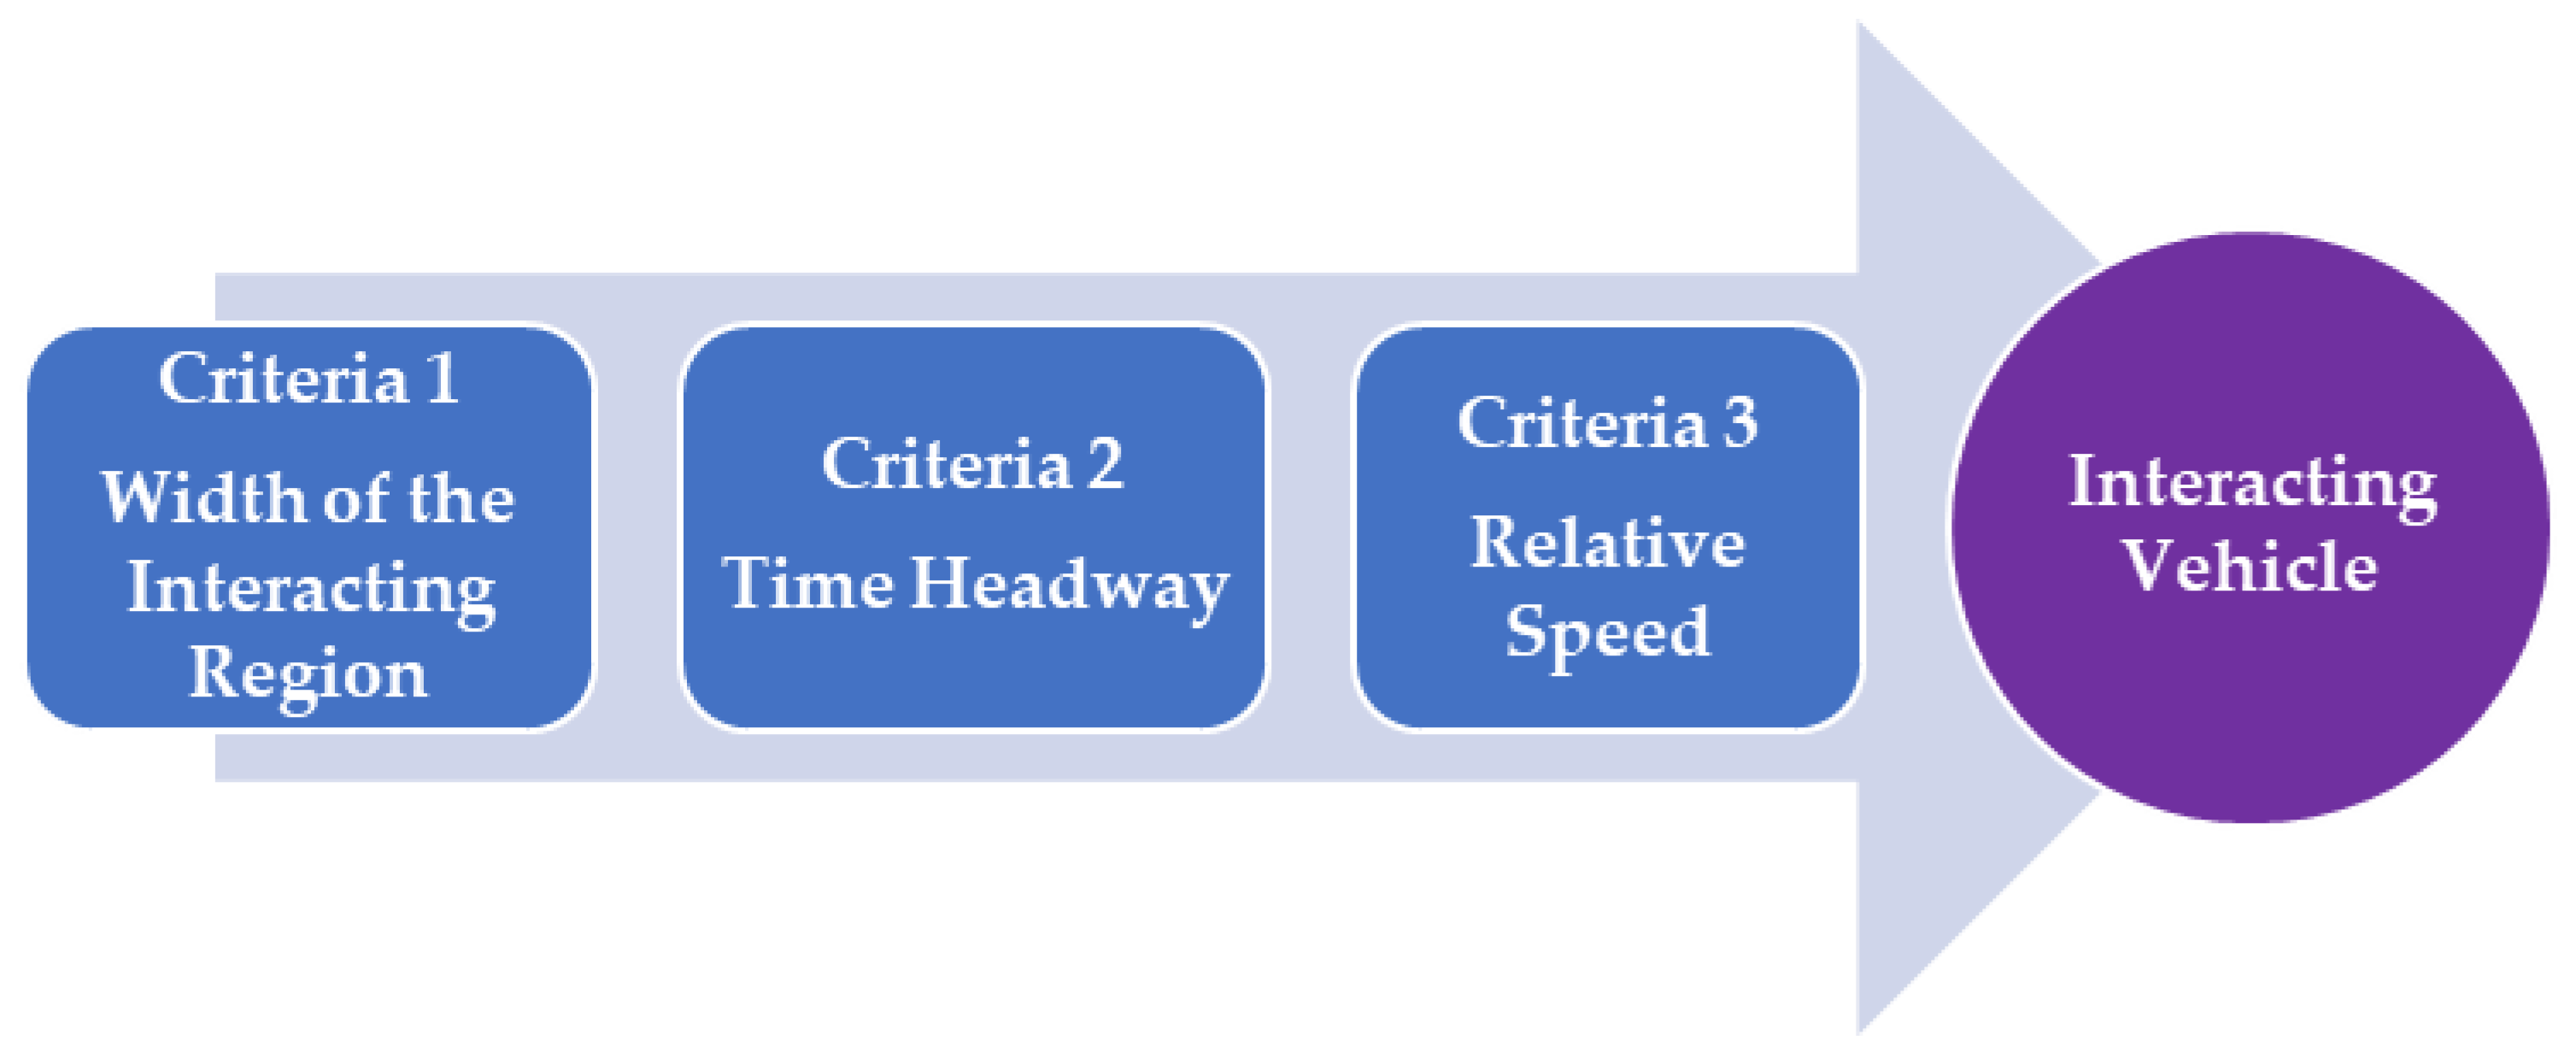
49] provide insight into how vehicles interact in heterogeneous traffic conditions. As recognizing interacting vehicles in traffic is vital for identifying the formation of a platoon, three criteria were considered to identify interacting vehicles in the stream, namely, the width of the interacting vehicle, time headway, and relative speed. To recognize interacting vehicles, a schematic diagram is presented in
Figure 2. In this study, any vehicle that satisfies the three criteria mentioned in
Figure 2 is stated as an interacting vehicle.
3.1.1. Criteria 1: Width of the Interacting Region
In traffic situations where the adherence to lane discipline is weak, vehicles exhibit heterogeneous characteristics, and with irregular driving behavior, there is a considerable amount of lateral movement. This lateral movement is influenced by vehicle dimensions, performance capabilities, and driver behavior. In recent studies, researchers have conducted investigations on the lateral interactions of vehicles in heterogeneous traffic flows. Gunay [
27] discovered that when a vehicle’s frictional clearance (FC) is less than 0.5 m, the subject vehicle follows the lead vehicle, thereby eliminating the possibility of lateral shifting. The speed of the subject vehicle is also influenced by the width of the travel path. Amrutsamanvar et al. [
25] defined an interacting region to recognize the interacting vehicles. This study examined a lateral threshold of 2 m on both sides of the vehicle, and the results revealed that more than 70% of two-wheelers executed lateral shifts between 0.6 and 1.2 m. Madhu et al. [
2,
6] reported the size of the vehicles, from which the following maneuvers have been taken into account while analyzing the vehicle interaction in an urban road section. In the case of heterogeneous traffic conditions, the sole consideration of time headway proves inadequate in the identification of vehicles interacting on an urban roadway. In addition to the time headway, it is essential to take into account the dimensions of the vehicles and the maneuvers they perform while following one another. Consequently, to identify interacting vehicles, a new term called the “width of the interacting region” has been introduced. The width of the interacting region is the sum of the width of the vehicle and a specified threshold value for lateral clearance on either side of the vehicle. The minimum lateral distance that a vehicle can maintain in the following condition is known as the lateral clearance threshold (LCT). In this present study, two categories of interactions have been taken into account: (1) the width of the subject vehicle ≤ the width of the lead vehicle, and (2) the width of the subject vehicle > the width of the lead vehicle. These two categories were defined considering the possible following maneuvers on the road section. This study also investigated two distinct types of following maneuvers: overlapping and non-overlapping. In overlapping following maneuvers, the subject vehicle either traces the lead vehicle path fully or partly. In non-overlapping following maneuvers, the subject vehicle does not trace the path of the lead vehicle and instead travels either the left or right end of the interacting region.
Category I–Width of the Subject Vehicle ≤ Width of the Lead Vehicle
For the case when the width of the subject vehicle is equal to or less than the width of the lead vehicle, the width of the interacting region is calculated using Equation (1). As the width of the subject vehicle is smaller than that of the lead vehicle, the subject vehicles employ the lateral shift only when they encounter a lateral gap of sufficient magnitude with the lead vehicle. In Category I, the width of the interacting region (W
IR) is computed by the width of the lead vehicle (W
LV) and the lateral clearance threshold (LCT) adopted for this study.
Figure 3a illustrates the systematic diagram of Category I and its following possibilities, which consist of the subject vehicle either strictly following the path of the lead vehicle or being positioned to the left or right side of the width of the interacting region.
Category II–Width of the Subject Vehicle > Width of the Lead Vehicle
In case where the width of the subject vehicle is greater than the width of the lead (
Figure 3b), the width of the interacting region is calculated using Equation (2). In Category II, the determination of the width of the interacting region is based on the width of the subject vehicle (W
FV) and the lateral clearance threshold (LCT) value adopted. Although the width of the subject vehicle is greater than that of the lead vehicle, it is essential to maintain a sufficient lateral gap to perform a lateral shift.
Figure 3b illustrates the systematic diagram of Category II and its following possibilities, which consist of the subject vehicle either strictly following the path of the lead vehicle or the lead vehicle being positioned to the left or right side of the width of the interacting region.
Whereas WIR is the width of the interacting region, WFV is the width of the subject vehicle (following vehicle), and LCT is the lateral clearance threshold.
Based on the dimensions of two successive vehicles, the vehicles are classified into either one of the aforementioned two classifications. Subsequently, the width of the interacting region is computed. If the position of the vehicle falls within the interaction region, the relevant vehicle is presumed to be interacting.
3.1.2. Criteria 2: Time Headway
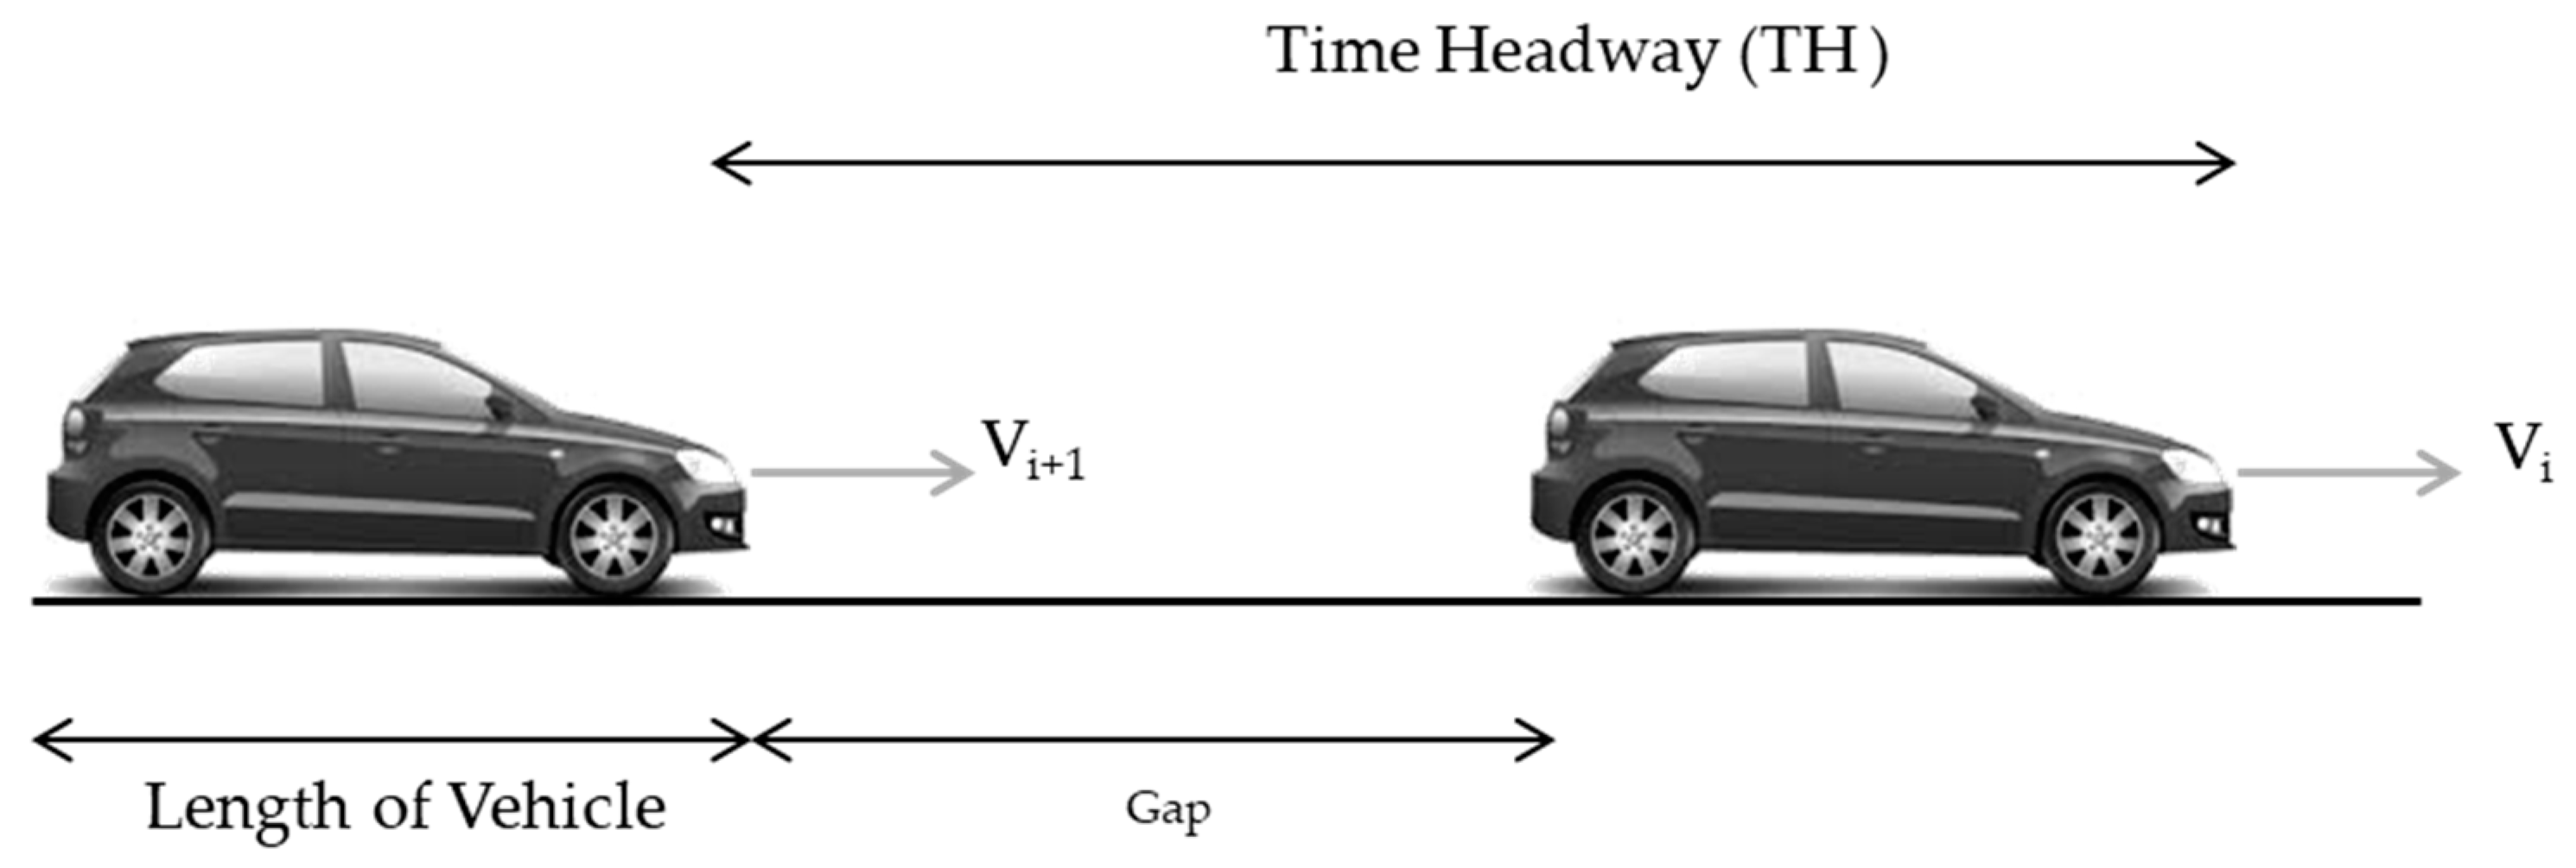
Time headway refers to the time duration between two successive vehicles passing through a designated point (
Figure 4). Numerous studies have demonstrated the significance of time headway in understanding vehicle behavior within a traffic flow. Some researchers have used time headway threshold values as a criterion to recognize following and non-following vehicles in the stream. Vogel [
36] established a threshold value of 6 s for the time headway to differentiate between interacting vehicles and free vehicles in urban areas. In a study by Boora et al. [
38], a critical gap of 10 s was proposed to identify free-flow traffic conditions on two-lane intercity roads. Al-Kaisy et al. [
5] found that a headway threshold value between 5 and 7 s was crucial in understanding the interaction between consecutive vehicles in the traffic stream. Additionally, Lay [
50] summarized that headway values exceeding 9 s could be considered to be indicative of free-flow conditions. Time headways ranging from 2.5 to 9 s were identified as the transition zone between following and free-flow traffic conditions. May [
51] mentioned sporadic occurrences of time headways exceeding 10 s. Based on the aforementioned literature, it has been noted that vehicles with time headways greater than 10 s exhibit minimal interaction with successive vehicles. In the present study, vehicles with a time headway of 10 s or less were assumed to be interacting.
3.1.3. Criteria 3: Relative Speed
The difference in speed between the preceding and subject vehicles is a crucial parameter in determining their following behavior. Drivers tend to adapt their speed and sustain a distance commensurate with the speed of the preceding vehicle. Many researchers have incorporated the concept of relative speed into the development of car-following models [
52,
53,
54]. Jiang et al. [
55] developed a car-following model that takes into consideration both the distance (gap) and relative speed between two consecutive vehicles. The researchers inferred that the relative speeds of vehicles have an impact on their following behaviors. In the study by Zhang et al. [
56], the relative speed, relative distance, and the speed of the subject vehicle were considered as inputs for car-following scenarios. The relationship between relative distance and relative speed was examined to comprehend the behavior of the following vehicle. In the context of inter-city roads, the difference in speed between two consecutive vehicles has been proposed as a new measure to identify free vehicles. A speed difference limit of −4 to 10 km/h, along with a time gap of 10 s, was used to identify the following vehicles [
57]. The aforementioned literature highlights the importance of relative speed in the identification of vehicle interactions. In this study, a relative speed of 10 km/h has been considered.
In the first step, vehicles meeting all three criteria—a time headway of 10 s or less, a position within the width of the interacting region, and a relative speed less than or equal to 10 km/h—are identified as interacting vehicles. Subsequently, the relative speed and time headway of these interacting vehicles are then employed to calculate the critical headway.
3.2. Step 2: Critical Time Headway
The critical time headway (time headway threshold) is estimated to identify the vehicles in platoons. The estimation of the critical time headway is crucial to identifying vehicle platoons. To identify the platoon followers, numerous researchers have used various criteria, such as time headway, free gap, space headway, and relative speed. Several researchers used different methods such as mean relative speed [
11,
39,
42], the exponential headway model [
11], and the coefficient of variation (CoV) of speed [
58] to estimate the critical time headway, since the speed and time headway influence the platoon formation on urban road sections. In this study, the mean absolute relative speed of vehicles and their time headway have been considered valuable factors in estimating the critical time headway.
3.3. Step 3: Platoon Identification
In mixed traffic conditions, vehicles interact both longitudinally and laterally with the preceding vehicles. The speed difference with the lead vehicle has a significant impact on the behavior of the following vehicles. Therefore, in this study, a novel approach has been proposed to recognize vehicle platoons by employing three criteria: the width of the interacting region, the critical time headway, and the relative speed. The identification of platoons follows a process analogous to vehicle interaction, as illustrated in
Figure 2. In platoon identification, instead of using a time headway of 10 s, the critical time headway, computed from the field data, is utilized. The other criteria, namely, the width of the interacting region and the relative speed, were used to define the vehicle interaction.
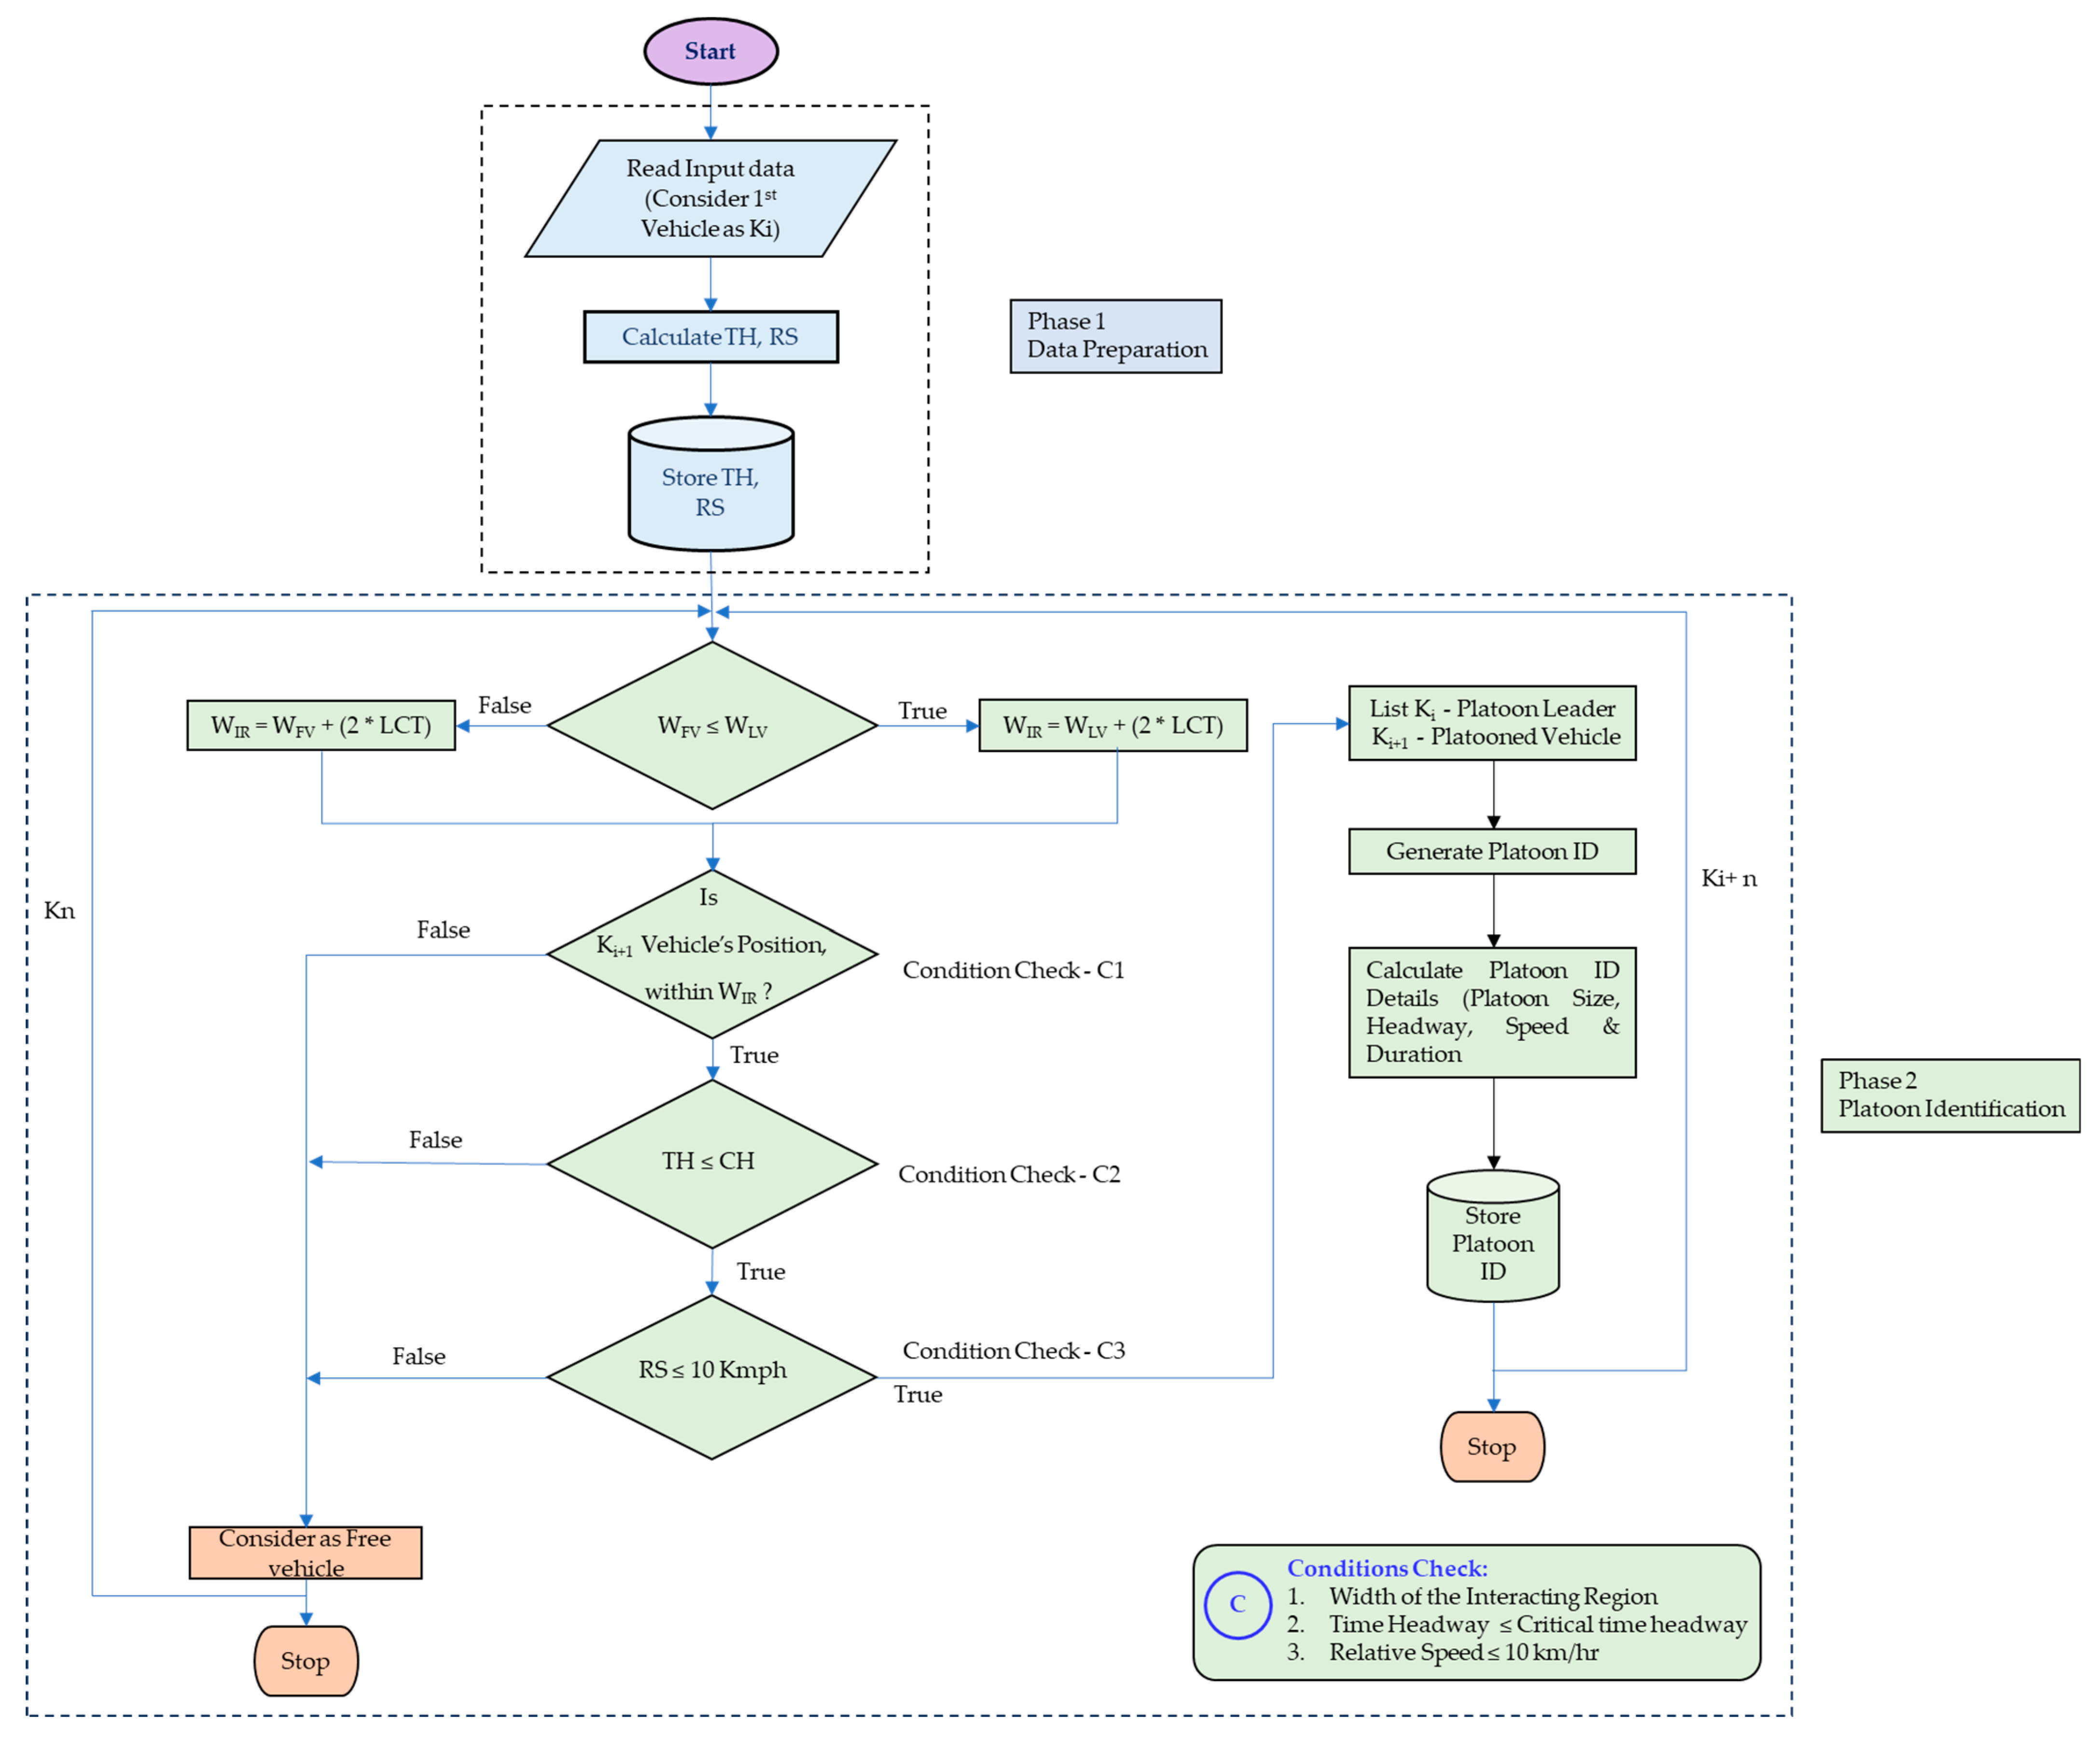
Figure 5 depicts the schematic representation of the platoon identification. The input contained vehicle details such as the time of the vehicle passing the detector point, vehicle type, vehicle speed, minimum and maximum distance from the transmitter, and vehicle width and length. The output file contents are listed in
Table 1.
The process of platoon identification involves two phases: data preparation and platoon identification.
Phase 1: Data Preparation
Read Data: The algorithm begins by reading the raw data from a given data source using an infra-red sensor TIRTL instrument.
Data Cleaning and Validation: After reading the data, the algorithm performs data cleaning and a validation processes. Data cleaning involves removing or correcting any inconsistencies, errors, or missing values in the data. Data validation is the process of verifying that the data conforms to predetermined rules, constraints, or formats. It involves checking data types, ranges, or relationships between data variables.
Calculate TH and RS: Next, the algorithm calculates the time headway (TH) and relative speed (RS) between successive vehicles.
Data Storage: After the necessary data preparation, the processed data are saved for further analysis. The storage mechanism can vary based on writing the data to a file and storing it in memory for immediate use.
Phase 2: Platoon Identification
Check Condition: The algorithm checks three specific conditions, namely, C1—the width of the interacting region, C2—the time headway, and C3—the relative speed.
Condition Check 1 (C1)—The width of the interacting region is calculated (reference
Section 3.1.1). If the K
i+1 and K
i travel within the range of W
IR, it can be processed for Condition Check 2 (C2), or else it is treated as a free vehicle.
Condition Check 2 (C2)—If the calculated time headway of Ki+1 is less than or equal to the critical headway, it can be processed for Condition Check 3 (C3), or else it is considered as a free vehicle.
Condition Check 3 (C3)—If the relative speed of K
i+1 is less than or equal to 10 kmph (reference
Section 3.1.3), it can be considered as a platoon follower, or else it is preserved as a free vehicle.
If Condition Satisfied: Vehicles that satisfy the above conditions were sorted. The list of vehicles was segregated regarding the platoon leader, which is denoted as Ki. The list was populated based on the condition checks. Each platoon leader was added to the list, thereby ensuring that it contained all the relevant leaders for the platoon. We then listed Ki+1—the following vehicles in the platoon. Ki+1 represents vehicles in the platoon. We generated the platoon ID: The algorithm generates a unique identifier, known as the platoon ID, for the platoon.
Else: We considered the vehicle as a free vehicle and processed the Kn vehicle for the analysis of the condition checks.
4. Traffic Data Description
A six-lane divided urban arterial in Chennai was chosen as the study stretch. Data collection was conducted in the mid-block section of the road, which was located around 400 m from the downstream signalized intersection. This particular section was deliberately selected, as the flow was uninterrupted. An infra-red-based portable automatic traffic counter—Transportable Infra-Red Traffic Logger (TIRTL)—was used for data collection. The instrument has a transmitter and a receiver, which were strategically positioned on the edges of the road to detect passing vehicles. The traffic data were collected at the study location for 13 h (7:30 am to 8:30 pm). During the survey, 42,500 traffic data points were observed in a selected six-lane divided road section. The recorded information includes the classified volume count, vehicle speed, time headway, space headway, gap, vehicle length, and width of the vehicle, as well as the minimum and maximum distances from the transmitter. A video graphic survey was done for one hour in the selected study section to verify the reliability of the TIRTL detectors. The classified volume count and speed were obtained from the recorded video using an in-house data extraction application, and it was compared with the traffic data from the TIRTL instrument. A total of 95% of the data matched indicating good reliability in capturing the traffic characteristics.
The categories of vehicles collected in the sections were grouped into five categories: car, motorized two-wheeler, motorized three-wheeler, light commercial vehicle (LCV), and bus.
Figure 6a illustrates the vehicle composition observed in the road section. Motorized two-wheelers accounted for approximately 55% of the total, and cars accounted for 24%, which was followed by motorized three-wheelers (13%); both LCVs and buses each contributed 4%.
Figure 6b represents the speed distribution of the vehicles, which conformed to a normal distribution.
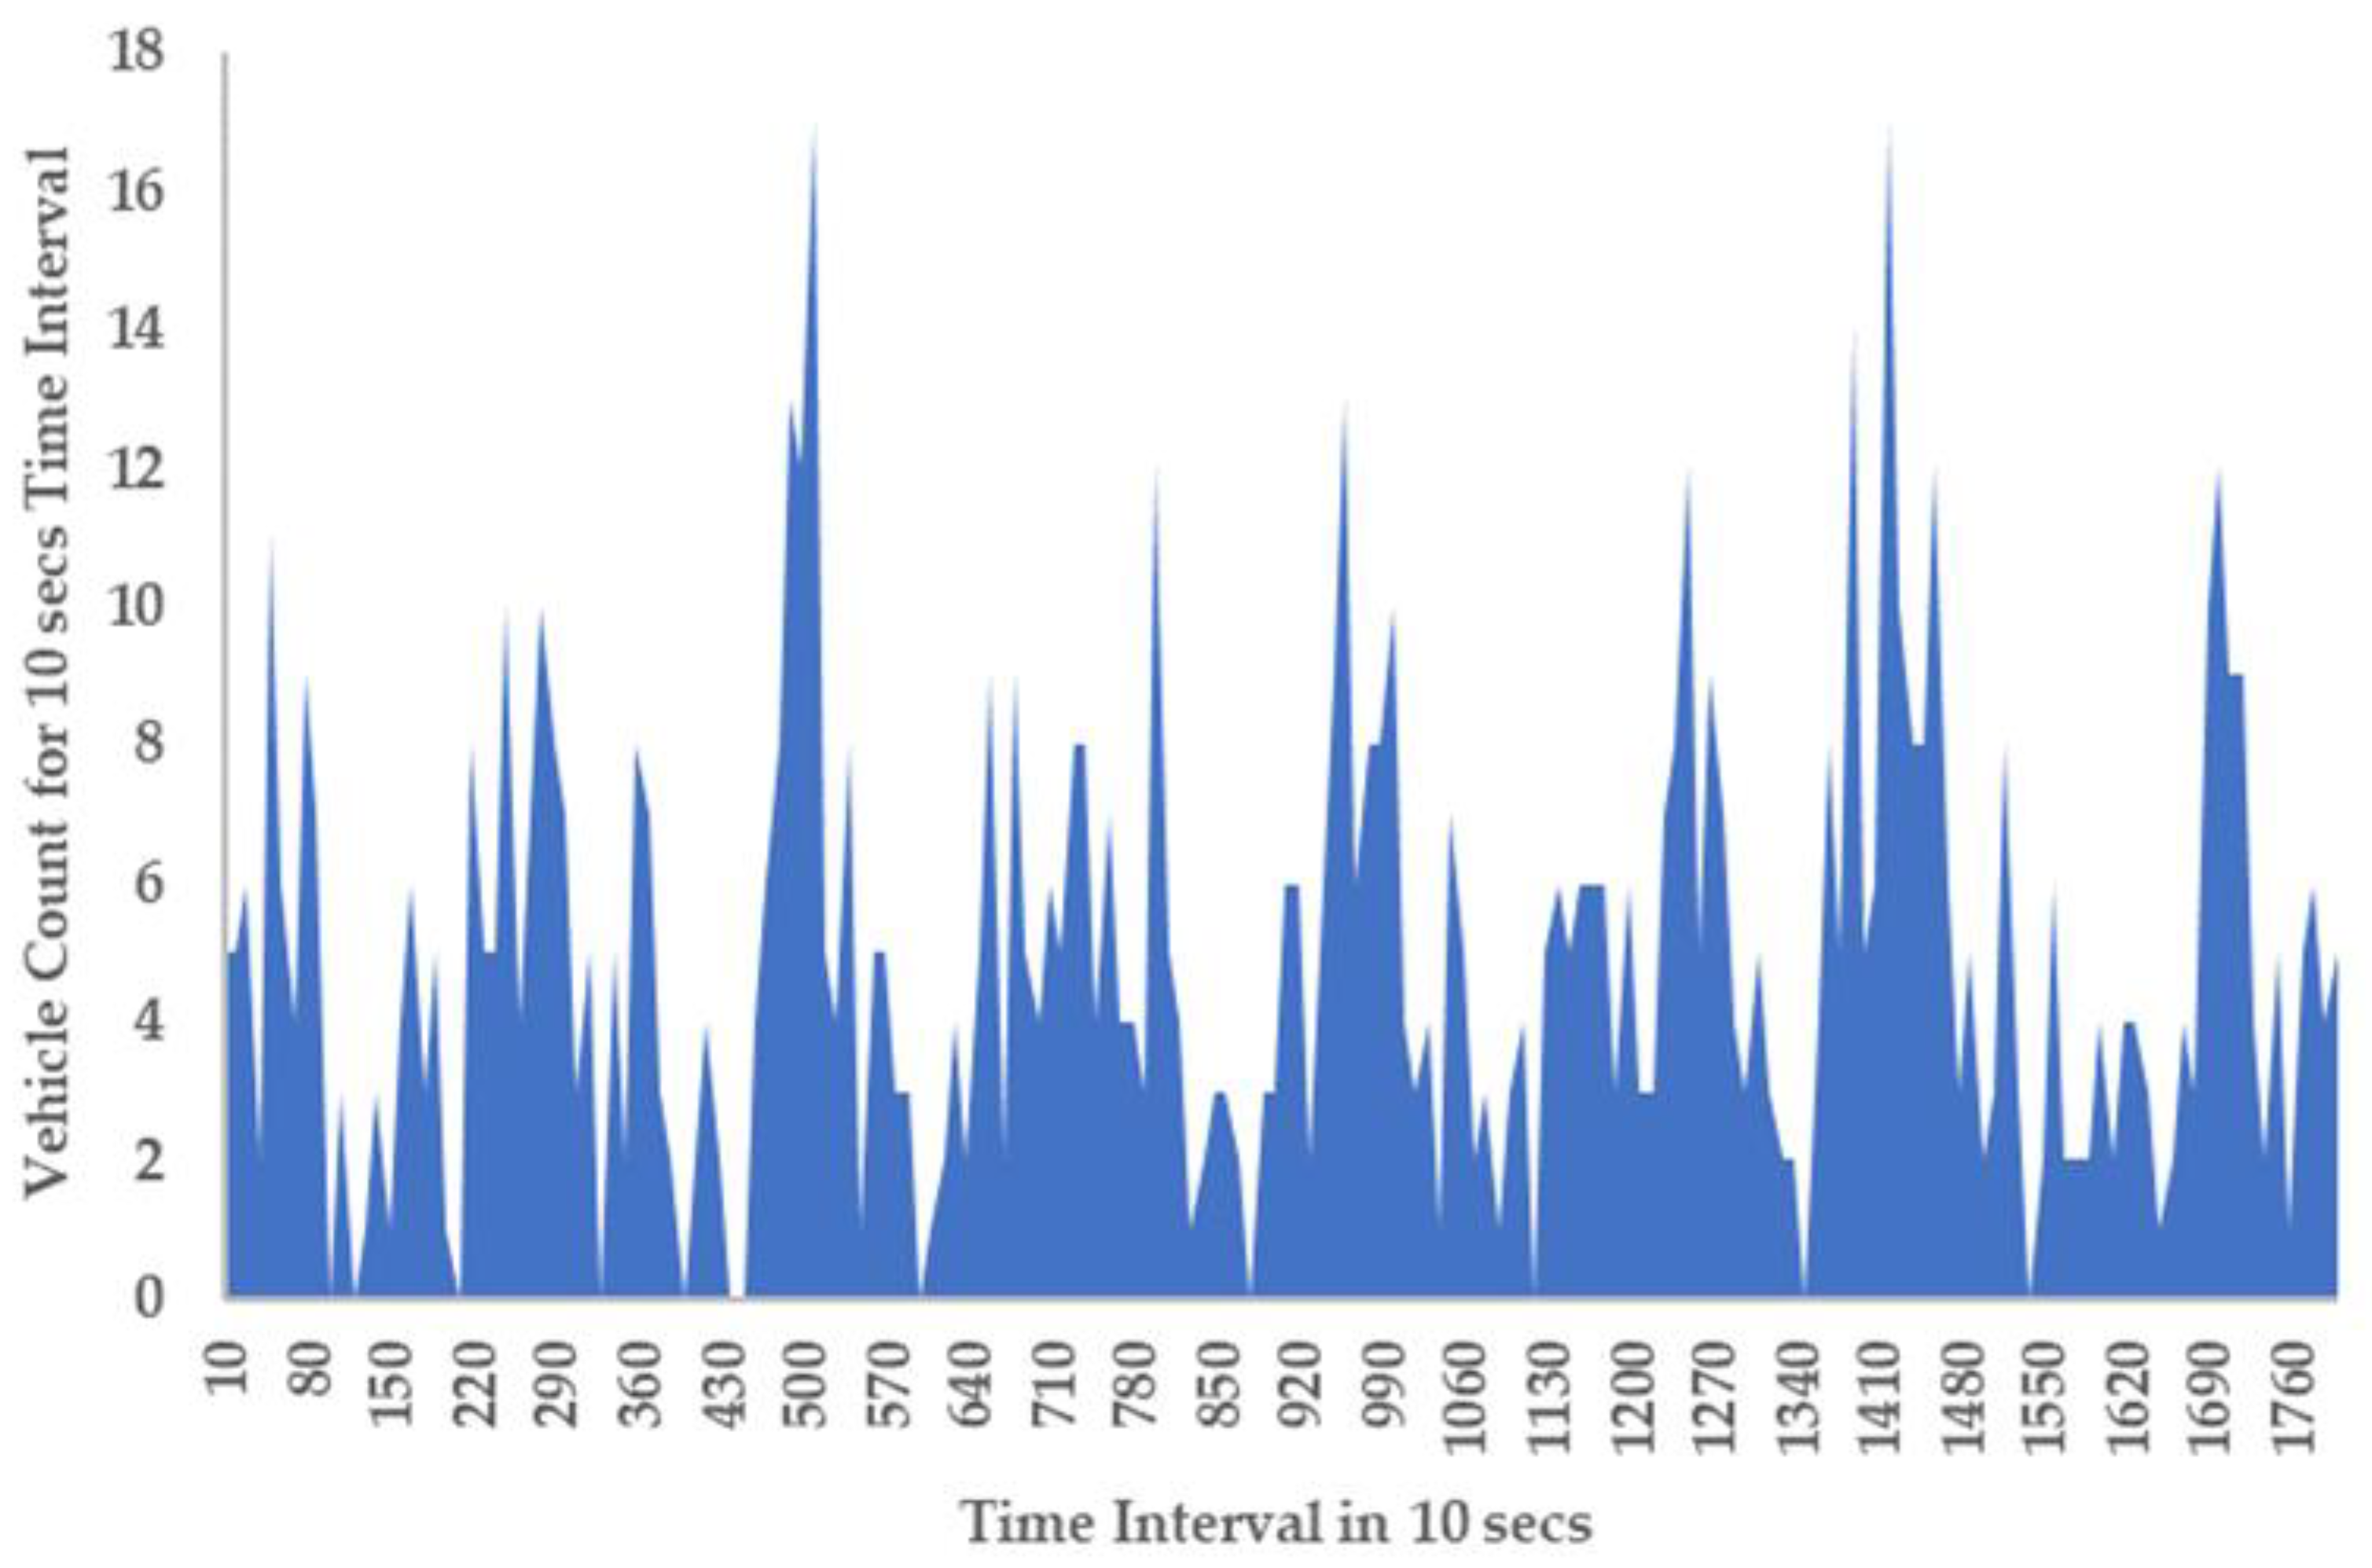
The presence of platoons on the urban road segment was observed through the graph representing the rate of arrival over a ten-second interval. The arrival rate of the vehicles is the number of vehicles that traverse through a designated observation point on a road segment within a defined time.
Figure 7 illustrates the number of vehicles crossing the observation point within each 10 s interval. The group of vehicles crossed the data collection point for a few seconds, after which no flow was observed for a brief period. This pattern of flow was observed in the chosen study stretch. It indicates the existence of platoons on urban midblock sections, which are characterized by a consistent (constant) flow during certain periods, which is then followed by time intervals with no traffic flow.
4.1. Estimation of Lateral Clearance Threshold (LCT)
The LCT is the minimum lateral clearance the subject vehicle maintains under the prevailing circumstances without passing the lead vehicle. Lateral clearance is important for passing maneuvers and identifying vehicle interactions in heterogeneous traffic flow. Two aspects, namely, the lag distance and space headway were considered. The lag distance refers to the distance of the visible road ahead of the driver, which is computed using Equation (3).
where D is the lag distance of the vehicle, V is the speed of the vehicle, and t is the reaction time of the driver. In this study, 2.5 s were considered as the reaction time [
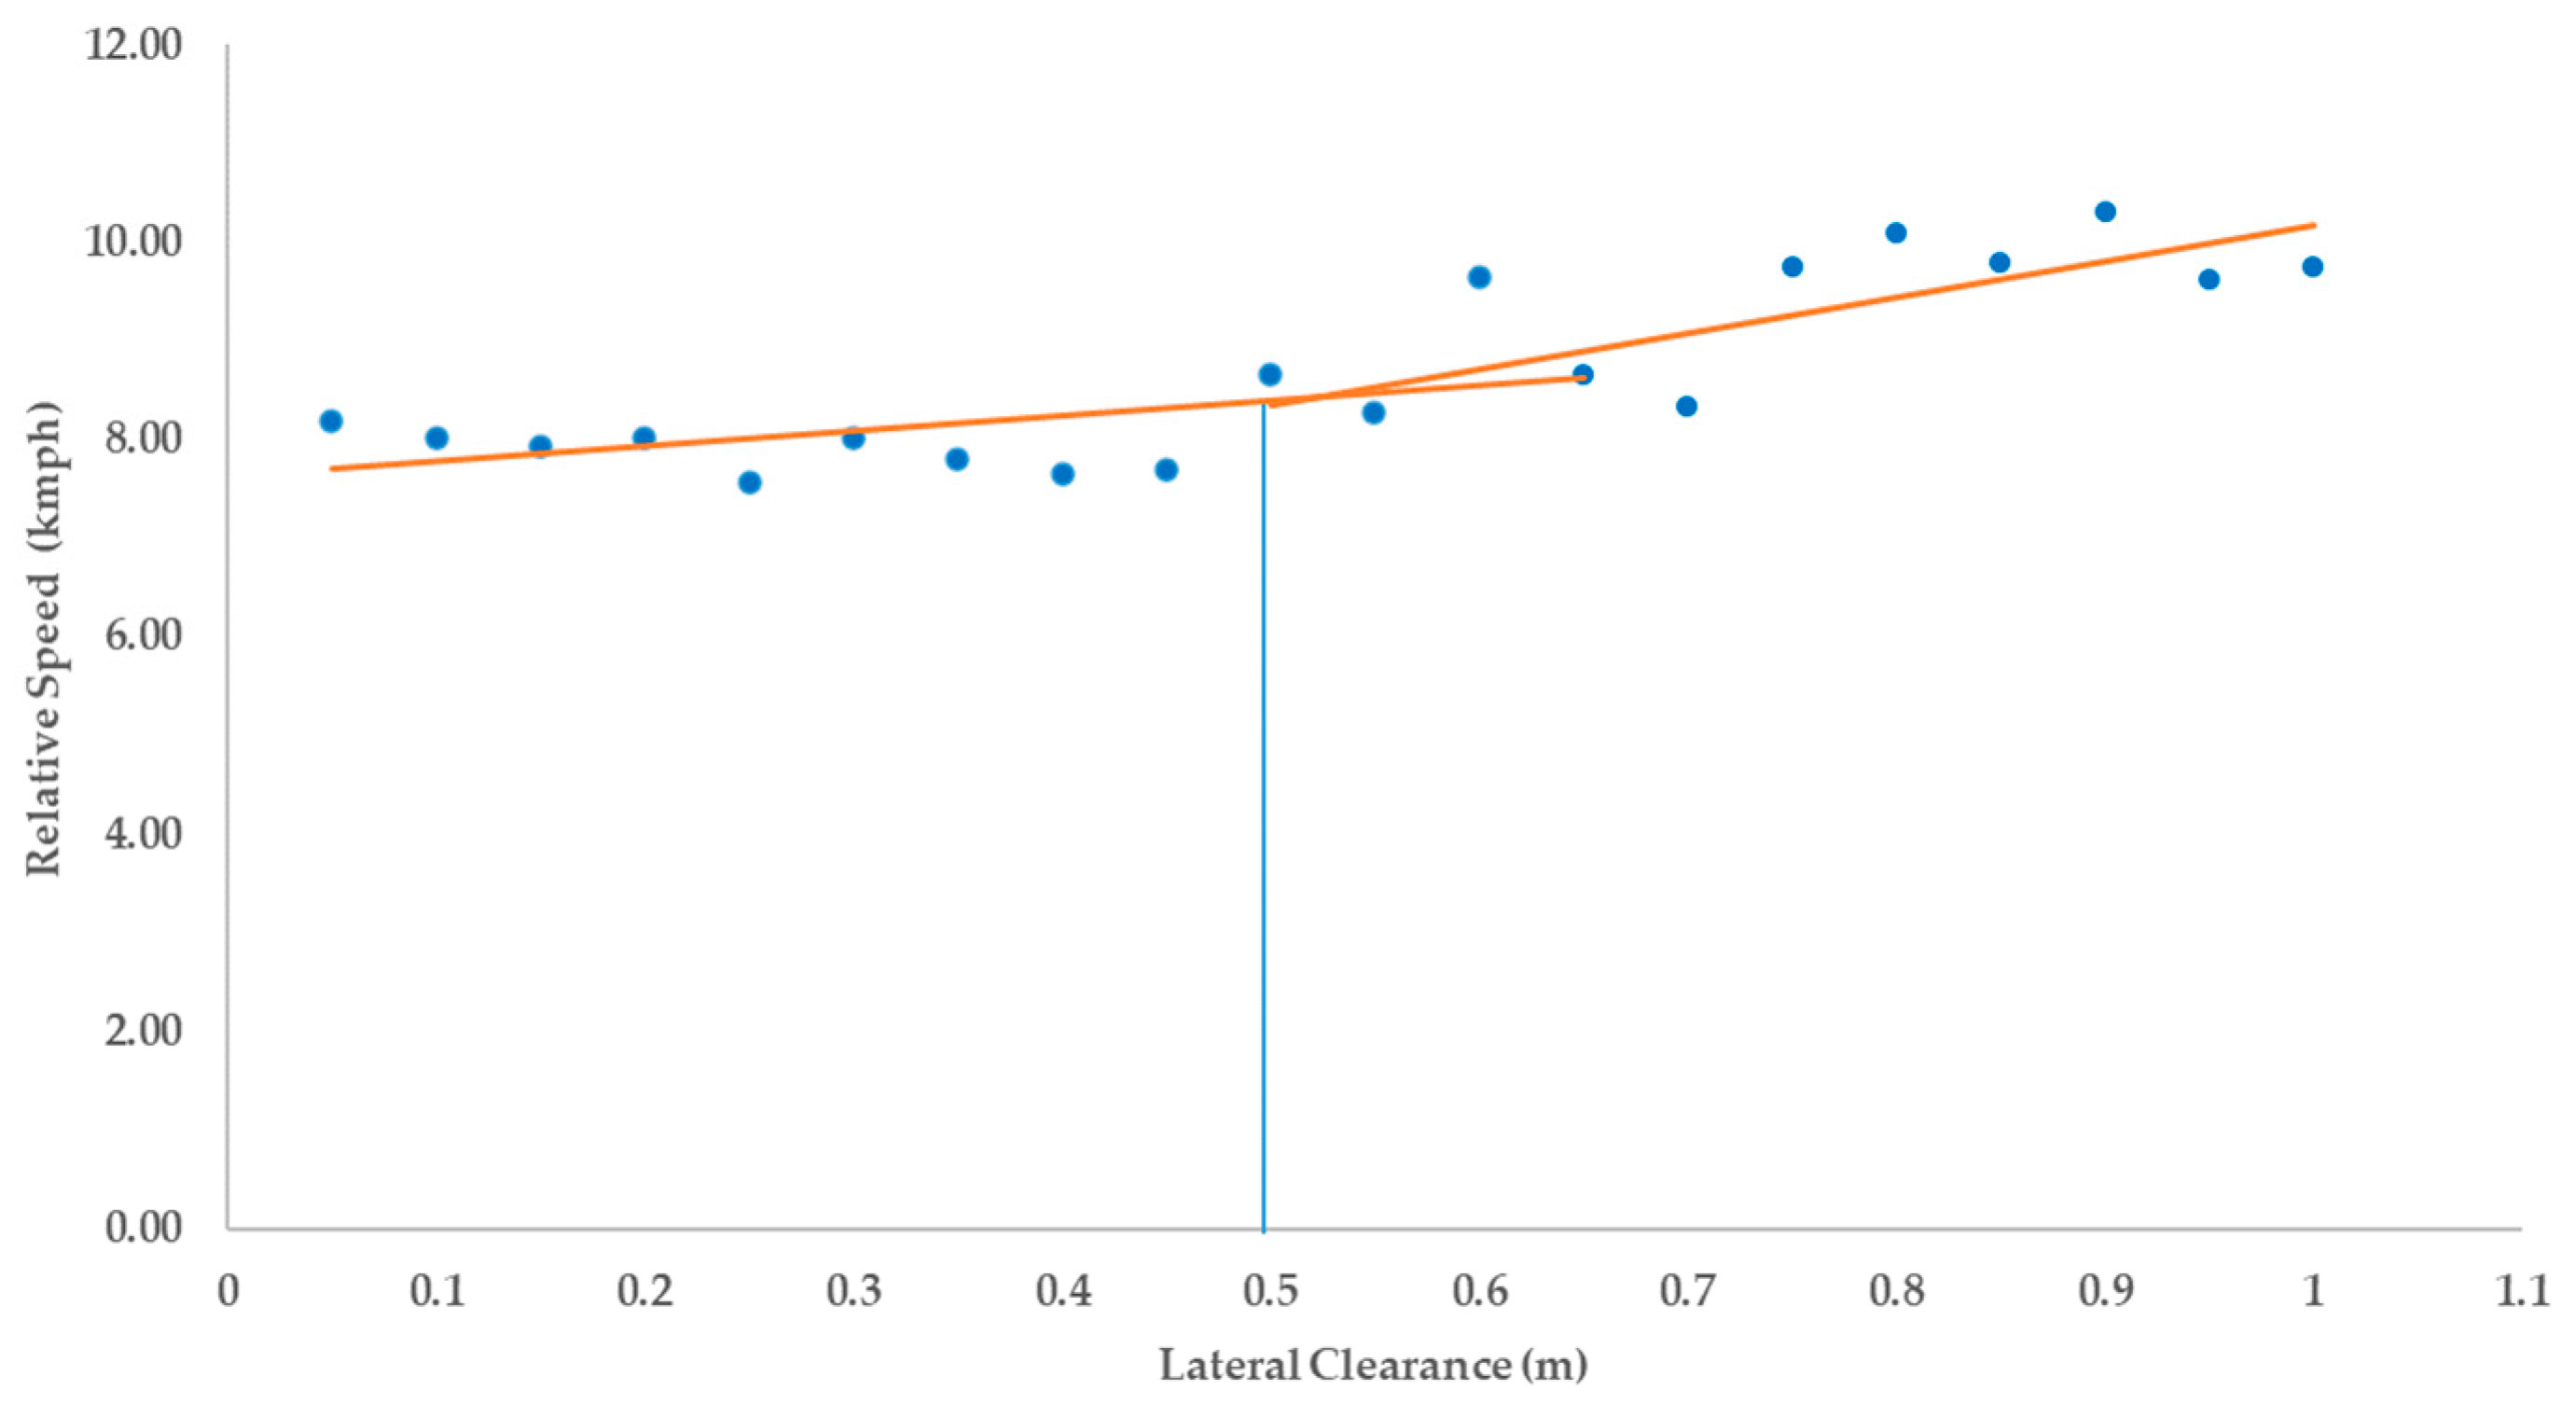
59]. If the lag distance is less than the space headway, it is deemed that the speed of the following vehicle is influenced by the speed of the leading vehicle. Vehicles that have a lag distance less than the space headway were selected to study the influence of lateral clearance. The relative speeds of the selected vehicles and their lateral clearances were plotted, and the trend was analyzed to estimate the lateral clearance threshold(
Figure 8). As the lateral clearance increased for each vehicle, there was a noticeable increase in their relative speeds, and it was also observed that the shift or a significant change in the trend was noticed at a lateral clearance of 0.5 m. The lateral clearance threshold (LCT) was considered as the point of change in the trend, i.e., 0.5 m. The estimated LCT value was utilized to compute the width of the interacting region.
4.2. Estimation of Critical Headway
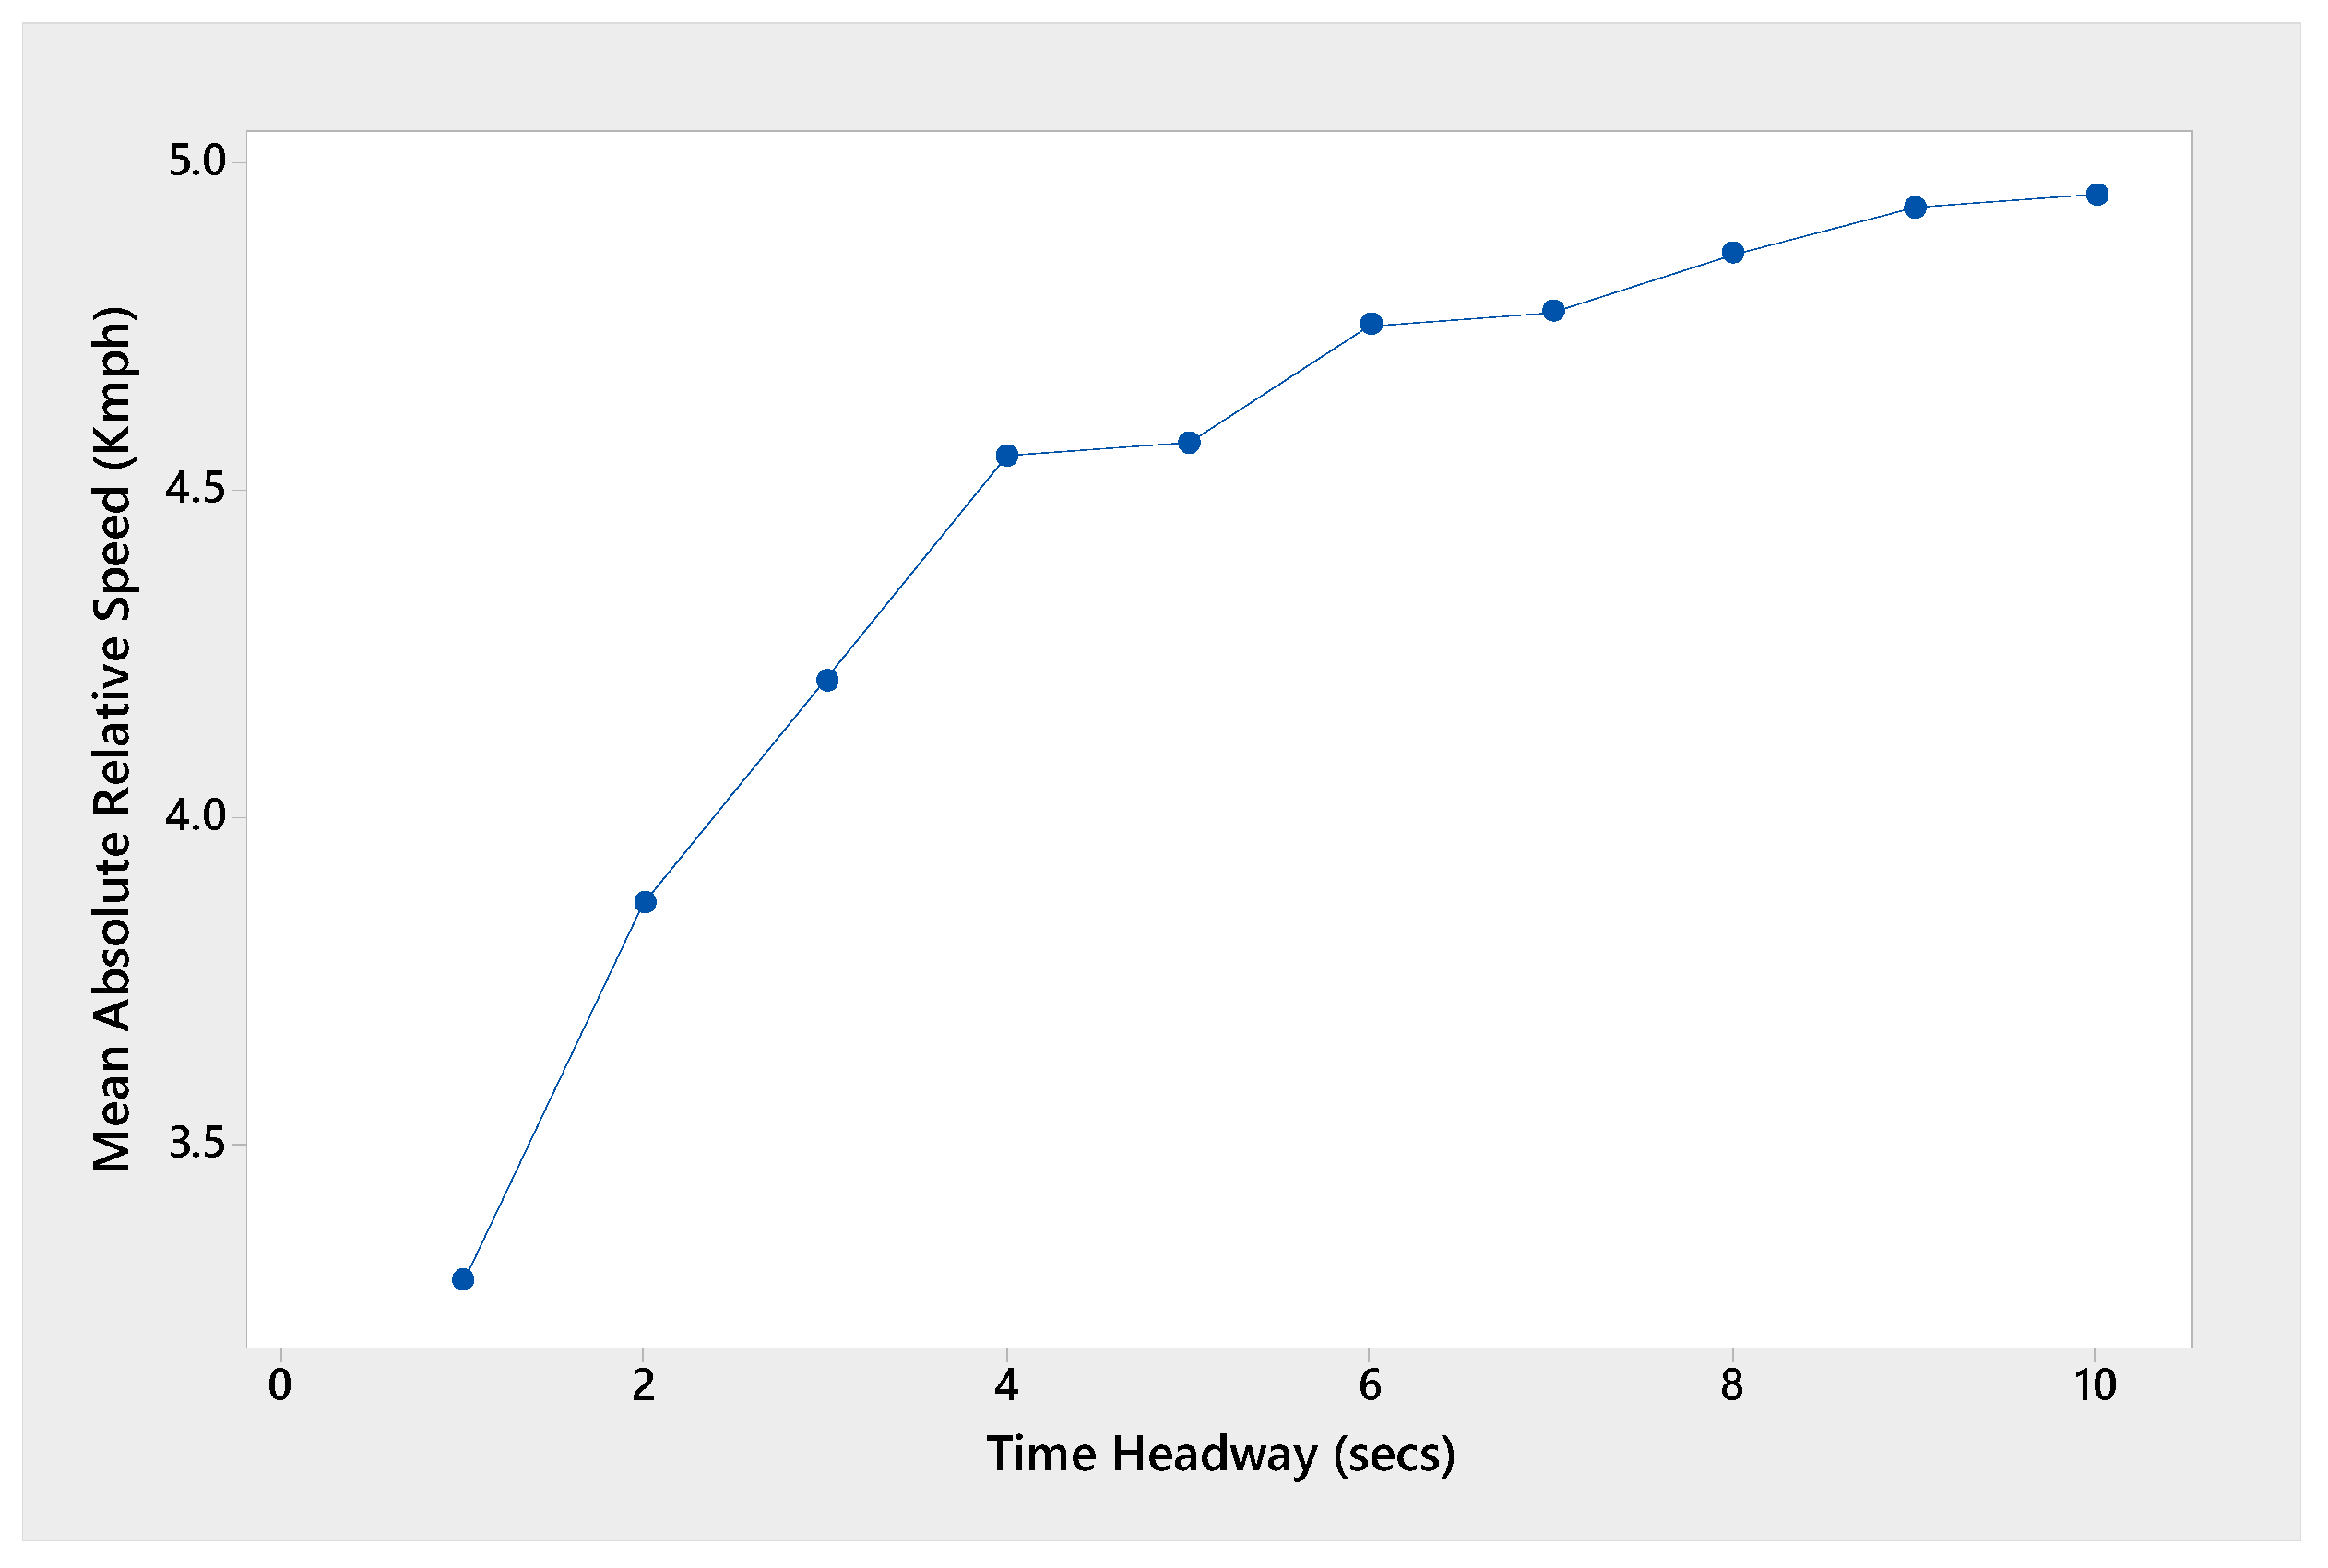
The first step of the methodology was executed on the obtained traffic data, and the interacting vehicles were identified. The mean absolute relative speed and time headway of interacting vehicles are plotted in a graph and shown in
Figure 9. It can be observed that the mean absolute relative speed of the vehicles gradually increased as the headway increased. When the time headway was low, the observed mean absolute relative speed of the vehicles was also at its minimum. As the headway gradually increased, the mean absolute relative speed also increased up to 5 s, thereby indicating that when the headway is 5 s or less, all vehicles tend to adjust their speed to match that of the lead vehicle. However, for headways greater than 5 s, the mean absolute relative speed of the following vehicles was not significantly affected. Hence, a critical headway of 5 s was determined.
6. Conclusions
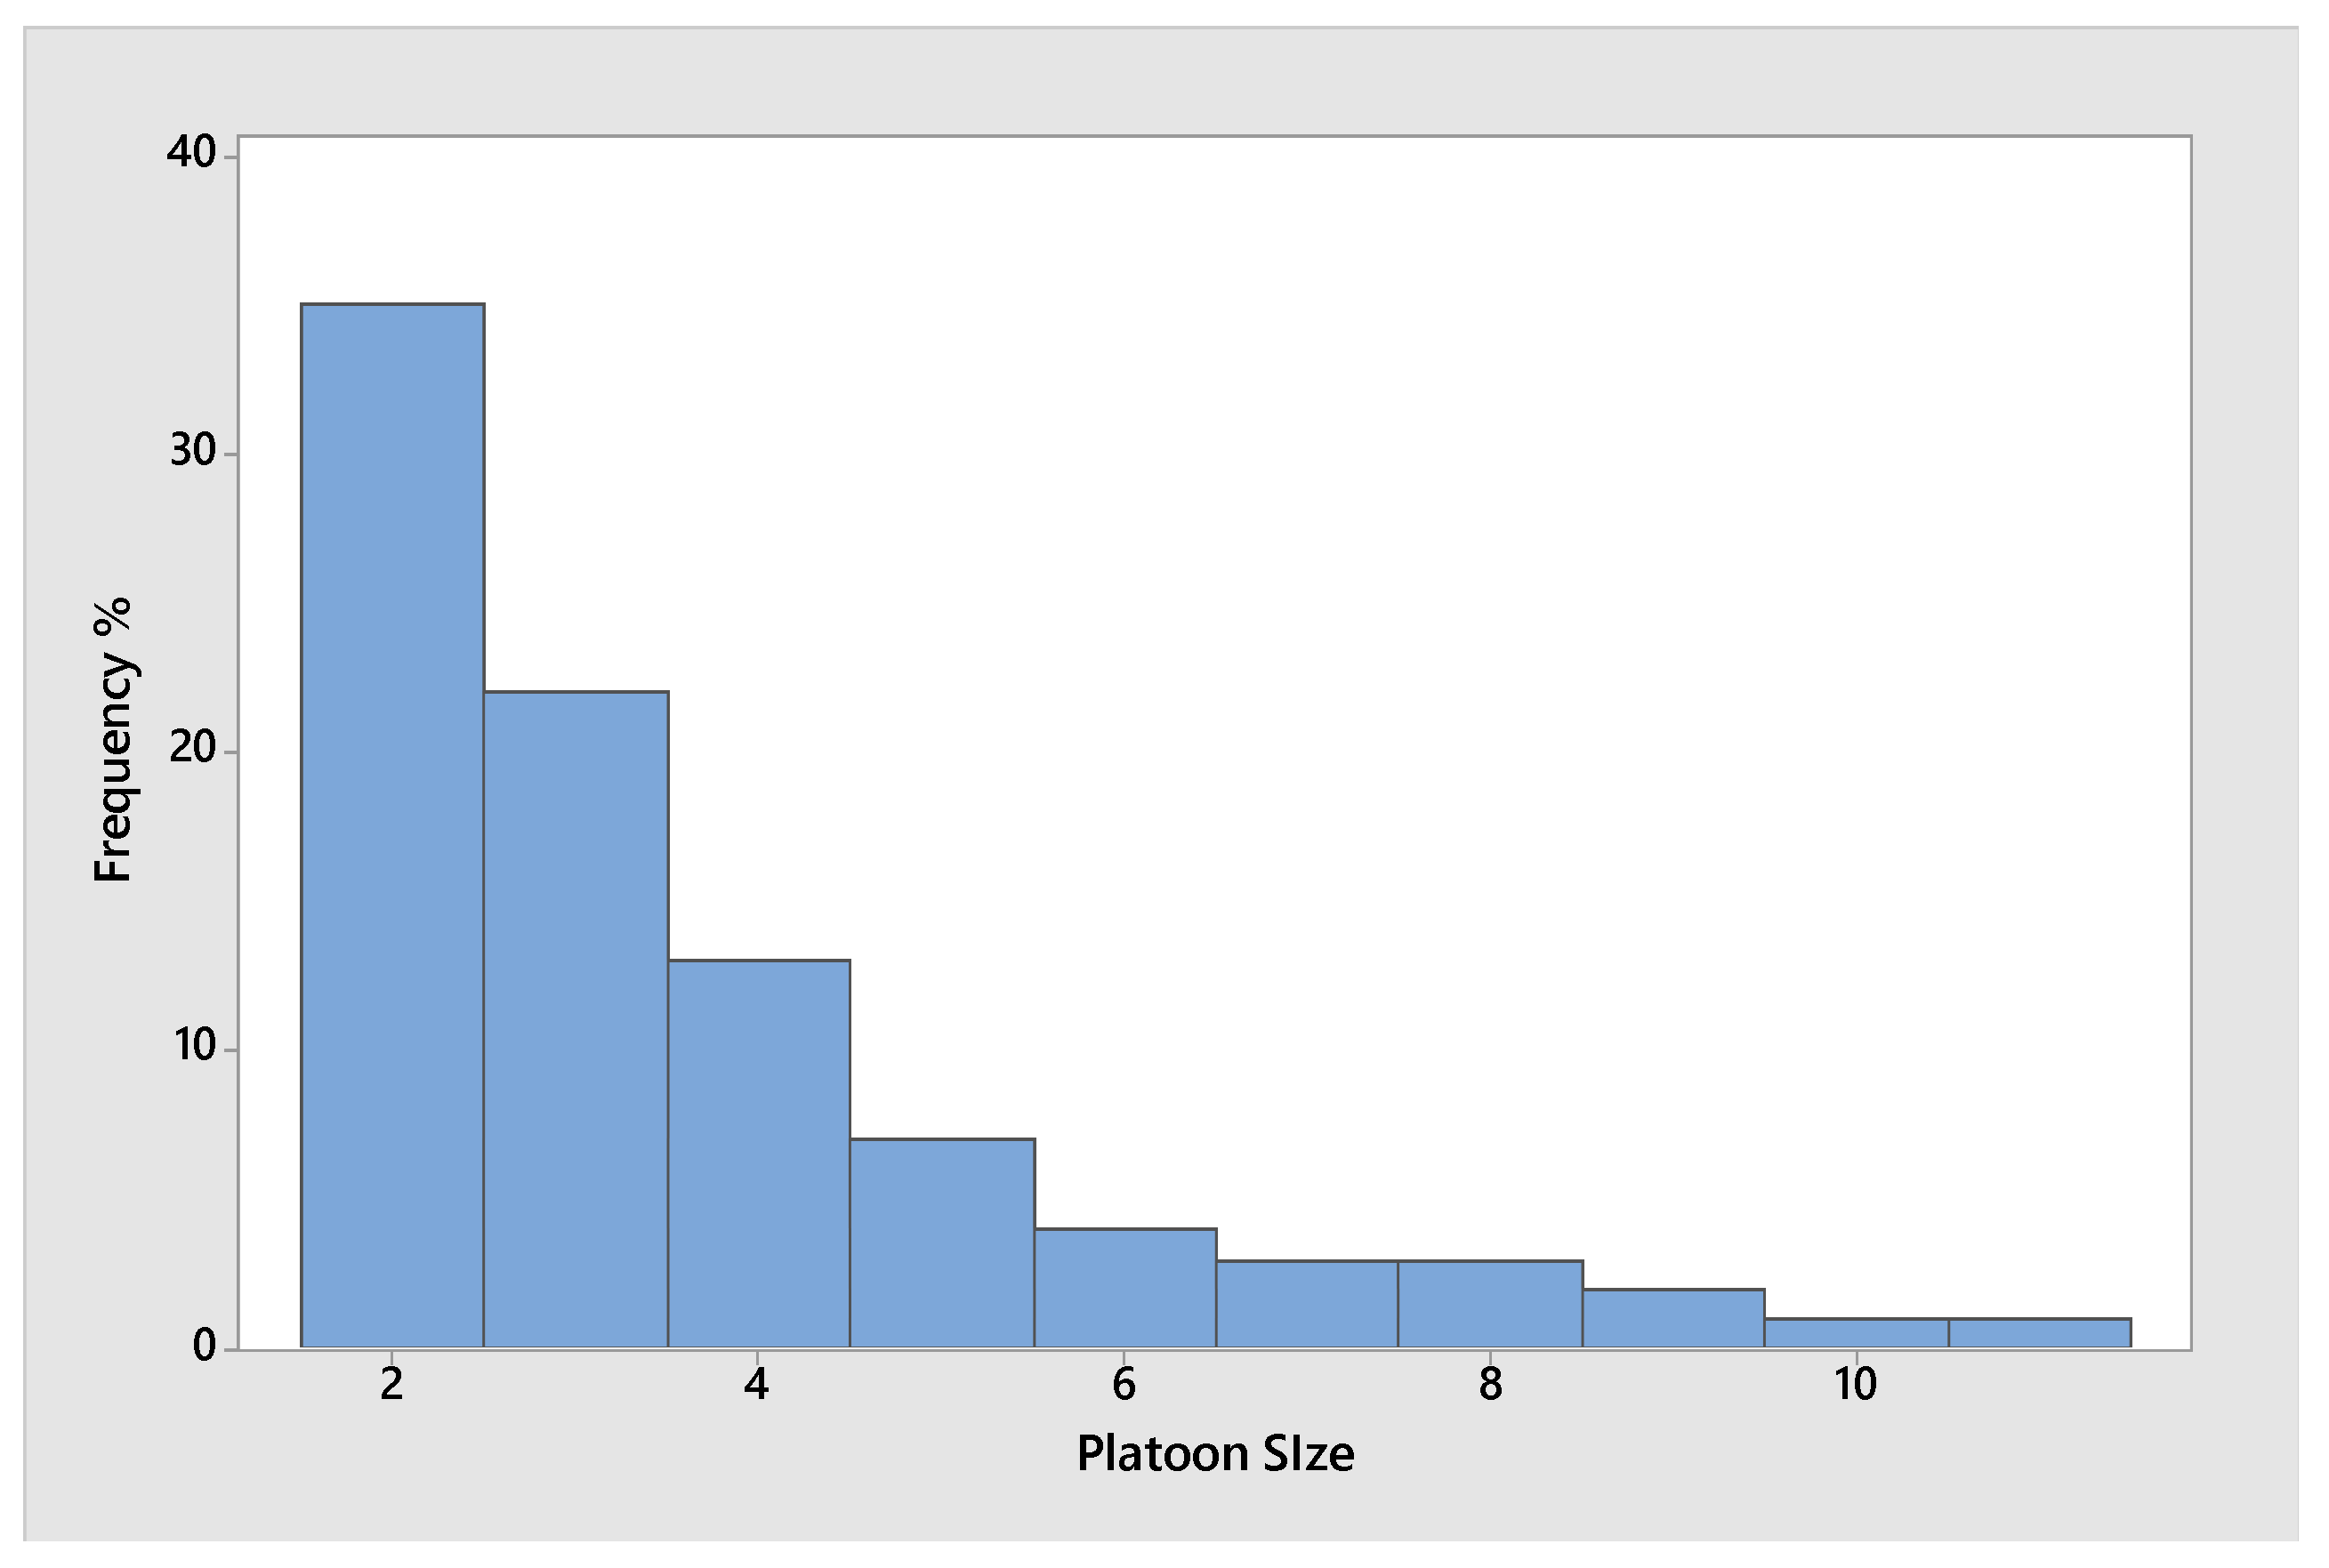
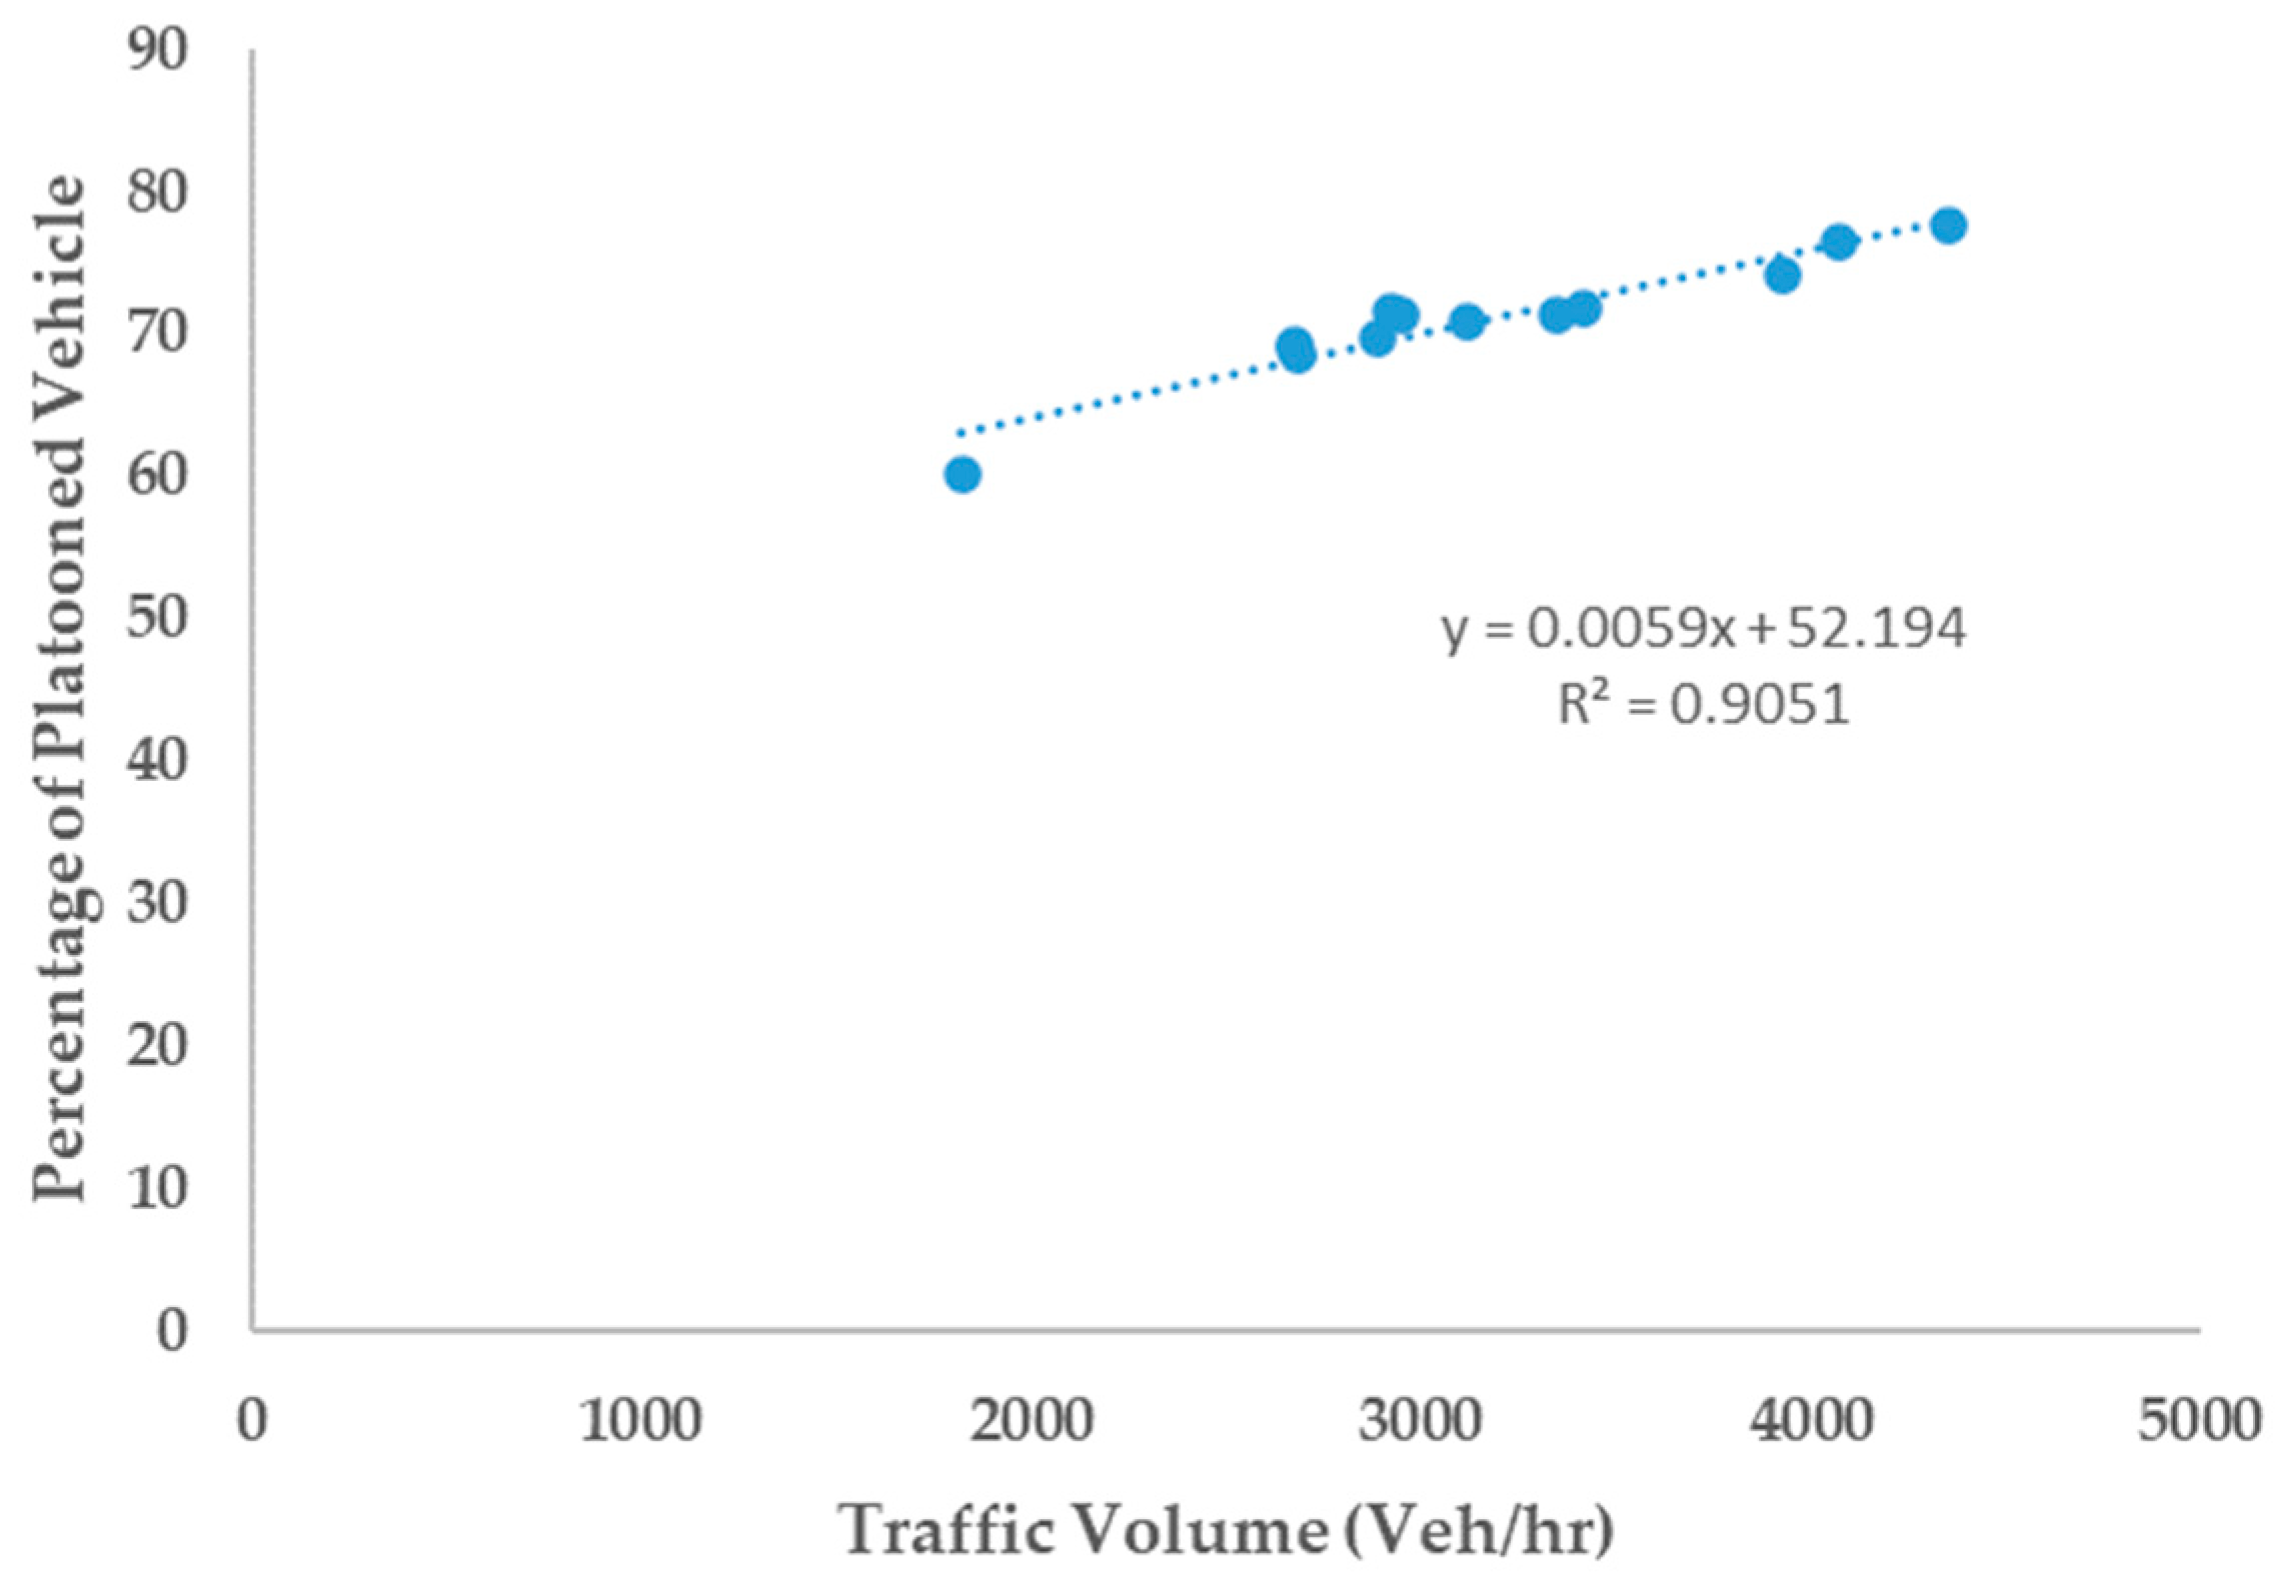
Vehicle platoon studies are essential for understanding and managing traffic on urban arterial roads. Previous research has proposed multiple approaches for identifying vehicle platoons and studied their behavior under homogeneous traffic conditions. However, these approaches are inappropriate for heterogeneous traffic conditions. Based on the site investigation and traffic data observation, it has been found that the vehicles may take their path anywhere across the width of the road on multilane urban roadways because of the non-adherence of lane discipline and heterogeneity. The ways that vehicles interact with one another is also influenced by their static and dynamic characteristics. To address this issue, a three-step strategy was proposed to recognize vehicle platoons in mixed traffic flows. In order to determine vehicle interaction, this study took into account the time headway, the width of the interacting region, and the relative speed. The critical headway of 5 s was estimated considering the relationship between the mean absolute relative speeds of interacting vehicles and their time headways. The vehicle platoons were identified by executing the Python program, and out of a total of 42,500 vehicles observed, 74% of the vehicles traversed as vehicle platoons. The following aspects of vehicles in the platoon were studied viz the platoon size, intra-platoon headway, platoon stream speed, and percentage of platoon formation. According to the findings, the platoon size predominantly consisted of two vehicles, and the 85th percentile platoon size observed was six vehicles. The findings illustrate that the platoon size was inverse to platoon stream speed and intra-platoon headway. Furthermore, it was found that the intra-platoon headway and platoon stream speed followed a normal distribution. The study also investigated the share of free vehicles for various volume ranges. The findings demonstrate that there was a decrease in the tendency of all vehicle categories to move as free vehicles as the volume of traffic increased. The study findings revealed a direct correlation between the traffic volume and the percentage of platoon formation.
There have been very limited attempts to study the platooning of heterogeneous traffic flow. The proposed framework for platoon identification is one such attempt that takes into account heterogeneous and non-lane-based traffic conditions. This study can be utilized to simulate traffic flow on urban roads and to explore the potential benefits and challenges associated with improving traffic flow, fuel efficiency, and overall transportation sustainability. This research’s findings can be beneficial in studying platoon-based aggregation, estimating road capacity, optimizing traffic flow, enhancing safety, and reducing emissions. Our forthcoming research intends to apply the concept of vehicle platoons to estimate the capacity of urban roads.
