Article

Teaching Statistics for Sustainability across Contexts: Exploring the Knowledge and Beliefs of Teachers

1
Faculty of Education and Psychology, Departament of Subject-Specific Didactics, University of Girona, 17004 Girona, Spain
2
Claudia Vásquez, Campus Villarrica, Pontificia Universidad Católica de Chile, Villarrica 4930000, Chile
*
Author to whom correspondence should be addressed.
Sustainability 2024, 16(2), 692; https://doi.org/10.3390/su16020692
Submission received: 11 November 2023 / Revised: 12 December 2023 / Accepted: 10 January 2024 / Published: 12 January 2024
(This article belongs to the Section Sustainable Education and Approaches)

Abstract

:
We explore the effect of the design of intentional teaching sequences from the concrete to the abstract in order to promote the teaching of statistics in connection with sustainability. To this end, the pre-validated questionnaires “MTSK-Stochastic Statistics” and “ESD in Statistics Activities” are administered to in-service primary education teachers. Both tools contain the same statistics teaching itinerary, based on the mathematics teaching itineraries approach, that includes five tasks: a real situation, a manipulative, a game, a technological resource, and a graphic resource. Each task includes an overview, objectives, content, required materials, development, and development questions; in addition, the second questionnaire includes connections to sustainability. The results show that tasks with real contexts, manipulative resources, and technological resources are the ones with the lowest scores. These initial findings lead us to conclude that teachers mobilize their knowledge to teach statistics as it relates to sustainability in different ways, depending on the type of task.

1. Introduction

In recent decades, there has been several advances in the fields of science and technology, resulting in global changes in different areas of knowledge [1]. Considering the accelerated pace at which our society is evolving, schools should adapt and restructure their educational system to offer high-quality training that reflects these changes [2,3]. In addition, it should be configured as a means to provoke an “awakening” in students who are capable of transforming crisis scenarios into opportunity scenarios [4].
In this regard, there are more and more primary education curricula that emphasize the need for mathematics teaching focused on the development of critical thinking. The goal is to train citizens who are capable of “extracting meaningful information from data, including how to read charts appropriately, draw correct conclusions from data, and recognize when data are being used in misleading or inappropriate ways” [5] (p. 5).
From this point of view, statistical education is crucial [6,7], especially if we consider that it provides tools to understand and respond to problems both in real life and in other disciplines [8], allowing us to make connections with multiple contexts and diverse issues [9]. From this perspective, the context from which the data are sourced becomes especially relevant since, appropriately, in statistical education “data are not just numbers, but numbers in context” [10] (p. 801). Thus, data analysis would be impossible without thinking about the context in which they are obtained [11,12,13], since “what matters is not the data, but the answers and knowledge we look for in the data” [14] (p. 4).
Data from the international survey on future research topics in mathematics education [15], conducted with 229 researchers in mathematics education from 44 countries, on the one hand, revealed that statistics is a topic that needs more attention, as there is little teacher training to teach it; on the other hand, the same report stated [15] that “though methodologically and theoretically challenging, it is of great importance to study learning and teaching mathematics across contexts” (p. 16).
Therefore, in this study, we assumed that it is necessary to reorient the teaching of statistics towards a diversified education that offers opportunities for students to develop, from an early age, statistical literacy.
From this perspective, then, it is imperative that teachers offer students, from an early age, learning opportunities across different contexts that promote the development of statistical literacy [16,17,18,19,20,21,22], especially if we consider that, according to [23], statistics education and, therefore, statistics literacy, are presented as an adequate scenario to address one of the greatest challenges in today’s world: the promotion of education for sustainable development (ESD). In this regard, we assume that the teaching of statistics has enormous potential to incorporate discussions on problems from students’ daily lives and, thus, develop the skills and knowledge necessary to deal with the environmental, social, and economic crises that we face as humanity, which is why we aim to advance the teaching of statistics for sustainability through teaching itineraries that consider a variety of contexts, from the concrete to the abstract.
This entails a challenge for the staff in charge of teaching statistics at this educational stage; their role as an agent of social change is fundamental given the training they provide in the classroom with regard to “world views, knowledge, attitudes and competencies of students towards sustainability” [24] (p. 113). This is in addition to the fact that teachers “not only hold the key to promoting understanding and skills in sustainable development, but also to supporting social justice, equity and environmental responsibility in our communities” [25] (p. 2). Therefore, the success of implementing ESD will be subject to “their opinions, understanding of sustainability and how they incorporate this concept into their pedagogy” [24] (p. 113). In this way, we consider that it is also necessary to pay attention to how teachers envision the integration of statistics education and sustainability [23].
In light of the above, the focus of this study was to investigate the effect of the design and subsequent implementation of itineraries in which statistics is taught in connection with sustainability on the specialized knowledge of teachers and their beliefs around the teaching of statistics for sustainability. Thus, the research question guiding this study is the following: how does the context for teaching statistics in connection with sustainability affect teachers’ specialist knowledge and beliefs? To this end, this study was based on the mathematics teacher’s specialized knowledge (MTSK) model [26] and the mathematics teaching itineraries approach (MTIA) [27] as a pedagogical strategy to effectively teach, in this case, statistics content in connection with sustainability in higher primary education levels (ages 10–12). From this perspective, the following research questions about statistics teaching practices and their beliefs about these practices were proposed: (1) How does the teaching context and the resources involved (real context, manipulative, game, technological resource, and graphic resource) influence the specialized knowledge of the teaching staff?; and (2) what are teachers’ beliefs of the teaching staff in relation to the teaching of statistics in connection with sustainability based on the proposed teaching itinerary?

2. Theoretical Foundation

2.1. The Mathematics Teacher’s Specialized Knowledge Model

The mathematics teacher’s specialized knowledge (MTSK) model, by [26], is a theoretical model of the specialized knowledge of mathematics teachers that considers the advances of its predecessors [28,29,30] and seeks to overcome their limitations [31,32,33,34]. In this regard, specialization affects every subdomain [31]. The MTSK model focuses on the teaching of mathematics to understand the specialized knowledge of teachers and, in turn, serves as a methodological tool to analyze various practices across the different domains of knowledge [35]. In other words, it is crucial for teachers to have specialized knowledge in order to teach mathematics effectively, since it allows them to adapt their teaching to the needs and skills of the students and encourage more meaningful learning.
The MTSK model proposes two domains of knowledge, which are, in turn, subdivided into three subdomains: on the one hand is mathematical knowledge (MK), which consists of knowledge of topics (KoT), knowledge of the structure of mathematics (KSM), and knowledge of the practice of mathematics (KPM); and on the other hand is pedagogical content knowledge (PCK), which encompasses knowledge of mathematics teaching (KMT), knowledge of features of learning mathematics (KFLM), and knowledge of mathematics learning standards (KMLS).
At the core of this MTSK model are beliefs about mathematics and about the teaching and learning of mathematics. This is because if teachers are to offer their students quality mathematical learning opportunities, an adequate mathematical and pedagogical knowledge of mathematics is not enough. It is also necessary to pay attention to the affective component (beliefs) that permeates such types of knowledge, directly influencing teacher decision making involving the teaching and learning of mathematics [36]. This has led to the affective component being an increasingly prolific and constantly evolving area of research in mathematics education.

2.2. The MTIA: An Approach for Addressing the Teaching of Statistics in Connection with Sustainability in Primary Education

This approach aims to provide a tool whose main purpose is to provide pedagogical guidance to teachers in order to promote students’ mathematical competence based on the fact that to develop this competence, it is necessary to diversify teaching-learning contexts, which is closely linked to [15] about the need to investigate the learning and teaching of mathematics across contexts.
The MTIA, as described extensively in [27], is theoretically and methodologically based on the sociocultural perspective of human learning [37]; the realistic–reflective training model [38], adapted to the training of mathematics teachers; and the realistic mathematical education (RME) of [39]. Thus, synthetically, it assumes that: (a) human learning is a social activity; (b) it takes place across a diverse range of contexts and resources that teachers should be aware of and reflect on the effectiveness of their implementation in their own teaching practices; and (c) these contexts and resources should be based on the principle of abstraction, so that teaching starts at the situational level and moves progressively towards the formal level. Within this framework, the MTIA proposes that the development of mathematical thinking should be carried out through teaching itineraries, defined as an intentional teaching sequence that spans three levels: (1) informal contexts, which allow for visualizing mathematical ideas concretely (e.g., real contexts, manipulatives, and games); (2) intermediate contexts, which, through exploration and reflection, lead to the progressive schematization and modeling of mathematical knowledge (e.g., literary and technological resources); and (3) formal contexts, in which the representation and formalization of mathematical knowledge is developed through conventional procedures and notations, thus rounding out the complete learning from the concrete to the abstract (e.g., graphic resources).
In addition, the MTIA provides some recommendations on mathematics teaching practices, considering the approaches described above: the teaching of content should be carried out through the processes of problem solving, reasoning and proof, communication, connections, and representation; in the design of teaching itineraries, it is not necessary to consider all the resources described in the pyramid of mathematics education, but it is highly advisable to consider the principle of progressive abstraction. This principle is always applicable, so it would be a pedagogical mistake to consider that students at the end of primary school, for example, can learn new content with understanding by starting teaching at the formal level, but that they first need to visualize mathematical ideas concretely from real situations, manipulatives, etc. Access to different contexts and resources may vary according to age, so that teachers in the early levels should design their teaching practices mainly from informal level resources, while in the later levels of primary school, more formal resources should be given greater prominence; in all cases, it should be considered that mathematics education should be inclusive, i.e., accessible to all.
From the perspective of the MTIA, then, context is a key element for promoting mathematical competence and, in particular, for teaching statistics. Therefore, it is assumed that, in statistical teaching practices, tasks should be implemented across all contexts, considering the opportunities offered by each to promote statistical literacy while supporting children’s natural way of learning, from the concrete to the abstract. In this way, students can adeptly process statistical information, and so the study of sample data can contribute to inferring results from future experimental and population data.
Indeed, today, more than ever, it is necessary to offer students learning experiences that allow them to integrate and connect knowledge; in our case, statistics with real contexts and problems that affect them. But what contexts should be used? What contexts are the most relevant? The answers can be very different. However, a context on which it is vitally important to be able to reflect is that of sustainable development [40], given that for some years now, the world (our common home) has been in the midst of a real crisis, and our efforts to overcome it, until now, have not been entirely successful. Therefore, mathematics education in general, and statistics education in particular, have much to contribute when associated, for example, to issues related to the Sustainable Development Goals (SDGs) [41]. Consequently, urgent measures are required that allow citizens to be literate in sustainability, which implies the development of “skills, attitudes, competencies, dispositions and values necessary to survive and thrive in the declining conditions of the world in order to mitigate said decline as much as possible” [42] (p. 2).
Carrying this out requires having a holistic, inclusive, and transformative education that makes it possible for current and future generations to achieve specific cognitive, socioemotional, and behavioral learning and, in particular, develop sustainability competencies [41]. The role of the teacher is thus key, since they must facilitate the development of sustainability competencies in their students, such as: (a) recognizing and understanding the relationships needed to analyze complex systems, as well as dealing with uncertainty (systems thinking competency); (b) understanding and evaluating multiple future scenarios, so that based on the data and the problems presented, they can evaluate the consequences of their actions (anticipatory competency); (c) understanding and reflecting on the norms and values that underlie our actions (regulatory competency); (d) collectively developing and implementing innovative actions that foster sustainability (strategic competency); (e) understanding and respecting the needs, perspectives, and actions of others, so as to facilitate collaborative and participatory problem solving (collaborative competency); (f) questioning norms, practices, and opinions in order to reflect on one’s own values, perceptions, and actions and to take a stance in the sustainability discourse (critical thinking competency); (g) reflecting on the role each person has in the local community and in society (self-awareness competency); and (h) applying problem-solving strategies to address complex sustainability problems and devise equitable solution options that foster sustainable development (integrated problem-solving competency).
These competencies “represent what sustainability citizens particularly need to deal with today’s complex challenges. They are relevant to all SDGs and also enable individuals to relate the different SDGs to each other” [41] (p. 11).
In this regard, in recent years, there has been a specific line of research that connects statistics education with education on sustainable development, showing that statistics education provides tools to understand and respond to real-life problems [23]. In this sense, there is a need to encourage a teaching of statistics that promotes education for sustainable development. Under this perspective, ESD is structured with the purpose of teaching statistics, and, in turn, statistics provides a pretext to train in sustainability [23]. However, there is still much to investigate regarding the integration of statistics and sustainability, especially concerning the design of classroom experiences that facilitate the development of sustainability skills in order to properly characterize them.
Faced with this challenge, given its context-focused nature, the MTIA can provide an optimal setting for students to activate their statistics knowledge while also developing sustainability competencies. However, for this to happen, it is clear that teachers need to have the necessary knowledge in both statistics and sustainability education in order to establish connections that allow them to nurture ESD statistics education and vice versa.

3. Materials and Methods

This research relied on a mixed approach methodology of an exploratory–descriptive nature that combines both quantitative and qualitative analyses [43]: on the one hand, the aim was to analyze how the context and teaching resources influence teachers’ specialized knowledge; on the other hand, another objective was to investigate teachers’ beliefs regarding the teaching of statistics in connection with sustainability based on the proposed teaching itinerary.

3.1. Context and Participants

The sample used was non-probabilistic and comprised 25 in-service primary education teachers. To recruit these participants, an open invitation was sent out to primary school teachers who teach 5th and 6th grade (10–12 years) in different schools in Catalonia and the Balearic Islands (Spain). The participants were then contacted, and they voluntarily agreed to participate and sign the informed consent associated with this research.

3.2. Data Collection Techniques and Instruments

The data were collected in 2023 by administering two pre-validated instruments. The first corresponded to the MTSK-Stochastic Statistics Questionnaire [44], based on the mathematics teacher’s specialized knowledge model (MTSK) and the mathematics teaching itineraries approach (MTIA). Through this instrument, we sought to analyze how a statistics education itinerary influences the specialized knowledge of teachers (Appendix A). Thus, based on the 5 items of this questionnaire, corresponding to the different contexts of the MTIA that analyze different subdomains of the MTSK (Table 1), we investigated how a statistical teaching itinerary influences the specialized knowledge of teachers.
Secondly, the “ESD in Statistics Activities” questionnaire was administered. This instrument has an itinerary to work on statistical content in connection with sustainability in the 5th and 6th grades using the MTIA approach (Appendix B). Thus, the participants were first asked to read and review the itinerary to be familiar with the proposed tasks across a variety of contexts and resources; the participants were then asked to reflect systematically, along the lines suggested by several authors (e.g., [38,45]), on the implementation of the itinerary in their statistics teaching practices. Finally, they answered the following questions:
(a)
Do you think that this itinerary, which includes activities based on a real context, manipulative material, a game, a technological resource, and a graphic resource, can be used to promote education for sustainable development in connection with statistics? Why?
(b)
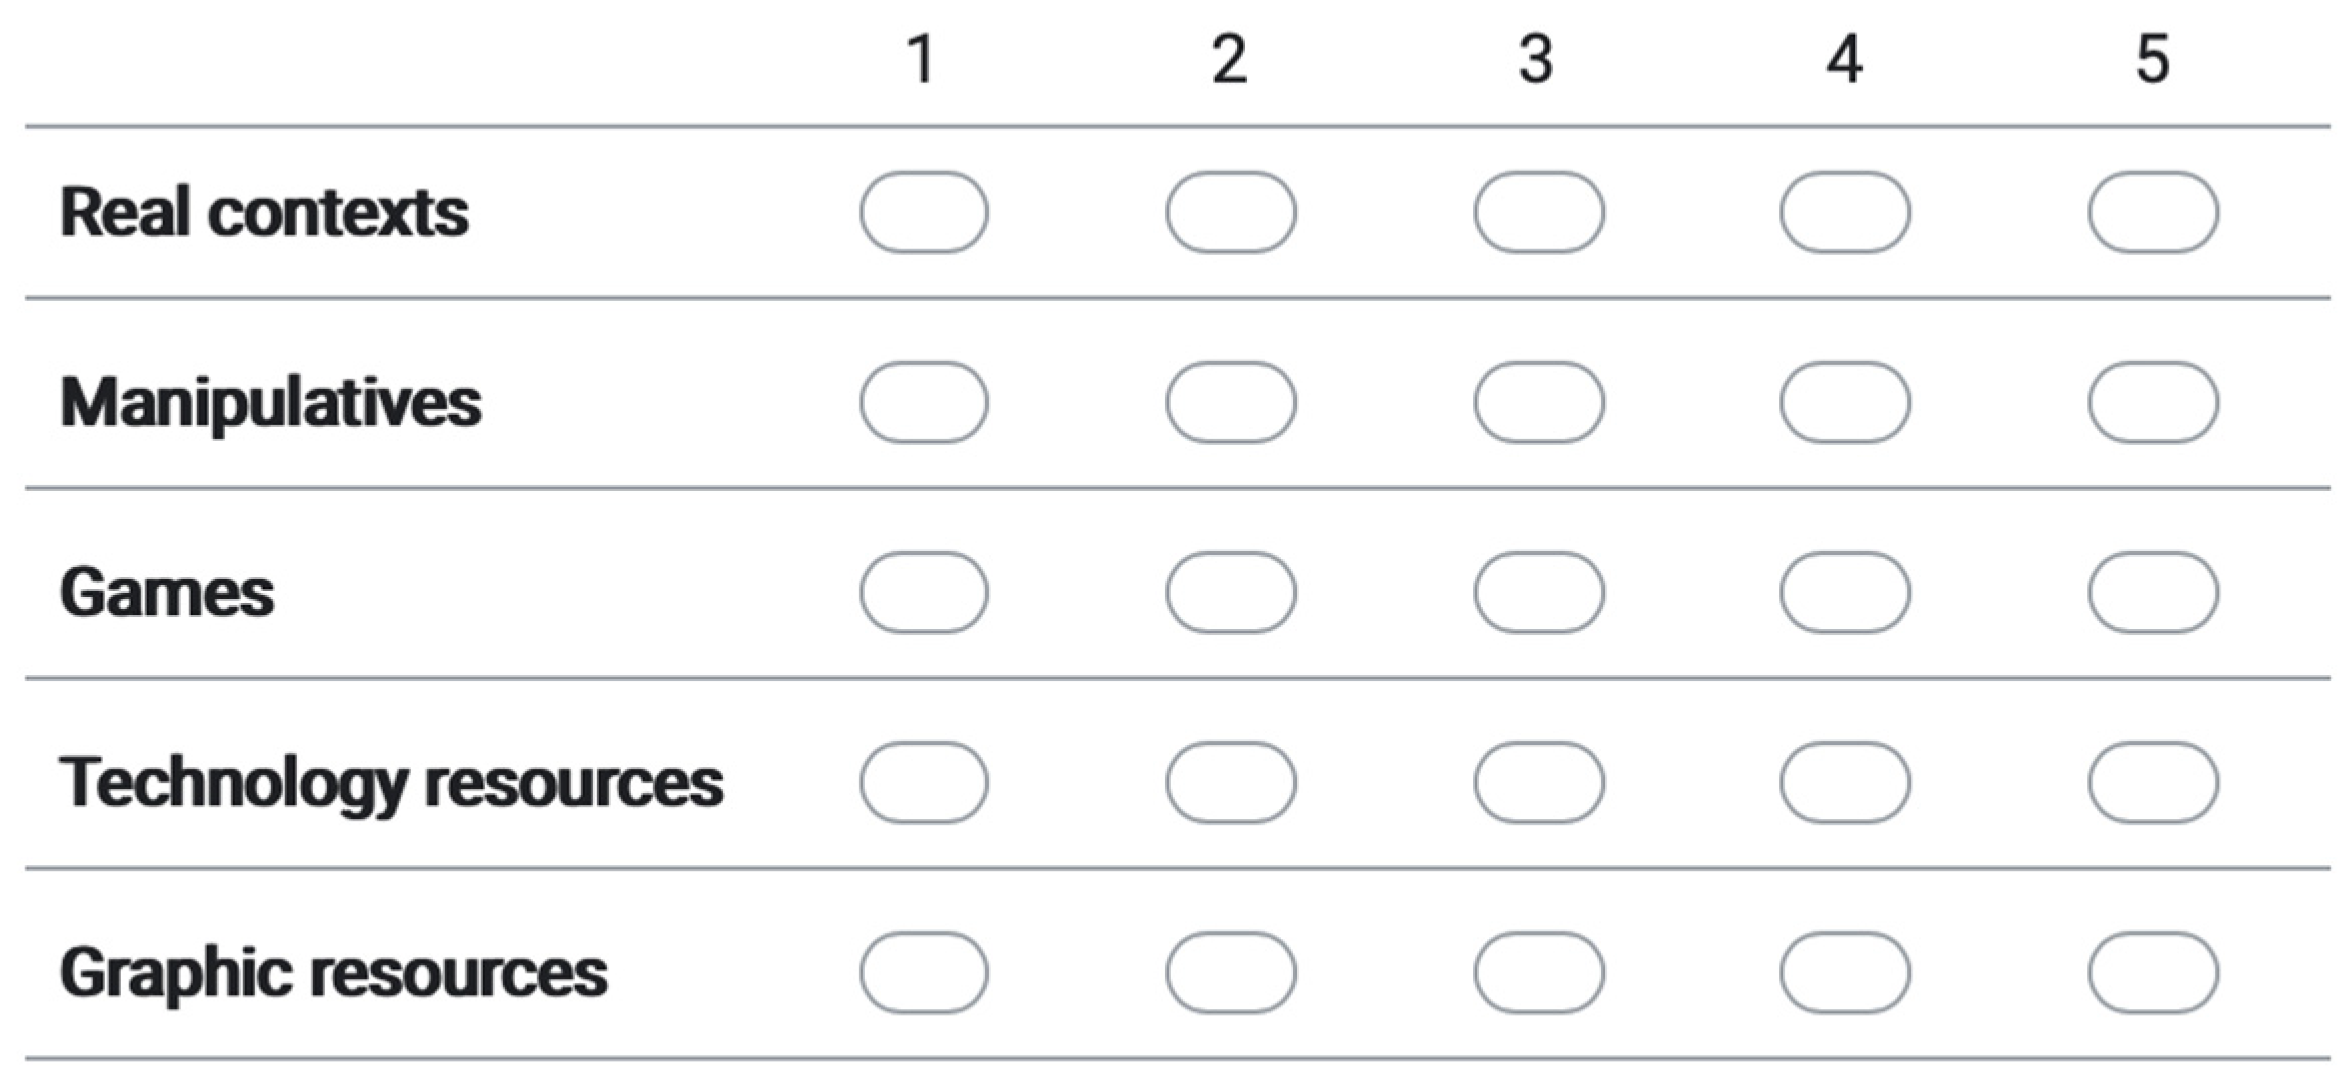
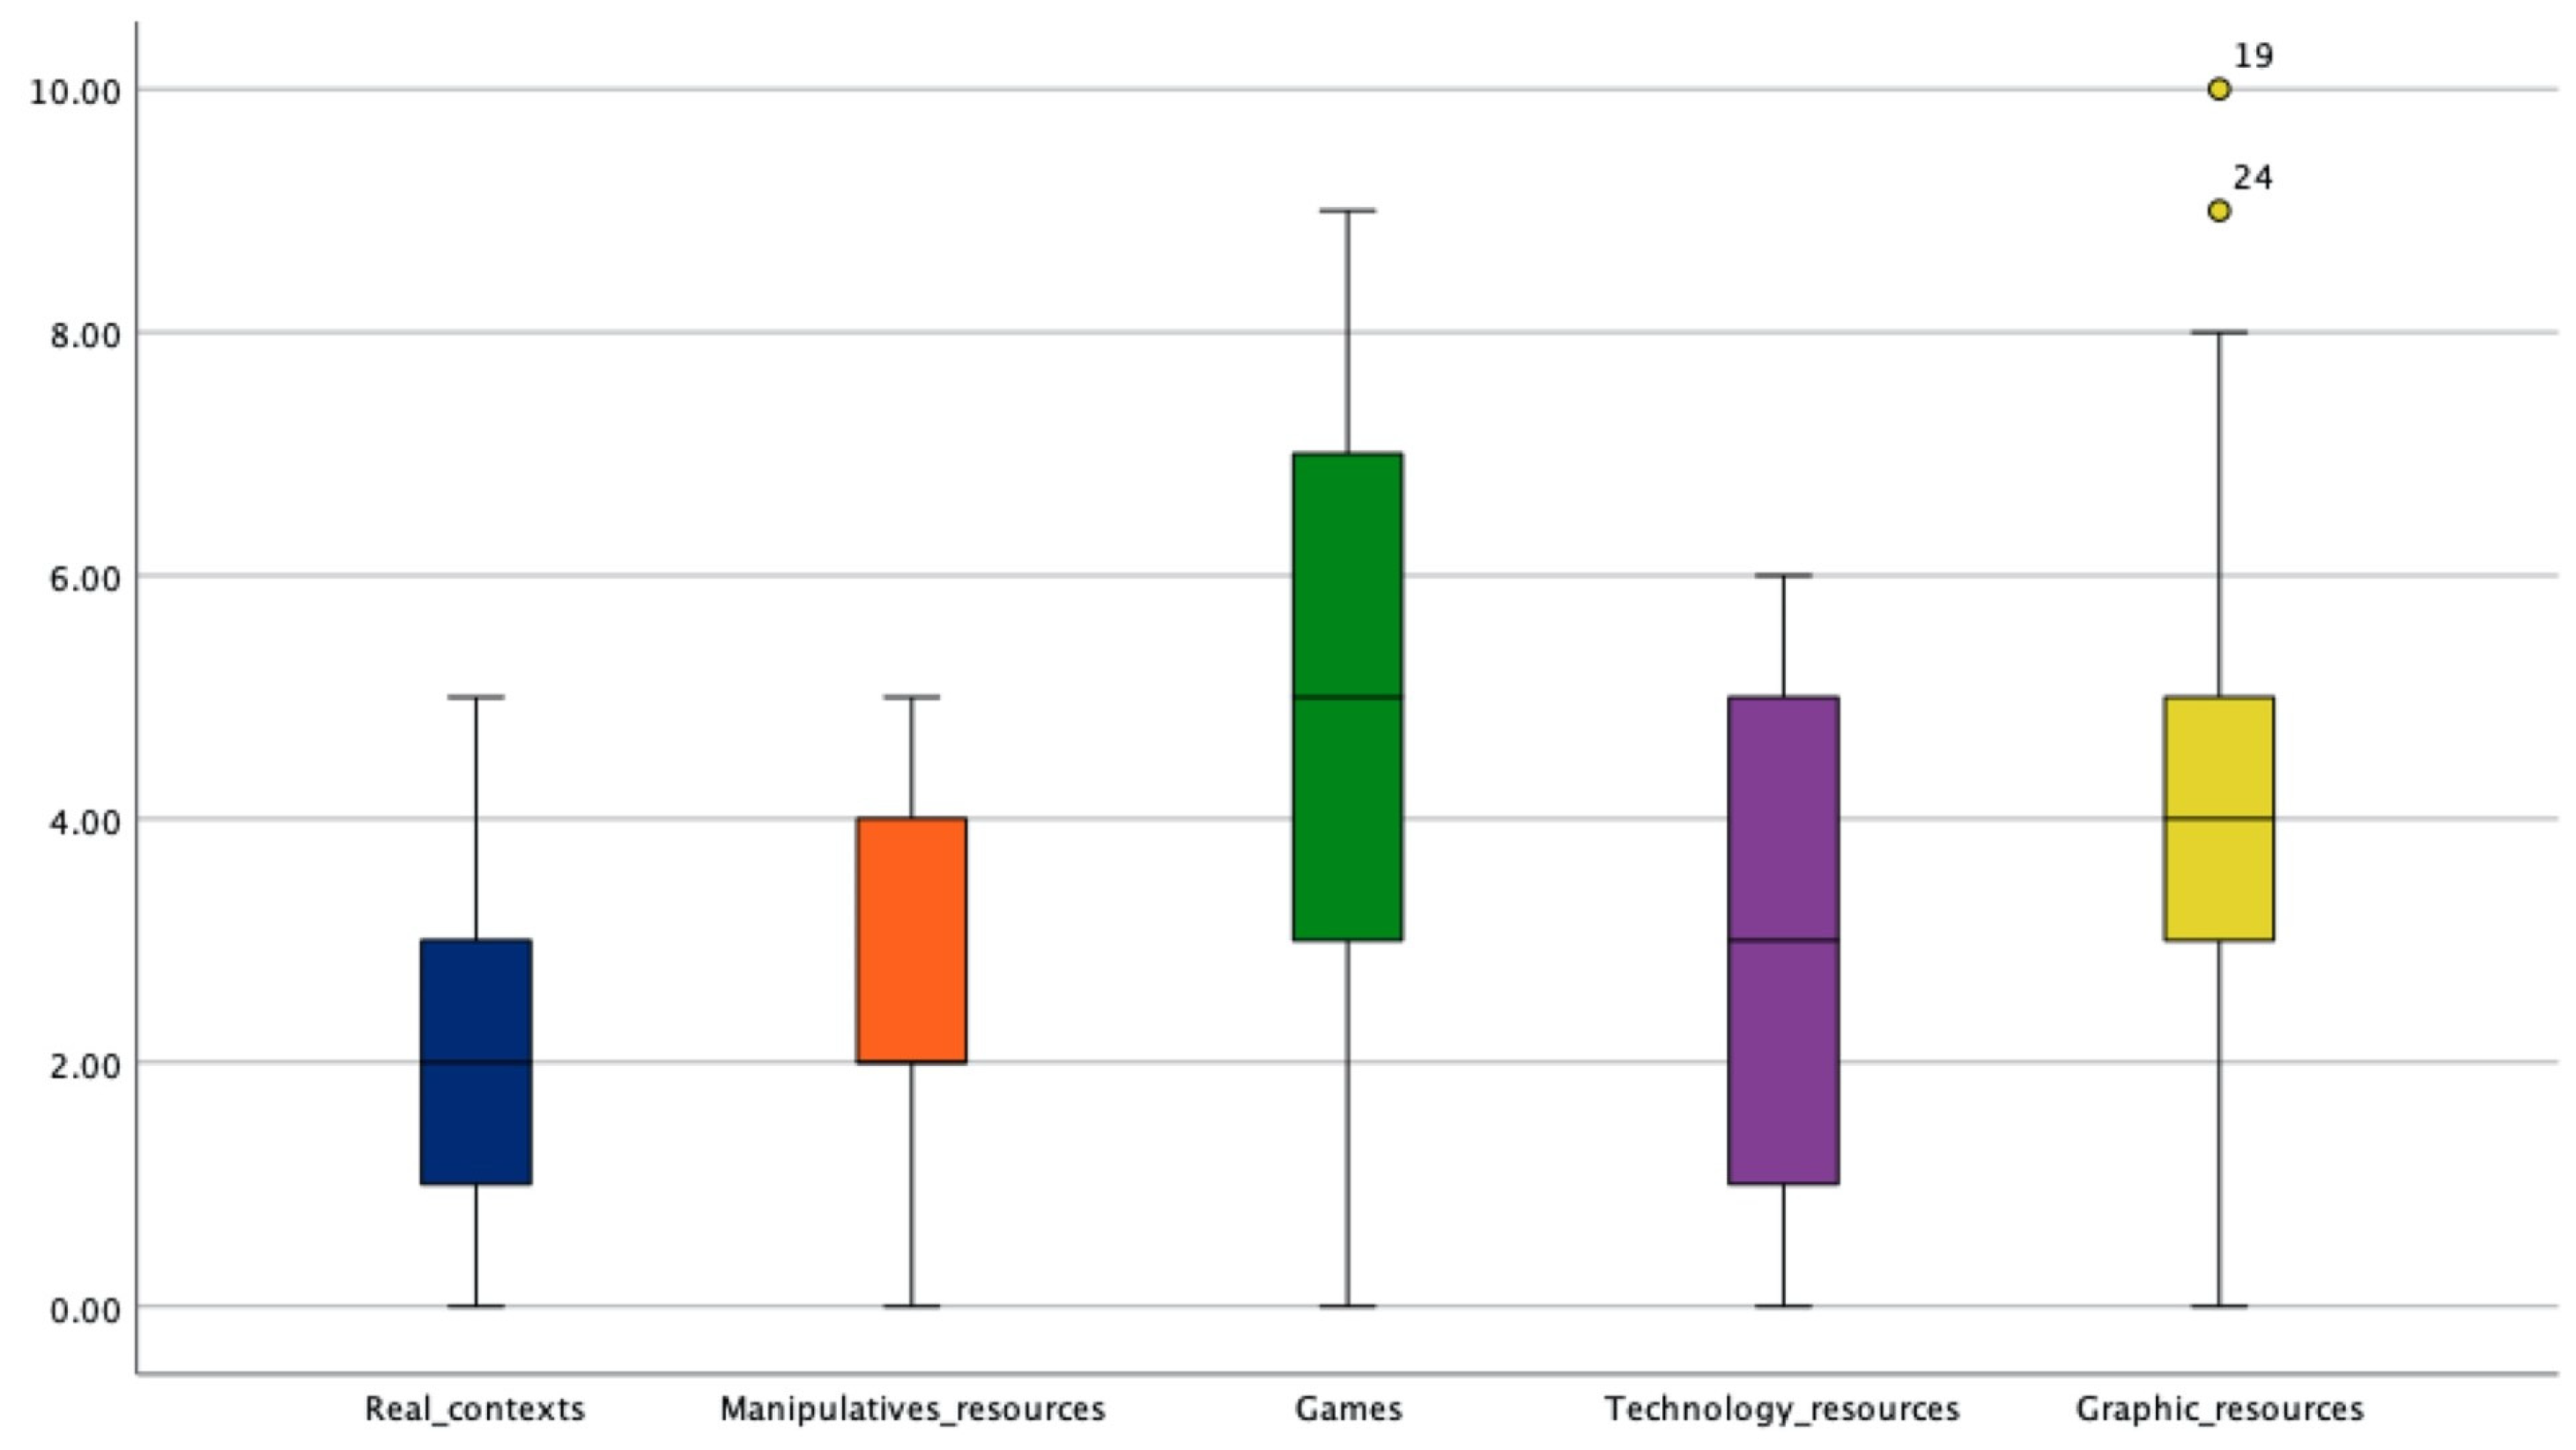
Arrange the different resources provided in the itinerary for teaching statistics in connection with sustainability based on whether you think they can be used to teach sustainable development, where 1 = least suitable and 5 = most suitable (Figure 1. Mark with an “x” only one oval per row. Finally, justify the reasons for your ranking.
(c)
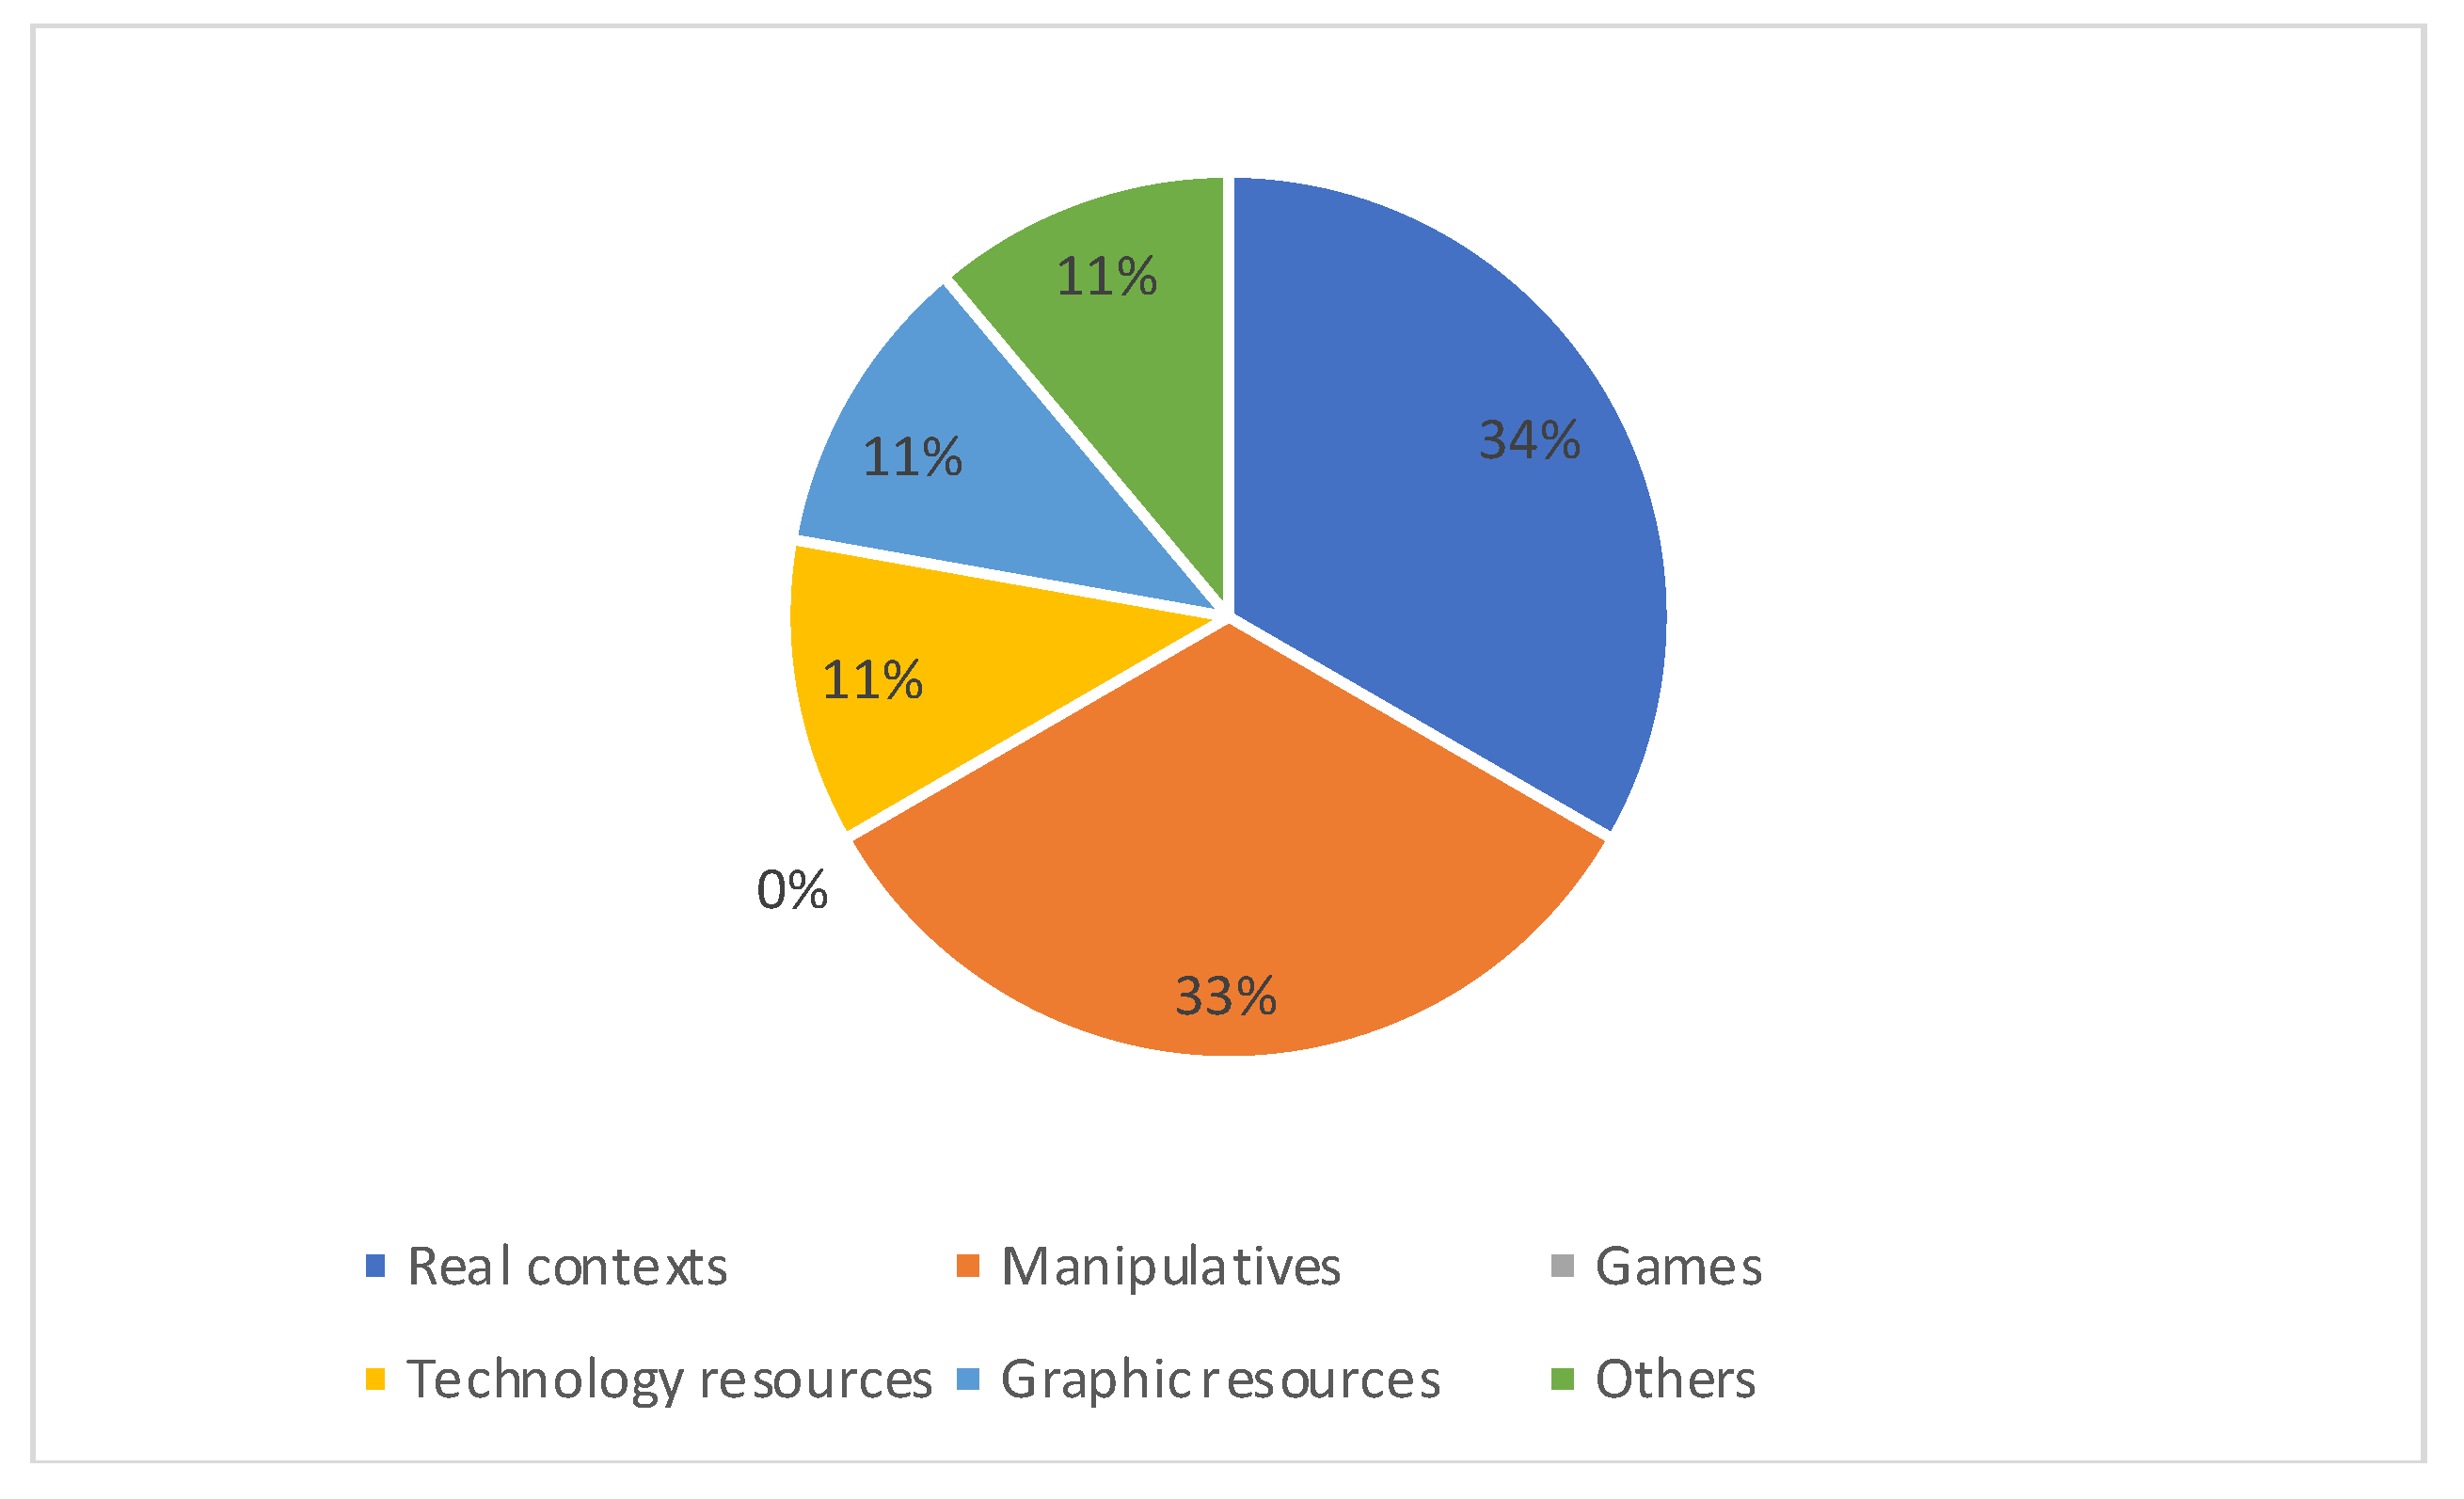
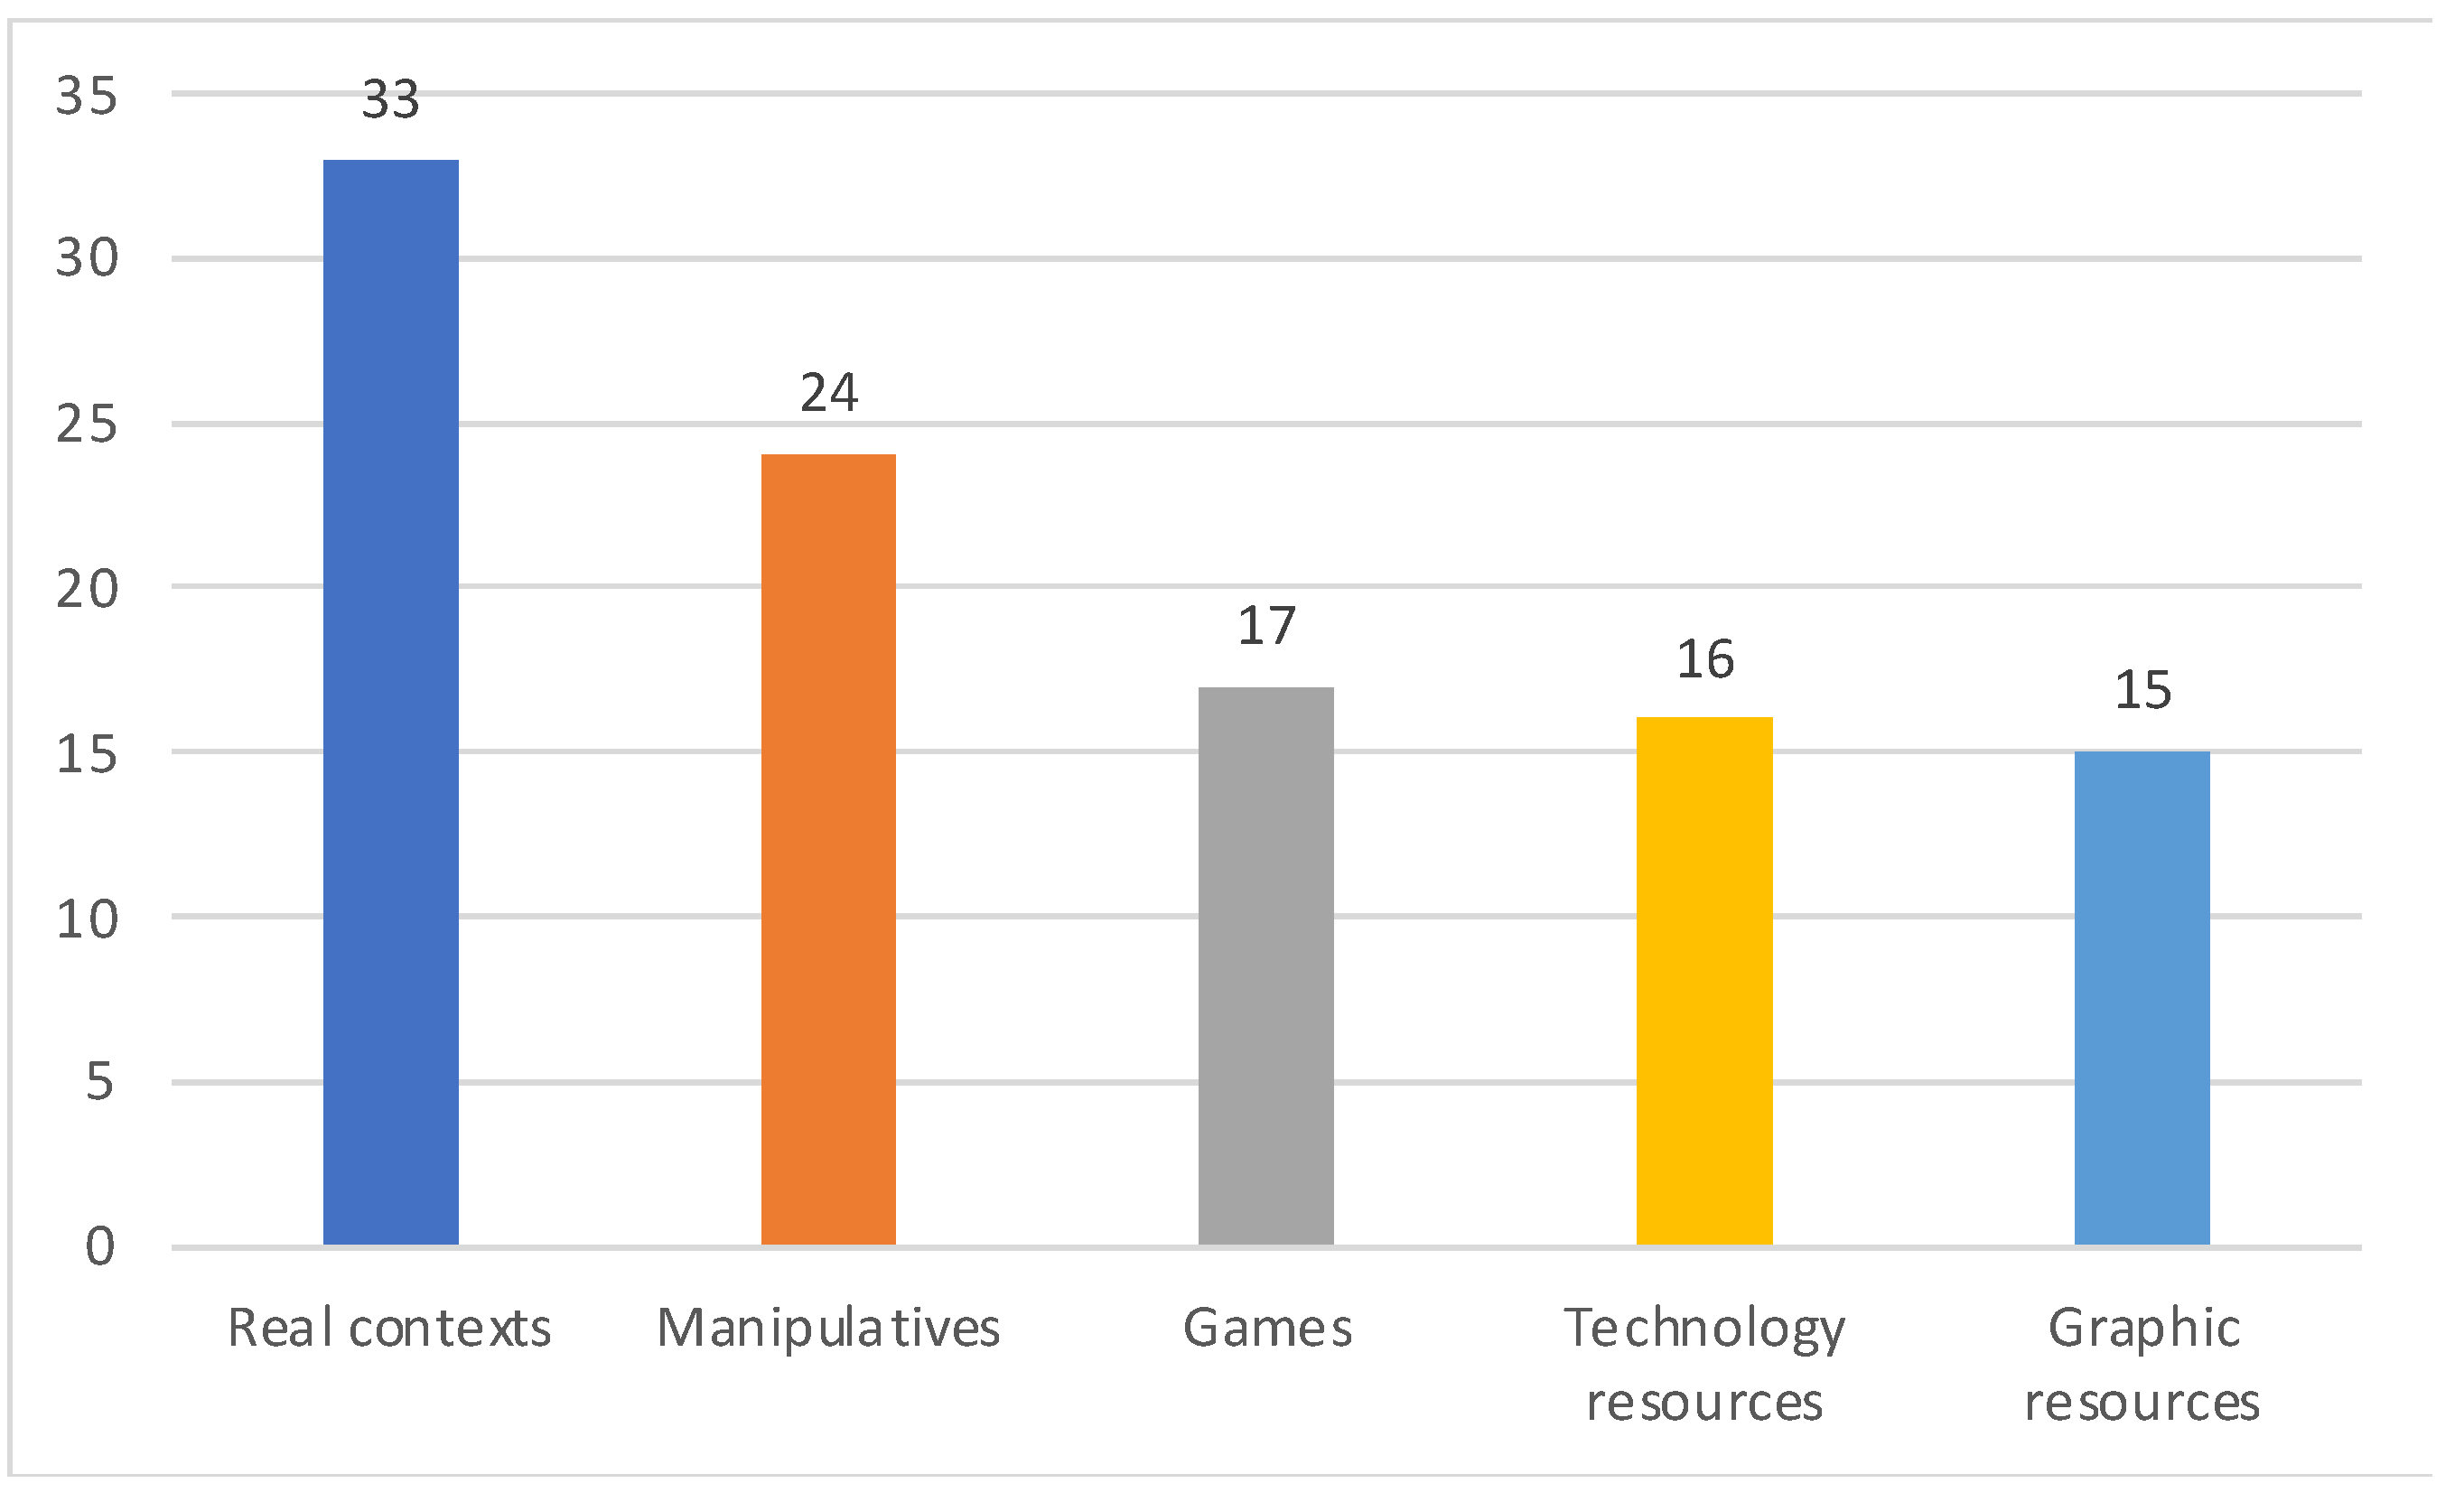
What type of resource (everyday situation, manipulative material, games, technological resources, or graphic resources) are you most confident using to teach statistics? Why?
Thus, these questions ask about teachers’ practices in teaching statistics and, more specifically, about their beliefs in the teaching of statistics for sustainability based on the proposed teaching itinerary. It should be noted that both questionnaires were administered online using Google Forms.

3.3. Analysis Procedure

Once the answers were collected, the mixed data were analyzed so as to integrate the findings from both methodologies. In this sense, with regard to the application of the MTSK-Stochastic Statistics Questionnaire, the answers were coded based on how correct they were, assigning a 0 for a blank or incorrect answer, a 1 if it was partially correct, and a 2 if it was correct for the quantitative data. The criteria for defining the category to which the answers belong were specified by means of a rubric. Based on this coding, psychometric aspects of the instrument were analyzed. In the case of qualitative data obtained from the application of the questionnaire “ESD in Statistical Activities”, teachers’ responses were recorded in order to look for patterns and key issues in the data, categorize them, and then analyze the relationship between the different responses.

4. Results

In keeping with the goals of this study, the results obtained from the application of the MTSK-Stochastic Statistics Questionnaire in the different teaching contexts of the MTIA (real contexts, manipulative resources, games, technological resources, and graphic resources) were first analyzed; secondly, the teachers’ beliefs on sustainability and its connection with statistics were studied based on their responses to the questionnaire “ESD in Statistical Activities”.

4.1. Specialized Knowledge on the Statistics and Teaching Contexts of the MTIA

This section analyzes whether the teaching context involved in the different items of the MTSK-Stochastic Statistics Questionnaire [44] has any association with the participants’ specialized knowledge of statistics. In other words, the goal was to find possible evidence regarding whether teachers mobilize their knowledge differently depending on the context used in the different situations proposed in the questionnaire.
First, we determined the total score of the questionnaire. For this purpose, the answers of the 25 teachers were categorized according to the indicated degree of correctness. According to these scores, a maximum score of 42 points was possible in the MTSK-Stochastic Statistics Questionnaire, since it consists of 5 items addressing 21 questions in total. The total scores obtained fluctuated between 5 and 31 points, which means that no teacher solved the questionnaire correctly in its entirety. Furthermore, the mean score was 16.8 points with a standard deviation of 6.01 points, which is very low given that this score takes into account both correct and partially correct answers. From Figure 2, we observe the presence of two outliers that correspond to extreme observations that are far from the bulk of the data, in this case, two teachers who obtained a total score of 29 and 31 points out of a total of 42 possible points.
In summary, these results indicate that these primary school teachers have difficulties in relation to their specialized knowledge for teaching statistics in sustainability contexts.
With regard to the scores obtained according to the different subdomains of the MTSK model, at the global level, Figure 3 shows how the percentages are distributed according to the degree of correctness of the answers for each of the questions that assess the subdomains of the MTSK model.
From the point of view of the different subdomains of the MTSK model, it can be seen that the results at the global level are low and do not exceed, on average, 17% of correct answers. It is also observed that the KMLS and KMT subdomains obtained the highest percentages of correct answers, 20% and 19%, respectively. On the other hand, the KoT and KFLM subdomains were the most difficult for the teachers participating in this study, with 14% and 15% of correct answers, respectively.
With regard to the teaching contexts of the MTIA, Figure 4 shows that those questions linked to the “games” context correspond to those with the highest percentage of correct answers (30%). Meanwhile, those questions related to the real contexts corresponded to those with the lowest percentage of correct answers (7%).
However, if we analyze the distributions of the scores for the different contexts of the MTIA, from Figure 5, we can see that teachers have more difficulties in answering those questions linked to real contexts, manipulative resources, and technological resources. On the other hand, in the questions linked to the use of graphic resources and games, they obtained a better score.
Finally, with regard to the influence of the context and the teaching resources involved (real contexts, manipulatives, games, technological resources, and graphic resources) on teachers’ specialized knowledge, a multiple linear regression analysis was carried out, showing that all the variables are significant (Table 2), but that the one with the greatest weight in explaining the final score obtained in the MTSK-Stochastic Statistics Questionnaire is the “games” context, which explained 44.4% of the score.

4.2. Teachers’ Beliefs Regarding the Teaching of Statistics in Connection with Sustainability Based on Teaching Itineraries

This section analyzes the beliefs of teachers in relation to the possibility of educating for sustainable development based on the proposed itinerary for teaching statistics. Of particular interest in this regard is how teachers interpret how sustainability is learned and how learning is manifested through the activities proposed. From this perspective, the teachers stated that students will have to reflect on the activities and, therefore, dialogue can be encouraged based on different sustainable development goals, such as reducing inequality, responsible production and consumption, health and well-being, etc.
Figure 6 shows the teachers’ beliefs regarding the teaching contexts proposed by the MTIA that allow them to effectively implement ESD. In this sense, most of the teachers agree that the real context/daily situation is the resource that provides the most efficient and relatable way to present the SDGs to the students, since everyday situations offer meaning and context to the students.
In addition, according to the total score (Figure 7), we infer that teaching statistics linked to sustainability has to go from the most concrete (everyday situation) to the most abstract (graphic resource). If we compare the total score obtained with the teaching contexts of the MTIA [27], we see how teachers agree that it is necessary to start with informal contexts, continue with intermediate contexts, and finish with formal contexts, and thus present learning from the concrete to the symbolic (graphic resource).
Finally, the teachers were asked what type of resource they feel most confident using to teach statistics, which yielded a variety of answers and justifications. Table 2 shows that the majority of teachers feel most confident when teaching using everyday situations and manipulative materials. As an example, one participant stated: “I feel more confident with manipulatives, since the students can personally pick them up, and visualize and represent the problem. I think they are more aware of what they are being asked and what the answer is. They internalize everything they learn more effectively through manipulation” (teacher 6). However, a comparison of the answers in Table 2 with Figure 7 and Figure 8, which reflect the overall scores of the teachers in the different contexts, reveals that the teachers have more difficulties with real contexts. It is therefore surprising that the teachers state feeling more confident when teaching statistics based on real situations.

5. Discussion and Conclusions

This study has analyzed the effect that an itinerary for teaching statistics in connection with sustainability has on the specialized knowledge of teachers and their beliefs, assuming that mathematics education in general, and statistics education in particular, are vitally important to understanding and responding to the different problems and challenges of the 21st century [6,7]. This is a double novelty: first, because this research has taken into account a variety of mathematical teaching contexts (real contexts, manipulatives, games, technological resources, and graphics), which is a topic of particular interest in mathematics education research for the next decade that has been little studied until now [15]; second, because the proposal of itineraries for teaching statistics in connection with sustainability provides support to teachers to advance towards an interdisciplinary vision of teaching statistics in connection with sustainability, an issue that has been widely claimed by institutions, such as [41], but which remains a challenge for teachers [23].
In the case of statistics education, there is a manifest need to reorient how it is taught in order to promote statistical literacy and thus provide strategies to students so they can interpret and critically evaluate statistical information [46]. Ref. [47] noted that statistics education allows us to incorporate tools based on statistical analyses to understand the relevant aspects of our society as a whole and thus make conscious decisions about how our individual actions impact the world in which we live. In this sense, statistics education, and therefore statistics literacy, provides an ideal setting to promote ESD [23]. Given this perspective, the theoretical–methodological approaches of the MTIA have been used to provide an itinerary for teaching statistics in connection with sustainability.
The findings of our study on the influence of mathematical teaching contexts on teacher knowledge have identified that scores are lower when teaching statistics using real contexts that are familiar to students. This is a worrying point, especially considering that many authors and organizations have underlined the importance of approaching the teaching of statistics through real contexts (e.g., [11,12,48,49] and others). The results in the other learning contexts also revealed difficulties, with the normalized scores not exceeding 50 out of 100 on average. This finding poses another challenge in how to promote professional teacher development for teaching statistics, as many authors have stressed the importance of using diverse contexts such as manipulatives or technology (e.g., [50,51]). Thus, the first contribution of this study is that, although the knowledge of teachers for teaching statistics has already been shown to be generally low, it seems that the context employed could also be playing a role.
As has been pointed out, this involves reflecting both on the training received by teachers and on their own practice, in order to make the necessary changes to improve their pedagogical knowledge, so that they feel more confident to incorporate resources, such as real contexts, manipulatives, or technological resources into their statistics teaching practices. From this perspective, Ref. [45] suggested that teachers should know many ways of acting and incorporate them into practice, i.e., they should have the criteria to know when, what, and why something is appropriate and reflect on it systematically.
Regarding the beliefs of teachers in terms of teaching statistics in connection with sustainability, among the main findings is that teachers place importance on reflection and subsequent dialogue between peers and between teachers and students. In this sense, the results suggest that teachers consider that teaching should start with real situations and move towards more abstract content, eventually concluding with graphic resources. These data show the importance that teachers attach to teaching by resorting to situations familiar to students, but they clash head-on with the low scores they obtain in this context in the MTSK-Stochastic Statistics Questionnaire [44]. One possible interpretation, in our opinion, is the little to no teacher training, since few had sufficient initial training on statistics and how to teach it [47,52,53]; that is, they have not received training that allows them to engage in suitable teaching in the classroom [54,55]. Consequently, statistics tend to be taught from textbooks, a fact that does not help solve students’ conceptual problems [56,57,58]. Or, education in statistics is omitted by the teaching staff, given their poor preparation, leaving it for the end of the year, at which point there is insufficient time in the curriculum compared to other blocks of content. Therefore, the professional development of teachers is essential, since they must be prepared to use this knowledge flexibly, accepting that effective teaching requires determining what students know and what they need to learn [20].
Finally, this study highlights the need to emphasize the value of teaching statistics in context and in a more cross-disciplinary manner [23], focusing on the development of sustainability skills in order to train citizens who are capable of addressing the complex and urgent challenges facing the world today, including those who are able to critically evaluate the relevant information, make informed decisions, and contribute significantly to solving problems in sustainability contexts.
In conclusion, the main contribution of this study is that the design of itineraries for teaching statistics for sustainability, from interdisciplinary tasks proposed across a variety of contexts and resources, would not only enhance the capacity of individuals to understand and address global challenges but also contribute to the education of committed and responsible citizens who are capable of positively influencing the sustainable future of our planet.
The limitations are as follows. The first is its limited nature, since it is a non-probabilistic sample consisting of a small group of in-service teachers who were intentionally selected based on their willingness to take part in this study. However, our initial findings are useful because, although they do not allow us to establish generalizations, they do have the potential to guide future lines of research related to the challenge of designing and implementing instances of professional development that impact the initial and continuous training of teachers, involving both their beliefs and their didactic and disciplinary knowledge to teach statistics in connection with sustainability. The second is that the results presented are local since they are limited to the Balearic Islands and Catalonia (Spain). The third is that the data on the beliefs of teachers were obtained from analyzing a single teaching itinerary, making it difficult to determine exactly whether the teachers’ knowledge of ways to teach statistics using sustainability criteria is transformed.
To overcome these limitations, it will be necessary to design new studies with larger samples and from other geographical areas, as well as to incorporate other tools and techniques to continue advancing towards teaching based on the principles of statistical literacy and education for sustainability. In addition, in the future, it will be necessary to design new studies that look into the experiences learned from teaching statistics, with a focus on sustainability in the school classroom.

Author Contributions

Conceptualization, J.F.S. and Á.A.; methodology, J.F.S., Á.A. and C.V.; formal analysis, J.F.S. and C.V; investigation, J.F.S., Á.A. and C.V.; resources, Á.A. and C.V.; data curation, J.F.S.; writing—original draft preparation, J.F.S., Á.A. and C.V.; writing—review and editing, J.F.S., Á.A. and C.V..; supervision, Á.A.; funding acquisition, Á.A. and C.V. All authors have read and agreed to the published version of the manuscript.

Funding

This work was carried out as a part of the project SGR 2021 00767, funded by the Agència de Gestió d’Ajuts Universitaris i de Recerca (AGAUR) of Catalonia (Spain), and FONDECYT N°. 1200356, funded by the Agencia Nacional de Investigación y Desarrollo (ANID) of Chile.

Institutional Review Board Statement

Approval for this study was not required in accordance with the local regulation “Doctoral thesis supervision procedure at the University of Girona (https://www.udg.edu/ca/portals/1/Normativa/Procediment_seguiment_TD_rev2021_GC_rev2_en.pdf, accessed on 21 December 2023)”, which establishes that the research plan of PhD students is supervised by the Academic Committee of the PhD program.

Informed Consent Statement

Informed consent was obtained from all subjects involved in the study.

Data Availability Statement

The data presented in this study are available on request from the corresponding author.

Conflicts of Interest

The authors declare no conflicts of interest.

Appendix A. MTSK-Stochastic Statistics Questionnaire

Item 1
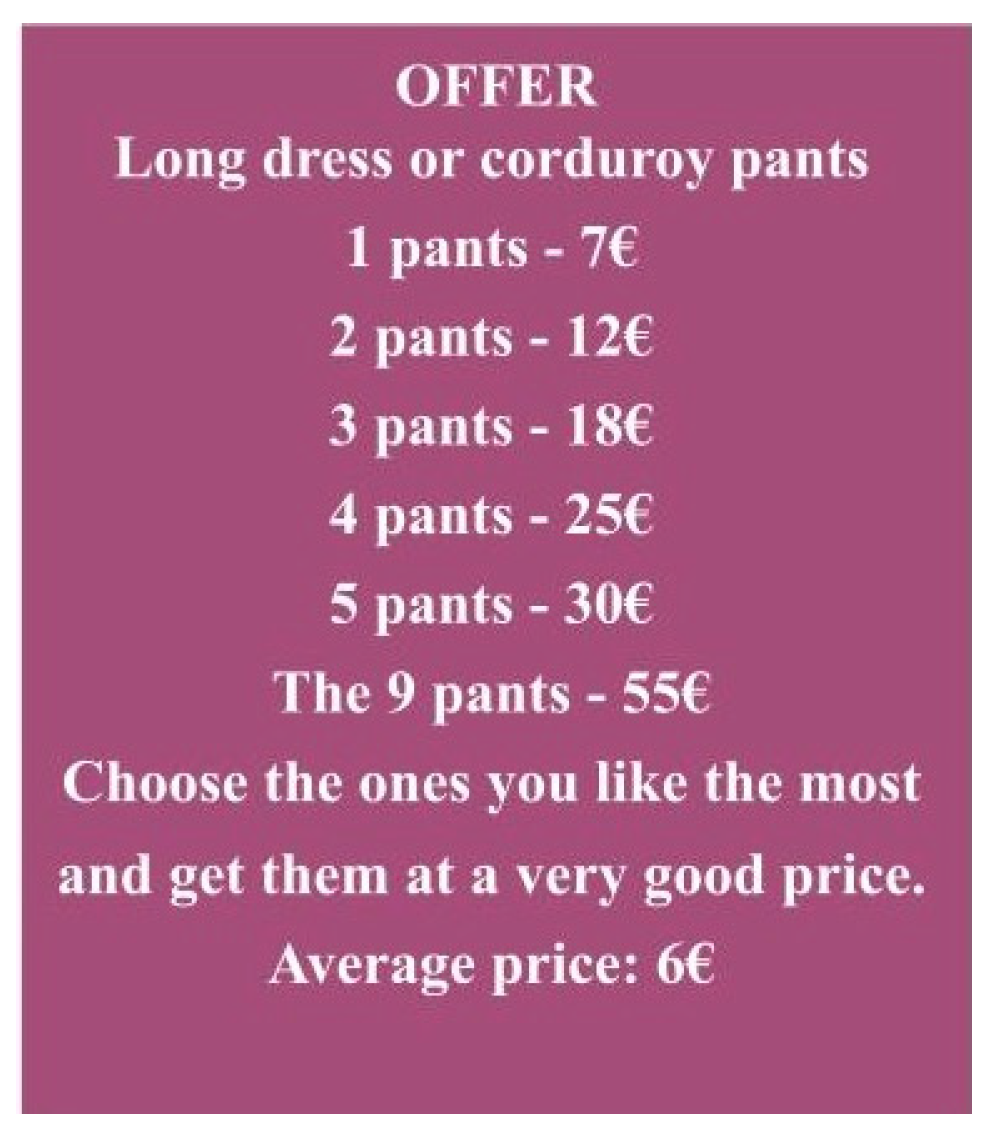
A clothes salesman puts up the following sign in his store: “Pants for sale, different prices, average price €25”. Based on this sign, which of the following statements is true and why?
(A)
Most pants cost between €15 and €35.
(B)
Half of the pants cost less than €25, and the other half cost more than €25.
(C)
At least one pair of pants costs €25.
(D)
Some pants cost less than €25.
Questions:
a.
What mathematical concepts and/or properties should students use to give a correct solution to this problem?
b.
What difficulties might students have when solving the problem?
c.
How would you as a teacher intervene to help the students with their difficulties?
d.
To what mathematical content can we relate the content involved in this problem?
MTIA context: real context.
Item 2
The teacher distributes 30 colored candies per group and asks them to try to fill the table with the number of candies they have based on their color. They are then asked, by group, to try to make a graph according to the different colors that they received to then transfer to paper. Once finished, the teacher asks them: What is the relative frequency of candies of a certain color? And the absolute frequency? Will it be the same for all the groups? Why? Questions:
a.
Describe the possible difficulties that the students may have.
b.
What strategies would you use to help overcome the potential difficulties or errors that come up in the solution to the problem? If a student does not understand where the relative frequency of candies of a certain color comes from, how would you reply?
c.
Based on the school curriculum, what is the objective of the problem, and in what grade would you present it?
MTIA context: manipulative.
Item 3
A Jenga tournament will be held in math class, where each student has to write down how many pieces they were able to move in each game. The dynamic of the game consists of moving blocks from the bottom of the tower to the top without the tower falling. Once eliminated, the student will write down on the board the results obtained (where the value item corresponds to the game and the number of times to the blocks the student was able to move without the tower falling), yielding a table similar to this:
Values Number of times
1
2
3
Once the game is over, they are asked to calculate the mean, mode, median, and range with the data from the tournament.
Questions:
a.
What mathematical concepts and/or properties should students use to give a correct solution to this problem?
b.
What difficulties might students have when solving the problem?
c.
How would you as a teacher intervene to help the students with their potential difficulties? For example, if they do not understand the concept of median, how would you answer?
d.
To what level do you think the above question is best suited? Why?
e.
To what mathematical contents can we relate the content involved in this problem?
MTIA context: game.
Item 4
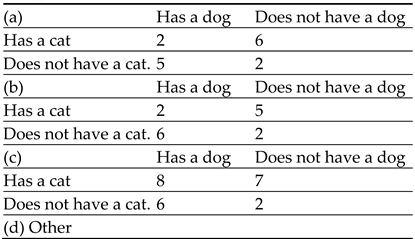
John asked his companions if they had any pet dogs or cats. He marked with a bold the pets of each, and collected the following information:
Sustainability 16 00692 i001
To complete the table, John got help from some friends. Which of these is correct?
Sustainability 16 00692 i002
Once the table is completed, the math teacher asks the students to make a graph using these data. They have to complete it with the Data Grapher applet, and then explain the strategy they used to make the graph and the reason for their choice.
Questions:
a.
What mathematical concepts and/or properties should students use to give a correct solution to this problem?
b.
What difficulties or errors could the students have when solving the problem?
c.
To what level do you think the above question is best suited? Why?
d.
How would you intervene to help the students overcome the possible difficulties or errors discussed in question 4b?
MTIA context: technological resource,
Item 5
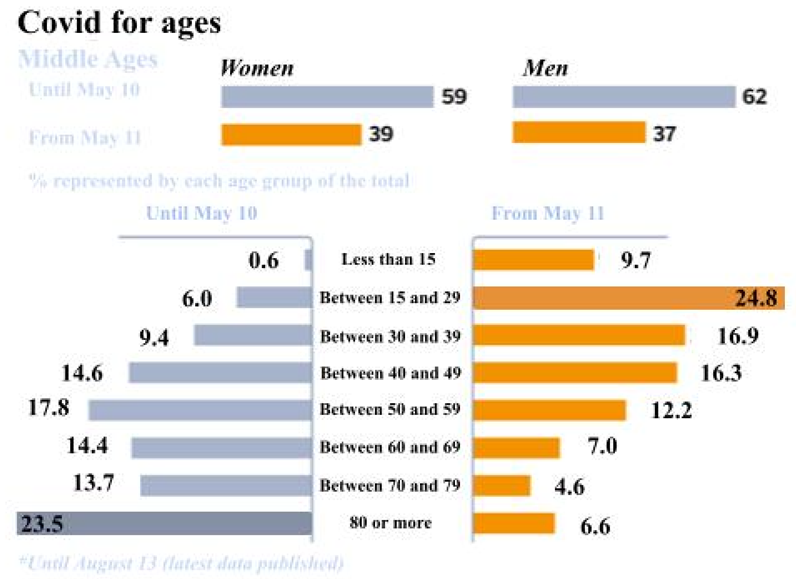
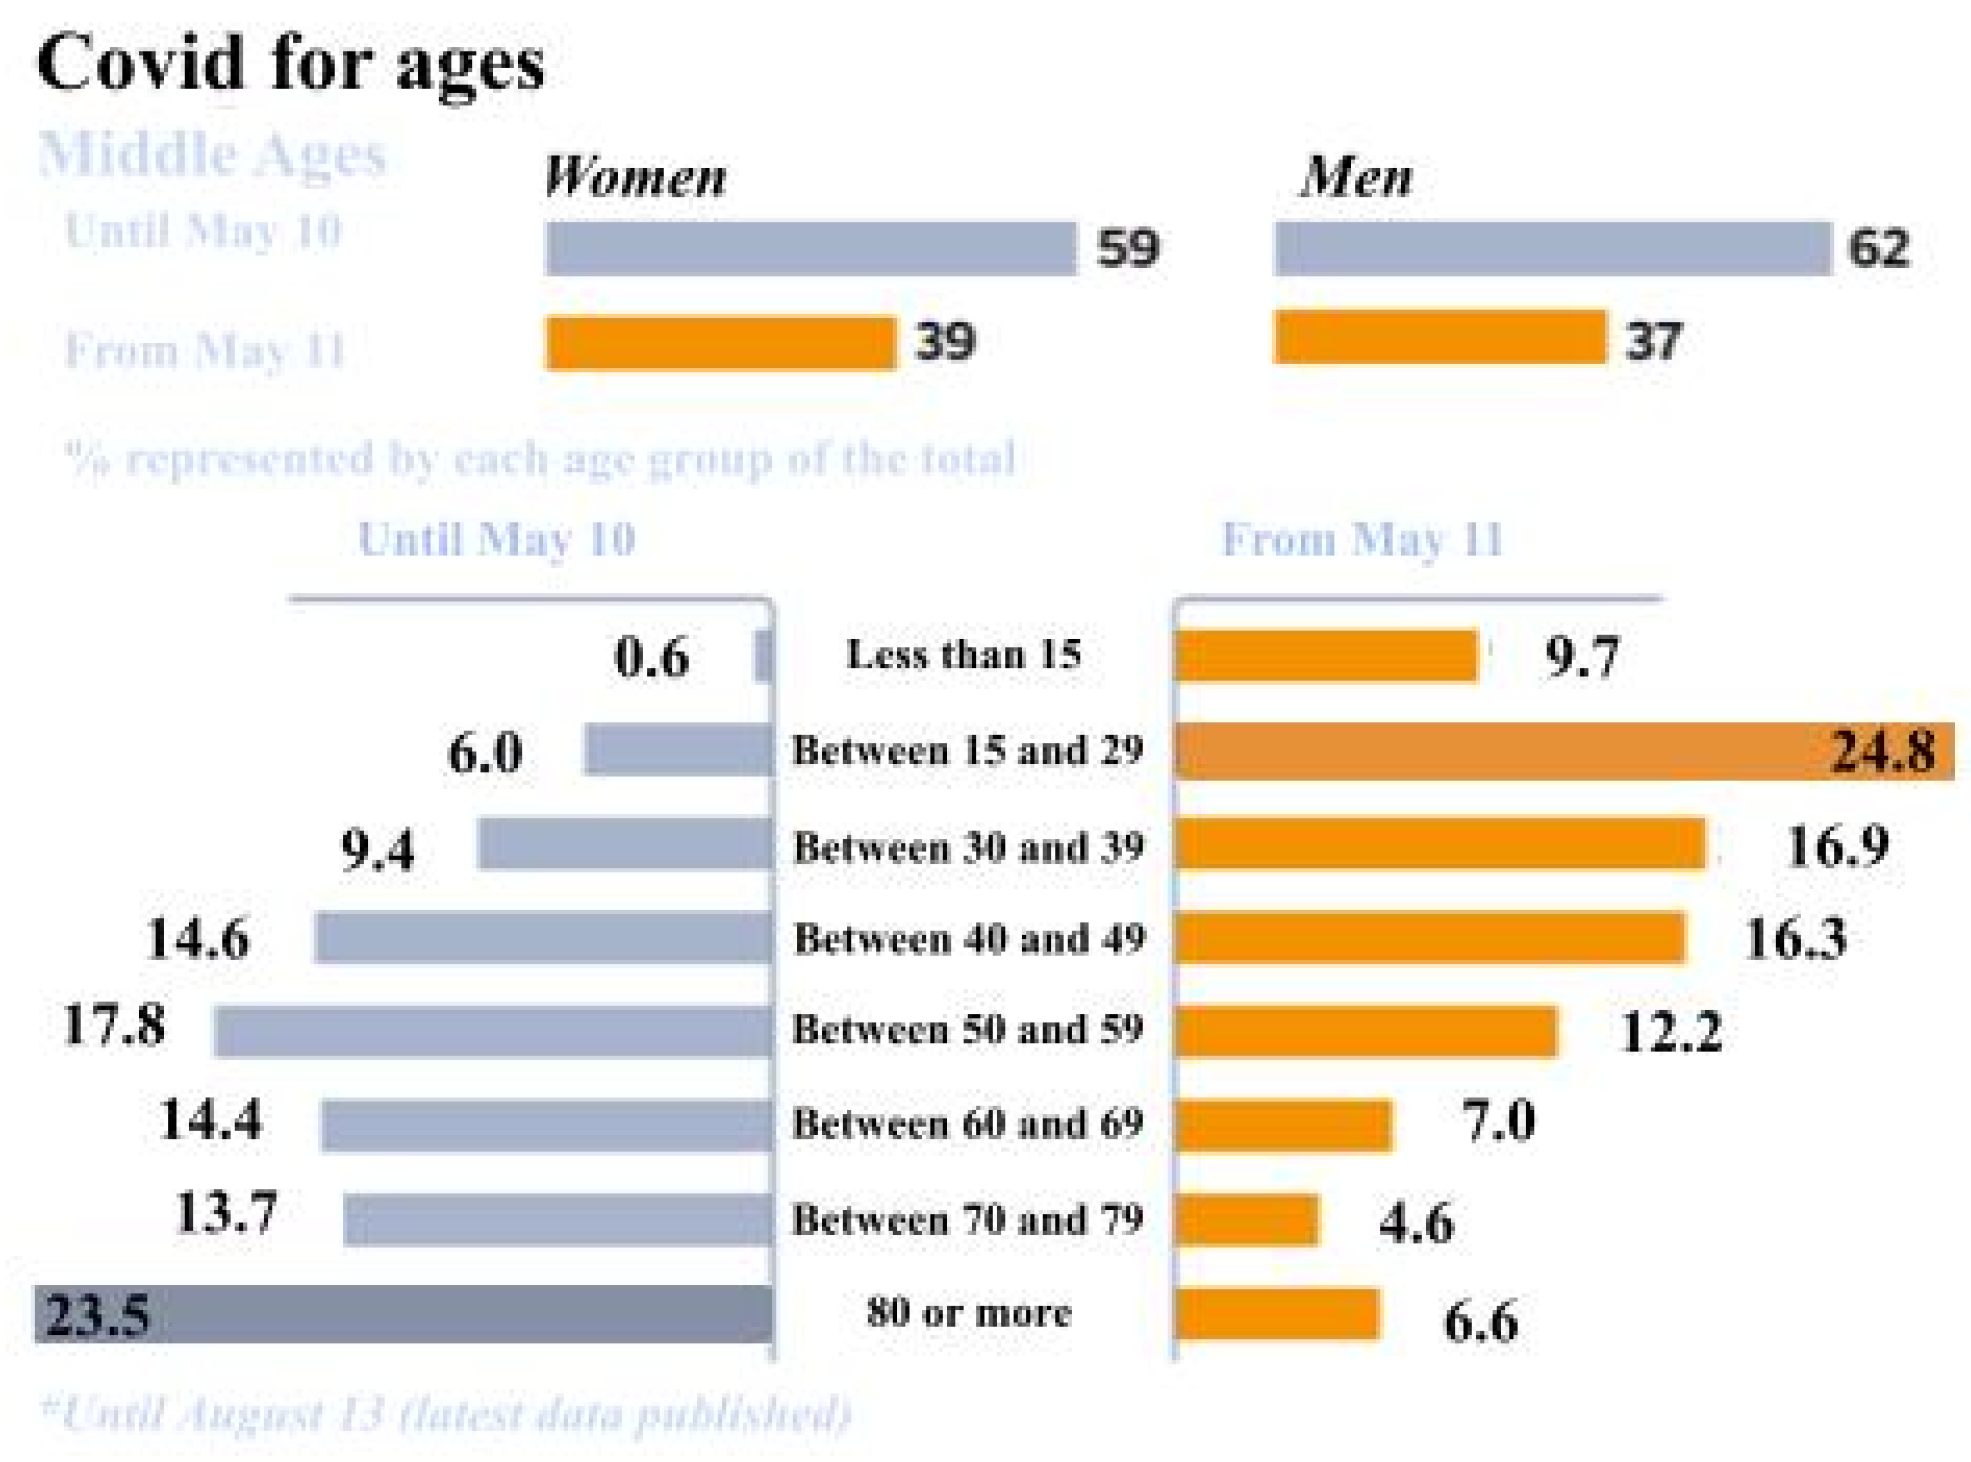
The math teacher shows them a population pyramid with confirmed COVID-19 cases in Galicia through 13 August, sorted by sex and age groups. From this perspective, the teacher asks them: What variables are being represented? What are their values?
Secondly, they are asked to identify what percentage of those affected are young people aged 15 to 29, and women aged 70 to 79. Finally, they are asked: What age group has the most cases? What is the difference between the two graphs?
Sustainability 16 00692 i003
Questions:
a.
What answers should the teacher accept as correct? Could you state them?
b.
What mathematical concepts and/or properties should students use to give a correct solution to this problem?
c.
What difficulties or errors might the students exhibit when solving the problem?
d.
How would you intervene as a teacher to help the students overcome their possible difficulties or mistakes? Could you describe a common error in this type of graph and explain how you would correct it?
e.
What concepts in the curriculum are related to the content involved in solving the problem?
MTIA context: graphic resource.

Appendix B. Itinerary for Teaching Statistics in Connection with Sustainability

ACTIVITY 1: Real context
Activity
Discover the arithmetic median present in everyday life situations, in this case, a promotional sign in a business (Figure A1), in order to identify and use the arithmetic median in a dataset.
Objectives
-
Read and interpret representations of a dataset relating to a familiar environment.
-
Use the arithmetic median to interpret information in contexts from everyday life.
-
Solve everyday problems.
-
Reflect on the consumption and reuse of products.
-
Consider the different working conditions in poor countries.
Content
-
Identify and use the median and mode in a dataset.
-
Analyze the differences between two samples: make observations, formulate conjectures, and propose new questions.
-
Use the calculator and ICT resources to prepare tables of values to calculate the median and arithmetic mean. Apply to problem solving.
Materials
-
Lego bricks.
Development of the proposal
-
Hold an initial discussion so that the students can express what they think the arithmetic mean is.
-
Present the necessary material in groups of four students. Allow time for free experimentation with the manipulatives.
-
Invite the students to analyze the problem presented: “A clothing salesman puts up the following sign in his business: Pants for sale, different prices, average price of €25”.
-
Guide the students to arrange the Lego bricks to identify the mean. For example, if a group member has 16 pieces and the others 17, 25, and 35, what is the mean?
-
Having identified the mean, guide the students to extract means with different prices and numbers of pants.
-
Collect the results and discuss in a small group to subsequently draw a conclusion with the class.
Development questions
Based on the sign, which of the following statements is true and why?
a.
Most pants cost between €15 and €35.
b.
Half of the pants cost less than €25, and the other half cost more than €25.
c.
At least one pair of pants costs €25.
d.
Some pants cost less than €25.
Connections to sustainability
Work on SDG 1 to end poverty within the framework of working conditions associated with poverty, such as exploitative companies and/or child labor. To this end, based on leading questions, students are invited to reflect on the working conditions in companies that sell their products very cheaply.
SDG 12, responsible production and consumption, is presented using the following questions: How often do you think you should buy clothes and/or electronic products? What do you do when your clothes get too small? What is the best way to reduce individual consumption of electronics and/or clothing? This activity promotes, on the one hand, the competence of critical thinking by questioning the practices of some large companies to sell their products cheaper, and at the same time, reflect on their own actions. The students also reflect on the role that each one has in their local community, evaluating the actions they take (competence of self-awareness) in relation to the responsible consumption of products.
ACTIVITY 2: Manipulatives
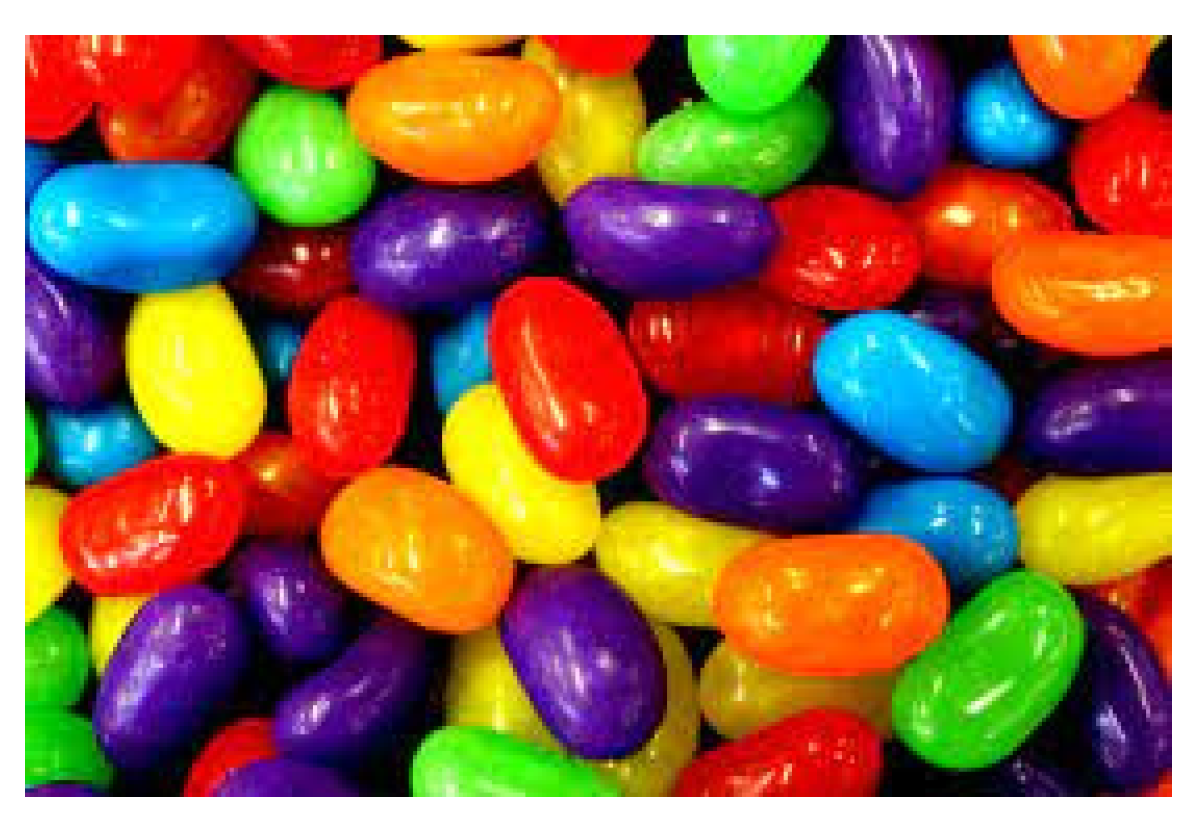
Activity
Arrange the candies (Figure A2) in order to identify the relative and absolute frequency of candies of a certain color and compare the results with the different groups.
Objectives
-
Collect and record quantifiable information, candies, using a data table.
-
Interpret graphical representations of an environmental dataset.
-
Reflect on the need to live a healthy life.
Content
-
Use data generated from simulations.
-
Formulate questions and design statistical research to collect data.
Materials
-
Colored candies.
Development of the proposal
The teacher distributes 30 colored candies per group and asks them to try to fill the table with the number of candies they have based on their color. They are then asked, by group, to try to make a graph according to the different colors that they received to then transfer to paper.
-
Hold an initial discussion so the students can express what they think the relative and absolute frequency are.
-
In groups of fur students, present the necessary material (30 colored candies per group). Allow time for free experimentation with the manipulatives.
-
Prompt the students to manipulate the colored candies to identify the relative frequency of candies of a certain color. In groups, have them make a graph showing the different colors they received.
-
Once the relative frequency is identified, guide the students to extract the absolute frequency.
-
Collect the results and discuss in a small group to subsequently draw a conclusion with the class.
Development questions
-
What is the relative frequency of the candies of a certain color? And the absolute frequency?
-
If we ask ourselves the same question thinking of all the groups, will the relative and absolute frequencies be the same? Why?
-
What type of graph is best suited to represent the different frequencies?
Connections to sustainability
SDG 3 on health and well-being is presented by asking how often students eat foods with a lot of sugar, such as candy or sweets. They are asked: What happens if you eat a lot of foods that contain sugar? What diseases can this cause? Are there healthier candies and/or sweets?
Regarding the competences for sustainability, the main focus is on the competence of anticipation, since, when investigating the problems associated with the consumption of candy, they have to understand and evaluate future scenarios, such as the effect that excess consumption can have in the medium and long term.
ACTIVITY 3: Game
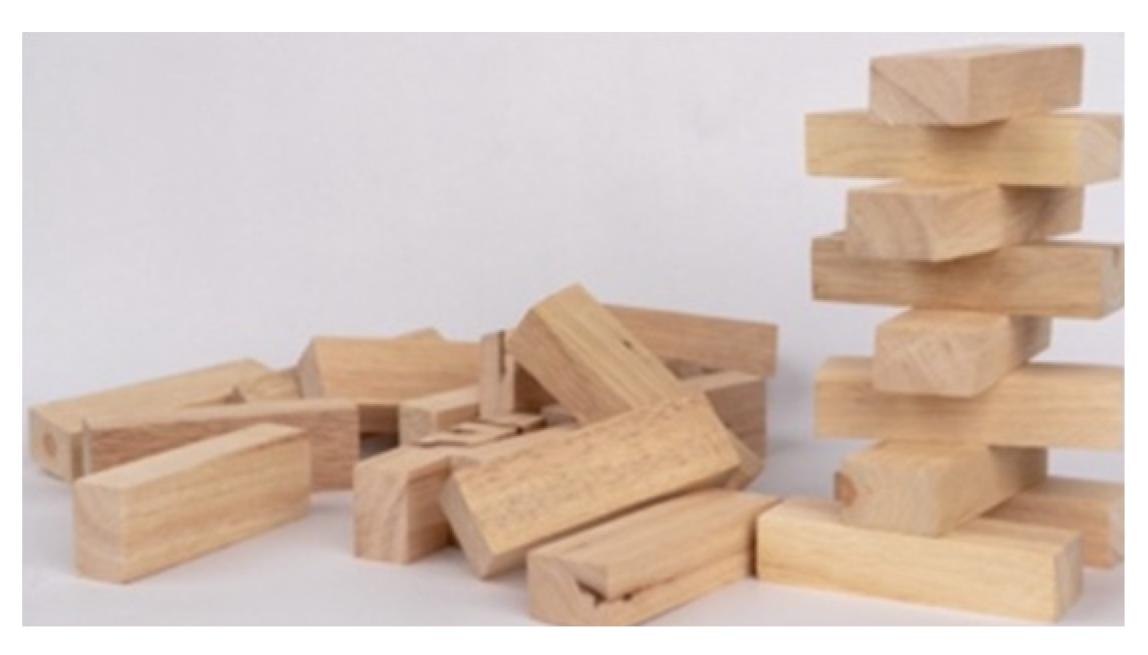
Activity
Reinforce the concepts of the mean, mode, median, and range using the game “Jenga”, a game of physical skill in which players take turns removing one block at a time from a tower built using 54 blocks. Each removed block is placed on top of the tower, creating a structure that grows more unstable with each turn (Figure A3).
Objectives
-
Collect and record quantifiable information, Jenga pieces, using a data table.
-
Identify the mean, mode, median, and range in a dataset generated from a simulation.
Content
-
Identify and use the mean, median, mode, and range of a dataset.
-
Formulate questions and design statistical research to collect data.
Materials
-
Jenga.
Development of the proposal
-
Hold an initial discussion so that the students can express what they think the mean, mode, median, and range are.
-
Present the necessary material in groups of four students. Allow time for free experimentation with the manipulatives.
-
Explain the rules of the game.
-
Invite the students to play. In the first game, the students will play without paying attention to the number of moves they make. Starting with the second game, the students have to record the number of moves they make without toppling the tower.
-
Collect the results and discuss in a small group to subsequently draw a conclusion with the class.
Development questions
-
Who starts the game?
-
What are the rules for removing a Jenga block?
-
Who wins?
Connections to Sustainability
This activity deals with SDG 11, sustainable cities and communities, by asking about the manipulative material used during the session. In this case, it is the “Jenga” game, made with recycled materials and/or wood. The students are asked to think about the use of this material, inquiring and reflecting on the importance of using recyclable or reusable materials. Specifically, considering that, according to Wikipedia, by the end of 2017, more than 80 million Jenga games had been sold worldwide, equivalent to over 4 billion Jenga blocks, reflect on whether it is better to use blocks of wood or properly recycled material.
As far as competences are concerned, this activity primarily develops collaboration, since the fact that it is a game of skill and concentration implies that not all students perform well in this type of situation, which is why it is essential that students learn to engage in collaborative and participatory problem solving.
ACTIVITY 4: Technological resource
Activity
By manipulating the online version of the Data Grapher applet (Figure A4), discover and identify what graph is best suited to represent the dataset provided by the teacher containing data on local sustainability.
Objectives
-
Interpret a data table.
-
Represent a dataset in a graph.
Content
-
Use data collected by teachers.
-
Use bar graphs (single, double, and stacked), histograms, dot plots, and pie charts to represent the data.
-
Make predictions and discuss whether or not the results agree with the predictions.
Materials
-
Table with data from the problem.
Development of the proposal
-
Hold an initial discussion to let the students recall the different types of graphs.
-
Present the necessary material in groups of four students. Allow time for free experimentation with the material.
-
Invite the students to experiment with the Data Grapher applet to identify the most appropriate type of graph.
-
Collect the results and discuss in a small group to subsequently draw a conclusion with the class.
Development questions
-
Would you be able to predict the mean of the dataset? Calculate the mean and compare it with your prediction.
-
Which graph best represents the data obtained?
Connections to Sustainability
This activity involves all the SDGs by inquiring about the sustainability data of the local community, but it deals particularly with SDG 4, quality education, by promoting learning opportunities for all students by relying on technological resources.
Regarding the key competencies for sustainability, this task encourages the competency of anticipation based on good questions about what future scenarios the students expect from the results of the graph. It also works on the self-awareness competency based on the data provided by the teachers. In this regard, the students must be aware of the actions they take and evaluate them to improve local sustainability.
ACTIVITY 5: Graphic resource
Activity
Observe the data provided by teachers on the effect of COVID-19 by age (Figure A5) and analyze them in depth to prompt a dialogue between students, first in pairs and later in a large group.
Objectives
-
Discuss the data in a bar graph.
-
Interpret the graphical representations of the COVID-19 data.
Content
-
Use data generated from simulations.
-
Concept of variables and values of a statistical graph.
-
Concept of range in relation to those most affected by COVID-19.
Materials
-
Statistical graph of the influence of COVID by age.
Development of the proposal
-
Present the activity in a large group and then pair up (heterogeneous).
-
Explain the rules of the activity and give an example to the group. First, they will identify which age group is most affected by COVID-19, and whether the result corresponds to the news reports.
-
Answer a series of questions in pairs.
-
At the end of the teacher’s questions, there will be time for each member of the pair to think of questions for other classmates to answer.
-
Reflect, in a large group, on the answers to the questions. Prompt dialogue.
Development questions
-
If we look at the first graph, when was the incidence of COVID-19 at its highest? Did more women or more men have it? Why?
-
The second graph provides information about the most affected age range, what is it? And the least affected? Is it the same for both men and women?
-
Why do you think there are differences between the ages of the men and women?
-
Would you say that the data provided reflect the information presented in the news? Can you find an example that confirms your answer?
Connections to sustainability
This activity emphasizes SDG 1, end to poverty, and SDG 10, reduced inequalities, by prompting a dialogue with questions such as: Do you think that the poor were more affected by COVID? Or has it affected everyone equally?
In addition, with regard to SDG 3, good health and well-being, students have to investigate and remember what behavioral routines they had during the time of COVID-19 and their opinion about them.
Regarding the key competencies, this activity deals with regulations by reflecting on the norms and actions in place during the time of COVID-19. The students are also asked if they believe that a pandemic, such as COVID-19, will happen again and, if so, what actions they would take to deal with the potential risks.
Figure A1. Promotional poster.
Sustainability 16 00692 g0a1
Figure A2. Bag of candy.
Sustainability 16 00692 g0a2
Figure A3. Jenga.
Figure A3. Jenga.
Sustainability 16 00692 g0a3
Figure A4. Data Grapher Applet.
Sustainability 16 00692 g0a4
Figure A5. COVID data.
Sustainability 16 00692 g0a5

References

  1. Rocard, M. (Ed.) Science Education Now: A Renewed Pedagogy for the Future of Europe; European Communities: Brussels, Belgium, 2007. [Google Scholar]
  2. Morin, E. La Cabeza Bien Puesta: Repensar la Reforma, Reformar el Pensamiento; Ediciones Nueva Visión: Buenos Aires, Argentina, 1999. [Google Scholar]
  3. UNESCO. Guidelines for Inclusion: Ensuring Acces to Education for All; UNESCO: Paris, France, 2005. [Google Scholar]
  4. Bonil, J.; Junyent, M.; Pujol, R.M. Educación para la sostenibilidad desde la perspectiva de la complejidad. J. Eureka Sobre Enseñanza Y Divulg. De Las Cienc. 2010, 7, 198–215. [Google Scholar] [CrossRef]
  5. OECD. OECD Future of Education and Skills 2030: OECD Learning Compass 2030. 2019. OECD: Paris, France. Available online: http://www.oecd.org/education/2030-project/teaching-and-learning/learning/corefoundations/Core_Foundations_for_2030_concept_note.pdf (accessed on 10 October 2023).
  6. Batanero, C.; Borovcnik, M. Statistics and Probability in High School; Sense Publishers: Rotterdam, The Netherlands, 2016. [Google Scholar]
  7. Ben-Zvi, D.; Makar, K.; Garfield, J. (Eds.) International Handbook of Research in Statistics Education; Springer: Cham, Switzerland, 2018. [Google Scholar]
  8. Begg, A. Some emerging influences underpinning assessment in statistics. In The Assessment Challenge in Statistics Education; Gal, I., Garfield, J., Eds.; IOS Press: Amsterdam, The Netherlands, 1997. [Google Scholar]
  9. Arteaga, P. Evaluación de Conocimientos Sobre Gráficos Estadísticos y Conocimientos Didácticos de Futuros Profesores. Ph.D. Thesis, Universidad de Granada, Granada, Spain, 2011. [Google Scholar]
  10. Moore, D.; Cobb, G. Mathematics, Statistics, and Teaching. Am. Math. Mon. 1997, 104, 801–823. [Google Scholar]
  11. Bargagliotti, B.; Franklin, C.; Arnold, P.; Gould, R.; Jhonson, R.; Perez, L.; Spangles, D.A. (Eds.) Pre-K–12 Guidelines for Assessment and Instruction in Statistics Education II (GAISE II); American Statistical Association: Alexandria, VA, USA, 2020. [Google Scholar]
  12. Hahn, C. Linking academic knowledge and professional experience in using statistics: A design experiment for business school students. Educ. Stud. Math. 2014, 86, 239–251. [Google Scholar] [CrossRef]
  13. Wild, C.J.; Pfannkuch, M. Statistical thinking in empirical enquiry. Int. Stat. Rev. 1999, 67, 223–248. [Google Scholar] [CrossRef]
  14. Gal, I. Understanding statistical literacy: About knowledge of contexts and models. In Proceedings of the Third International Virtual Congress of Statistics Education, Virtual, 21–24 February 2019; Contreras, J.M., Gea, M.M., López-Martín, M.M., Molina-Portillo, E., Eds.; University of Granada: Granada, Spain, 2019. [Google Scholar]
  15. Bakker, A.; Cai, J.; Zenger, L. Future themes of mathematics education research: An international survey before and during the pandemic. Educ. Stud. Math. 2021, 107, 1–24. [Google Scholar] [CrossRef] [PubMed]
  16. Batanero, C. La comprensión de la probabilidad en los niños. ¿Qué podemos aprender de la investigación? In Atas do III Encontro de Probabilidades e Estatítica na Escola; Fernandes, J.A., Correia, P.F., Martinho, M.H., Viseu, F., Eds.; Centro de Investigação em Educação, Universidade Do Minho: Braga, Portugal, 2013. [Google Scholar]
  17. Bryant, P.; Nunes, T. Children’s Understanding of Probability. A Literature Review; Nuffield Foundation: London, UK, 2012. [Google Scholar]
  18. Frye, D.; Baroody, A.J.; Burchinal, M.; Carver, S.M.; Jordan, N.C.; McDowell, J. Teaching Math to Young Children: A Practice Guide (NCEE 2014-4005); National Center for Education, Evaluation and Regional Assistance: Washington, DC, USA; Institute of Education Sciences: Washington, DC, USA; U.S. Department of Education: Washington, DC, USA, 2013. [Google Scholar]
  19. Jones, G.A. (Ed.) Exploring Probability in School. Challenges for Teaching and Learning; Springer: Berlin/Heidelberg, Germany, 2005. [Google Scholar]
  20. NCTM. Principios y Estándares Para la Educación Matemática; Thales: La Défense, France, 2003. [Google Scholar]
  21. Nunes, T.; Bryant, P.; Evans, D.; Gottardis, L.; Terlektsi, M.-E. Teaching Mathematical Reasoning: Probability and Problem Solving in Primary School; University of Oxford: Oxford, UK, 2015. [Google Scholar]
  22. Batanero, C.; Álvarez, Á.; Hernández, L.; Gea, M. El inicio del razonamiento probabilístico en educación infantil. PNA 2021, 15, 267–288. [Google Scholar] [CrossRef]
  23. Vásquez, C.; Alsina, Á.; Seckel, M.J.; García-Alonso, I. Integrating sustainability in mathematics education and statistics education: A systematic review. Eurasia J. Math. Sci. Technol. Educ. 2023, 19, em2357. [Google Scholar] [CrossRef]
  24. Semiz, G.K.; Baykal, I.I. Middle school pre- service mathematics teachers’ opinions related to mathematics education for sustainability. Eurasian J. Educ. Res. 2020, 20, 111–136. [Google Scholar] [CrossRef]
  25. Alsina, Á.; Mulà, I. Advancing towards a transformational professional competence model through reflective learning and sustainability: The case of mathematics teacher education. Sustainability 2019, 11, 4039. [Google Scholar] [CrossRef]
  26. Carrillo, J.; Climent, N.; Montes, M.; Contreras, L.; Flores, E.; Escudero, D.; Vasco, D.; Rojas, N.; Flores, P.; Aguilar-González, Á.; et al. The mathematics teacher’s specialised knowledge (MTSK) model. Res. Math. Educ. 2018, 20, 236–253. [Google Scholar] [CrossRef]
  27. Alsina, Á. A Abordagem dos Itinerários do Ensino da Matemática: Por quê?, Por quê? E como aplicá-lo na sala de aula? TANGRAM-Rev. De Educ. Matemática 2020, 3, 127–158. [Google Scholar] [CrossRef]
  28. Shulman, L. Those Who Understand: Knowledge Growth in Teaching. Educ. Res. 1986, 15, 4–14. [Google Scholar] [CrossRef]
  29. Ball, D.; Thames, M.H.; Phelps, G. Content knowledge for teaching: What makes it special? J. Teach. Educ. 2008, 59, 389–407. [Google Scholar] [CrossRef]
  30. Godino, J.D.; Giacomone, B.; Batanero, C.; Font, V. Enfoque ontosemiótico de los conocimientos y competencias del profesor de matemáticas. Bolema Bol. De Educ. Matemática 2017, 31, 90–113. [Google Scholar] [CrossRef]
  31. Carrillo, J.; Climent, N.; Contreras, L.C.; Catalán, M.C. Determining Specialised Knowledge for Mathematics. In Proceedings of the Eighth Congress of European Research in Mathematics Education, Antalya, Turkey, 6–10 February 2013; Ubuz, B., Haser, Ç., Mariotti, M., Eds.; Middle East Technical University and ERME: Ankara, Turkey, 2013; pp. 2985–2994. [Google Scholar]
  32. Escudero, D.; Flores, E.; Carrillo, J. El conocimiento especializado del profesor de matemáticas. In Report of the 15th Winter School in Educational Mathematics; Landy, S., Eddie, A., Flor, R., Eds.; Ciudad de México: Red Cimates: Hague, The Netherlands, 2012; pp. 35–42. [Google Scholar]
  33. Flores-Medrano, E.; Escudero-Avila, D.I.; Aguilar-González, Á. Oportunidades que brindan algunos escenarios para mostrar evidencias del MTSK. In Investigación en Educación Matemática XVII; Berciano, A., Gutie, G., Estepay, A., Climent, N., Eds.; SEIEM: Santiago Tlaxomulco, Mexico, 2013; pp. 275–282. [Google Scholar]
  34. Montes, M.A.; Contreras, L.C.; Carrillo, J. Conocimiento del profesor de matemáticas: Enfoques del MKT y del MTSK. In Investigación en Educación Matemática XVII; Berciano, A., Gutie, G., Estepa, A., Climent, N., Eds.; SEIEM: Santiago Tlaxomulco, Mexico, 2013; pp. 403–410. [Google Scholar] [CrossRef]
  35. Carrillo, J.; Montes, M.A.; Contreras, L.C.; Climent, N. Les connaissances du professeur dans une perspective basée sur leur spécialisation: MTSK. Ann. Didact. Sci. Cogn. 2017, 22, 185–205. [Google Scholar] [CrossRef]
  36. Clark, L.M.; DePiper, J.N.; Frank, T.J.; Nishio, M.; Campbell, P.F.; Smith, T.M.; Griffin, M.J.; Rust, A.H.; Conant, D.L.; Choi, Y. Teacher characteristics associated with mathematics teachers’ beliefs and awareness of their students’ mathematical dispositions. J. Res. Math. Educ. 2014, 45, 246–284. [Google Scholar] [CrossRef]
  37. Vygotsky, L.S. Mind in Society. In The Development of Higher Psychological Processes; Harvard University Press: Cambridge, MA, USA, 1978. [Google Scholar]
  38. Tigchelaar, A.; Melief, K.; Van Rijswijk, M.; Korthagen, K. Elementos de una posible estructura del aprendizaje realista en la formación inicial y permanente del profesorado. In Creando mi Profesión. Una Propuesta Para el Desarrollo Profesional del Profesorado; Esteve, O., Melief, K., Alsina, Á., Eds.; Octaedro: Barcelona, Spain, 2010; pp. 39–64. [Google Scholar]
  39. Freudenthal, H. Revisiting Mathematics Education; Kluwer Academic Publishers: Norwell, MA, USA, 1991. [Google Scholar]
  40. Comisión Mundial del Medio Ambiente y del Desarrollo. CMMAD. In Nuestro Futuro Común; Alianza: Pleasant Grove, UT, USA, 1987. [Google Scholar]
  41. UNESCO. Educación Para los Objetivos de Desarrollo Sostenible: Objetivos de Aprendizaje; United Nations Educational, Scientific and Cultural Organization: Paris, France, 2017. [Google Scholar]
  42. Stibbe, A. The Handbook of Sustainability Literacy: Skills for a Changing World; Green Books: Newark, NJ, USA, 2009. [Google Scholar]
  43. Creswell, J.W. Research Design: Qualitative, Quantitative, and Mixed Methods Approaches, 4th ed.; Sage Publications: Thousand Oaks, CA, USA, 2014. [Google Scholar]
  44. Franco, J.; Alsina, Á. Evaluando el conocimiento especializado para enseñar estadística y probabilidad: Elaboración y validación del Cuestionario MTSK-estocástico. Uniciencia 2023, 37, 84–105. [Google Scholar] [CrossRef]
  45. Korthagen, F.A. Linking practice and theory. In The Pedagogy of Realistic Teacher Education; Lawrence Erlbaum Associates: Mahwah, NJ, USA, 2001. [Google Scholar]
  46. Gal, I. Adults’ Statistical literacy: Meanings, components, responsibilities. Int. Stat. Rev. 2002, 70, 1–25. [Google Scholar] [CrossRef]
  47. Batanero, C. Retos para la formación estadística de los profesores. II Encontro de Probabilidade e Estatística na Scola 2009, 1–24. Available online: https://www.researchgate.net/publication/257295767_retos_para_la_formacion_estadistica_de_los_profesores (accessed on 6 October 2023).
  48. Batanero, C.; Díaz, C.; Contreras, J.M.; Arteaga, P. Enseñanza de la estadística a través de proyectos. In Estadística con Proyectos; Universidad de Granada: Granada, Spain, 2011; pp. 9–46. Available online: https://www.ugr.es/~batanero/pages/ARTICULOS/Libroproyectos.pdf (accessed on 3 October 2023).
  49. Hahn, C. La recherche internationale en éducation statistique: État des lieux et questions vives. Statistique et Enseignement 2015, 6, 25–39. [Google Scholar]
  50. Pratt, D.; Davies, N.; Connor, N. The role of technology in teaching and learning statistics. In Teaching Statistics in School Mathematics-Challenges for Teaching and Teacher Education; Batanero, C., Burrill, G., Reading, C., Eds.; Springer: Berlin/Heidelberg, Germany, 2011; pp. 97–107. [Google Scholar]
  51. Nolan, V.T.; Swart, A.J. Undergraduate student perceptions regarding the use of educational technology—A case study in a statistics service course. Eurasia J. Math. Sci. Technol. Educ. 2015, 11, 505–513. [Google Scholar]
  52. Batanero, C. Thirty years of stochastics education research: Reflections and Challenges. In Proceedings of the Third International Virtual Congress on Statistical Education; Contreras, J.M., Gea, M., López-Martín, M.M., Molina-Portillo, E., Eds.; 2019; pp. 1–15. Available online: https://www.ugr.es/~fqm126/civeest/ponencias/batanero_ing.pdf (accessed on 5 October 2023).
  53. Franklin, C.; Mewborn, D. The statistical education of PreK-12 teachers: A shared responsibility. In NCTM 2006 Yearbook: Thinking and Reasoning with Data and Chance; Burrill, G., Ed.; NCTM: Reston, VA, USA, 2006; pp. 335–344. [Google Scholar]
  54. Ruiz, B.; Arteaga, P.; Batanero, C. Comparación de distribuciones, Una actividad sencilla para los futuros profesores. In Paper Presented at the II Encontro de Probabilidade e Estadística na Escola; Universidade do Minho: Braga, Portugal, 2009. [Google Scholar]
  55. Batanero, C. Didáctica de la Estadística; Grupo de Investigación en Educación Estadística, 2001. Available online: http://www.ugr.es/local/batanero (accessed on 7 October 2023).
  56. Gómez, E.; Ortiz, J.J.; Batanero, C.; Contreras, J.M. El lenguaje de probabilidad en los libros de texto de Educación Primaria. UNIÓN. Rev. Iberoam. De Educ. Matemática 2013, 35, 75–91. [Google Scholar]
  57. Sánchez-Cobo, F.T. Análisis de la Exposición Teórica y de Los Ejercicios de Correlación y Regresión en Los Textos de Bachillerato; Third Cycle Report; Universidad de Granada: Granada, Spain, 1996. [Google Scholar]
  58. Ortiz de Haro, J.J. Significado de Conceptos Probabilísticos en los Textos de Bachillerato. Ph.D. Thesis, Departamento de Didáctica de la Matemática, Universidad de Granada, Granada, Spain, 1999. [Google Scholar]
Figure 1. Sample EDS questionnaire items.
Sustainability 16 00692 g001
Figure 2. Total scores of the MTSK-Stochastic Statistics Questionnaire.
Sustainability 16 00692 g002
Figure 3. Distribution of the different types of answers according to the degree of correctness for each of the subdomains of the MTSK model.
Sustainability 16 00692 g003
Figure 4. Distribution of the different types of answers according to the degree of correctness for each teaching context of the MTIA.
Sustainability 16 00692 g004
Figure 5. Distribution of scores according to the teaching contexts proposed by the MTIA.
Sustainability 16 00692 g005
Figure 6. Resources arranged by whether or not they can be used in education for sustainable development.
Sustainability 16 00692 g006
Figure 7. Total score—adequacy of contexts for working on education for sustainable development.
Sustainability 16 00692 g007
Figure 8. Resources (e.g., real contexts, manipulatives, games, technological resources, and graphic resources) that teachers feel most confident using to teach statistics.
Sustainability 16 00692 g008
Table 1. Links between the items of the MTSK-Stochastic Statistics Questionnaire with the subdomains of the MTSK model and the contexts of the MTIA [44]. Reprinted with permission from the authors of [44]. 2023, CC: BY-NC-ND.
Contexts/
Subdomains
Real ContextsManipulativesGamesTechnological ResourcesGraphical Resources
KoT1(a) 3(a)4(a)5(b)
KSM1(a) y 1(d) 3(a) y 3(d)4(a)5(b)
KMT1(c)2(b)3(c)4(d)5(d)
KFLM1(b)2(a)3(a) y 3(b)4(a) y 4(b)5(a) y 5(c)
KMLS1(a), 1(c) y 1(d)2(c)3(d) y 3(e)4(c)5(e)
Table 2. Multiple linear regression analysis.
Coefficients a
Standardized Coefficients
Beta
Sig.
Real_contexts0.220<0.001
Manipulatives_resources0.239<0.001
Games0.444<0.001
Technology_resources0.336<0.001
Graphic_resources0.421<0.001
a: Dependent variable: final score.
Disclaimer/Publisher’s Note: The statements, opinions and data contained in all publications are solely those of the individual author(s) and contributor(s) and not of MDPI and/or the editor(s). MDPI and/or the editor(s) disclaim responsibility for any injury to people or property resulting from any ideas, methods, instructions or products referred to in the content.

