Abstract
Campus green space, as a component of urban green space and the main natural place for college students’ daily contact, has a subliminal effect on their mental health. This study aims to investigate the degree of influence of campus green space on college students’ emotions as well as the main indicators of influence and other scientific issues. Taking the campus green spaces of 44 college campuses in Nanjing as the object of the study, with the help of social media data to research the issue of green spaces and emotional preference, we conducted a difference analysis, constructed an individual-time, double fixed-effects regression model and obtained the corresponding results: (1) significant seasonal and individual differences existed in all green space indicators across the 44 campuses; (2) a significant positive correlation existed between each of the campus green space indicators and college students’ positive emotions; (3) compared with the regression results of the data prior to the New Crown Pneumonia Outbreak (COVID-19), college students’ green sensitivity increased substantially during the outbreak control period, and the health benefits of the campus green spaces were more significant.
1. Introduction
Green spaces can improve human health and provide many health benefits [1,2], mainly by promoting physical activity [3], reducing mental stress [4], and encouraging social interaction [5]. In the field of environmental psychology, green spaces can improve people’s negative emotions, relieve stress, and improve mental health [6,7]. With certain positive factors in the environment, people can enjoy a good restorative experience, prompting them to recover more quickly from a state of fatigue and stress; conversely, the opposite may increase the degree of negativity and cause a greater burden on the psyche. Therefore, researchers have long recognized the health benefits of urban green spaces [8,9].
As the material place of higher education, colleges and universities are spatial environments with which teachers and students frequently come into contact for a long time, and they serve multiple functions, such as living, studying, and working. Since it was first proposed, the Green Campus concept has continued to evolve and improve, guided not only by the theory of sustainability in the construction and operation of campus facilities but also by the integration of green concepts and technologies into campus site planning and building design [10], which plays a pivotal role in guiding the process of promoting the development of campuses. Campus green space, as an important part of urban green space, is not only a basic means to accelerate the construction of green campuses [11,12] but also a second natural place to provide leisure activities; it can provide many benefits to students, and a systematic evaluation has summarized the evidence linking green spaces to adolescent mental health, with adolescents’ regular exposure to green spaces helping to reduce stress, decrease depressive symptoms, alleviate psychological distress, enhance positive emotions, and increase well-being, comprehensively demonstrating the potential contribution of campus green spaces [13]. Therefore, how to plan and design campus green space to enhance its vitality and attractiveness has become a crucial and meaningful topic for the implementation of green campuses.
As the application of big data technology in sustainable urban development is becoming increasingly mature, scholars continue to conduct research in the fields of urban planning, transportation management, and smart tourism [14,15,16,17,18,19,20,21,22]. In recent years, as a hotspot in the discipline of urban planning, planning methods based on big data technology have yielded many research results both at home and abroad [23,24,25]; however, their research and practical application in green spaces have just begun. Existing research shows that with the improvement in big data-mining technology and an increase in access channels, multi-source big data present a powerful aid to the development of green spaces [26,27], and social media data (SMD) research [28] has now become one of the most popular forms of data in green space research. With the rise of the Internet era, many people tend to publicly post various types of information on social media, and scholars can place the tagged information on a map to locate and then analyze it in combination with the surrounding environment [29,30,31,32]. Considering the importance and feasibility of social media data, it is necessary to widely apply them to study the health benefits of urban environments [33,34]—especially green spaces.
While many studies have investigated the beneficial effects of green spaces on different social groups [35,36], including adolescents and young adults [37,38,39], few scholars have specifically focused on the college student population. This study explores the emotional health benefits of campus green spaces from the perspective of this important group of college students. Not only do we fully consider the influencing factors of campus green space with the help of remote sensing satellites and online street-view platforms [40,41,42,43], but we also combine social media data as a relatively objective and effective method of emotional evaluation, while simultaneously considering the differences in the influence of campus green space on students’ emotions in the context of space, time, and epidemics.
This study aims to explore the impact of campus green space on students’ emotions, learn how to link campus green space with college students’ mental health and maximize its benefits, provide a more scientific basis for the planning and design of green campuses, enhance college students’ sense of well-being, and improve mental health problems. Based on this, the specific scientific issues explored in this paper are as follows:
(1) Is there an association between green space on college campuses and positive emotions among college students?
(2) What is the extent of the influence of campus green space on college students’ positive emotions? Which indicator has the most significant impact?
(3) Longitudinally comparing the time before COVID-19 and during the prevention and control period, does any change occur in the benefits of campus green space on the positive emotions of college students?
Based on the research on the above scientific issues, the theory is applied to guide practice, clarify the deficiencies of campus green space planning in Nanjing colleges and universities, and guide professionals to enhance campus green space in the future with the help of quantitative scientific data indexes, so as to promote the development of campus green space in a healthy direction.
2. Methods
2.1. Study Area and Pathways
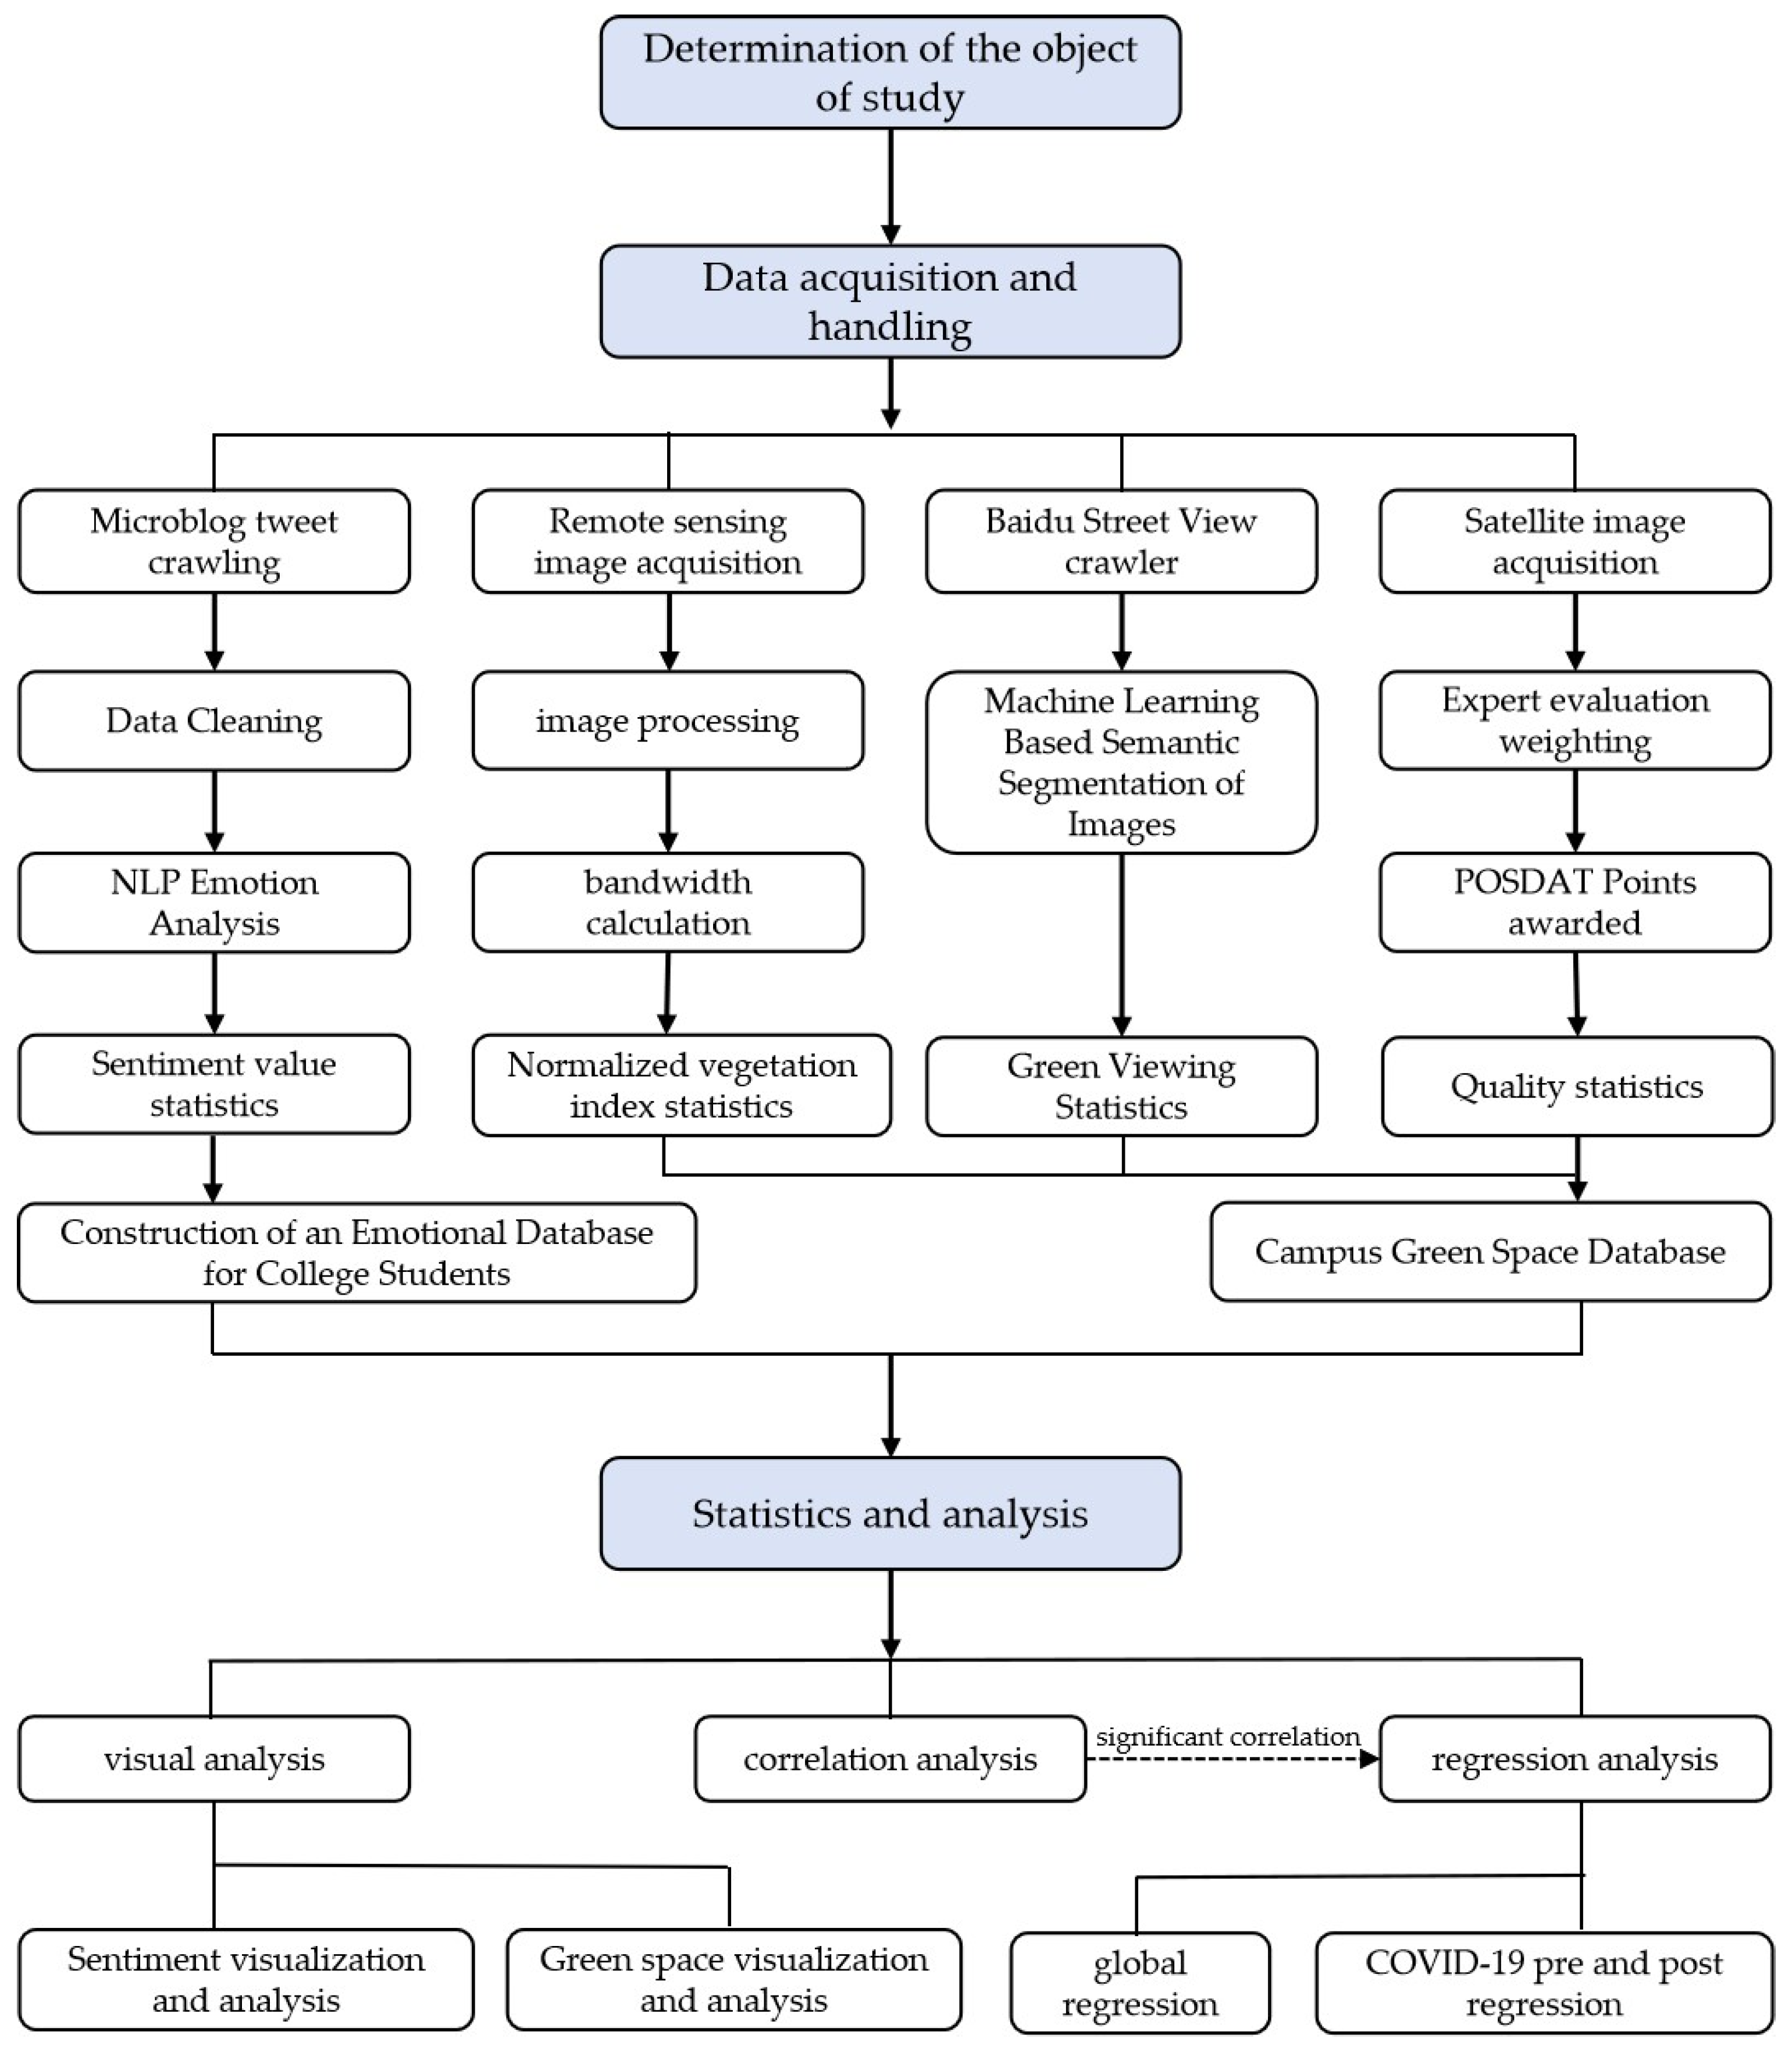
The research path of this study specifically consists of three aspects: identifying the object of study, data acquisition and processing, and statistical relationship resolution. The flowchart is shown in Figure 1.
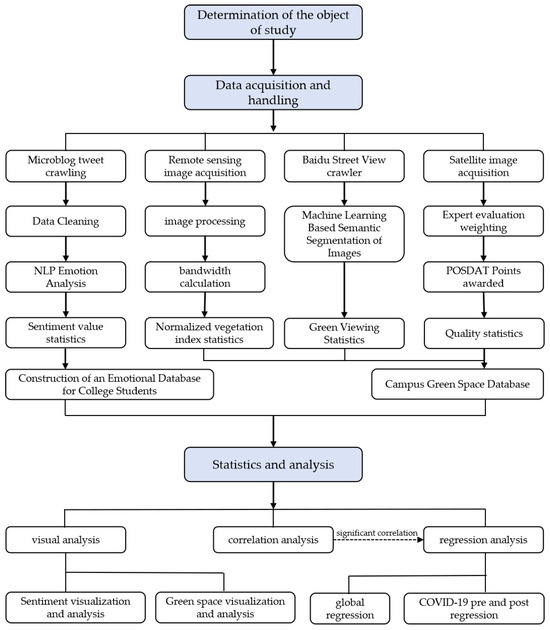
Figure 1.
Flowchart of the research process.
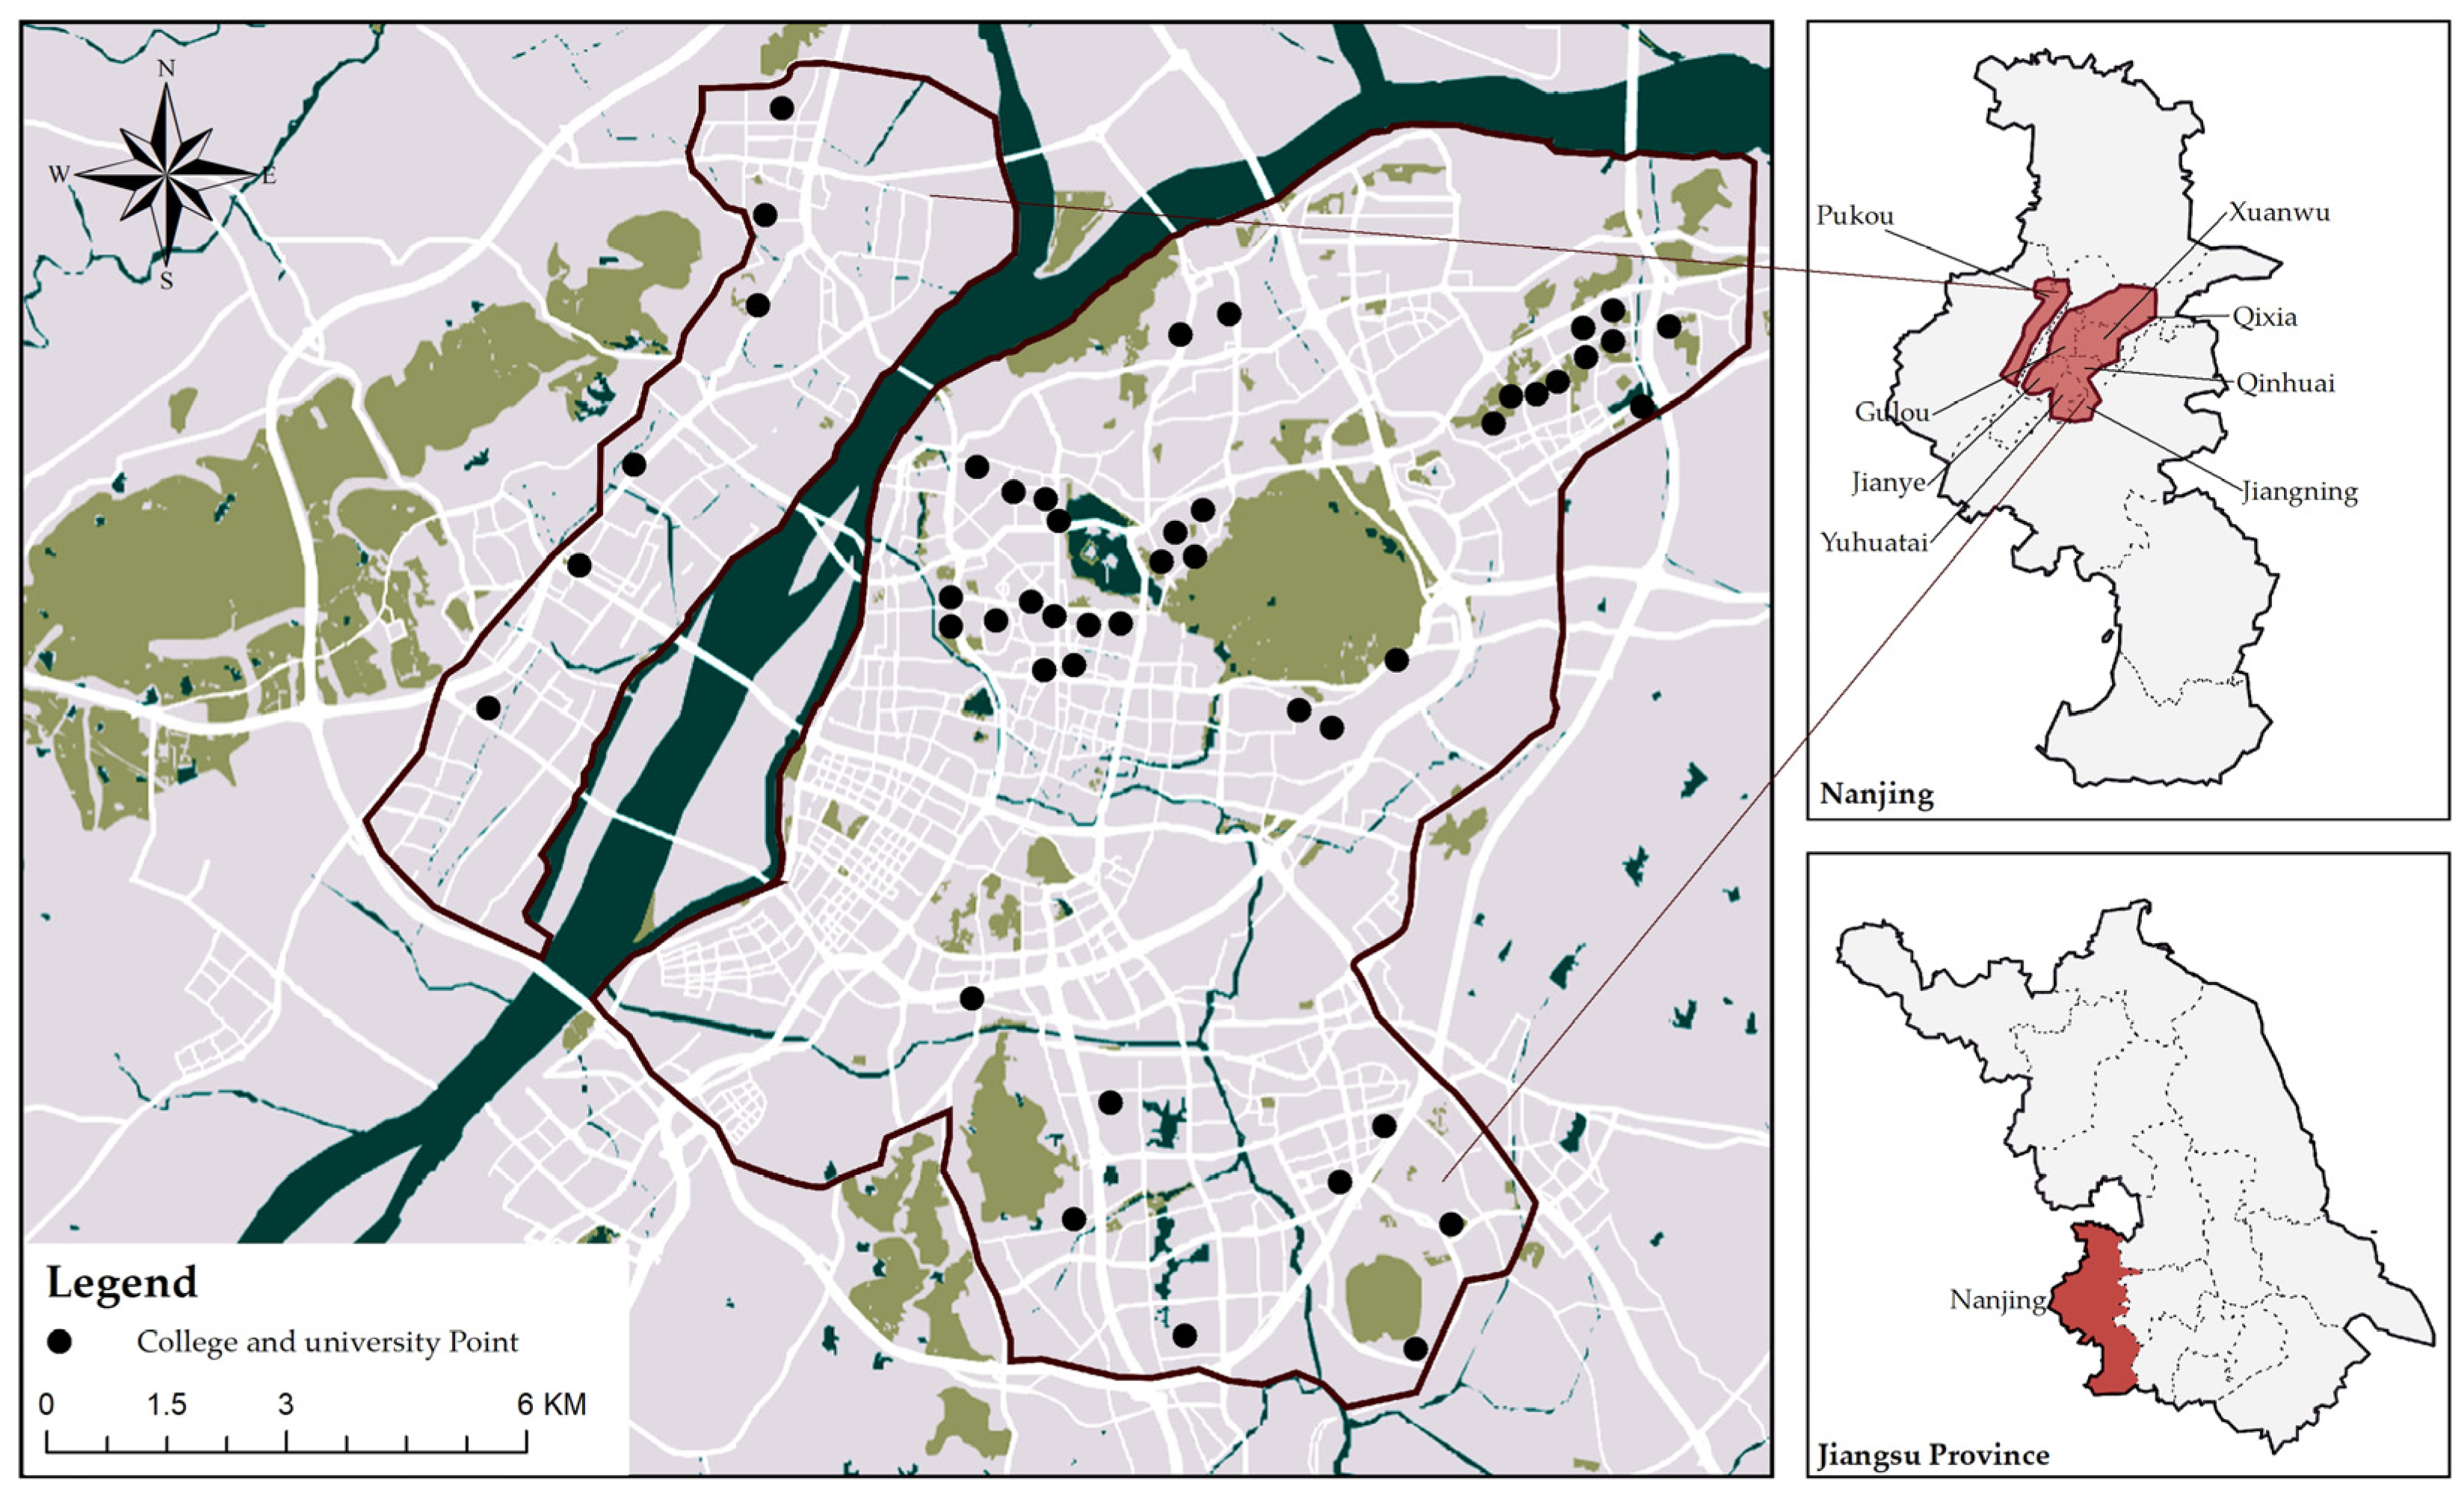
Nanjing, the capital and megacity of Jiangsu Province, China, has a population of approximately 8 million and an area of about 6600 square kilometers. It is one of the most important cities in the Yangtze River Delta from economic, cultural, and historical perspectives and one of the three major centers of higher education in the country, with a concentration of higher education resources ranking in the top five in the country and a comprehensive strength in science and education—the third largest in China. According to the 2021 Statistical Yearbook of Jiangsu Province, there are currently 51 higher education institutions of various types in Nanjing that are rapidly developing, with a large number of college students enrolled. From 2005 to 2020, Nanjing’s urban greening level has grown rapidly, far exceeding the country’s average level; moreover, the growth rate of park greening per capita in Nanjing is also much higher than the average level in China. As part of Nanjing’s urban green space, campus green space is worthy of exploration and analysis. Based on the above information, we took the campus green space of Nanjing colleges and universities as the research object and 44 campuses of 34 colleges and universities as the research samples (Figure 2).
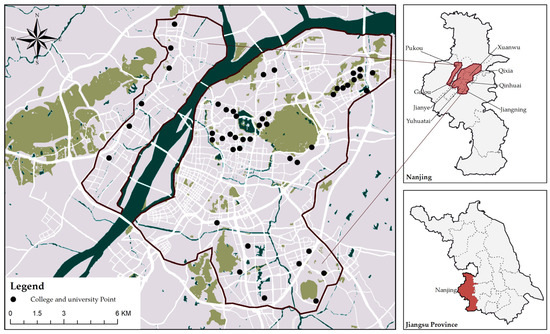
Figure 2.
Distribution of 44 campuses.
2.2. Green Space Databases
2.2.1. Normalized Difference Vegetation Index (NDVI) Acquisition Processing
In this study, we selected Sentinel-2A remote sensing satellite images as the data source of NDVI. Remote sensing images of Nanjing in four seasons from 2018 to 2021 were selected as the main data source, and five images were spliced in each season to cover the whole study area; the imaging times of the screened images were 07 May 2019, 10 August 2019, 16 October 2020, and 07 February 2021, respectively. We processed the collected remote sensing images, imported them into the vector file of Nanjing administrative boundaries, converted them into projections to make the projection consistent with that of the remote sensing images, cropped them to obtain remote sensing images containing all study campuses, and finally analyzed them to obtain the NDVI.
2.2.2. Green View Index (GVI) Acquisition Processing
In the study of campus green space and college students’ positive emotions, Green View Index (GVI), as a highly correlated and interpretable data indicator, well reflects the actual exposure of students to green space aspects.
Data acquisition and processing steps: Firstly, to determine the set of observation points, we used the BIGEMAP map downloader to obtain the vector road network of Nanjing city, combined it with the boundaries of each campus, cropped it to obtain the vector road network data of each university campus under study, and deleted the invalid and repetitive road network through preprocessing. Subsequently, we divided the vector road network into 10 m intervals; all the intermittent points obtained from the segmentation process were the set of observation points, and we selected Baidu Street View map as the basic data source for image acquisition. Finally, we obtained 16,219 observation points in 44 campuses and 84,486 street-view images in four seasons. We used a machine learning algorithm (FCN-8s) to semantically segment the street-view images and obtain the green visual index (GVI’) of a single observation point. Examples of green visual index data summaries on campuses are shown in the Supplementary Materials (Table S1).
2.2.3. Green Space Quality Data Acquisition and Processing
We used the quality level of accessible green space to study campus green space quality. We classified green space types, identified them by satellite images and street-view images, and labeled them in ArcGIS for all campuses’ accessible green spaces in the study area. We utilized Public Open Space Desktop Auditing Tool (POSDAT) to remotely identify green space information and assess its quality. Examples of the classification and definition of campus green space types are shown in the Supplementary Materials (Table S2).
Acquisition of quality data sources: After clarifying the location and detailed image data of the accessible green space on each university campus, we used the adapted POSDAT to evaluate its quality. First of all, we opened the corresponding layer in ArcGIS and complete the basic information entry in POSDAT; then, in ArcGIS, we compared it with the satellite image map and vector map of Nanjing and combined it with the information of network data and street maps, etc., and we assigned the value of each accessible green space in each campus item by item. If the corresponding option existed, it was assigned as “1”, and if it did not exist, it was assigned as “0”, and the result was entered into ArcGIS to obtain the rating table of each accessible green space, which was used as the initial statistical data of the quality of campus green space.
Processing of quality data: We conducted hierarchical analysis to construct an evaluation index system for the adapted POSDAT content and distributed a questionnaire on the indexes’ weights to various experts in related professional fields. These included five teachers from the discipline of landscape architecture, three teachers from the discipline of urban and rural planning, ten landscape architects, five architectural designers, and seven staff members from the logistics management office of the university, for a total of thirty experts who scored the weights of the indicators for evaluating the quality of accessible green space on campus. Then, we calculated the results of the experts’ weights for the evaluation system of the quality indexes of campuses’ accessible green spaces. We calculated the weighted average of all results to find the final weight value of the indicator evaluation system, as shown in Table 1.

Table 1.
Weight evaluation of campus accessible green space quality index.
Green space quality was calculated by combining the initial data on the quality of each accessible green space with the weights for a weighted analysis and then summing to obtain the final quality score for a single accessible green space. The formula is as follows:
where Att is the quality score of each accessible green space, Aj is the binary indicator (0,1) of the jth attribute, and ωj is the weight of the jth attribute.
Finally, the quality of all accessible green spaces in each campus was calculated as a weighted average, and the result obtained was the final green space quality score of each campus. The results were normalized for scientific statistics.
2.3. Emotion Database
Social media data (SMD) is now one of the most popular forms of data used in green space research. Along with the rise of the Internet era, many people tend to publicly post various information on social media, in which social media data with emotional information such as pictures, comments, thoughts, travelogues, and so on, have been emphasized by researchers, and it is possible to analyze emotions based on social media data so as to mine a large amount of implicit information related to mental health. And as a mainstream social media platform in China, Weibo has a large number of user groups. Considering the openness and richness of social media platforms and their close integration with mobile devices, this article chose Sina Weibo as a channel for obtaining college students’ emotional data.
The data on Sina Weibo are characterized by the advantages of typicality, richness, and being open source [44,45,46]. Sina Weibo data mining mainly applies web-crawler technology equipped with Python and the Baidu coordinate picking system, and this study utilized Python for data crawling to obtain microblog text data. We focused on three aspects of data collection—data collection scope, data collection content, and data time span—during data collection, and finally crawled 544,603 microblog text data from 44 university campuses in Nanjing over 4 years.
We processed the acquired data and obtained 503,428 valid text data. Then, we selected the emotional tendency analysis function provided by the Baidu Intelligent Cloud Platform to analyze the emotions in the microblog text. The obtained text data were categorized by emotional polarity as negative, neutral, and positive, represented by values of 0, 1, and 2, respectively. The classification was based on the following criteria: less than 45% of the positive degree was negative, >55% was positive, and between the two was neutral. Then, using the Python program code, the data text that is needed to calculate the sentiment value was accessed by the sentiment analysis API provided by the Baidu Intelligent Cloud Platform. We obtained the corresponding positive degree, negative degree, and sentiment index for each tweet and finally classified the data by campus to obtain the positive, negative, and sentiment indexes of each school district as well as the average positive sentiment level of each campus, which reflected the level of positive sentiment of students on each campus. Examples of results of emotion analysis are shown in the Supplementary Materials (Table S3).
2.4. Control Variables
The control variables in this study included surface temperature, air quality conditions, and male-to-female ratio on each campus.
Surface temperature: Landsat 8 images with less than 5% cloudiness and clear images over the urban areas without thin cloud cover were selected from 12 August 2019, 01 November 2019, 20 February 2020, and 08 April 2020.
Air quality: In the software “Air Quality Release” launched by the China Environmental Monitoring General Station, the Python code was used to crawl the hourly air quality data of Nanjing city for the whole year of 2021. Then, Excel organized the data and calculated the average value of air quality of each monitoring point in each season, and the air quality condition of each campus in each season was the average value of air quality of each monitoring point in each season. The air quality condition of each campus in each season reflects the corresponding data of the neighboring monitoring points.
Gender Ratio: The gender ratio of each campus was determined by asking the student affairs office of each campus and checking the information available on the internet.
2.5. Statistical Analysis
2.5.1. Variability Analysis
Based on the previously constructed database, we explored the relationship between campus green space characteristics and college students’ positive emotions in Nanjing colleges and universities. We applied the natural breakpoint method in ArcGIS to form a visual legend for the green space indicators of each campus and conducted a difference analysis of the campus green space indicators. Further, we applied the microblogging sentiment data to generate a visual map and compared the differences in students’ sentiment under the background conditions before and after the spatial, temporal, and COVID-19 conditions. Then, we performed a difference analysis.
2.5.2. Correlation Test
To visualize the relationship between green space indicators and positive emotions of college students in 44 school districts as a whole, we used SPSS 26 statistical analysis software to draw scatter plots of relevant data, with NDVI, GVI, and green space quality as horizontal coordinates and the degree of positive emotions of college students as vertical coordinates.
On this basis, we used SPSS 26 to analyze the Pearson’s correlation between NDVI, GVI, green space quality, and college students’ positive emotions according to the scatter distribution pattern of the values of each index of the research object.
We chose a fixed-effects regression model—in other words, an individual-time, double fixed-effects regression model. Meanwhile, after the VIF test, we found no covariance among the three explanatory variables; thus, they could be put into the same regression model as follows:
where i denotes the school district and t denotes the season (spring, summer, fall, and winter); Emotionit denotes the mood index of school district i in season t; NDVIit is the green space normalized difference vegetation index of school district i in season t; GVIit is the green space green view index of school district i in season t; QUAit is the quality of the green space of school district i in season t; Cit includes all the explanatory variables related to the control variables (in this study, they are surface temperature, air quality, and gender ratio); α0 is the model intercept term; α1, α2, and α3 are expected to be positive and are the coefficients of the explanatory variables normalized difference vegetation index, green view index, and quality, respectively; α4 is the coefficient of the control variables; μi and φt denote the individual and time effects of the model’s presence, respectively; and ε0 denotes the disturbance term.
Emotionit = α0 + α1NDVIit + α2GVIit + α3QUAit + α4Cit + μi + φt + ε0
3. Results
3.1. Descriptive Statistical Analysis of Results
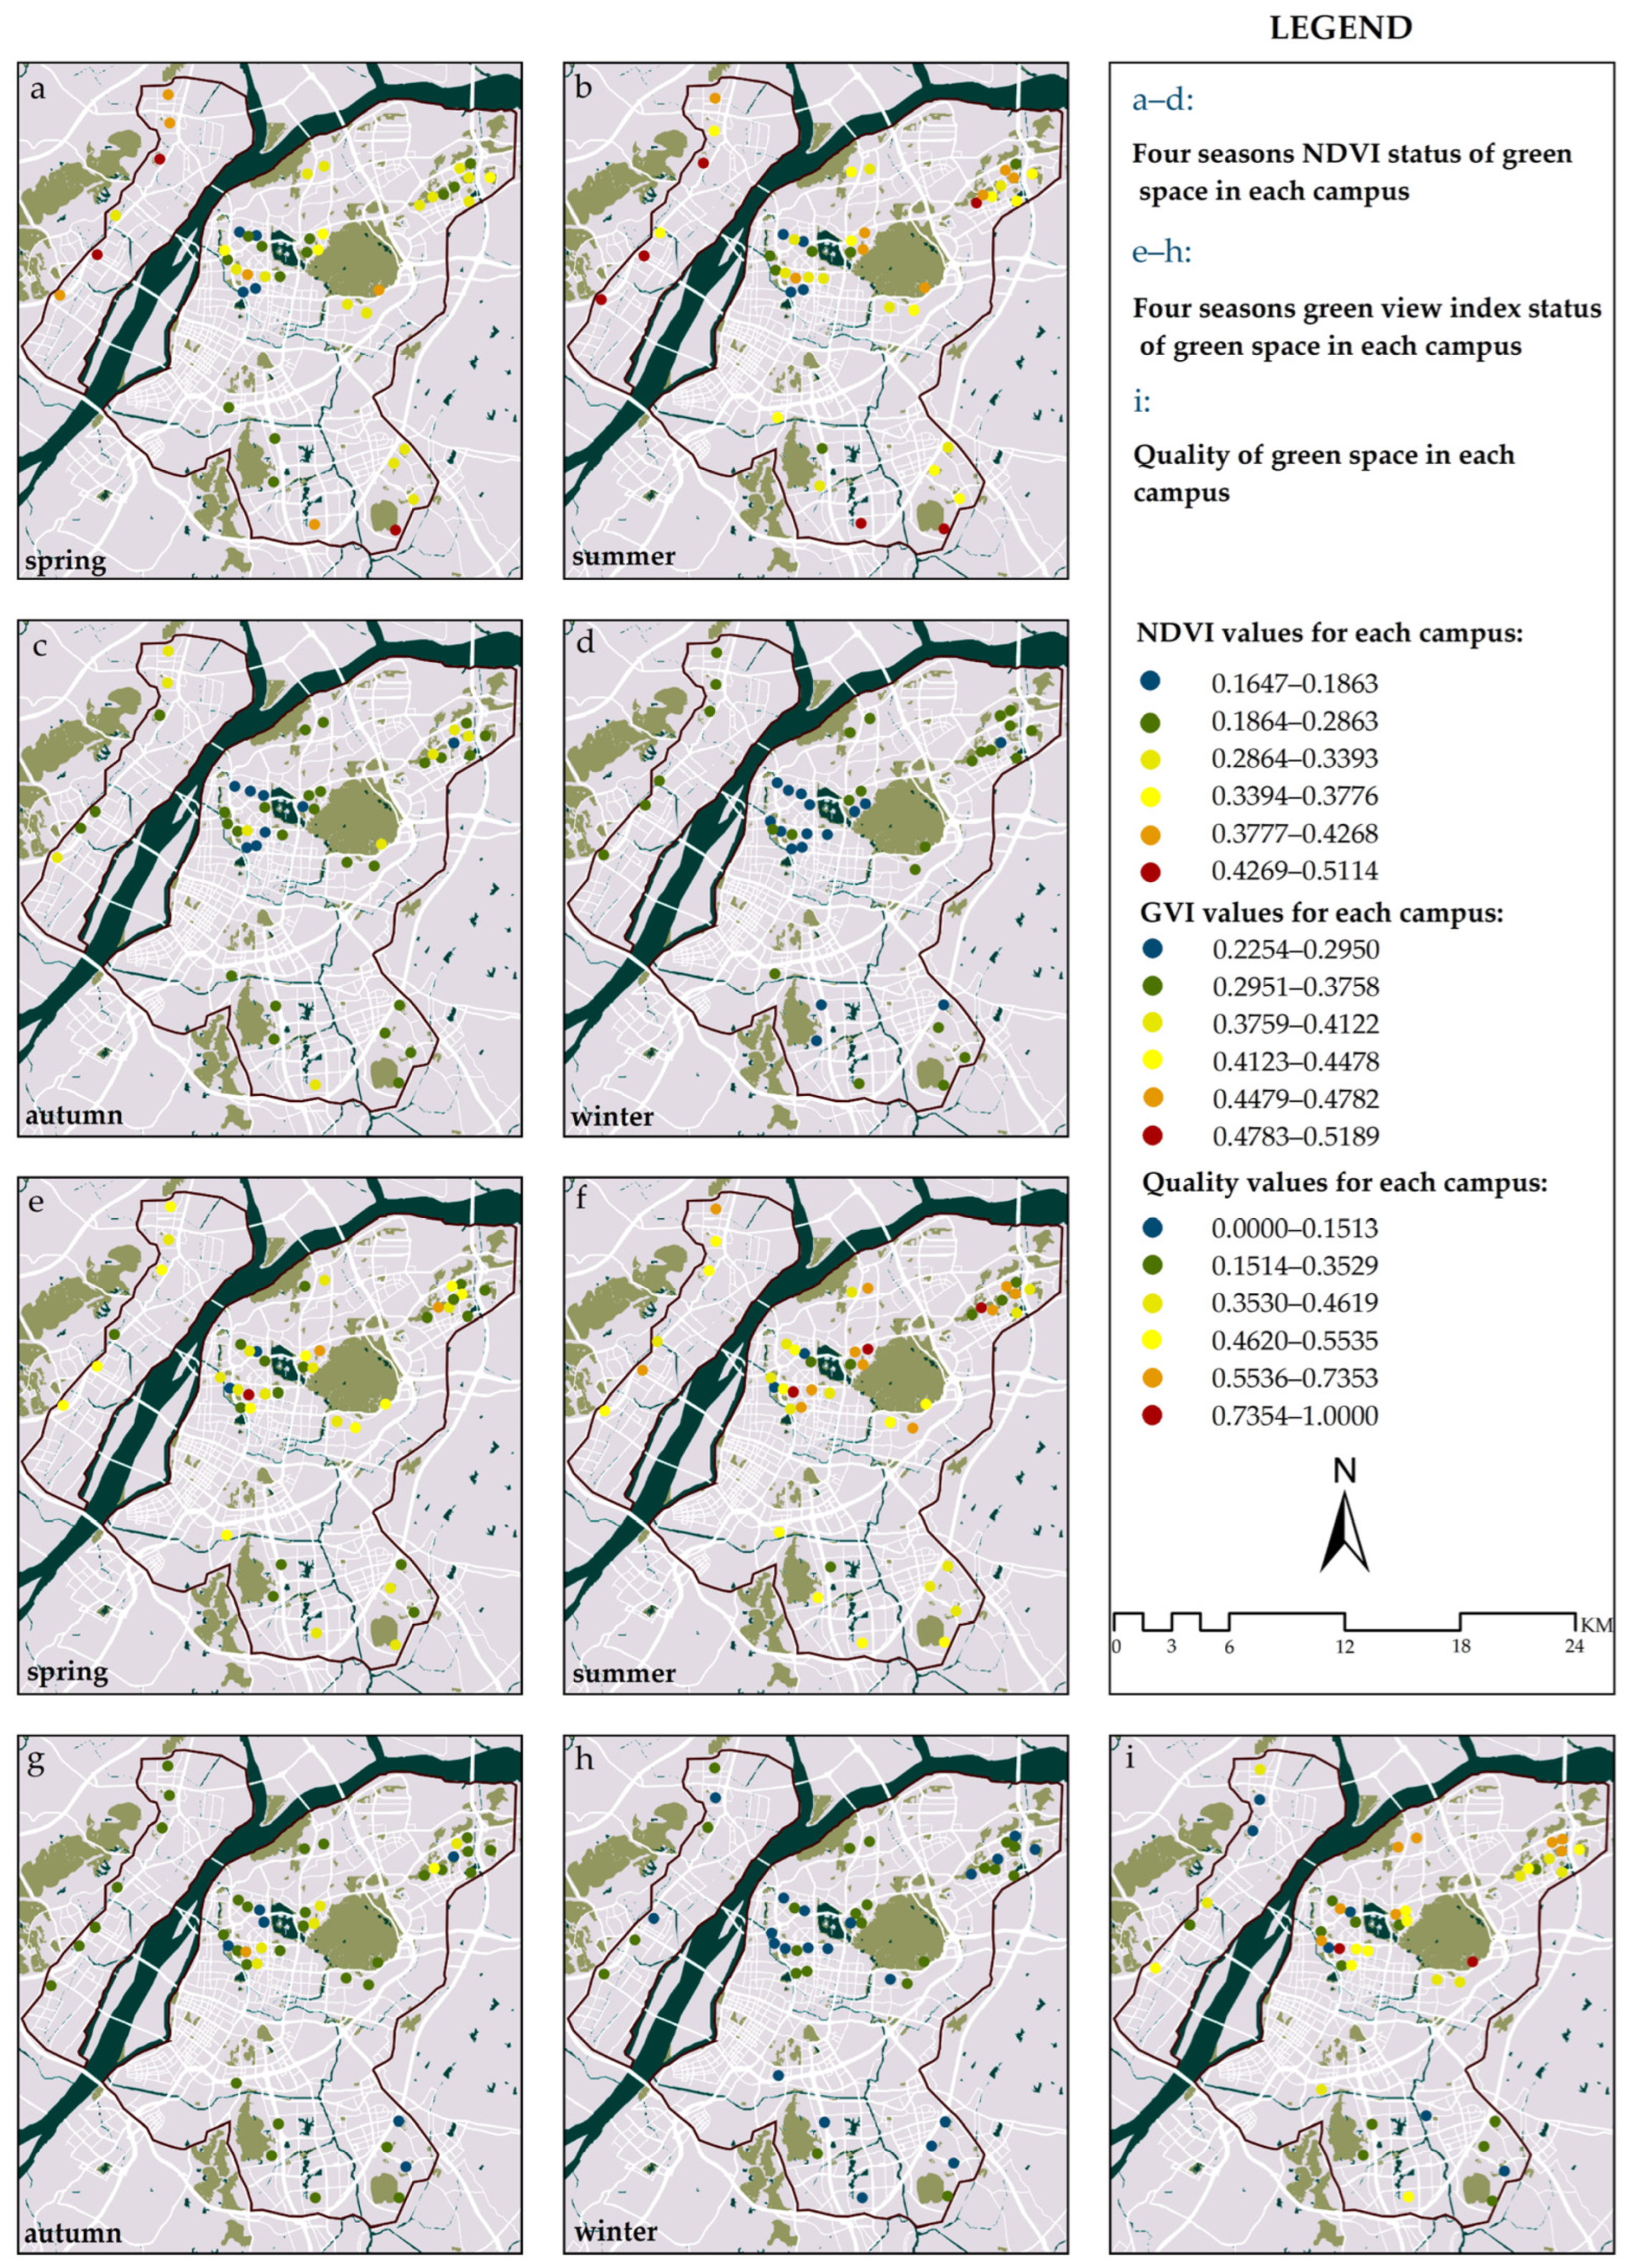
As shown in Table 2, the mean value of NDVI for each campus was 0.2717, the standard deviation was 0.0852, and the range interval was 0.0759–0.5114. In terms of temporal distribution, with regard to the scarcity of greenery in the fall and winter, the NDVI of each campus was significantly better than that of the fall and winter, with a large gap in the spring and summer (Figure 3a–d), and according to Statistical Table 2, the mean GVI of the 44 campuses was 35.80%, with a value range of 17.32–51.89%. In terms of time distribution, the GVI values of each campus were significantly higher in spring and summer than in fall and winter (Figure 3e–h); after normalization, the quality distribution of the 44 campuses was similar to that of the GVI, and the quality scores of the main university district were significantly higher than those of the peripheral university districts (Figure 3i).
Table 2.
Descriptive statistics of green space index of 44 campuses districts in Nanjing.
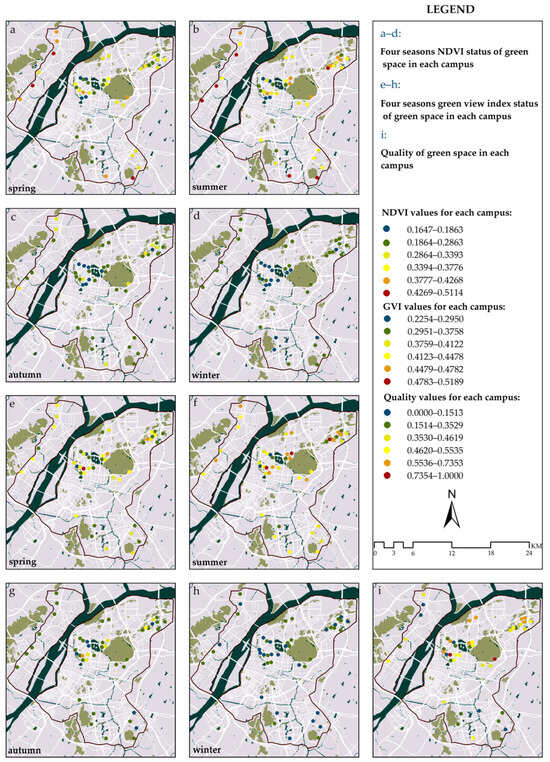
Figure 3.
Status of green space indicators by campus.
The visualization and analysis of NDVI, GVI, and quality of each campus show (Figure 3) that different indicators measure the green space of the same campus differently and that the results of the green space indicators under the overhead and human perspectives produce large differences.
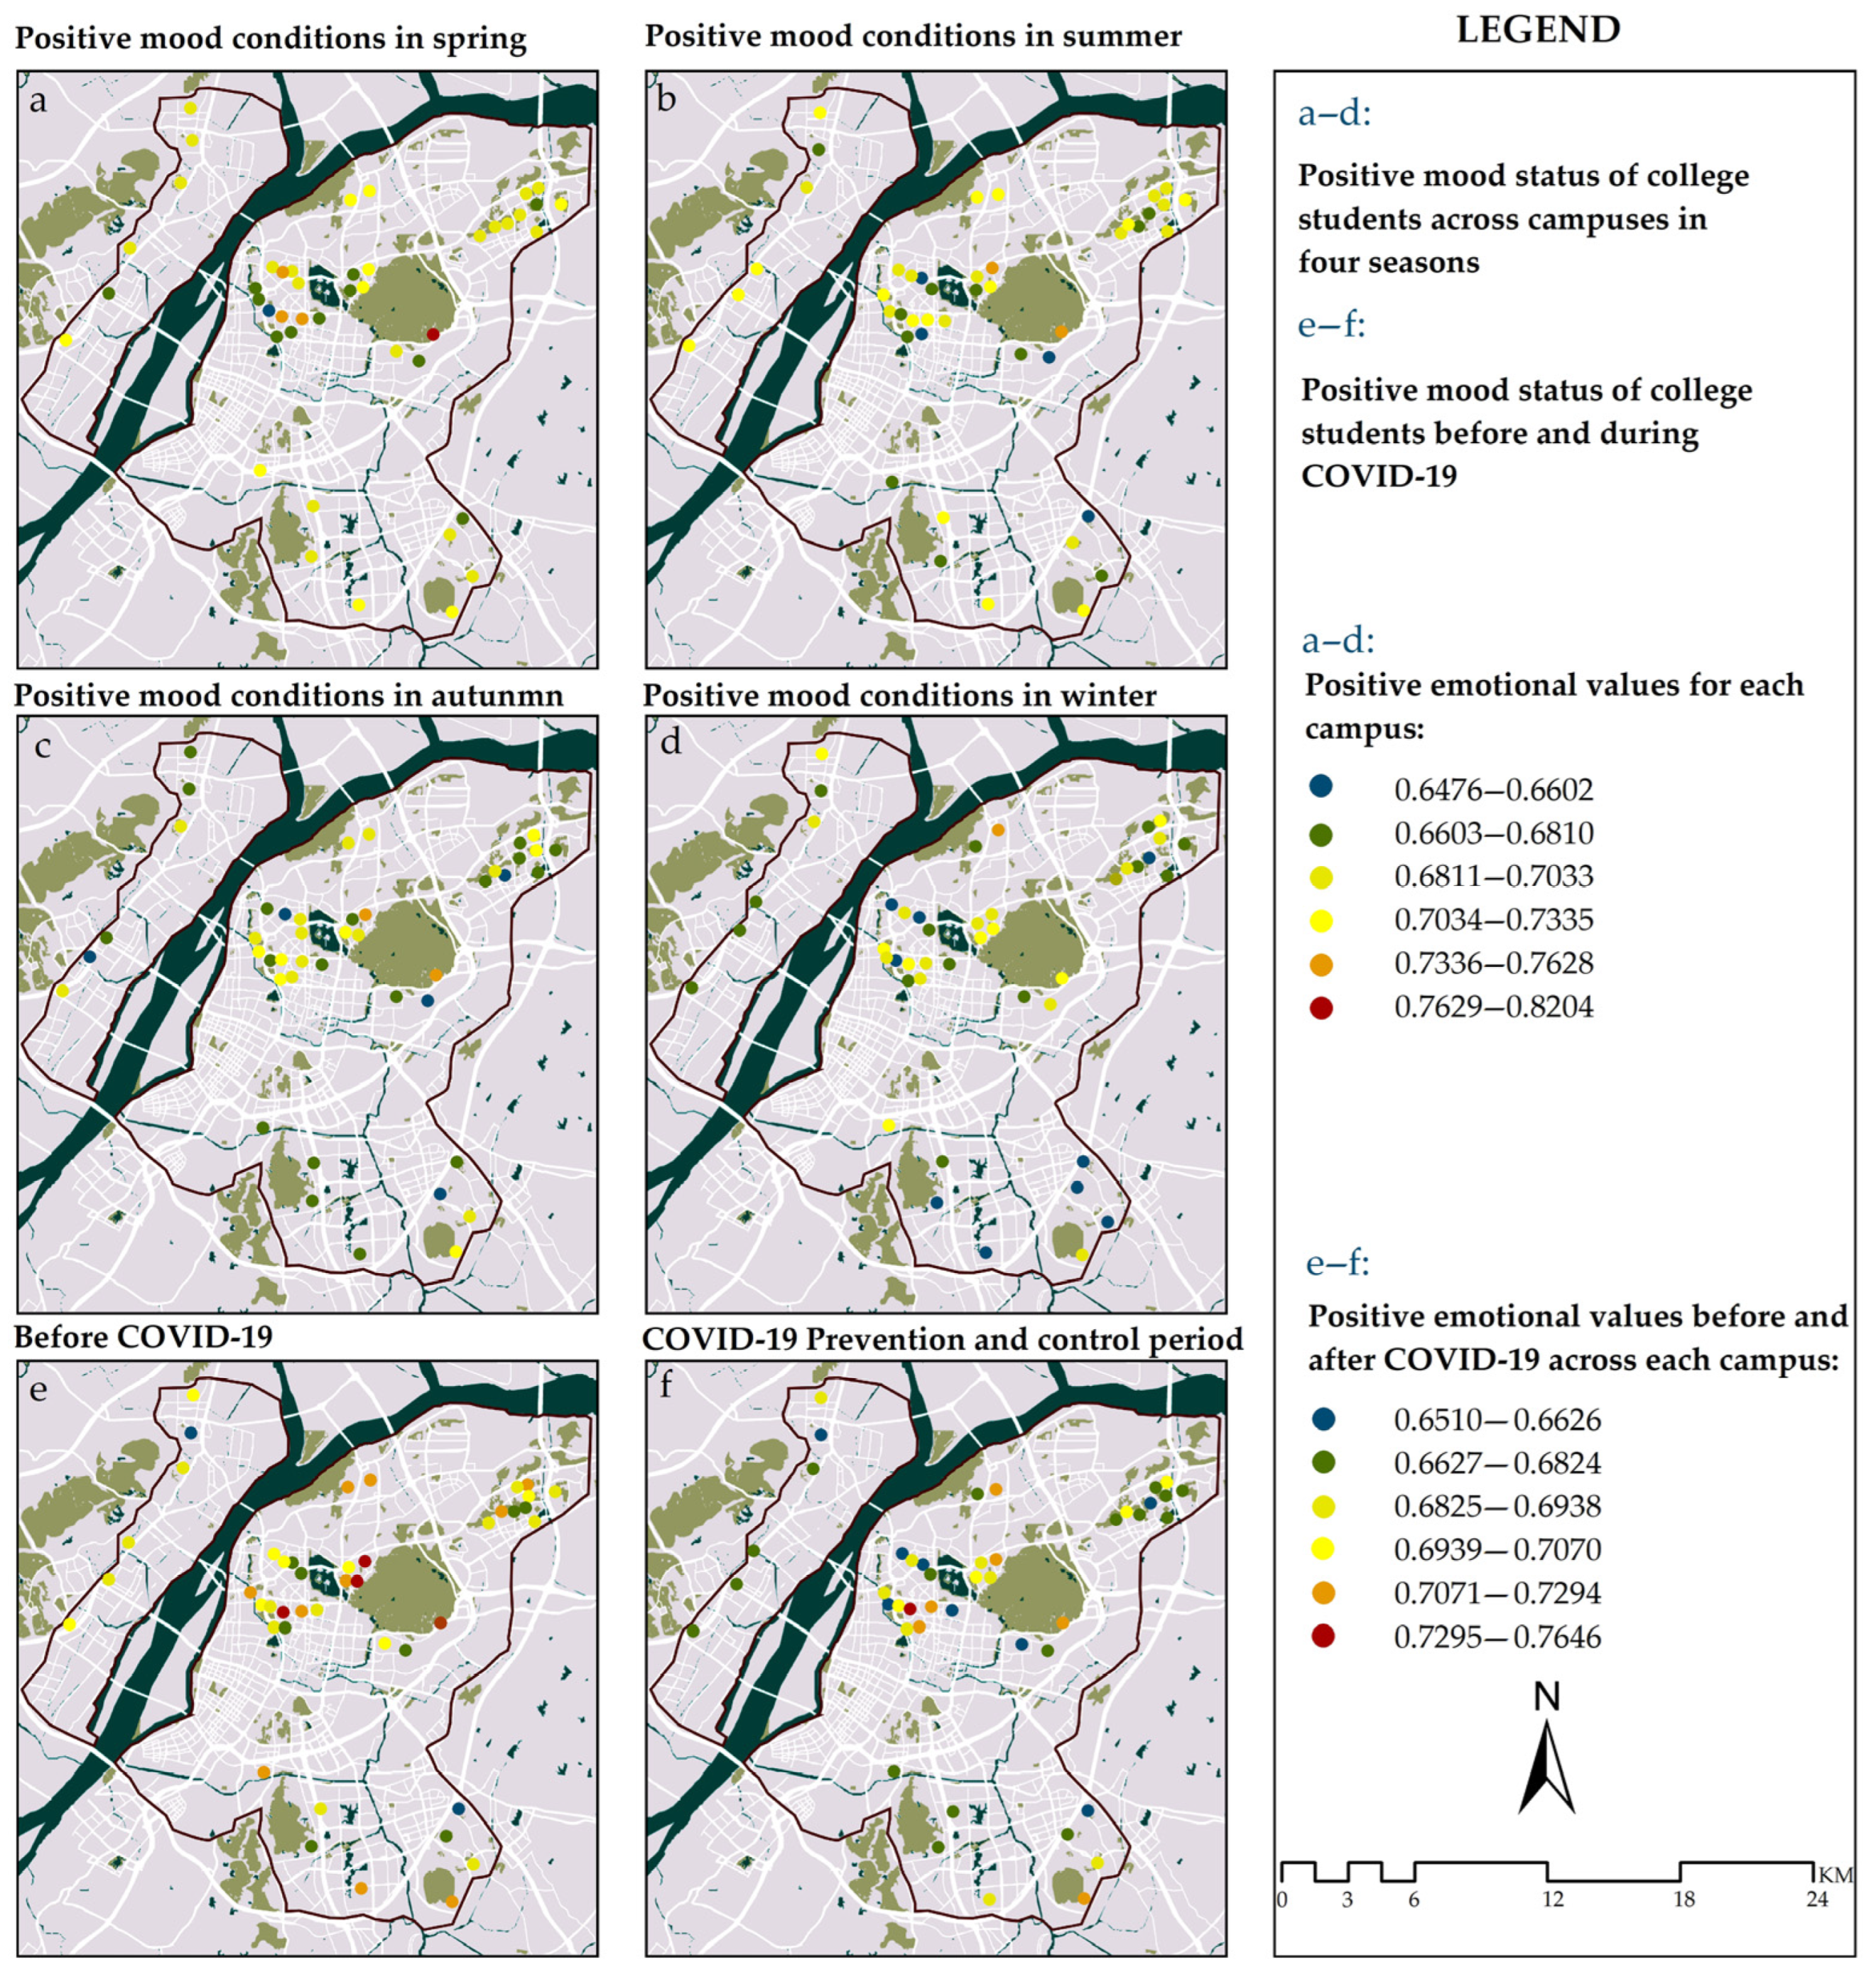
As shown in the visualization map generated from the microblogging sentiment data (Figure 4), the range of positive sentiment for each campus was 61.36–82.04%, with an average of 69.19%. In terms of spatial distribution, campuses with high levels of positive student sentiment are mainly found in the main university city area, and campuses with suboptimal levels of positive student sentiment are found in all university city areas. In terms of the time dimension, on the whole, the campuses had more positive sentiment in the spring and summer seasons, with the best overall level of sentiment in the spring and more negative sentiment in the fall and winter seasons in comparison; moreover, the tendency of the campuses’ sentiment to vary by season was similar. In comparison with the pre-COVID-19 period, the overall positive mood values of students at the 44 campuses during the outbreak prevention and control period were poor, with a downward trend, especially within the Main City University District area, where the mean positive mood values of some campuses differed significantly before and after the occurrence of COVID-19.
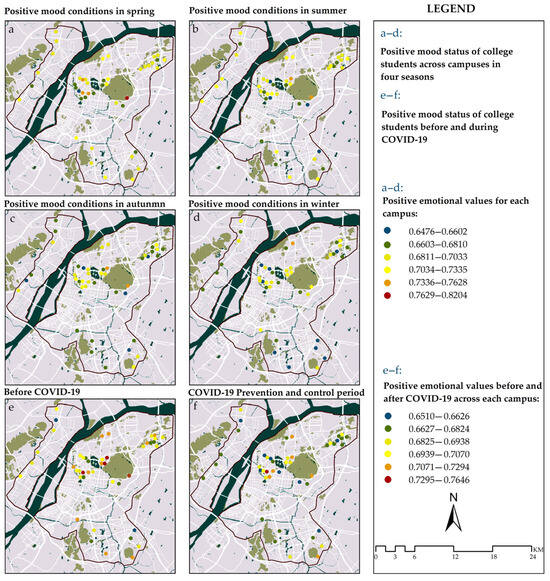
Figure 4.
Positive emotional state of college students in each campus.
3.2. The Relationship between Green Space Indicators and Positive Emotions of College Students
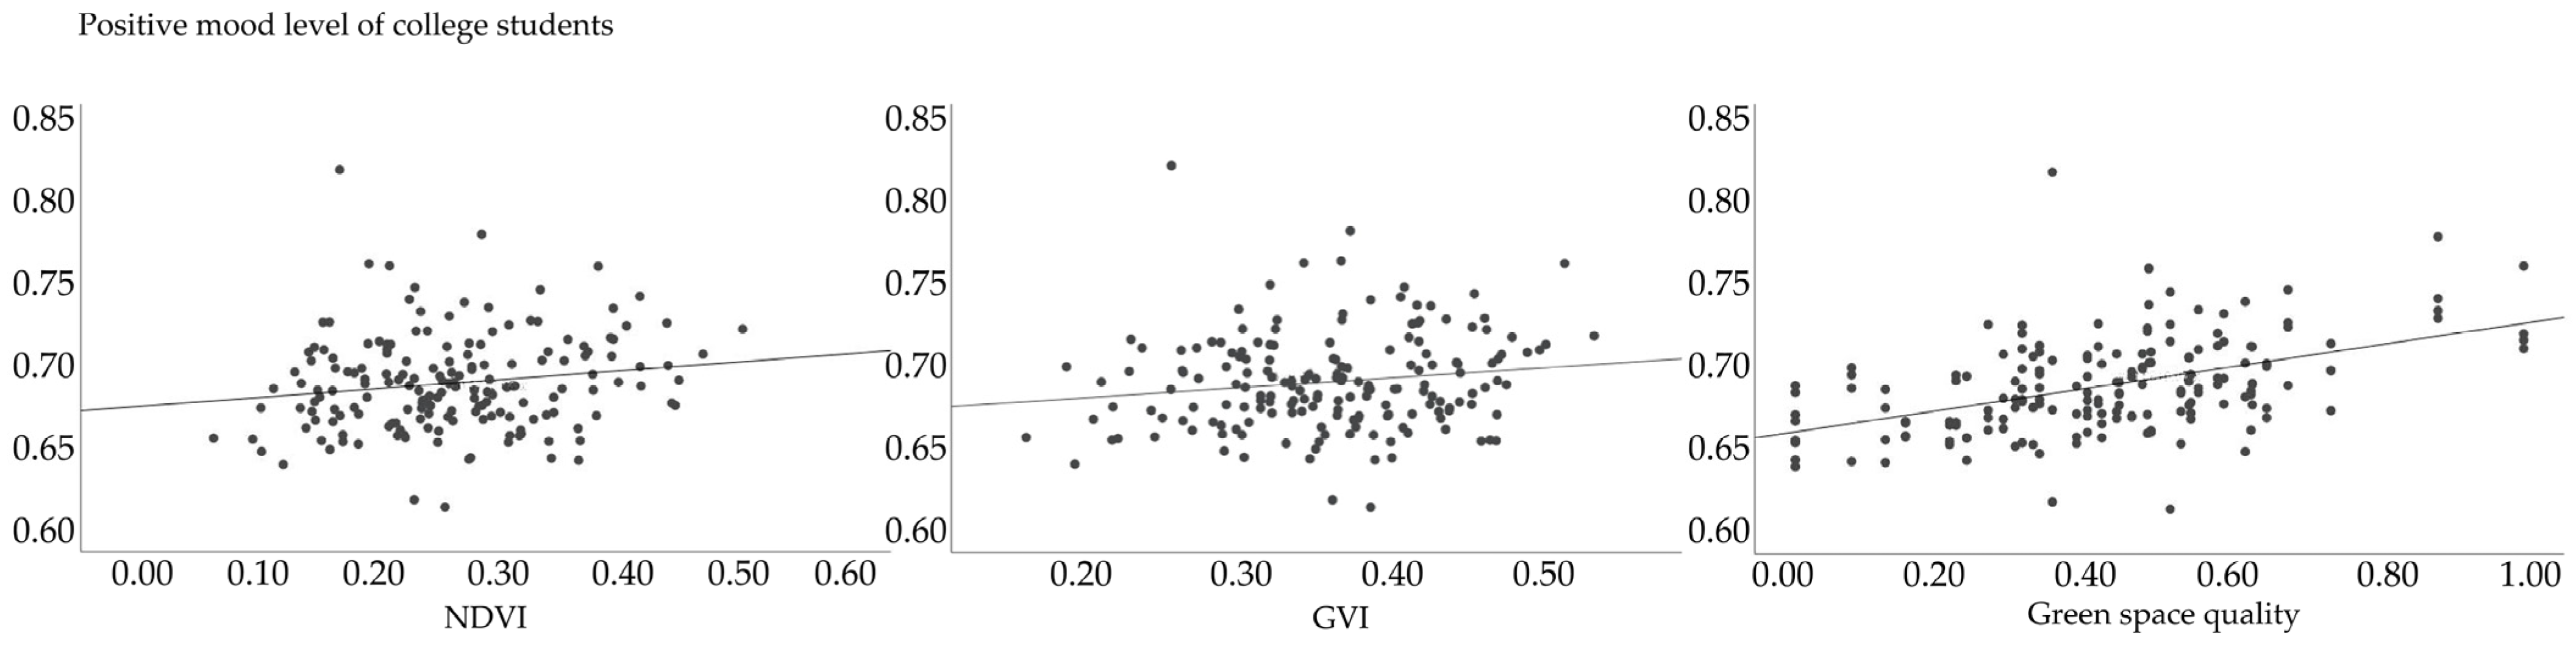
Figure 5 shows the scatterplot analysis of the relationship between indicators of campus green space and positive emotions of university students. In order to visualize the relationship between green space indicators and college students’ positive emotions in 44 school districts as a whole, SPSS 26 statistical analysis software was used to draw scatter plots of the relevant data with the Normalized Difference Vegetation Index (NDVI), Green View Index (GVI), and quality as the horizontal coordinates, and college students’ degree of positive emotions as the vertical coordinates. As indicated from the baseline trend in Figure 5, a roughly linear correlation exists between the three indicators of campus green space and college students’ positive emotions.

Figure 5.
Scatterplot analysis of the relationship between indicators of campus green space and positive emotions of university students.
On this basis, according to the scatter distribution trend of the values of each index of the research object, we applied SPSS 26 to analyze the Pearson’s correlation between NDVI, GVI, quality, and college students’ positive emotions (Table 3), which revealed a positive correlation. Firstly, the Pearson’s coefficient of NDVI and college students’ positive emotions was 0.034, which indicates a significant linear correlation, and the higher the Normalized Difference Vegetation Index on campus, the higher the level of positive emotions among college students. Secondly, those of GVI, quality, and college students’ positive emotions were all 0.000, and the degree of linear correlation was highly significant. The degree of positive emotions among college students increased with the GVI and quality indicators, and improving the GVI and quality of campus green spaces would lead to fewer negative emotions among college students. Finally, the results of the analysis show a higher degree of correlation between the GVI, quality, and positive emotions of college students compared to NDVI.
Table 3.
Correlation analysis between college students’ positive emotions and campus green space index.
3.3. Regression Results of NDVI, GVI, Green Space Quality, and Positive Emotions
Table 4 shows the results of the regression modeling of the indicators of green space and college students’ positive emotions. In this regression, after controlling for seasonal and campus fixed effects, the model fit R2 was 0.384, and all three indicators of campus green space played a positive role in enhancing college students’ positive emotions. In the regression model, the regression coefficients represent the degree of influence of the explanatory variables on the explanatory variables, and the regression coefficients of the three indicators differ significantly, with the degree of influence ranked as GVI > Quality > NDVI. Specifically, the degree of influence of GVI on college students’ positive emotions is the greatest, with a regression coefficient of 0.273, and the results of the test are significantly correlated at the level of 0.050 (p = 0.042); this indicates that the higher the value of GVI, the greater the promotion effect on college students’ positive mood. At the same time, quality is significantly correlated with the positive mood of college students at the level of 0.010 (p = 0.001), and the regression coefficient is 0.184; that is, for every 1 unit of quality index, college students’ positive mood can be improved by 0.184 units. The regression coefficient of NDVI is 0.117, and the coefficient is positive, which indicates that NDVI also has a positive promotion effect on college students’ emotions, but the degree of influence is low; the P-value is 0.068—in other words, the confidence level is above 0.900—which is a weak correlation. The results further affirm the positive influence of campus green space indicators, namely NDVI, GVI, and quality, on college students’ emotions.
Table 4.
Results of the regression model between the indicators of green space and university students’ positive emotions.
3.4. Regression Results for Pre- and Post-COVID-19 Data
As shown in Table 4, the regression model of pre-COVID-19 data has a goodness-of-fit R2 of 0.216, and the regression coefficients of each index of campus green space are ranked from high to low as GVI, quality, and NDVI. Among them, a correlation exists between quality, GVI, and college students’ positive emotions in the regression model (p-values of 0.014 and 0.078, respectively), whereas the effect of NDVI on college students’ positive emotions is insignificant and does not show a correlation.
The results of the data model during the COVID-19 prevention and control period showed a large difference compared to the pre-epidemic period, with the goodness of fit, regression coefficients, and correlations substantially improved. Specifically, the goodness-of-fit R2 of the regression model during the epidemic prevention and control period was 0.545 and thus positive, and the correlation between GVI and quality and college students’ positive emotions was positively significant at the 0.01 and 0.05 levels (p-values of 0.023 and 0.001, respectively). In addition, the two indicators have a similar degree of influence on college students’ positive emotions, with an increase of 1 unit in GVI increasing the degree of college students’ positive emotions by 0.305 units, and an increase of 1 unit in quality scores increasing the degree of college students’ positive emotions by 0.275 units. The effect of NDVI is also positive, but it only has a weak correlation with college students’ positive emotions at the 0.1 level (p = 0.072).
Compared with the regression results for the pre-COVID-19 data, R2 in the regression model for the data during the epidemic control period improved by approximately 0.329, and the model prediction was substantially improved. A comparison of the results indicates that the positive effect of campus green space on college students’ positive emotions during the epidemic prevention and control period had improved.
4. Discussion
4.1. Research Innovations
This study is the first to use multiple indicators together to measure the level of campus green space. Previous studies on green space have only focused on one indicator [47]; however, as different indicators of green space may reflect different aspects of it [48], we considered both the indicators of quantitative and qualitative aspects of campus green space, the indicators of the overhead perspective, and the indicators of the people-oriented perspective. In focusing on the amount of green from the human perspective, we also utilized the emerging method of assessing green visibility based on street-view images and semantic segmentation techniques [49].
Another novelty of this study is that it demonstrates the possibility of using social media data [50] to analyze college students’ emotions. The use of Weibo big data and natural language processing technology to assess the emotional status of college students innovates the method of obtaining college students’ emotions and avoids the drawbacks of traditional methods such as questionnaires and interviews [51,52], which are costly and time-consuming and rely on small sample sizes. With the fixation of Sina Weibo in the campus area on the use of groups and the scope of use, the data are more authentic and universal and have significant advantages, such as a large amount of information, wide coverage, and convenient access.
4.2. Contribution of the Results to the Exploration of Green Spaces and Youth Emotions on Campus
The results of the above regression model (Table 4) show that NDVI has a lower degree of correlation, both in terms of impact coefficients and correlation, than GVI and quality. The main reason for this is that the three indicators of GVI reflect different aspects of GVI in this study. Although NDVI has been proven to be related to emotions by scholars such as Cheng [53], measuring the amount of green space greenness from top to bottom based on satellites does not reflect students’ actual visual exposure to and perception of green space. In contrast, indicators of the human perspective can better reflect the actual degree of the influence of green space on college students. The findings of this study provide empirical support for Wang [54] and Helbich [55], who pointed out the differences in the impact of green space indicators on mental health benefits. In particular, the impact on mental health of the humanistic perspective indicators, mainly GVI and quality, is evident in comparison with NDVI.
In addition, according to Wang et al. [54], quality plays a more important role than GVI in influencing a population’s mental health; however, the results of this study contradict this argument. The higher coefficient of influence of GVI than quality on college students’ mood on campus may be due to the following reasons: (1) the green space quality indicator in this study mainly reflects the status of accessible green space on campus, and “not having enough time” and “lack of opportunities to get involved in accessible green space” may become the main barriers for college students to use green space; (2) accessible green space, as a convenient resource, is mainly used for physical activities and leisure and relaxation, and students are more concerned about having a suitable site to do their own thing than the quality of services and landscape within the green space; (3) students are likely to spend more time walking than being active in accessible green spaces, and thus, most exposure to green occurs on paths to dormitories, cafeterias, and classrooms. Therefore, roads on campus become one of the best opportunities for college students to come into direct contact with green spaces, and GVI is necessarily more likely to be an important green space indicator of their positive sentiment. This may be the main reason why GVI has a higher degree of influence on college students’ positive emotions than quality.
In summary, we argue that when conducting research on campus green space and college students’ positive emotions, more attention should be paid to indicators in terms of students’ actual exposure to green space and that GVI and quality can be included as indicators of data with strong correlation and high interpretability.
4.3. Limitations and Future Research
This study has some limitations. First, the GVI data collected were insufficient as the street-view images were acquired by Baidu Street View collection vehicles during the driving process. Since some spaces suitable for college students to walk are not accessible to traffic, some areas lack street-view data and could not be included in the overall GVI analysis of the campus, which may have affected the accuracy of the GVI analysis to a certain extent; the missing images should thus be supplemented by collection using cameras and drones.
In addition, compared to the actual situation observed by the human eye, the way of calculating the average value of a single street scene’s GVI is still somewhat different. The human eye has a viewing angle range of about 120 degrees, and compared with the left and right GVI, the GVI in the forward and backward directions may have a greater impact on the crowd; thus, the final results of the study are not necessarily comparable to the real situation observed by people. At the same time, a gap exists between the apparent height of the street-view collection vehicle’s collection point and the apparent height of pedestrians’ actual observation, which is slightly higher than the visual height of most students; this may have led to bias in the final GVI values and affected the analysis results. In future research, the projection transformation [56] method can be considered to make adjustment corrections to the street view image’s apparent height.
Second, social media data acquisition presented some shortcomings. College students’ emotional data in this study were taken from Sina Weibo, and not all students use Weibo as their main social software. In the future, more typical and extensive social media software should be considered to cover a wider range of groups for research, and questionnaires may be used for supplementary research.
Finally, the choice of study area was insufficient. The health benefits of green spaces may vary under different cultural backgrounds and environmental climates [57], and our study area was located in Nanjing, which is not representative of all regions; moreover, we were unable to investigate and analyze all university campuses in Nanjing. In future research, we will consider various conditions such as different cultural backgrounds, environmental climate, latitude and longitude, etc. Subsequent attempts should be made to increase the number of research subjects and conduct similar studies on campuses in other regions.
5. Conclusions
Using 44 college campuses in Nanjing as research samples, we constructed a database of campus green spaces containing NDVI, GVI, and quality indicators, as well as a database of college students’ emotions. From the perspective of health benefits, we empirically quantified the impact of campus green spaces on college students’ positive emotions; a positive correlation between campus green spaces and college students’ positive emotions was ultimately determined, confirming that campus green space has a significant impact benefit on college students’ positive emotions and validating the difference in emotional health benefits of campus green space before and after COVID-19.
(1) Positive correlations exist between campus green spaces and college students’ positive emotions.
By visualizing the two databases, we analyzed the seasonal and spatial variability of campus green space indicators and college students’ emotions. Pearson’s correlation analysis showed that all three indicators of campus green space had significant or highly significant positive correlations with college students’ positive emotions.
(2) Campus green space has a significantly beneficial impact on college students’ positive emotions.
By constructing the individual-time, double fixed-effect model, we clarified that campus green space has a large degree of influence on college students’ positive emotions (R2 = 0.384). After comparing the impact coefficients of the indicators in the model, we determined that the human perspective indicators—mainly GVI (0.273) and quality (0.184)—have a significant effect on college students’ positive emotions; this indicates differences in the impacts of different campus green space indicators on college students’ emotions.
(3) The emotional health benefits of campus green spaces before and after COVID-19 differ.
Compared with the regression results of the data before COVID-19 (R2 = 0.216), campus green space during the epidemic prevention and control period explained a higher degree of college students’ positive emotions (R2 = 0.545); this indicates that during the epidemic prevention and control period, the students’ green sensitivity increased substantially, and the health benefits of campus green space were more significant.
Supplementary Materials
The following supporting information can be downloaded at: https://www.mdpi.com/article/10.3390/su16020691/s1, Table S1. Examples of green visual index data summary on campuses. Table S2. Classification and definition of campus green space types. Table S3. Examples of results of emotion analysis.
Author Contributions
Conceptualization, A.W. and Z.M.; methodology, A.W. and Z.M.; software, A.W.; validation, A.W. and Z.M.; formal analysis, A.W.; investigation, A.W. and Z.M.; resources, Z.M.; data curation, A.W. and Z.M.; writing—original draft preparation, A.W.; writing—review and editing, A.W., Z.M. and F.Z.; visualization, Z.M.; supervision, B.Z.; project administration, B.Z.; funding acquisition, F.Z. All authors have read and agreed to the published version of the manuscript.
Funding
This work was supported by the National Natural Science Foundation of China (NSFC) General Project (No. 31971721). This was a project funded by the Priority Academic Program Development of Jiangsu Higher Education Institution (PAPD), the Priority Academic Program Development of Jiangsu Higher Educations Institutions (No. 164120230), and the Project of Innovation Programme for Postgraduate Research and Practice in Jiangsu Province (No. SJCX230352).
Institutional Review Board Statement
All subjects gave their informed consent for inclusion before they participated in the study. The study was conducted in accordance with the Declaration of Helsinki, and the protocol was approved by the Ethics Committee of Nanjing Forestry University.
Informed Consent Statement
Informed consent was obtained from all subjects involved in the study.
Data Availability Statement
The data presented in this study are available on request.
Acknowledgments
We thank the journal’s editors and reviewers for their valuable suggestions to improve the paper.
Conflicts of Interest
Author Ziran Meng was employed by the company China Design Group Co., Ltd. The remaining authors declare that the research was conducted in the absence of any commercial or financial relationships that could be construed as a potential conflict of interest.
References
- Ali, M.J.; Rahaman, M.; Hossain, S.I. Urban green spaces for elderly human health: A planning model for healthy city living. Land. Use Policy 2022, 114, 105970. [Google Scholar] [CrossRef]
- Yang, H.; Chen, T.; Zeng, Z.; Mi, F. Does urban green space justly improve public health and well-being? A case study of Tianjin, a megacity in China. J. Clean. Prod. 2022, 380, 134920. [Google Scholar] [CrossRef]
- Wang, H.; Dai, X.L.; Wu, J.L.; Wu, X.Y.; Nie, X. Influence of urban green open space on residents’ physical activity in China. BMC Public Health 2019, 19, 12. [Google Scholar] [CrossRef] [PubMed]
- Beyer, K.M.M.; Kaltenbach, A.; Szabo, A.; Bogar, S.; Nieto, F.J.; Malecki, K.M. Exposure to neighborhood green space and mental health: Evidence from the survey of the health of Wisconsin. Int. J. Environ. Res. Public Health 2014, 11, 3453–3472. [Google Scholar] [CrossRef] [PubMed]
- Jennings, V.; Bamkole, O. The relationship between social cohesion and urban green space: An avenue for health promotion. Int. J. Environ. Res. Public Health 2019, 16, 452. [Google Scholar] [CrossRef] [PubMed]
- Herzog, T.R.; Black, A.M.; Fountaine, K.A.; Knotts, D.J. Reflection and attentional recovery as distinctive benefits of restorative environments. J. Environ. Psychol. 1997, 17, 165–170. [Google Scholar] [CrossRef]
- Zhu, X.; Gao, M.; Zhang, R.; Zhang, B. Quantifying emotional differences in urban green spaces extracted from photos on social networking sites: A study of 34 parks in three cities in northern China. Urban For. Urban Green. 2021, 62, 127133. [Google Scholar] [CrossRef]
- Zhang, L.Q.; Tan, P.Y.; Richards, D. Relative importance of quantitative and qualitative aspects of urban green spaces in promoting health. Landsc. Urban Plan. 2021, 213, 104131. [Google Scholar] [CrossRef]
- Lee, A.C.K.; Jordan, H.C.; Horsley, J. Value of urban green spaces in promoting healthy living and wellbeing: Prospects for planning. Risk Manag. Healthc. Policy 2015, 8, 131–137. [Google Scholar] [CrossRef]
- Choi, Y.J.; Oh, M.J.; Kang, J.H.; Lutzenhiser, L. Plans and living practices for the green campus of Portland state university. Sustainability 2017, 9, 252. [Google Scholar] [CrossRef]
- Washington-Ottombre, C.; Washington, G.L.; Newman, J. Campus sustainability in the us: Social change since 1970 environmental management and. J. Clean. Prod. 2018, 196, 564–575. [Google Scholar] [CrossRef]
- Zhao, D.X.; He, B.J.; Meng, F.Q. The green school project: A means of speeding up sustainable development? Geoforum 2015, 65, 310–313. [Google Scholar] [CrossRef]
- Zhang, Y.J.; Mavoa, S.; Zhao, J.F.; Raphael, D.; Smith, M. The association between green space and adolescents’ mental well-being: A systematic review. Int. J. Environ. Res. Public Health 2020, 17, 6640. [Google Scholar] [CrossRef] [PubMed]
- Bibri, S.E. On the sustainability of smart and smarter cities in the era of big data: An interdisciplinary and transdisciplinary literature review. J. Big Data 2019, 6, 25. [Google Scholar] [CrossRef]
- Xue, X.Q.; Zhang, Y.J.; Zhang, L.X.; Wang, Y.Q.; Hou, R.C. Evaluation on sustainable development of smart urban rail transit. Mob. Inf. Syst. 2022, 2022, 2737750. [Google Scholar] [CrossRef]
- Yoffe, H.; Plaut, P.; Grobman, Y.J. Towards sustainability evaluation of urban landscapes using big data: A case study of Israel’s architecture, engineering and construction industry. Landsc. Res. 2022, 47, 49–67. [Google Scholar] [CrossRef]
- Bibri, S.E.; Krogstie, J. Ict of the new wave of computing for sustainable urban forms: Their big data and context-aware augmented typologies and design concepts. Sustain. Cities Soc. 2017, 32, 449–474. [Google Scholar] [CrossRef]
- Bibri, S.E. The IOT for smart sustainable cities of the future: An analytical framework for sensor-based big data applications for environmental sustainability. Sustain. Cities Soc. 2018, 38, 230–253. [Google Scholar] [CrossRef]
- Xu, R.R. Framework for building smart tourism big data mining model for sustainable development. Sustainability 2023, 15, 5162. [Google Scholar] [CrossRef]
- Rani, S.; Mishra, R.K.; Usman, M.; Kataria, A.; Kumar, P.; Bhambri, P.; Mishra, A.K. Amalgamation of advanced technologies for sustainable development of smart city environment: A review. IEEE Access 2021, 9, 150060–150087. [Google Scholar] [CrossRef]
- Yang, Z.; Liu, J.J.; Faqiri, H.; Shafik, W.; Abdulrahman, A.T.; Yusuf, M.; Sharawy, A.M. Green internet of things and big data application in smart cities development. Complexity 2021, 2021, 4922697. [Google Scholar] [CrossRef]
- Beeco, J.A.; Hallo, J.C.; Brownlee, M.T.J. GPS visitor tracking and recreation suitability mapping: Tools for understanding and managing visitor use. Landsc. Urban Plan. 2014, 127, 136–145. [Google Scholar] [CrossRef]
- Wang, S.H.; Qin, A.H. Landscape planning and management methods of beautiful rural pastoral complexes under the background of big data. Math. Probl. Eng. 2022, 2022, 5304873. [Google Scholar] [CrossRef]
- Tu, S.N.; Zhang, M. Research on planning and design of settlement from cities to rural areas based on big data technology. Soft Comput. 2023, 27, 1203. [Google Scholar] [CrossRef]
- Liu, S.Y. Application of big data technology in urban greenway design. Secur. Commun. Netw. 2022, 2022, 4826523. [Google Scholar] [CrossRef]
- Jin, Y.; Xu, Y.; Liu, W. The green quality of urban spatial development: A multi-dimensional and multi-regional model using big data. Urban For. Urban Green. 2023, 85, 127953. [Google Scholar] [CrossRef]
- Dong, Y.-H.; Peng, F.-L.; Li, H.; Men, Y.-Q. Spatiotemporal characteristics of Chinese metro-led underground space development: A multiscale analysis driven by big data. Tunn. Undergr. Space Technol. 2023, 139, 105209. [Google Scholar] [CrossRef]
- Wang, R.; Browning, M.H.E.M.; Qin, X.; He, J.; Wu, W.; Yao, Y.; Liu, Y. Visible green space predicts emotion: Evidence from social media and street view data. Appl. Geogr. 2022, 148, 102803. [Google Scholar] [CrossRef]
- Sinclair, M.; Ghermandi, A.; Sheela, A.M. A crowdsourced valuation of recreational ecosystem services using social media data: An application to a tropical wetland in India. Sci. Total Environ. 2018, 642, 356–365. [Google Scholar] [CrossRef]
- Angradi, T.R.; Launspach, J.J.; Debbout, R. Determining preferences for ecosystem benefits in great lakes areas of concern from photographs posted to social media. J. Great Lakes Res. 2018, 44, 340–351. [Google Scholar] [CrossRef]
- Oteros-Rozas, E.; Martín-López, B.; Fagerholm, N.; Bieling, C.; Plieninger, T. Using social media photos to explore the relation between cultural ecosystem services and landscape features across five European sites. Ecol. Indic. 2018, 94, 74–86. [Google Scholar] [CrossRef]
- Yoshimura, N.; Hiura, T. Demand and supply of cultural ecosystem services: Use of geotagged photos to map the aesthetic value of landscapes in Hokkaido. Ecosyst. Serv. 2017, 24, 68–78. [Google Scholar] [CrossRef]
- Wang, Y.; Gao, S.D.; Li, N.; Yu, S.Y. Crowdsourcing the perceived urban built environment via social media: The case of underutilized land. Adv. Eng. Inf. 2021, 50, 101371. [Google Scholar] [CrossRef]
- Väisänen, T.; Järv, O.; Toivonen, T.; Hiippala, T. Mapping urban linguistic diversity with social media and population register data. Comput. Environ. Urban Syst. 2022, 97, 101857. [Google Scholar] [CrossRef]
- Amoly, E.; Dadvand, P.; Forns, J.; López-Vicente, M.; Basagaña, X.; Julvez, J.; Alvarez-Pedrerol, M.; Nieuwenhuijsen, M.J.; Sunyer, J. Green and blue spaces and behavioral development in Barcelona schoolchildren: The breathe project. Environ. Health Perspect. 2014, 122, 1351–1358. [Google Scholar] [CrossRef]
- Vanaken, G.J.; Danckaerts, M. Impact of green space exposure on children’s and adolescents’ mental health: A systematic review. Int. J. Environ. Res. Public Health 2018, 15, 2668. [Google Scholar] [CrossRef]
- Janeczko, E.; Czyzyk, K.; Korcz, N.; Woznicka, M.; Bielinis, E. The psychological effects and benefits of using green spaces in the city: A field experiment with young polish adults. Forests 2023, 14, 497. [Google Scholar] [CrossRef]
- Bray, I.; Reece, R.; Sinnett, D.; Martin, F.; Hayward, R. Exploring the role of exposure to green and blue spaces in preventing anxiety and depression among young people aged 14–24 years living in urban settings: A systematic review and conceptual framework. Environ. Res. 2022, 214, 114081. [Google Scholar] [CrossRef]
- von Benzon, N. Discussing nature, ‘doing’ nature: For an emancipatory approach to conceptualizing young people’s access to outdoor green space. Geoforum 2018, 93, 79–86. [Google Scholar] [CrossRef]
- Chen, C.X.; Li, H.W.; Luo, W.J.; Xie, J.H.; Yao, J.; Wu, L.F.; Xia, Y. Predicting the effect of street environment on residents’ mood states in large urban areas using machine learning and street view images. Sci. Total Environ. 2022, 816, 151605. [Google Scholar] [CrossRef]
- Rui, Q.; Cheng, H. Quantifying the spatial quality of urban streets with open street view images: A case study of the main urban area of Fuzhou. Ecol. Indic. 2023, 156, 111204. [Google Scholar] [CrossRef]
- Yuan, Y.; Wang, R.; Niu, T.; Liu, Y. Using street view images and a geographical detector to understand how street-level built environment is associated with urban poverty: A case study in Guangzhou. Appl. Geogr. 2023, 156, 102980. [Google Scholar] [CrossRef]
- Liu, Y.; Liu, Y. Detecting the city-scale spatial pattern of the urban informal sector by using the street view images: A street vendor massive investigation case. Cities 2022, 131, 103959. [Google Scholar] [CrossRef]
- Zhang, Y.; Sun, M.; Ren, Y.; Shen, J. Sentiment analysis of Sina Weibo users under the impact of super typhoon Lekima using natural language processing tools: A multi-tags case study. Procedia Comput. Sci. 2020, 174, 478–490. [Google Scholar] [CrossRef]
- Wang, R.; Rho, S.; Chen, B.-W.; Cai, W. Modeling of large-scale social network services based on mechanisms of information diffusion: Sina Weibo as a case study. Future Gener. Comput. Syst. 2017, 74, 291–301. [Google Scholar] [CrossRef]
- Guan, W.; Gao, H.; Yang, M.; Li, Y.; Ma, H.; Qian, W.; Cao, Z.; Yang, X. Analyzing user behavior of the micro-blogging website Sina Weibo during hot social events. Phys. A Stat. Mech. Its Appl. 2014, 395, 340–351. [Google Scholar] [CrossRef]
- Zhang, M.; Zhang, F.; Chen, D.; Tan, M.L.; Chan, N.W. Urban local surface temperature prediction using the urban gray-green space landscape and vegetation indices. Build. Environ. 2022, 226, 109723. [Google Scholar] [CrossRef]
- Zhang, J. Inequalities in the quality and proximity of green space exposure are more pronounced than in quantity aspect: Evidence from a rapidly urbanizing Chinese city. Urban For. Urban Green. 2023, 79, 127811. [Google Scholar] [CrossRef]
- Xia, Y.; Yabuki, N.; Fukuda, T. Sky view factor estimation from street view images based on semantic segmentation. Urban. Clim. 2021, 40, 100999. [Google Scholar] [CrossRef]
- Li, X.; Zhang, J.; Li, B. Patterns in negative emotions, sleep disorders, and temperature: Evidence from microblog big data. Heliyon 2023, 9, e21987. [Google Scholar] [CrossRef]
- Kazemi, F.; Hosseinpour, N.; Ebrahimian, M. People’s preferences and perceptions toward low-input versus conventional park design approaches using 3d images and interview-based questionnaires. Urban For. Urban Green. 2023, 86, 128040. [Google Scholar] [CrossRef]
- Rosenberg, D.E.; Huang, D.L.; Simonovich, S.D.; Belza, B. Outdoor built environment barriers and facilitators to activity among midlife and older adults with mobility disabilities. Gerontologist 2013, 53, 268–279. [Google Scholar] [CrossRef] [PubMed]
- Cheng, Y.Y.; Zhang, J.G.; Wei, W.; Zhao, B. Effects of urban parks on residents’ expressed happiness before and during the COVID-19 pandemic. Landsc. Urban Plan. 2021, 212, 104118. [Google Scholar] [CrossRef] [PubMed]
- Wang, R.Y.; Feng, Z.Q.; Pearce, J.; Zhou, S.H.; Zhang, L.; Liu, Y. Dynamic greenspace exposure and residents’ mental health in Guangzhou, China: From over-head to eye-level perspective, from quantity to quality. Landsc. Urban Plan. 2021, 215, 104230. [Google Scholar] [CrossRef]
- Helbich, M.; Yao, Y.; Liu, Y.; Zhang, J.B.; Liu, P.H.; Wang, R.Y. Using deep learning to examine street view green and blue spaces and their associations with geriatric depression in Beijing, China. Environ. Int. 2019, 126, 107–117. [Google Scholar] [CrossRef]
- Kovalchuk, A.; Izonin, I.; Riznyk, O. An efficient image encryption scheme using projective transformations. Procedia Comput. Sci. 2019, 160, 584–589. [Google Scholar] [CrossRef]
- Peng, L.L.H.; Jim, C.Y. Economic evaluation of green-roof environmental benefits in the context of climate change: The case of Hong Kong. Urban For. Urban Green. 2015, 14, 554–561. [Google Scholar] [CrossRef]
Disclaimer/Publisher’s Note: The statements, opinions and data contained in all publications are solely those of the individual author(s) and contributor(s) and not of MDPI and/or the editor(s). MDPI and/or the editor(s) disclaim responsibility for any injury to people or property resulting from any ideas, methods, instructions or products referred to in the content. |
© 2024 by the authors. Licensee MDPI, Basel, Switzerland. This article is an open access article distributed under the terms and conditions of the Creative Commons Attribution (CC BY) license (https://creativecommons.org/licenses/by/4.0/).