Article

Investigation of Outdoor Thermal Comfort for Campus Pedestrian Walkways in Thailand

by
Naphat Suwanmanee
1,
Nopadon Kronprasert
1,2,*,
Chomphunut Sutheerakul
1,
Kriangkrai Arunotayanun
2 and
Damrongsak Rinchumphu
2
1
Excellence Center in Infrastructure Technology and Transportation Engineering (ExCITE), Chiang Mai University, Chiang Mai 50200, Thailand
2
Department of Civil Engineering, Faculty of Engineering, Chiang Mai University, Chiang Mai 50200, Thailand
*
Author to whom correspondence should be addressed.
Sustainability 2024, 16(2), 657; https://doi.org/10.3390/su16020657
Submission received: 1 December 2023 / Revised: 8 January 2024 / Accepted: 10 January 2024 / Published: 11 January 2024
(This article belongs to the Special Issue Benefits of Green Infrastructures on Air Quality in Urban Spaces)

Abstract

:
Thermal comfort is an important subject to evaluate the quality of outdoor environments. This study investigated outdoor thermal conditions and the thermal comfort perception of pedestrians using walkways within a university campus in Thailand, located in the hot and humid tropical region. In this field study, microclimate measurements were conducted to assess the physiological equivalent temperature (PET) of walkways, and on-site questionnaire surveys (n = 400) were used to evaluate the thermal sensation votes of pedestrians in different walkway conditions. The results revealed that the neutral PET was 25.2 °C and its acceptable range was 24.6–32.0 °C. Most pedestrians accept the thermal conditions of all walkway types but at different levels of acceptability, albeit in a slightly warm sensation. Among different walkway types, the cantilever-covered walkway with sparse trees yields the closest PET to the neutral PET. The most comfortable and favorable walkway is that with a lower air temperature, less sunlight, and higher wind ventilation. The studies on the outdoor thermal comfort of pedestrian walkways could benefit urban planners and engineers in designing physical and environmental conditions of walkways as well as promoting non-motorized transport and green university campuses.

1. Introduction

Green urban planning is currently being highlighted as one of the essential sustainability strategies for the development of cities or communities [1,2]. It helps create comfortable microclimate conditions and proactively improve livability. Outdoor spaces and walkways are important elements of cities and communities, which can be developed as green urban areas [3,4]. Specifically, walkways can promote non-motorized transport, including walking and cycling, for sustainable transport in urban environments [5,6].
Several colleges and universities worldwide have recently paid great attention to sustainability. They have encouraged a pedestrian-friendly environment and non-motorized transport. A college or university campus is an ideal setting to encourage sustainable transportation and community development that can improve the social environment on campus and promote better health among students and staff [7]. In Thailand, a developing Southeast Asian country, Chiang Mai University (CMU) is one of the large-sized university campuses located in the northern region in a tropical wet and dry (or savanna) climate. With its location in the foothills and shady parks, walking is one of the most popular travel modes and leisure outdoor activities on campus. CMU is now pursuing an action plan for a green, clean, and smart university. One of its important campus policies is the development of outdoor public spaces, such as pedestrian walkways. To attract their use of walkways, the walking facilities and environments must be suitably created in response to pedestrian usage and comfort.
In the evaluation of outdoor environments, outdoor thermal comfort has been used to express the satisfaction of humans with the external environment. It directly impacts the participation in outdoor activities [8,9,10,11]. Several indicators have been proposed for the assessment of outdoor thermal comfort [12,13]. The physiological equivalent temperature (PET) is the most pertinent thermal indicator commonly used in outdoor thermal comfort studies [14,15,16,17,18]. Compared to other thermal indices, PET corresponded the most to the actual thermal condition and thermal sensation. PET is expressed by degree Celsius (°C), which makes the results more comprehensible to urban or regional planners and designers [19].
This study aimed to investigate the outdoor thermal comfort and thermal perception of pedestrians using different designs and conditions of walkways in a university campus in Thailand. This study conducted field measurements and on-site questionnaire surveys to evaluate pedestrians’ physiological equivalent temperature (PET) and examine the thermal sensational vote (TSV) of different conditions of campus walkways. The results of this study could indicate whether the thermal condition of the campus walkways is suitable for pedestrians and which type of walkway is the most comfortable under different environmental components.
The remainder of this paper is organized as follows: Section 2 reviews past studies related to outdoor thermal comfort. Section 3 presents the materials and methods used in this study, including data collection and evaluation methods. Section 4 describes the results and provides a discussion of the results. Section 5 provides the conclusions and highlights further recommendations.

2. Literature Review

Over the past few decades, many research studies have been conducted to investigate human thermal comfort. Thermal comfort represents human satisfaction with the thermal indoor or outdoor environment conditions. It is typically assessed by a subjective evaluation and is affected by several factors, including environmental factors (e.g., air temperature, airspeed, movement, humidity, and radiation) and personal factors (e.g., metabolic rate, clothing insulation, body shape, age and gender, and state of health) [20,21,22].
During the last decade, increasing attention has been dedicated to outdoor thermal comfort in examining how people perceive and interact with urban outdoor environments [13,23,24,25]. Outdoor thermal comfort has become an important factor in the provision of strategies for the sustainable urban planning and design of outdoor spaces for daily activities. Urban planners and designers attempt to create outdoor spaces based on a good thermal environment to promote livable and healthy communities [16,26]. In urban environments, the outdoor thermal comfort of people is affected by thermal conditions, and the thermal perception of people affects their usage of the outdoors [27,28].
In this regard, numerous studies have assessed outdoor thermal comfort using in situ thermal conditions, and thermal perception using questionnaire surveys. They defined the boundaries of a thermal sensation scale and provided a better match between objective thermal indices and subjective thermal perception.
To assess the thermal comfort of people, a large number of thermal indices have been proposed. Previous studies have shown that the physiological equivalent temperature (PET) is the most widely used and applicable thermal index for outdoor thermal perception studies [13,18,29,30]. PET is defined as the air temperature at which the energy budget of the human body in indoor settings is balanced with the same skin temperature as under outdoor settings. PET is derived from the human energy balance, the Munich Energy-Balance Model (MEMI) for Individuals with the unit of degree Celsius (°C) [15]. It is recommended for urban and regional planners to use PET in assessing the perceived heat sensation of pedestrians as it corresponds to the actual outdoor conditions [19,24,27,30,31,32,33]. Moreover, PET could measure how changes in the thermal environment can affect human health and well-being [34].
To assess the thermal perception of people, the thermal sensory vote data from questionnaire surveys are commonly used. The ASHARE 7-point thermal sensation vote (TSV) scale, −3 (cold), −2 (cool), −1 (slightly cool), 0 (neutral), +1 (slightly warm), +2 (warm), and +3 (hot), was recommended for determining the neutral temperature, thermal acceptability, and thermal preference of respondents [22,23,25]. The thermal acceptability range can be related to the thermal sensation scale, as shown in Table 1 [14,24,27,30].
In recent years, many field studies have been performed by applying the PET index and TSV scales to determine the neutral thermal sensation under various climates worldwide. A recent review showed that the PET neutral sensation ranges were varied in different climatic zones according to the Köppen climatic classification from cold and temperate climates to tropical and subtropical climates. Examples of studies in cold and temperate climates can be mostly found in European countries, such as Germany, Croatia, Sweden, Greece, the Netherlands, and Hungary [29,35,36,37,38], while those in tropical and subtropical climates with hot, humid, and wet weather can be found in several Asian, African, and South American countries, such as Taiwan, Hong Kong, China, Japan, Australia, New Zealand, Iran, India, Singapore, Malaysia, Tanzania, Algeria, and Brazil [39,40,41,42,43,44,45,46,47,48,49,50]. A comprehensive review by Potchter et al. (2018) showed that the thermal acceptability range in cold climates is about 15–20 °C PET, while in hot climates, it is about 24–27 °C PET [31].
To date, the study on outdoor thermal conditions and human thermal sensation in the hot and humid tropical climate of Thailand is very limited. However, there were some research studies developed under the same climate condition as Thailand. These studies revealed that in Singapore, the neutral temperature and its acceptable range in outdoor conditions are at 28.7 °C PET and 26.3–31.7 °C PET, respectively [48], while in Malaysia, they are 25.6 °C and 25.9–32.3 °C PET, respectively [11]. A study in Hong Kong found that the neutral temperature in summer is 25 °C PET [19].
Furthermore, recent studies on outdoor thermal conditions and human thermal comfort perception showed that the neutral PETs appear to vary in different types of outdoor environments. Examples of outdoor environments are residential areas, urban parks, courtyards, urban street canyons, public squares, urban plazas, elevated walkways, and university campuses [8,9,10,11,23,33,43,44,46,47,51,52,53,54,55,56]. These studies help understand people’s usage of the outdoors, evaluate the quality of outdoor environments, and promote the sustainable urban design of outdoor spaces.
It can be seen that most outdoor thermal comfort studies were conducted in both cold and hot climates, but relatively little research has been conducted in the context of Thailand. Moreover, the literature has revealed a scarcity of thermal comfort perception under different walkway designs and environments, especially in hot-humid tropical cities.
In summary, many research findings have been accumulated in the field of the outdoor microclimate, which provides a solid foundation for this study. This study developed a field investigation to assess outdoor thermal environment conditions and human thermal comfort perception under different campus walkway conditions in Thailand.

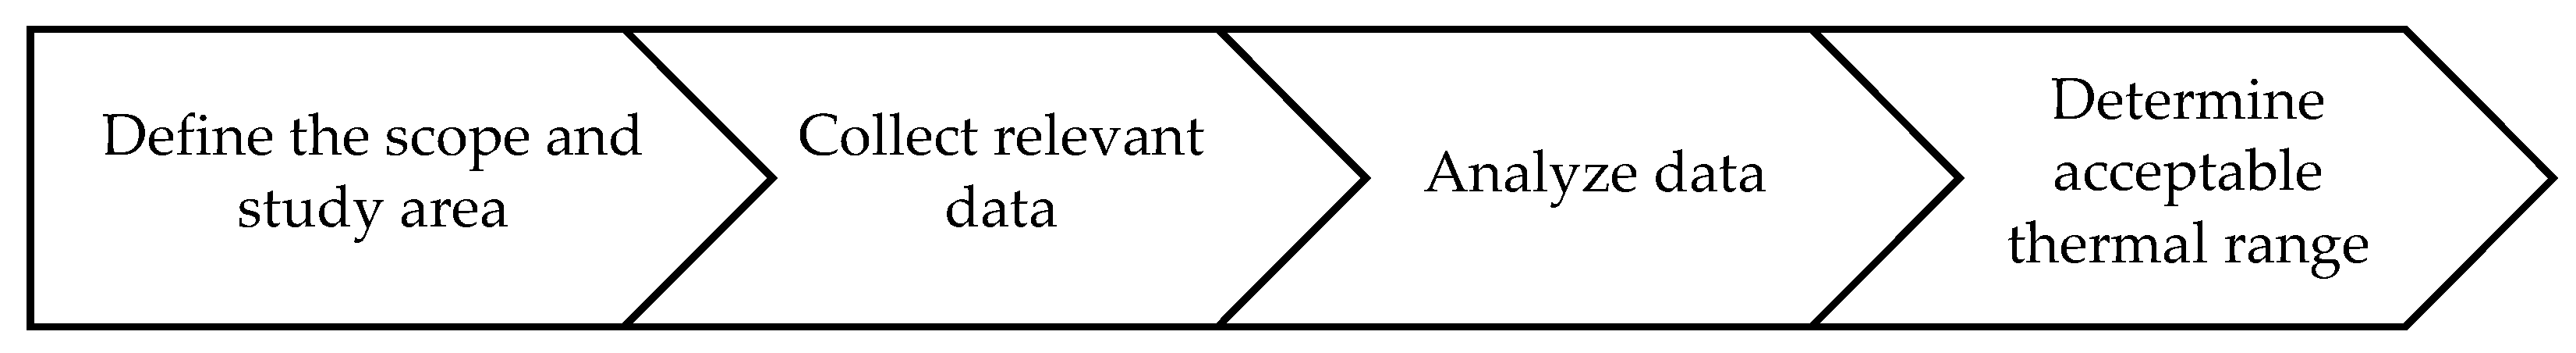
3. Materials and Methods

This study aimed to examine the outdoor thermal comfort of pedestrian walkways within a university campus in Thailand and to compare the acceptable outdoor thermal comfort among different conditions of walkways. This study focuses on examining the physiological equivalent temperature (PET) and Temperature Sensation Votes (TSVs) of pedestrians using campus walkways.
This study first defined the methods used and the study area. Next, the environmental factors associated with different campus walkways were measured in the field, and the personal factors were collected using questionnaire surveys. Further, all relevant data were analyzed to estimate the PET index of each walkway. Finally, the thermal acceptability range was determined, and the results were discussed. Figure 1 illustrates the research method adopted in this paper. A description of the method is presented as follows:

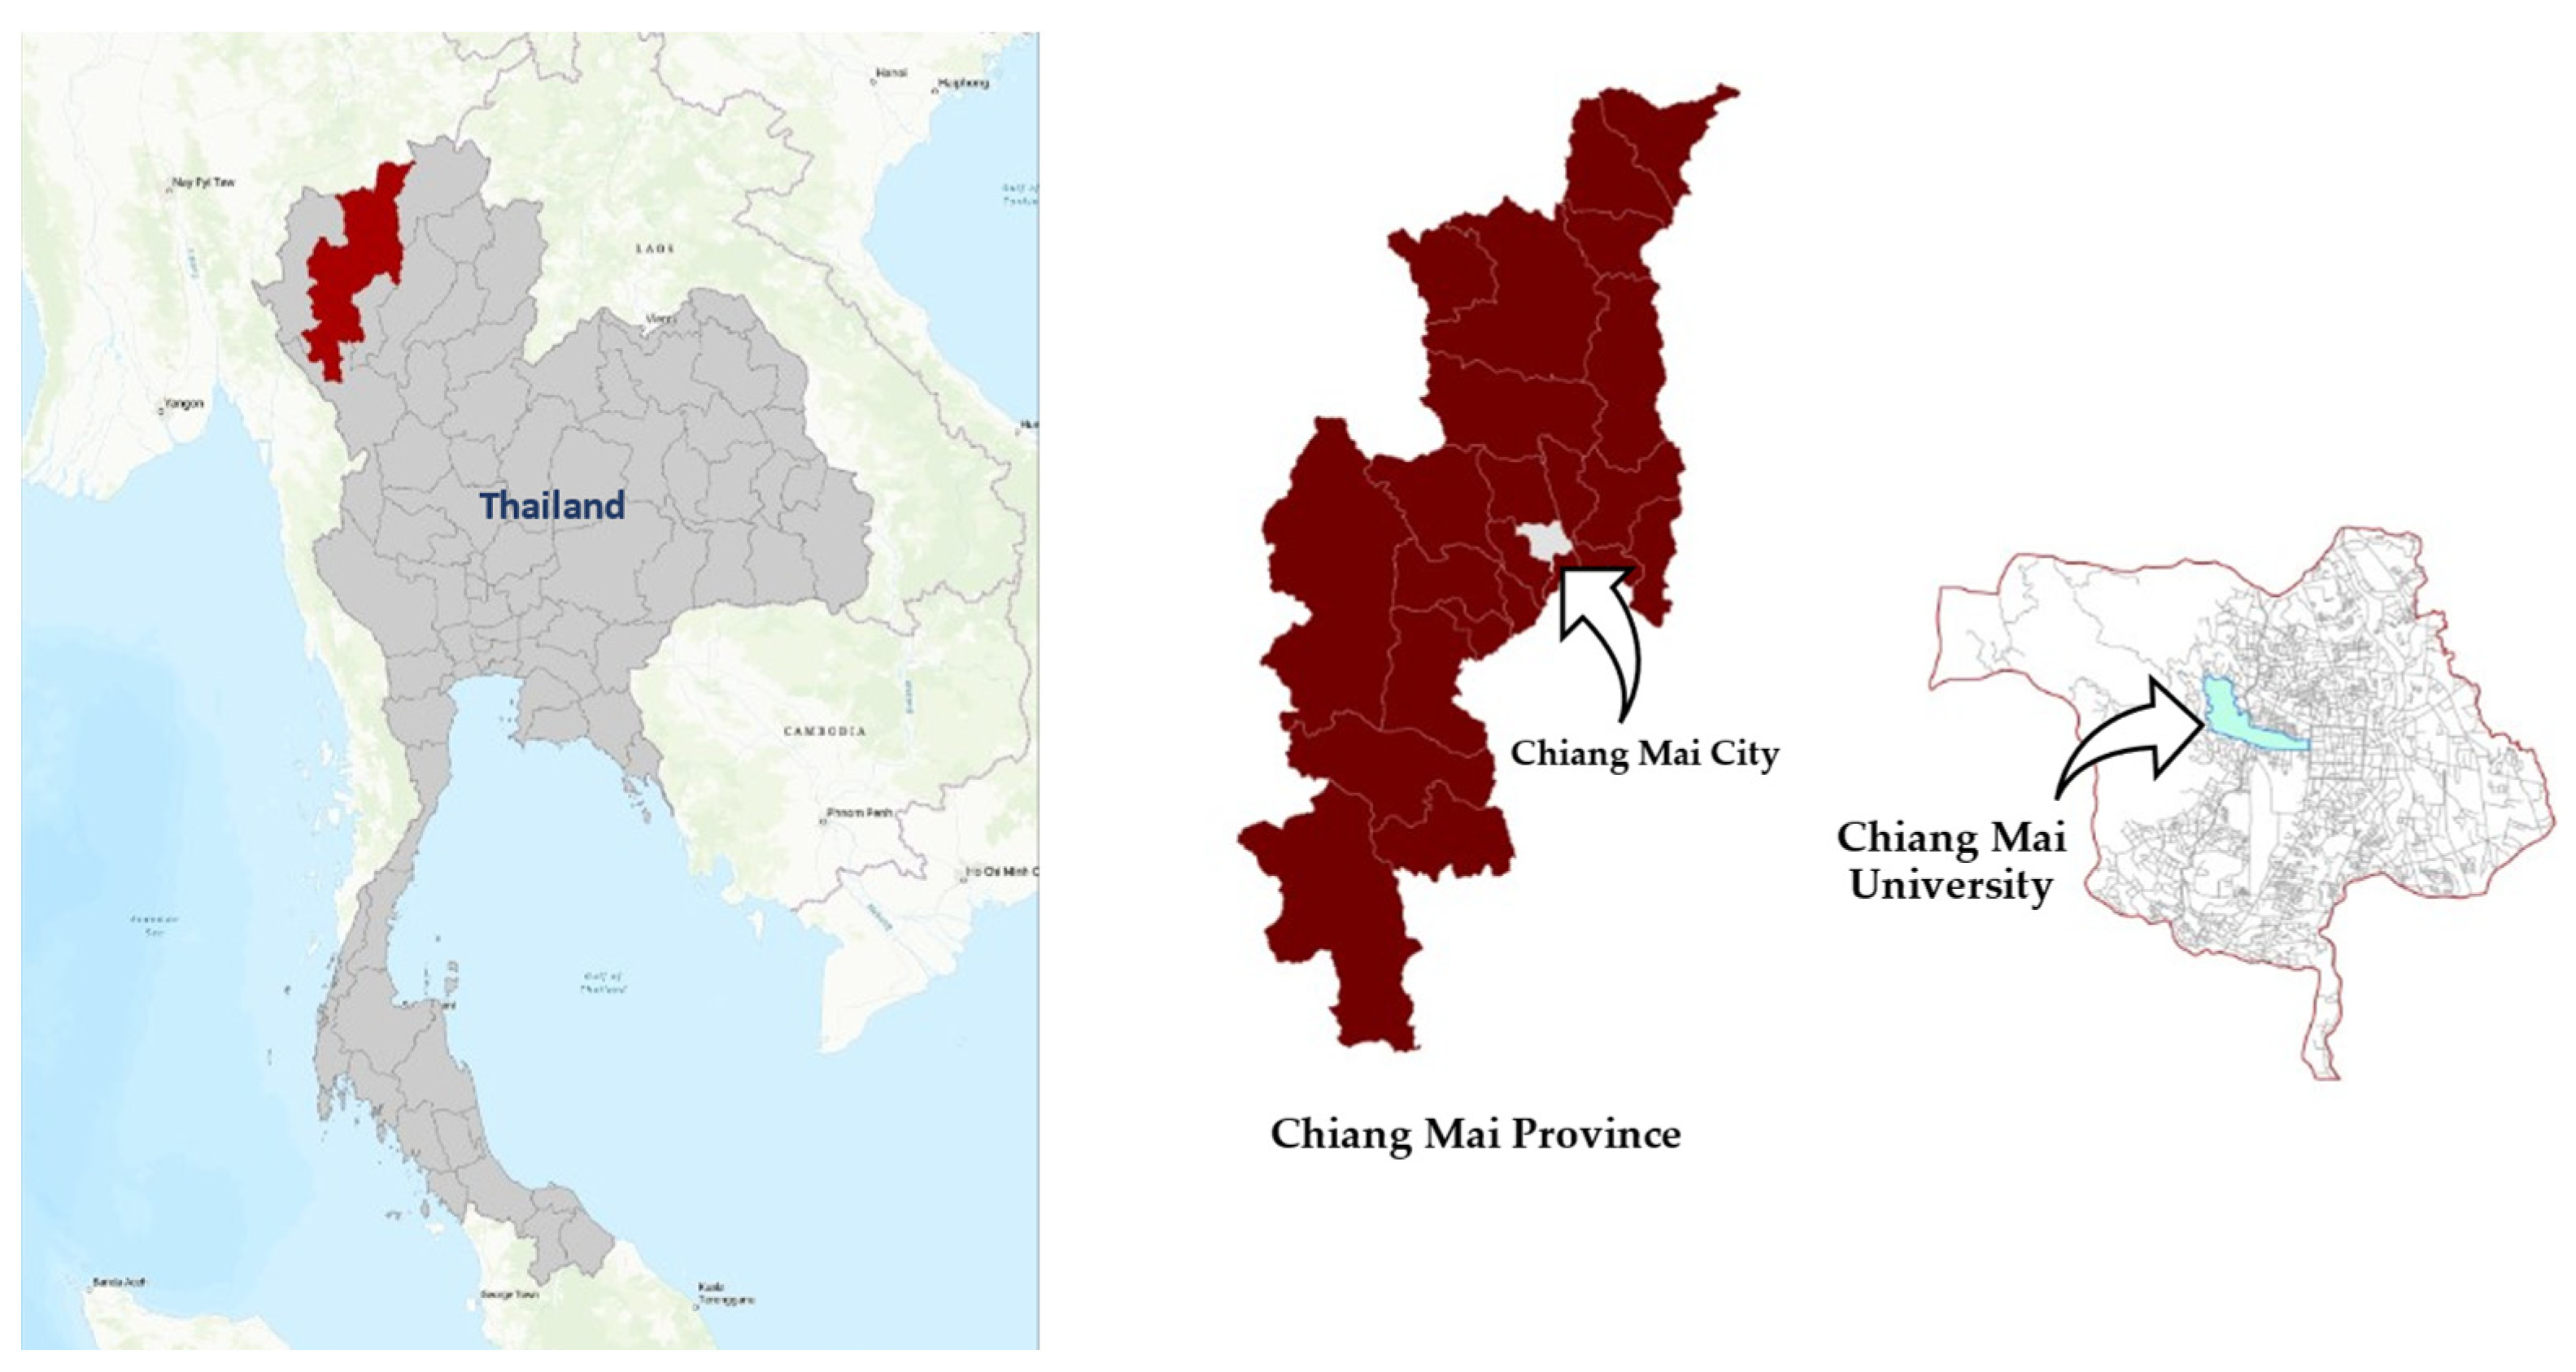
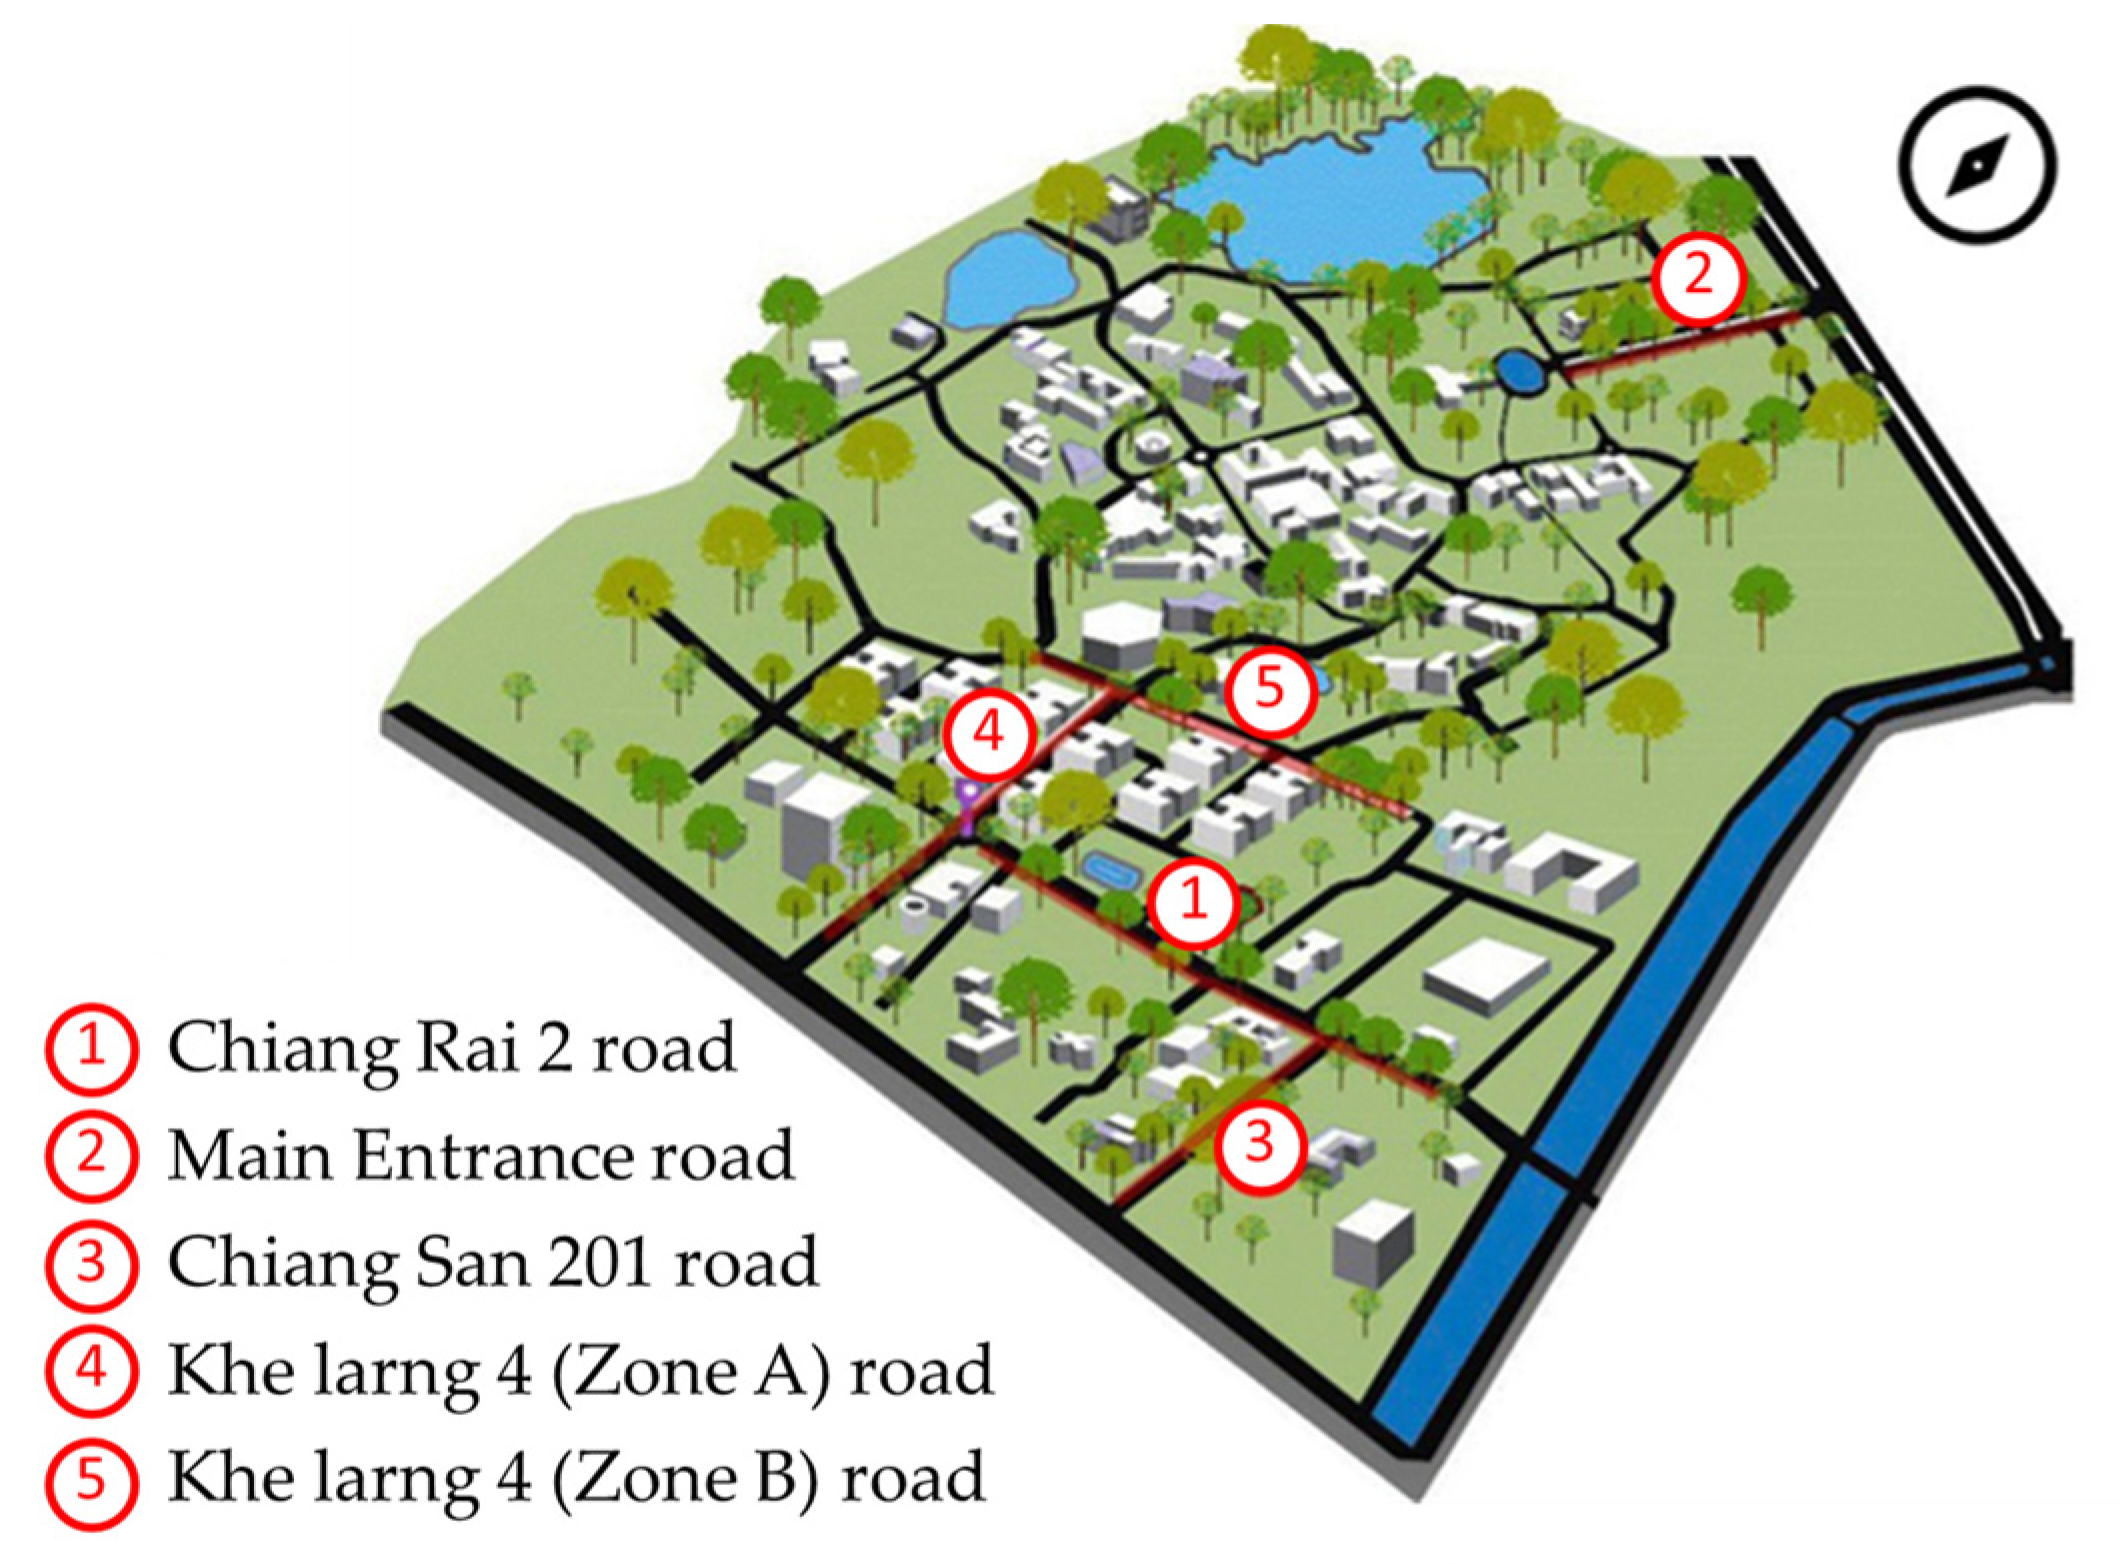
3.1. Defining the Study Area

This study was carried out from June to October in 2021 at Chiang Mai University (CMU) in Chiang Mai City, Thailand, as shown in Figure 2. Its campus is in the northern region of Thailand at longitude 99.0° E, latitude 18.8° N, and 310 m above the mean sea level, AM. The main campus lies about 5 km west of the city center. According to Thai Meteorological Department, the historical data between 2012 and 2021 showed that from June to October, the mean temperature was 27.8 °C and the average relative humidity is 76.5% in the study area.
The campus of Chiang Mai University (CMU) is one of the large green spaces in Chiang Mai City. The main campus occupies a 2.93 sq.km site. It has approximately 40,000 students and education personnel each year. With this size of population, there are transportation-related issues during semesters, such as traffic congestion and insufficient public transportation. Walking and cycling are great choices of travel modes within the campus, especially between classroom periods. Walking is promoted by the large green area and plenty of trees along the roadside. In this study, five campus walkways were selected based on their designs as listed below (see Figure 3):
  • Walkway with sparse trees on one side: Chiang Rai 2 road;
  • Walkway with sparse trees: Main entrance road;
  • Walkway with dense trees: Chiang San 201 road;
  • Cantilever-covered walkway with sparse trees: Khe Larng 4 (Zone A) road;
  • Open-sided covered walkway with sparse trees: Khe Larng 4 (Zone B) road.
These five pedestrian walkways are different in physical and environmental conditions. The walkways are 1.8–2.0 m wide and are made from concrete blocks. The conditions and cross-sections of walkways are shown in Figure 4, Figure 5, Figure 6, Figure 7 and Figure 8, which correspond to walkways No. 1 to No. 5, respectively.
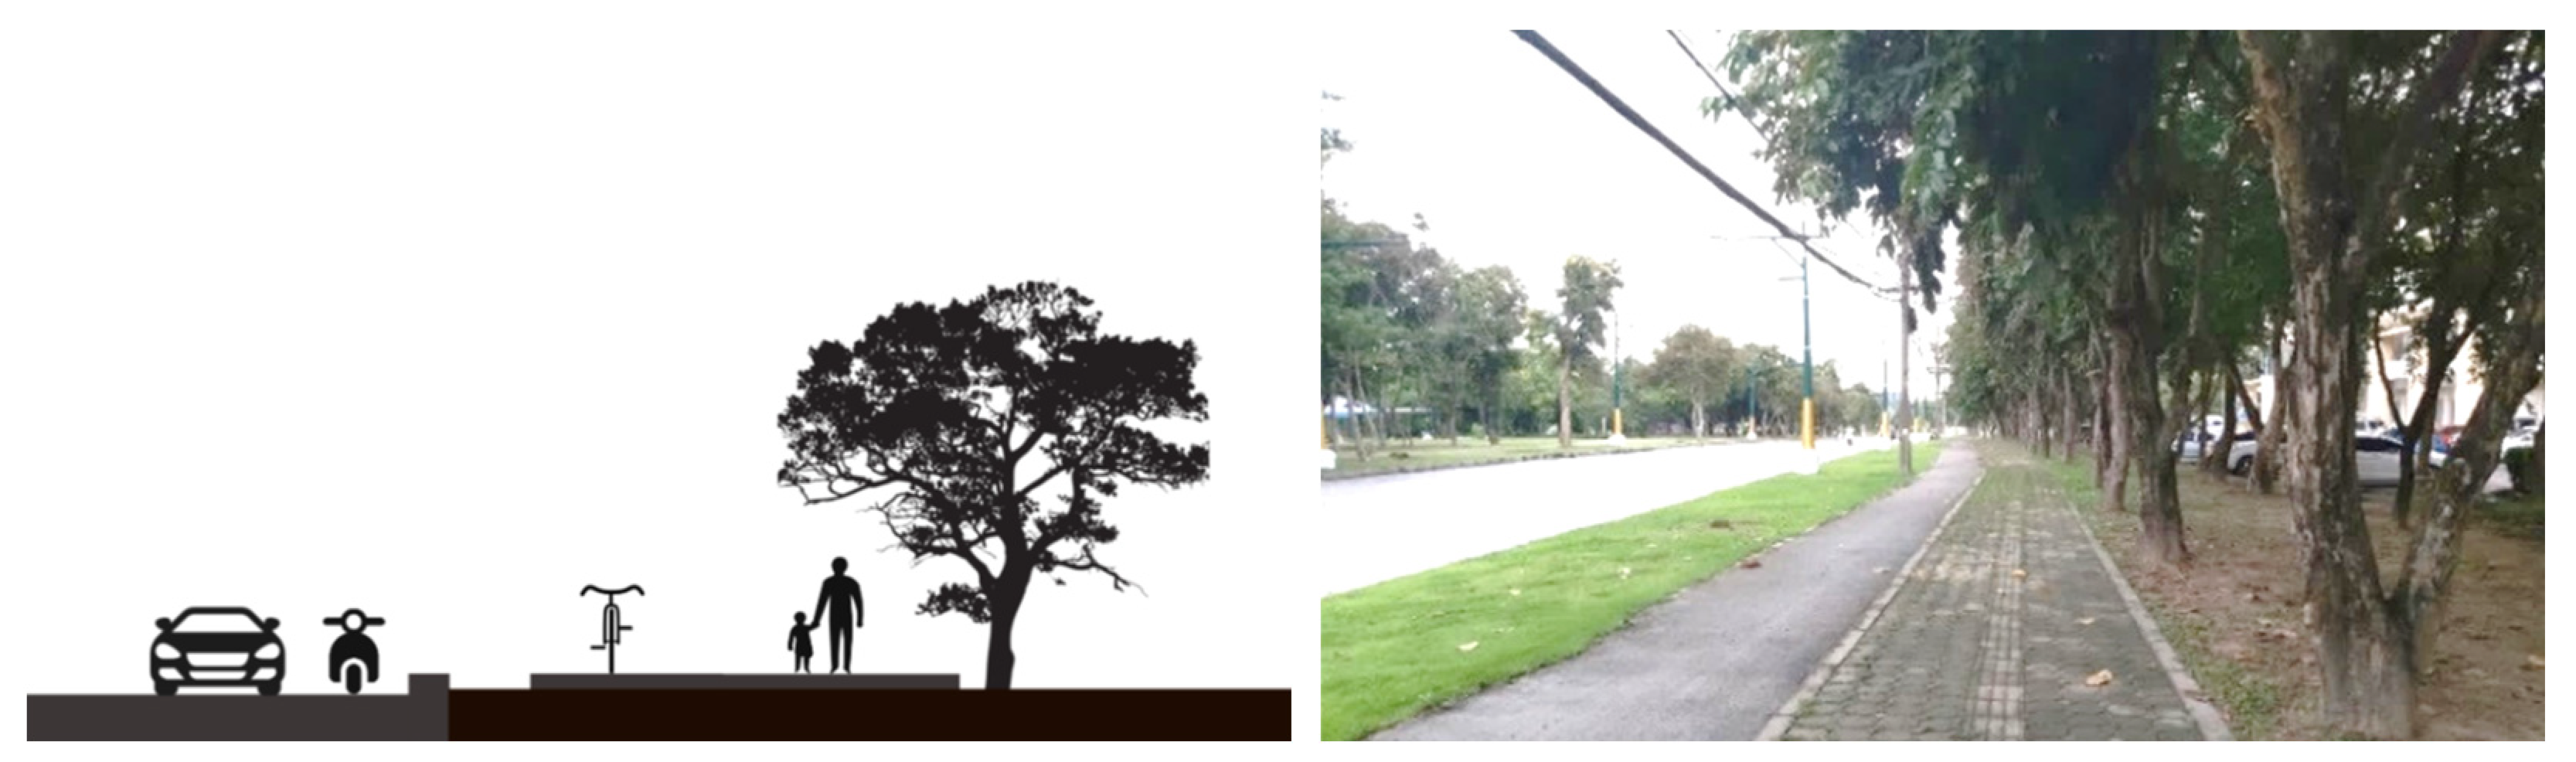
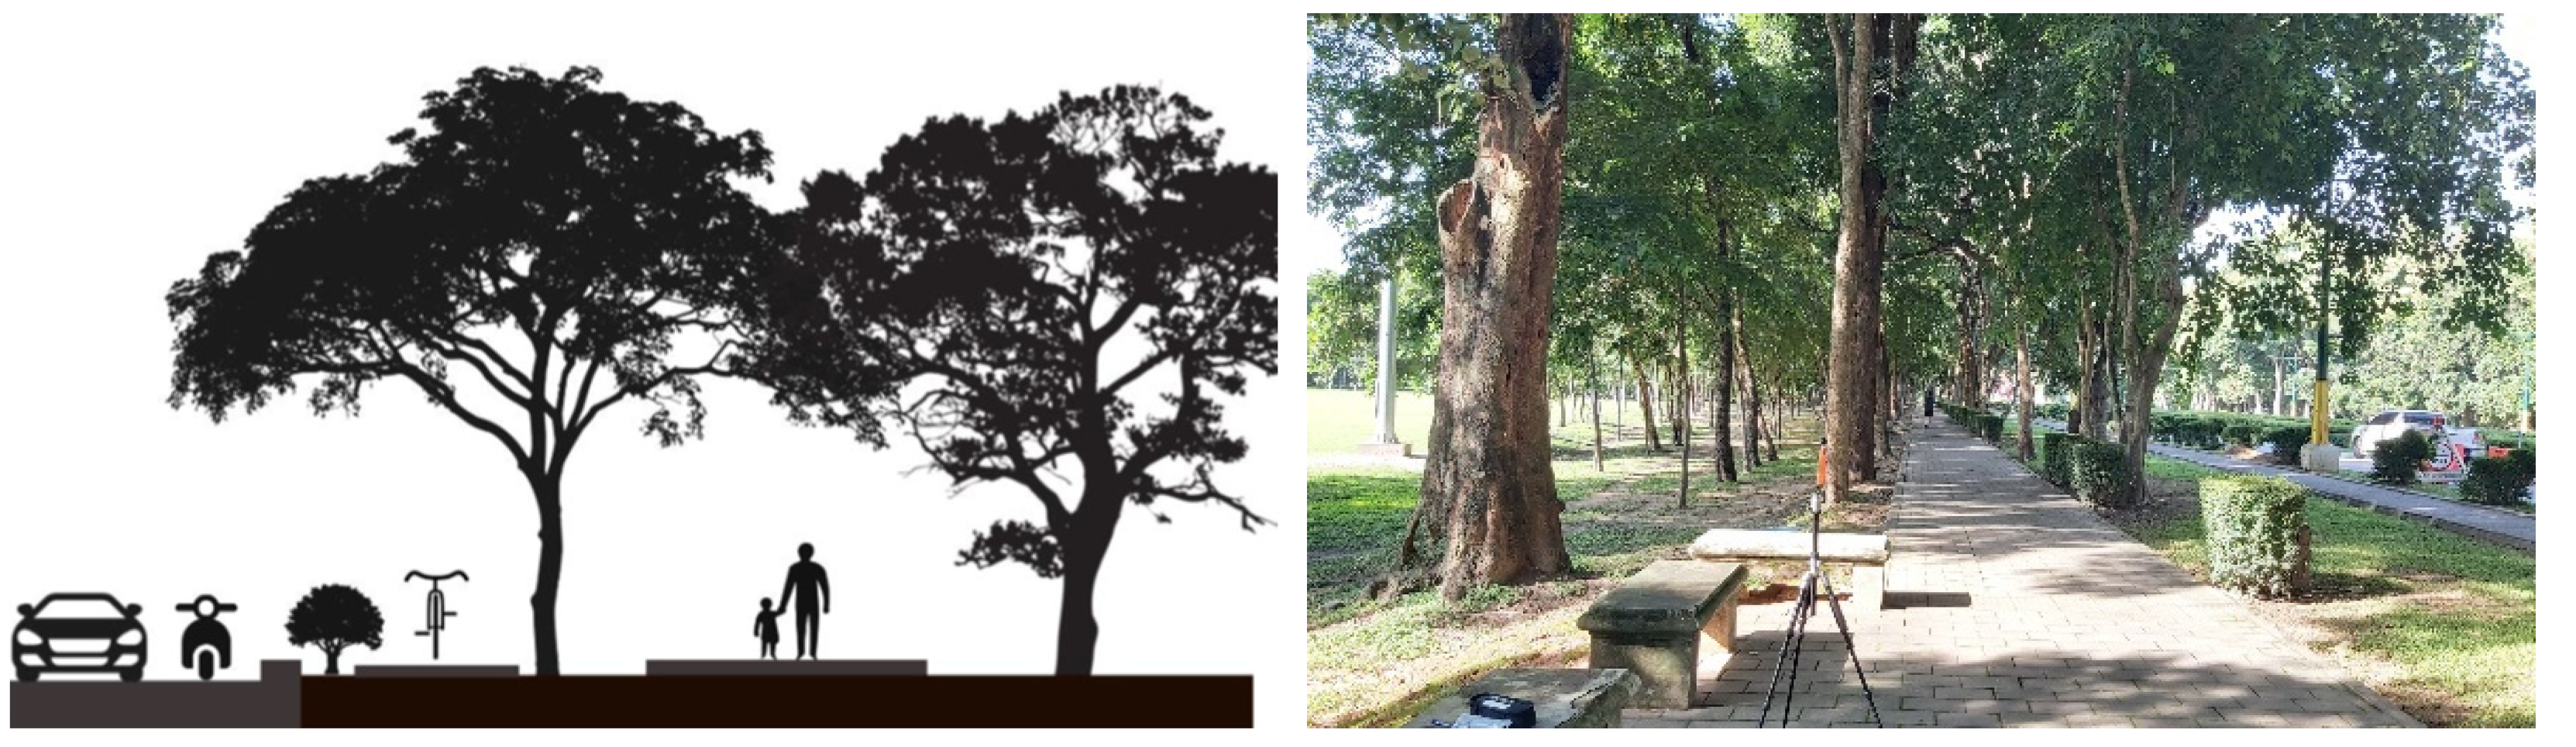
  • Walkway No. 1 (walkway with sparse trees on one side) consists of a pedestrian walkway and bike lane along the road. The walkway is surrounded by tall and sparse trees on one side of the walkway (see Figure 4).
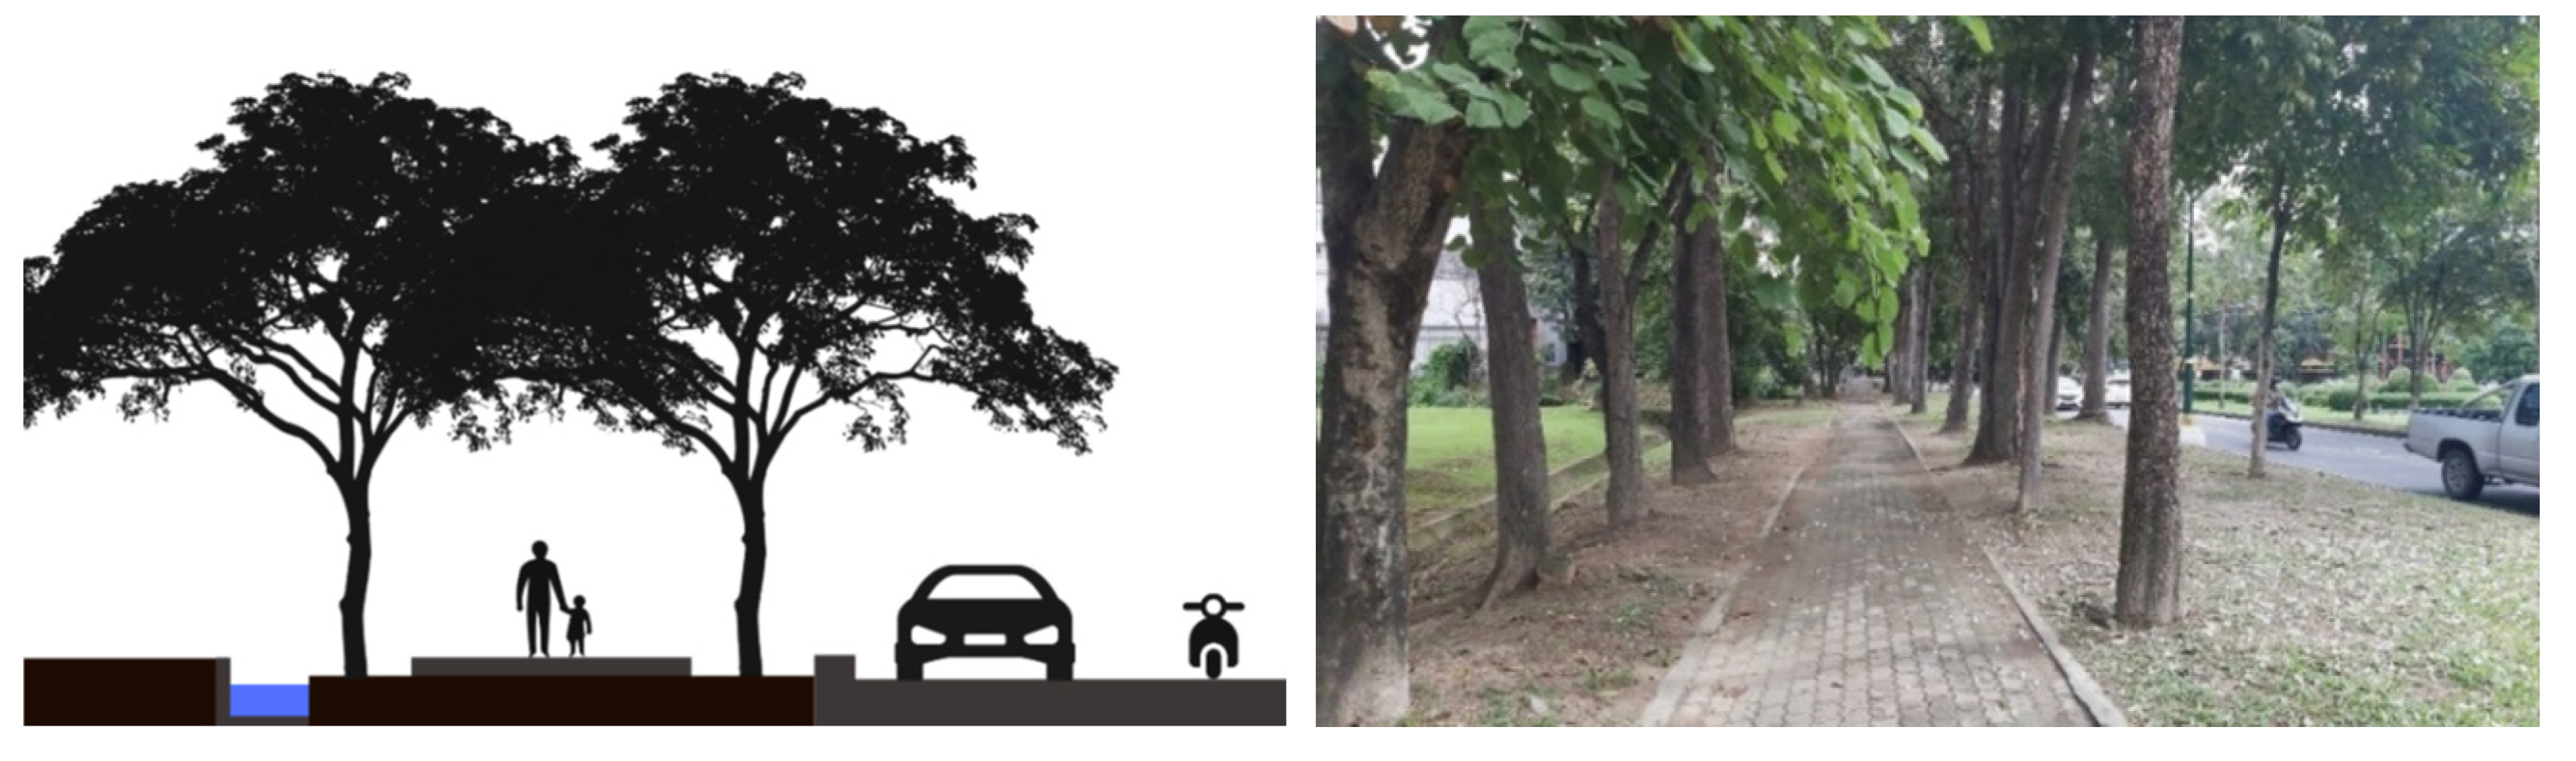
  • Walkway No. 2 (walkway with sparse trees) consists of a pedestrian walkway surrounded by tall and sparse trees on both sides of the walkway (see Figure 5).
  • Walkway No. 3 (walkway with dense trees) consists of a pedestrian walkway surrounded by a large number of trees along the walkway (see Figure 6).
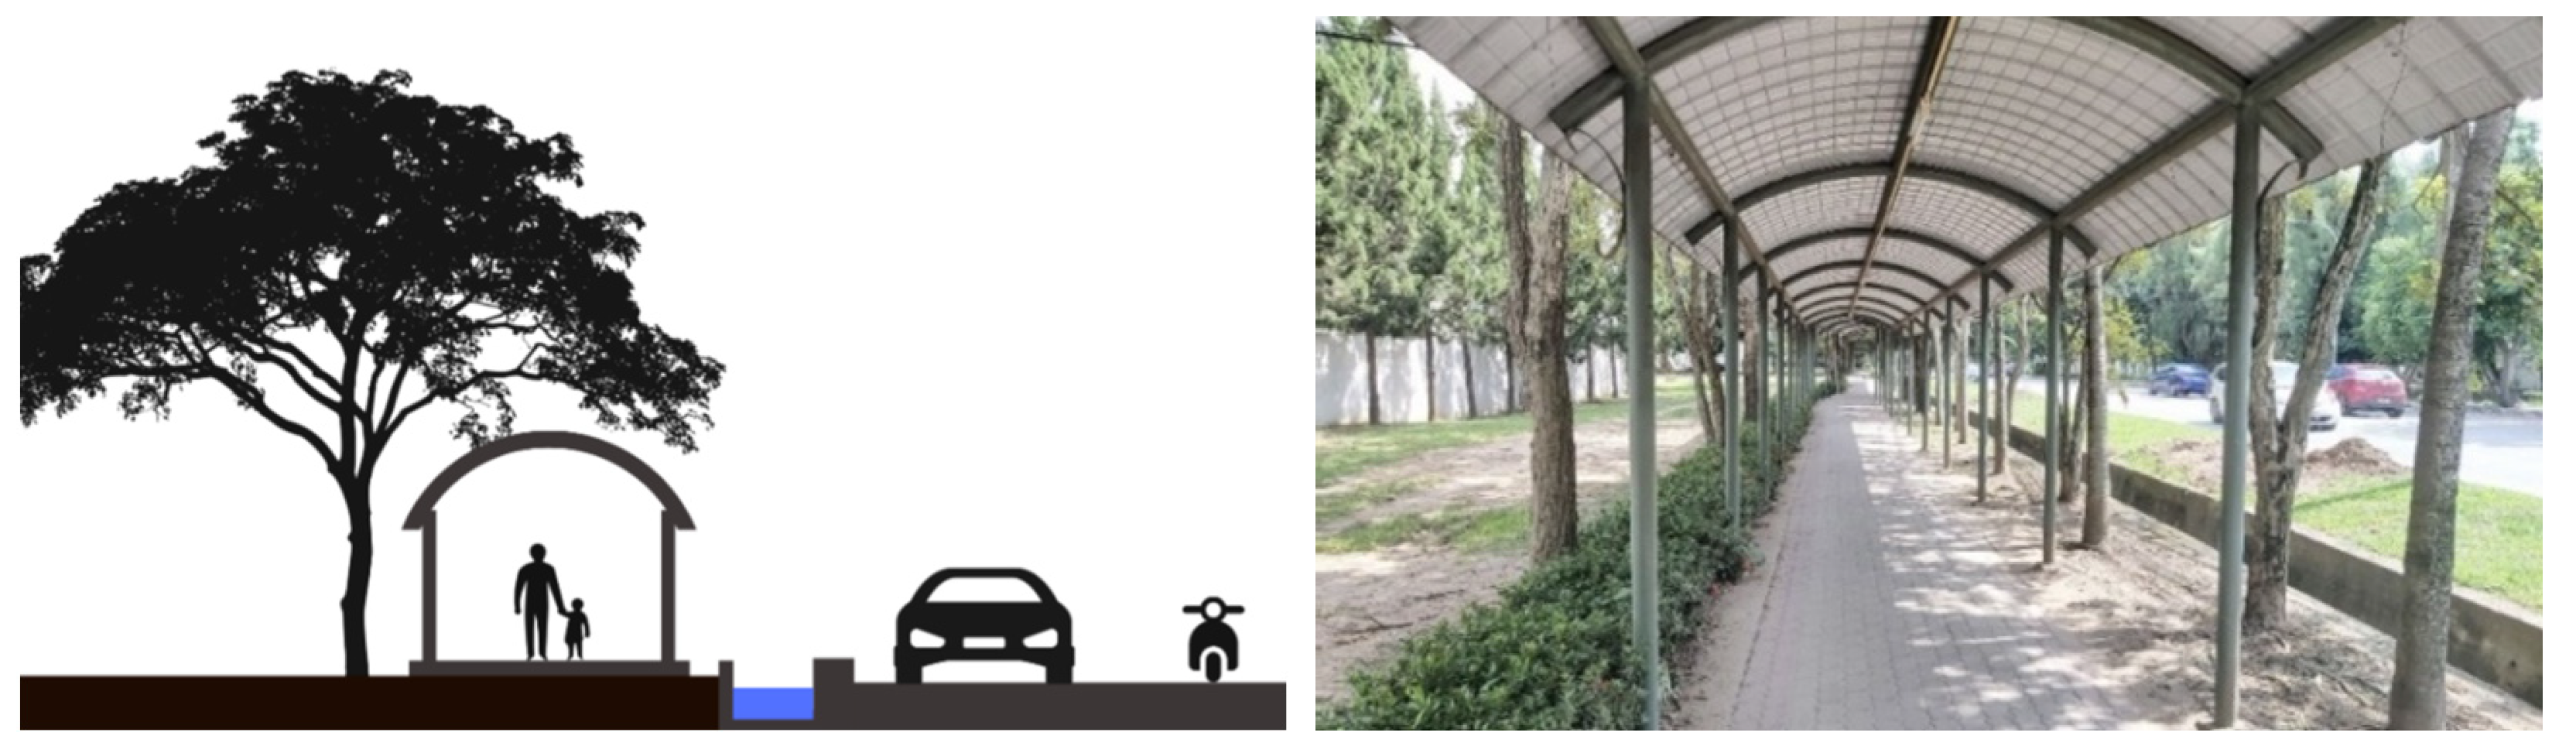
  • Walkway No. 4 (open-sided covered walkway with sparse trees) consists of a pedestrian walkway with open-sided covers surrounded by tall and sparse trees on one side of the walkway (see Figure 7).
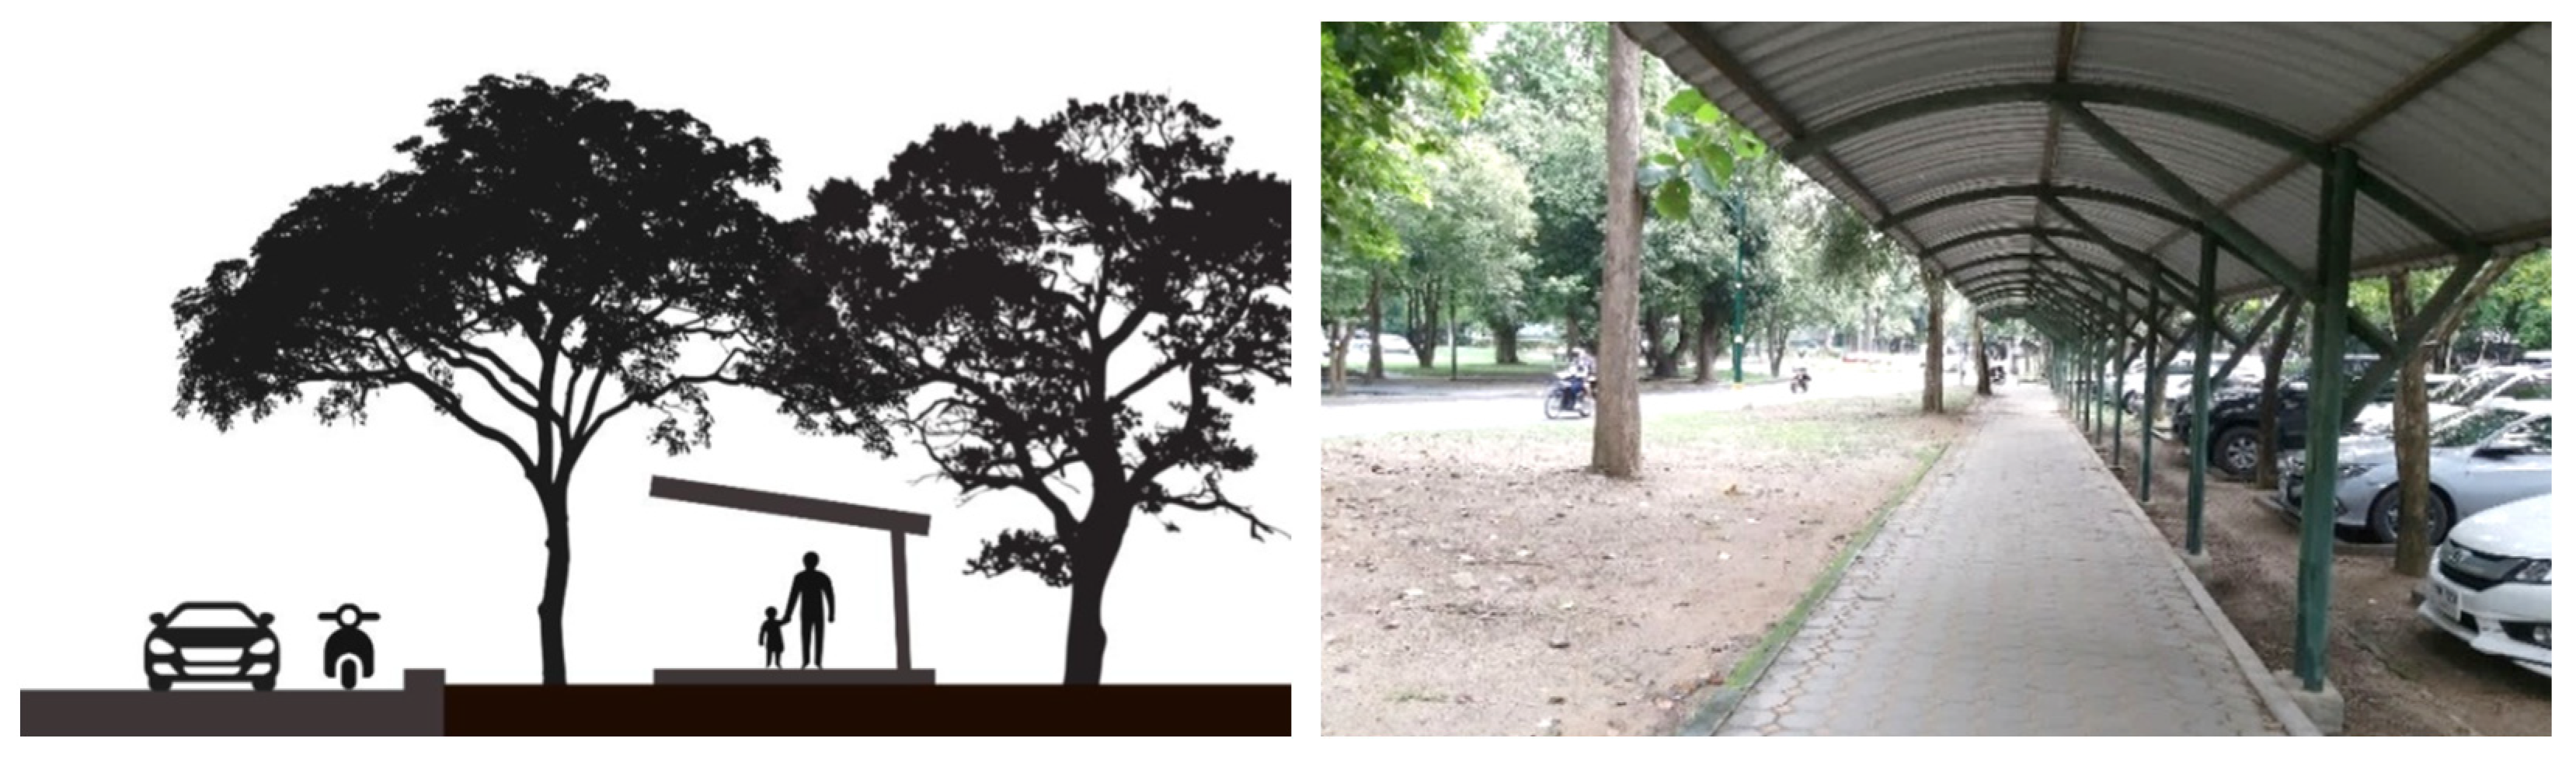
  • Walkway No. 5 (cantilever-covered walkway with sparse trees) consists of a pedestrian walkway with cantilevered covers surrounded by tall and sparse trees on both sides of the walkway (see Figure 8).

3.2. Collecting Data

This study employed questionnaire surveys and field measurements to collect environmental and personal parameters affecting the thermal comfort of walkways in the study area. Data collection was conducted from June to October during the semester from 10.00 a.m. to 5 p.m.

3.2.1. Microclimate Monitoring

A field measurement was conducted to collect the environmental and microclimate conditions on different walkways. This study utilized the Kestrel 5400 BGT Heat Stress Tracker and Weather Meter (Nielsen-Kellerman, Boothwyn, PA, USA), a micrometeorological measurement tool for measuring various environmental parameters, including air temperature, relative humidity, wind speed, and mean radiant temperature. Moreover, a fish-eye lens was employed for photographing and calculating the sky view factor, providing insights into the proportion of sky visible in the surroundings. These data can be used to calculate the PET accordingly.

3.2.2. Questionnaire Survey

A questionnaire survey was carried out to collect the personal characteristics and subjective thermal comfort of pedestrians. In this study, a sample size of 400 (n = 400) was collected using face-to-face interview surveys. The sample size was calculated by equation 1 developed by Cochran (1977) [57] to maintain a 5% margin of error, e = 0.05, at a 95% confidence level by taking a population variability of 50% males (p = 0.5), Z-score of 1.96, and population size of 40,000 (N = 40,000).
S a m p l e   s i z e = Z 2 × p × 1 p e 2 1 + Z 2 × p × 1 p e 2 × N
The questionnaire was divided into three parts. The first part documented the personal information (i.e., gender, age, height, and weight). The second part recorded the respondents’ thermal adaptation, including their thermal experience, activity type, and clothing condition. The third part requested that the participants record their instantaneous comfort status. The thermal comfort was judged on the 7-point thermal sensation vote (TSV) scale [22] (i.e., −3, cold; −2, cool; −1, slightly cool; 0, neutral; +1, slightly warm; +2, warm; and +3, hot).

3.3. Analysis of Physiological Equivalent Temperature

This study analyzed the PET based on data collected from field and questionnaire surveys. PET is a common indicator to describe outdoor thermal comfort. PET is defined as the air temperature at which the heat load of the human body in a typical indoor arrangement is equivalent to the skin temperature under outdoor conditions in which it is assessed [45]. This index was chosen due to its flexibility in estimating meteorological variables within the study area and the physiological characteristics of pedestrians.
In this study, PET was estimated using RayMan model 1.2, which is developed for urban climate studies. PET can be derived from environmental and personal factors such as air temperature, relative humidity, wind velocity, mean-radiant temperature, clothing insulation, and metabolic rate, together with the Sky View Factor, which is provided from a 180° fish-eye lens picture, as shown in Figure 9.

3.4. Determination of Thermal Acceptability Range

To determine the thermal comfort and its acceptable range, the neutral PET (physiological equivalent temperature) was analyzed based on the mean thermal sensation vote (MTSV) and thermal acceptability data of sample pedestrians [58]. The linear relationship between the PET and mean thermal sensation vote (MTSV) was determined, and the MTSV was set to 0 in the equation to calculate the neutral temperature of pedestrians. The thermal acceptability range is the range of PET (°C) that covers at least 80% of thermal acceptability votes.

4. Results and Discussion

The findings of this research are twofold. First, this study assessed the thermal condition of walkways using PET and assessed the thermal perception of pedestrians in different walkway conditions using the thermal sensation vote. Second, this study determined the thermal comfort and its acceptable range for pedestrians in the study area.

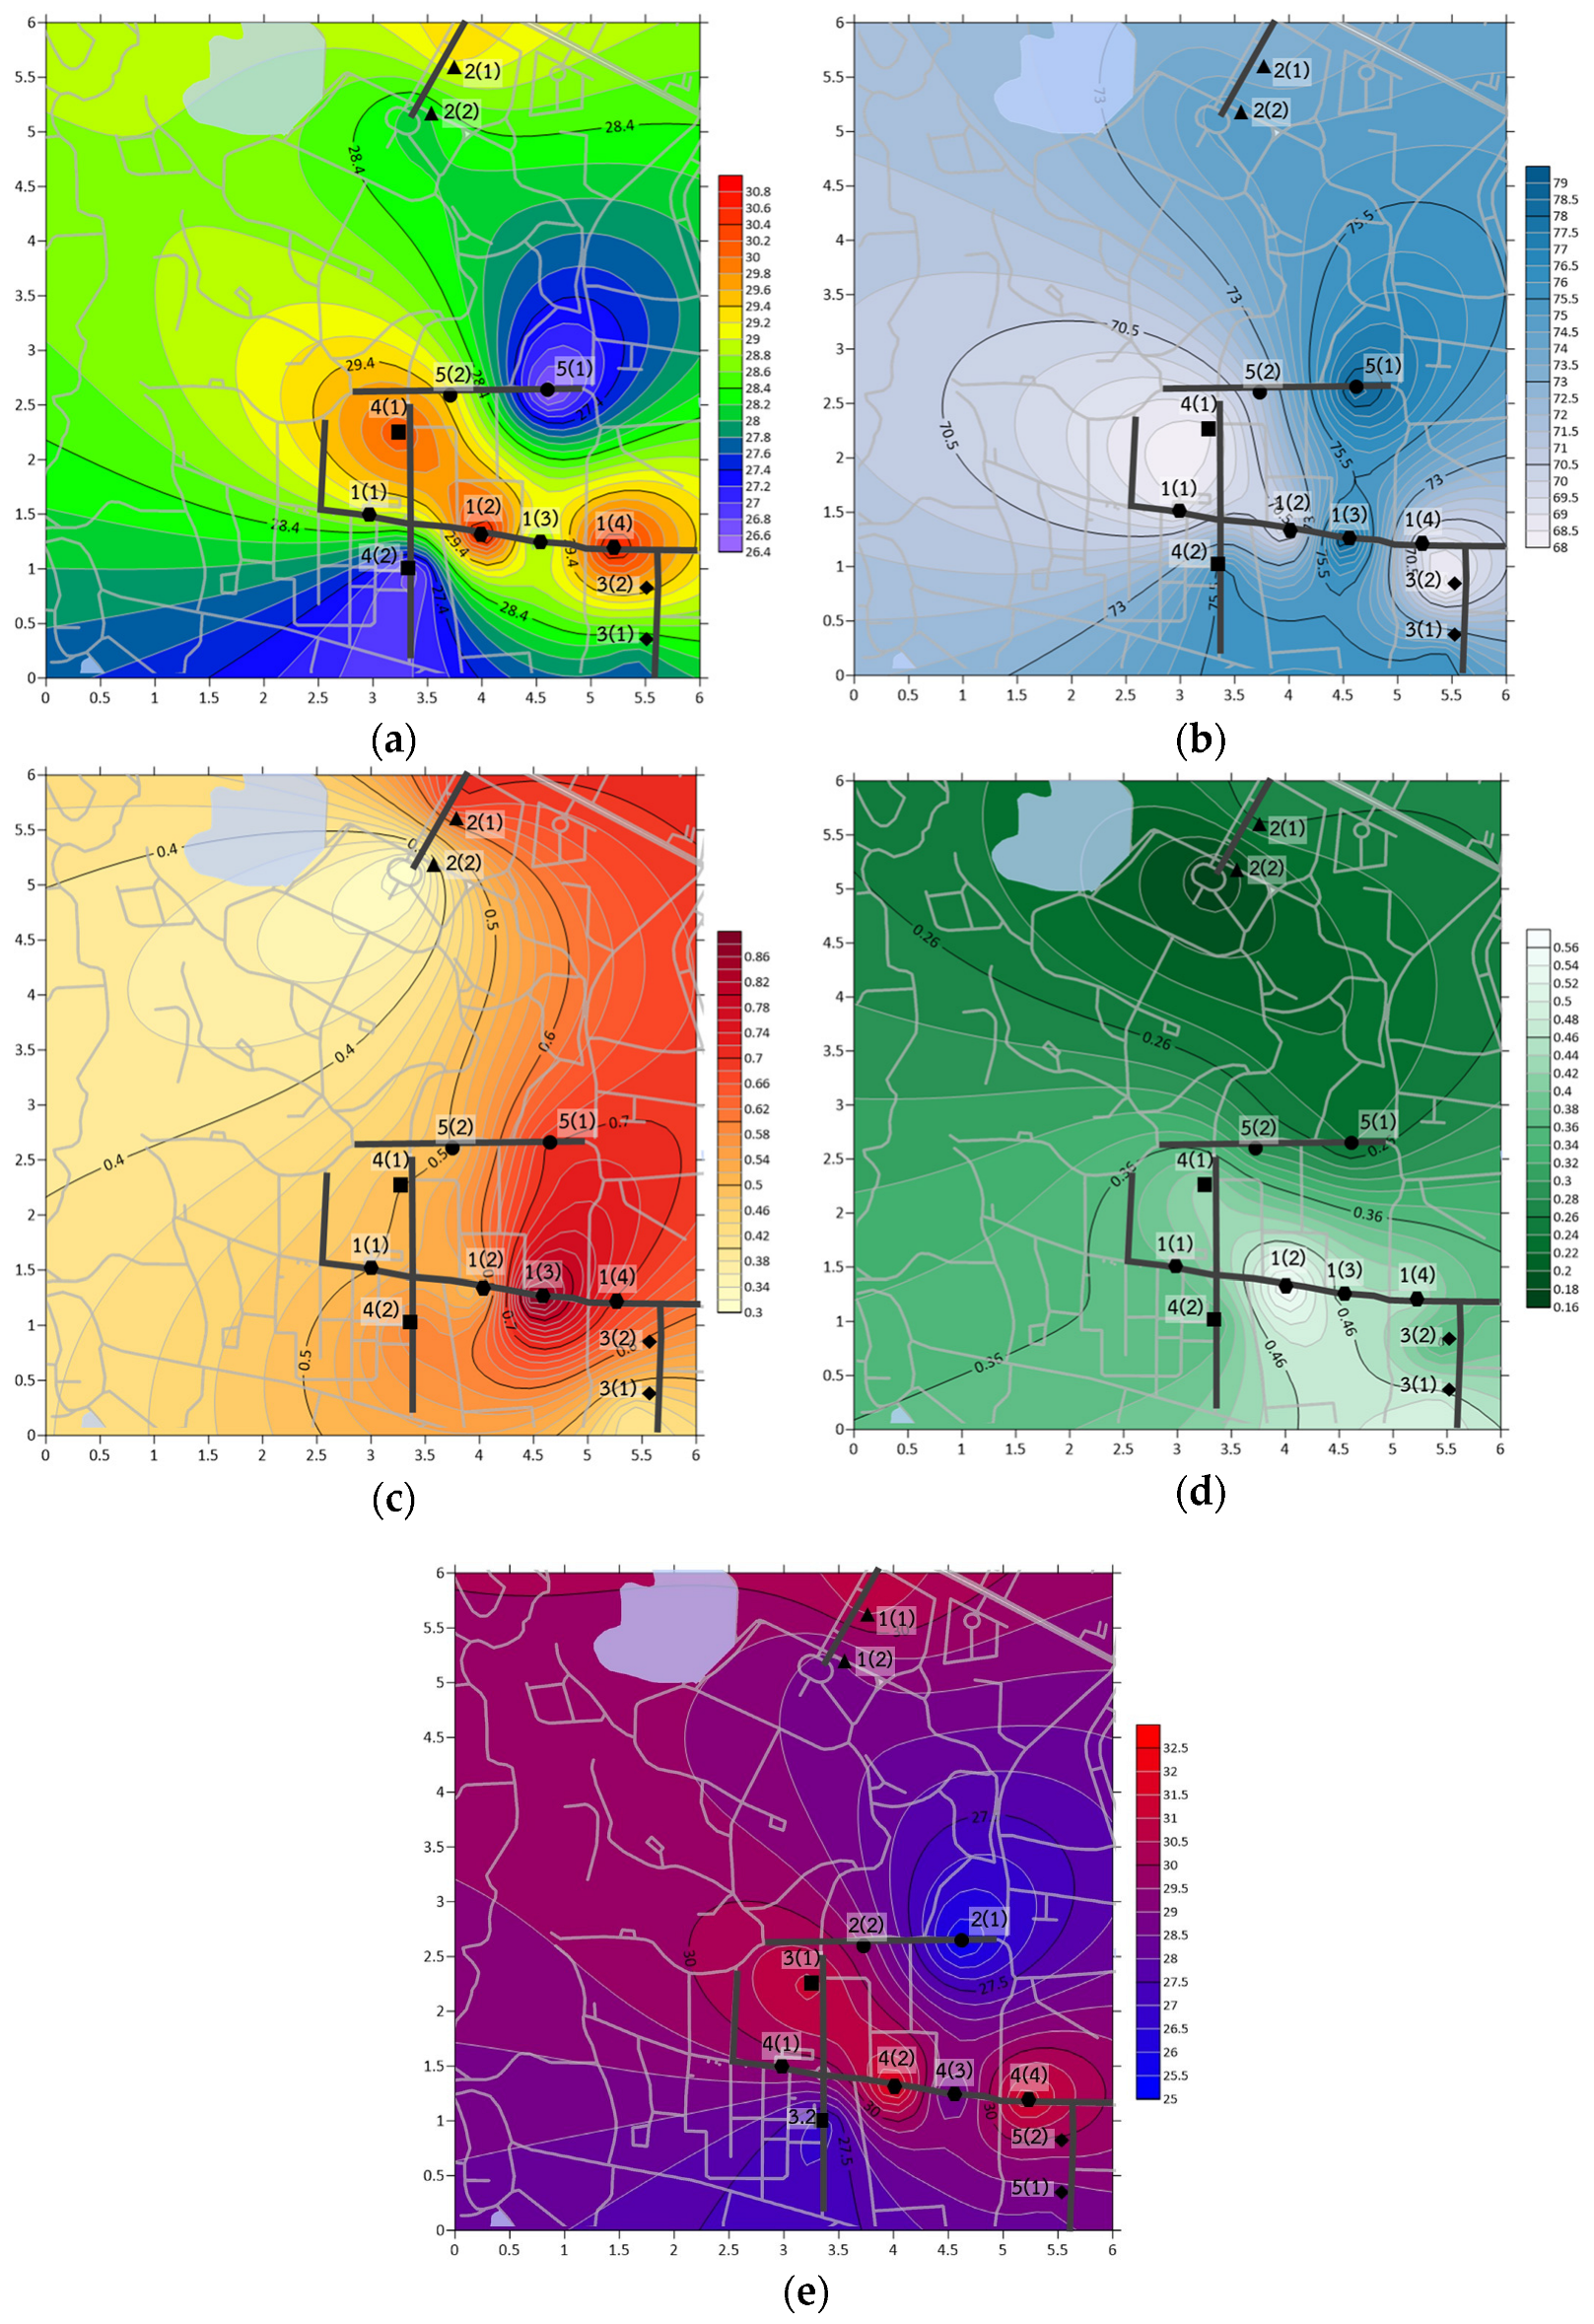
4.1. Assessment of Physiological Equivalent Temperature and Thermal Sensation Vote

This study assessed the outdoor thermal comfort conditions of pedestrian walkways in the Chiang Mai University campus using on-site questionnaire surveys and in situ measurements.
Based on the questionnaire surveys, the personal factors of pedestrians along five walkways were recorded. The basic statistical data on personal factors associated with each walkway are shown in Table 2. The data included gender, age, weight, height, Body Mass Index (BMI), and clothing insulation (clo). The survey results showed that most samples are young females with an average age of 21.6 years old, an average BMI of 21.5, and an average clo of 0.55.
Based on the field measurements, environmental factors at different locations along five walkways were recorded. The basic statistical data on environmental parameters associated with each walkway are shown in Table 3, including air temperature (Ta), relative humidity (RH), wind velocity (Va), mean-radiant temperature (Tmrt), and sky view factor (SVF). The results showed that air temperature (Ta) and relative humidity (RH) are moderate to high, with an average Ta of 0.57 m/s and an average RH of 30.3 °C. The sky view factor varies from the highest of 0.57 at walkway No. 1 to the lowest of 0.16 at walkway No. 2.
Using these environmental and personal data, PET values can be calculated for each pedestrian walkway. The PET results showed that the lowest average PET is 27.3 °C for walkway No. 5 (cantilever-covered walkways with sparse trees), while the highest average PET is 30.7 °C for walkway No. 1 (walkways with sparse trees on one side).
Figure 10 illustrates the contour maps associated with the environmental factors and PET in the study area. The maps were created using OriginLab 2020 (9.7) program. Figure 10a indicates that the air temperature is the lowest along walkways No. 4 and 5, and the highest along walkway No. 1. Figure 10b illustrates that relative humidity tends to be higher in low-temperature areas. Walkway No. 5 has the highest relative humidity, followed by some parts of walkways No. 1 and No. 4. Figure 10c presents the wind velocity in the study area. The areas with the highest wind speed are some parts of walkways No. 1, No. 2, and No. 5. Figure 10d shows the sky view factor (SVF) or the proportion of visible sky, which represents the density of shade trees in the area. Walkway No. 2 has the lowest SVF, implying the most amount of tree shade, while walkway No. 1 has the highest SVF or the lowest density of tree shade. Figure 10e presents the PET distribution in the study area.
Besides the thermal conditions of the walkways, this study assessed the thermal perception of pedestrians along the walkways in the study area. Figure 11 presents the percentages of thermal sensation vote (TSV) classified into seven levels (i.e., cold, cool, slightly cool, neutral, slightly warm, warm, and hot) concerning five campus pedestrian walkways. The result shows that for all campus walkways, the highest TSV percentage (34.5%) was slightly warm (TSV = +1), and 18.8% of pedestrians felt neither too hot nor too cold. The highest TSV percentage of walkway No. 5 was neutral (TSV = 0), while that of walkway No. 3 was slightly warm (TSV = +1) and those of walkways No. 1, 2, and 4 were warm (TSV = +2). At the neutral sensation level (TSV = 0), walkway No. 5 had the highest votes (37.5%), followed by walkway No. 3 (20.0%), No. 4 (16.3%), No. 2 (13.8%), and No. 1 (6.3%). This can imply that the most comfortable walkway is walkway No. 5 (cantilever-covered walkway with sparse trees), and the least comfortable walkway is walkway No. 1 (walkway with sparse trees on one side).
Figure 12 presents the percentages of acceptable and unacceptable votes for sample pedestrians using walkways No. 1 to No. 5. The results show that most pedestrians accept the thermal condition of campus walkways, albeit at different thermal sensations. Walkway No. 5 (cantilever-covered walkway with sparse trees) and walkway No. 3 (walkway with dense trees) have the highest acceptability (100% both), followed by 90% for walkway No. 4 (open-sided covered walkway with sparse trees), 84% for walkway No. 2 (walkway with sparse trees), and 80% for walkway No. 1 (walkway with sparse trees on one side), respectively.
  • Walkways with sparse trees on one side (No. 1) vs. both sides (No. 2). The walkway with trees on one side (No. 1) produces a higher air temperature than that with trees on both sides (No. 2). The PET of walkway No. 1 is higher than that of walkway No. 2 and slightly higher than the neutral PET. Walkway No. 1 has a higher TSV than that of No. 2, and it has fewer votes at the neutral sensation level (TSV = 0) than that of No. 2. It is clear that pedestrians on the walkway with sparse trees on one side (No. 1) feel less comfortable than those with trees on both sides (No. 2).
  • Walkways with sparse trees vs. dense trees. The results show that the walkways surrounded by either sparse trees (No. 2) or dense trees (No. 3) have the same air temperature and wind speed. The PET of walkway No. 3 is slightly lower than that of walkway No. 2. This may be because walkway No. 3 has dense trees, which cause less light, and walkway No. 2 has tall and open trees, which allow light to reach the walkway. Pedestrians on walkway No. 2 feel hotter than those on No. 3; the thermal sensation vote is higher. Pedestrians on the walkway with sparse trees (No. 2) feel less comfortable than those with dense trees (No. 3).
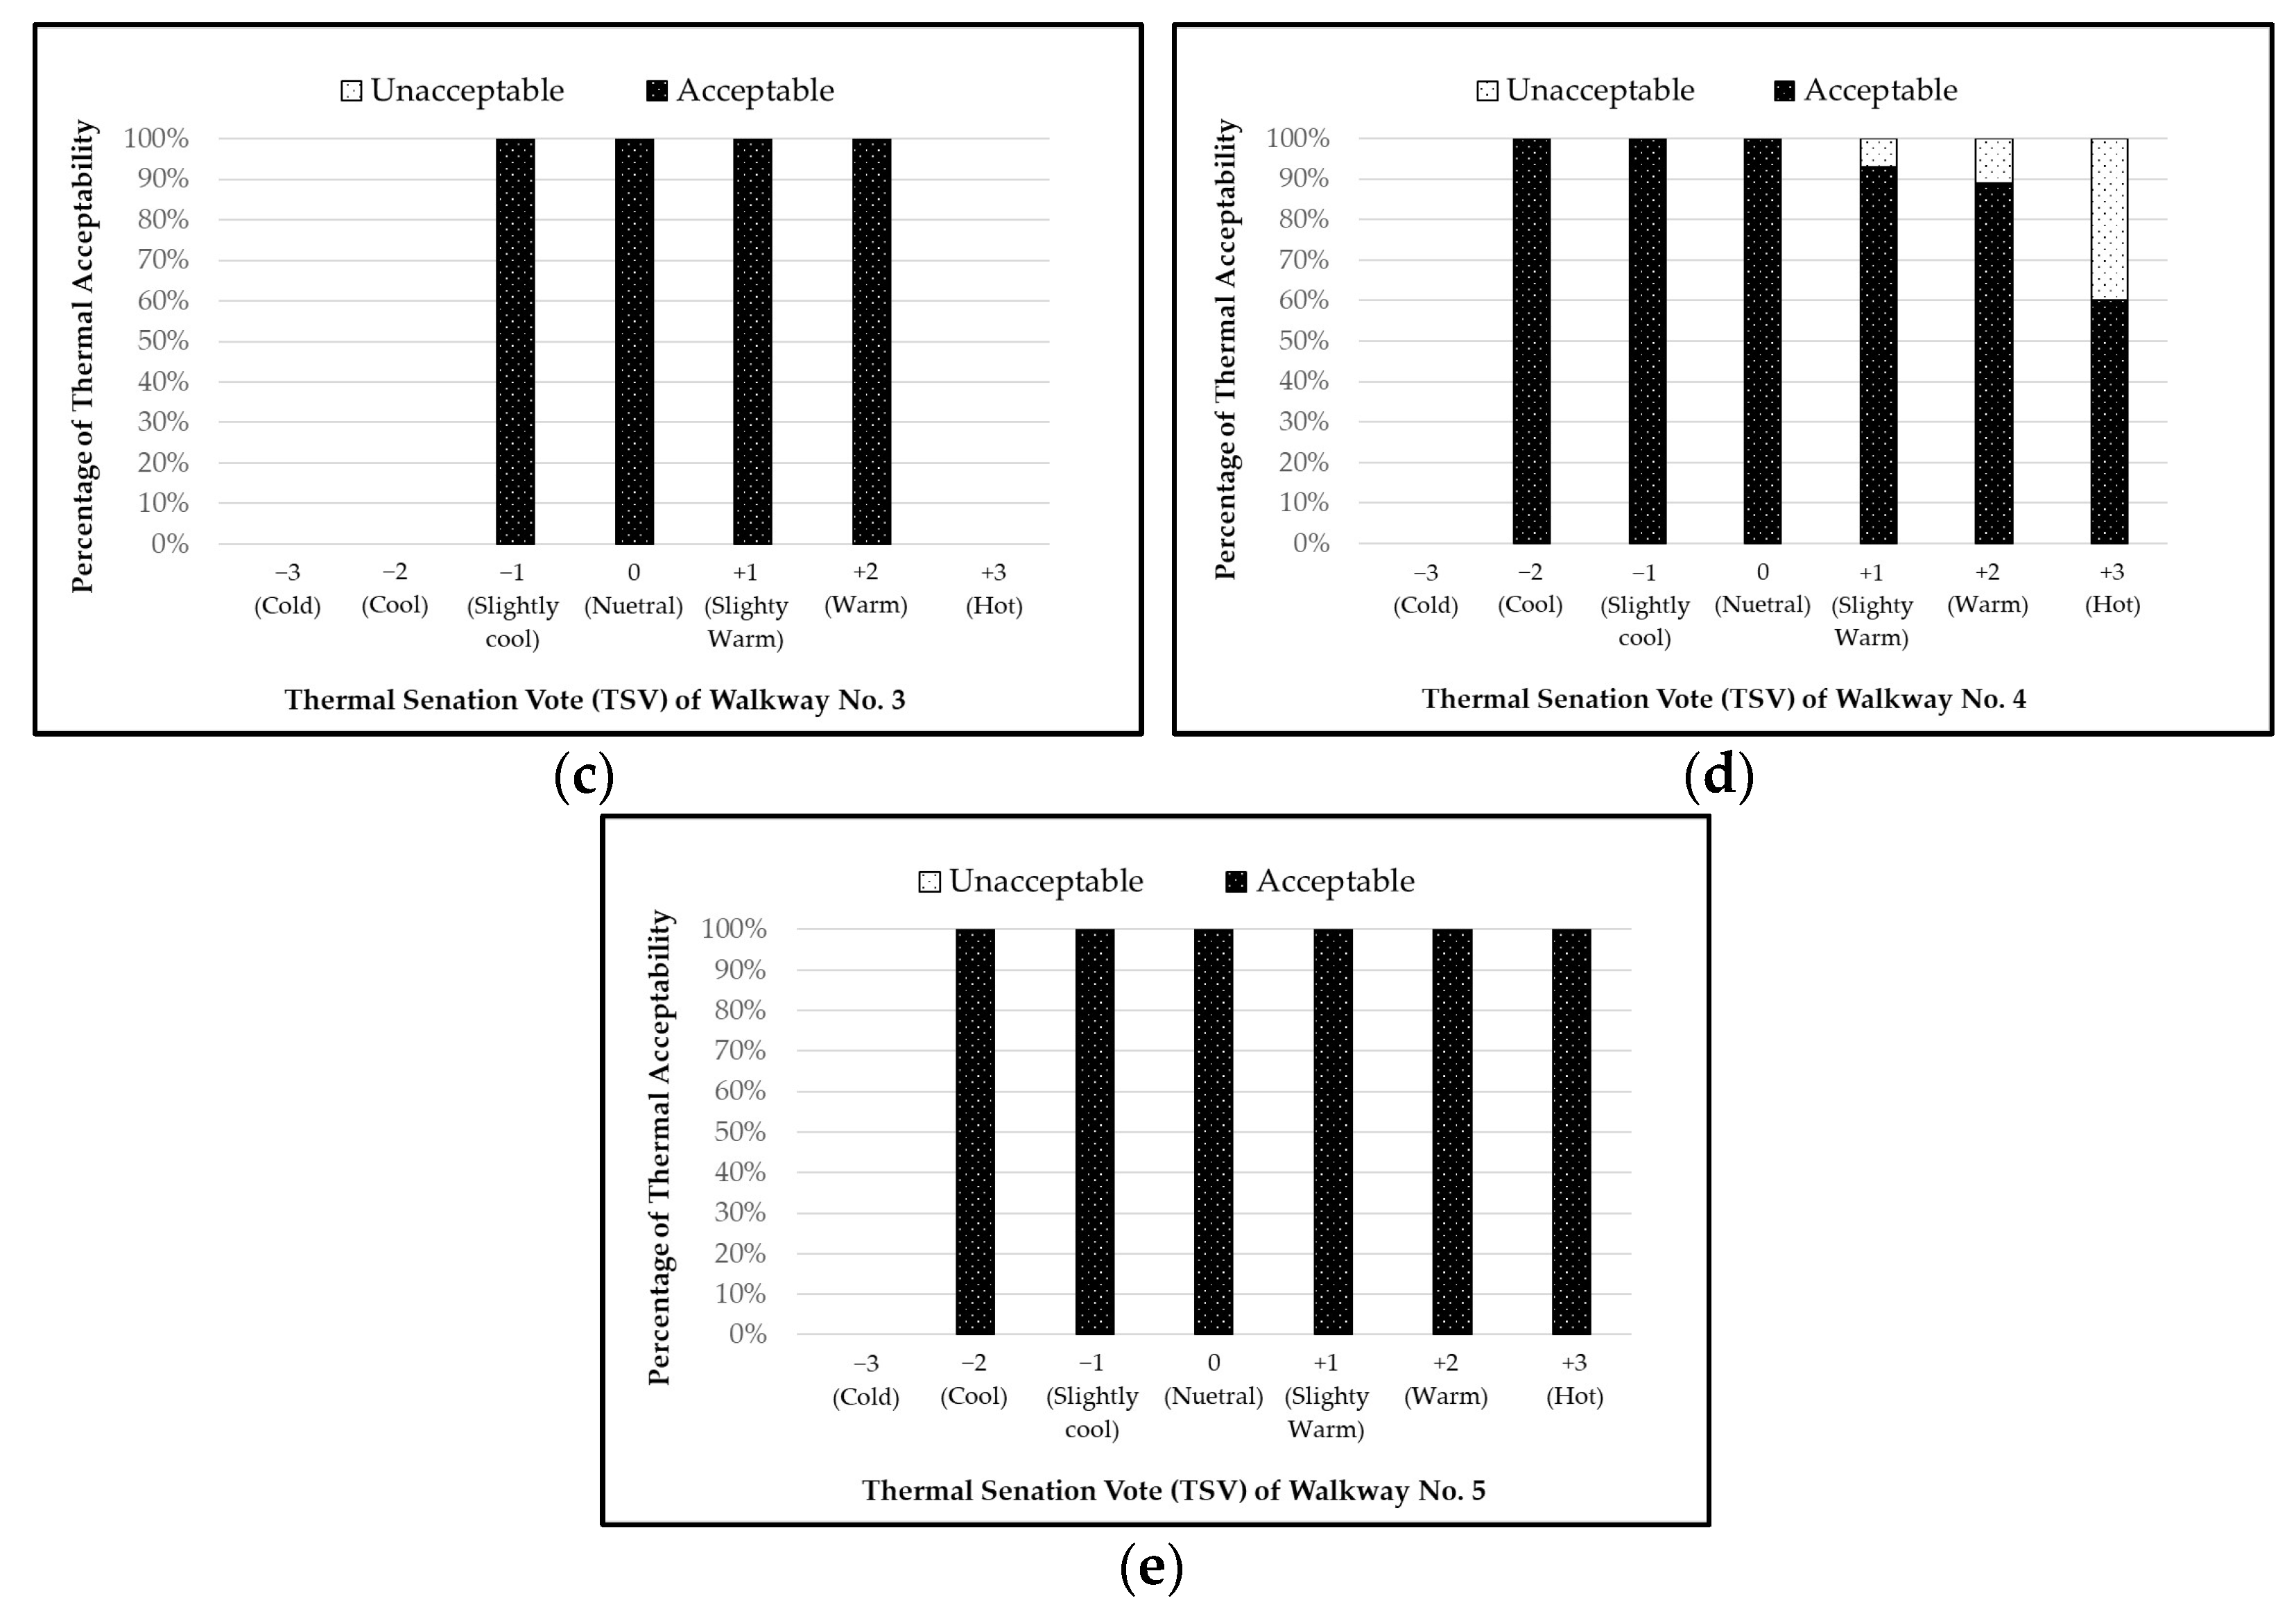
  • Walkways with dense trees vs. covered walkways with sparse trees. The air temperatures of both walkway types are similar, while the wind speed of the covered walkway (No. 4) is slightly higher than that of the walkways with dense trees (No. 3). Walkway No. 3 allows the sunlight to reach the walkway, while walkway No. 4 protects the walkway from direct sunlight. The PET on walkway No. 4 is lower than that on No. 3. The thermal sensation votes of both walkway types are about the same, but walkway No. 4 has a wider thermal acceptability range (from TSV+3 to TSV−2). It can be concluded that pedestrians on the covered walkway (No. 4) feel slightly more comfortable than those on the walkway with dense trees due to the lower PET.
  • Covered walkways vs. cantilever-covered walkways. The thermal comfort conditions of both walkway types are quite different. Walkway No. 4 (one-sided covered walkway) has a higher air temperature than walkway No. 5 (cantilever-covered walkway). Moreover, the wind speed of walkway No. 5 is significantly higher than that of walkway No. 4. This may be because walkway No. 5 has tall and open trees, so the wind is rapidly circulated. The PET of walkway No. 5 is thus significantly lower than that of walkway No. 4 (lower by 1.6 °C PET). The thermal sensation vote ranges of both walkway types are similar, but the percentage of thermal acceptability of walkway No. 5 is more than that of walkway No. 4. It can be concluded that pedestrians on cantilever-covered walkways feel more comfortable than those on covered walkways.

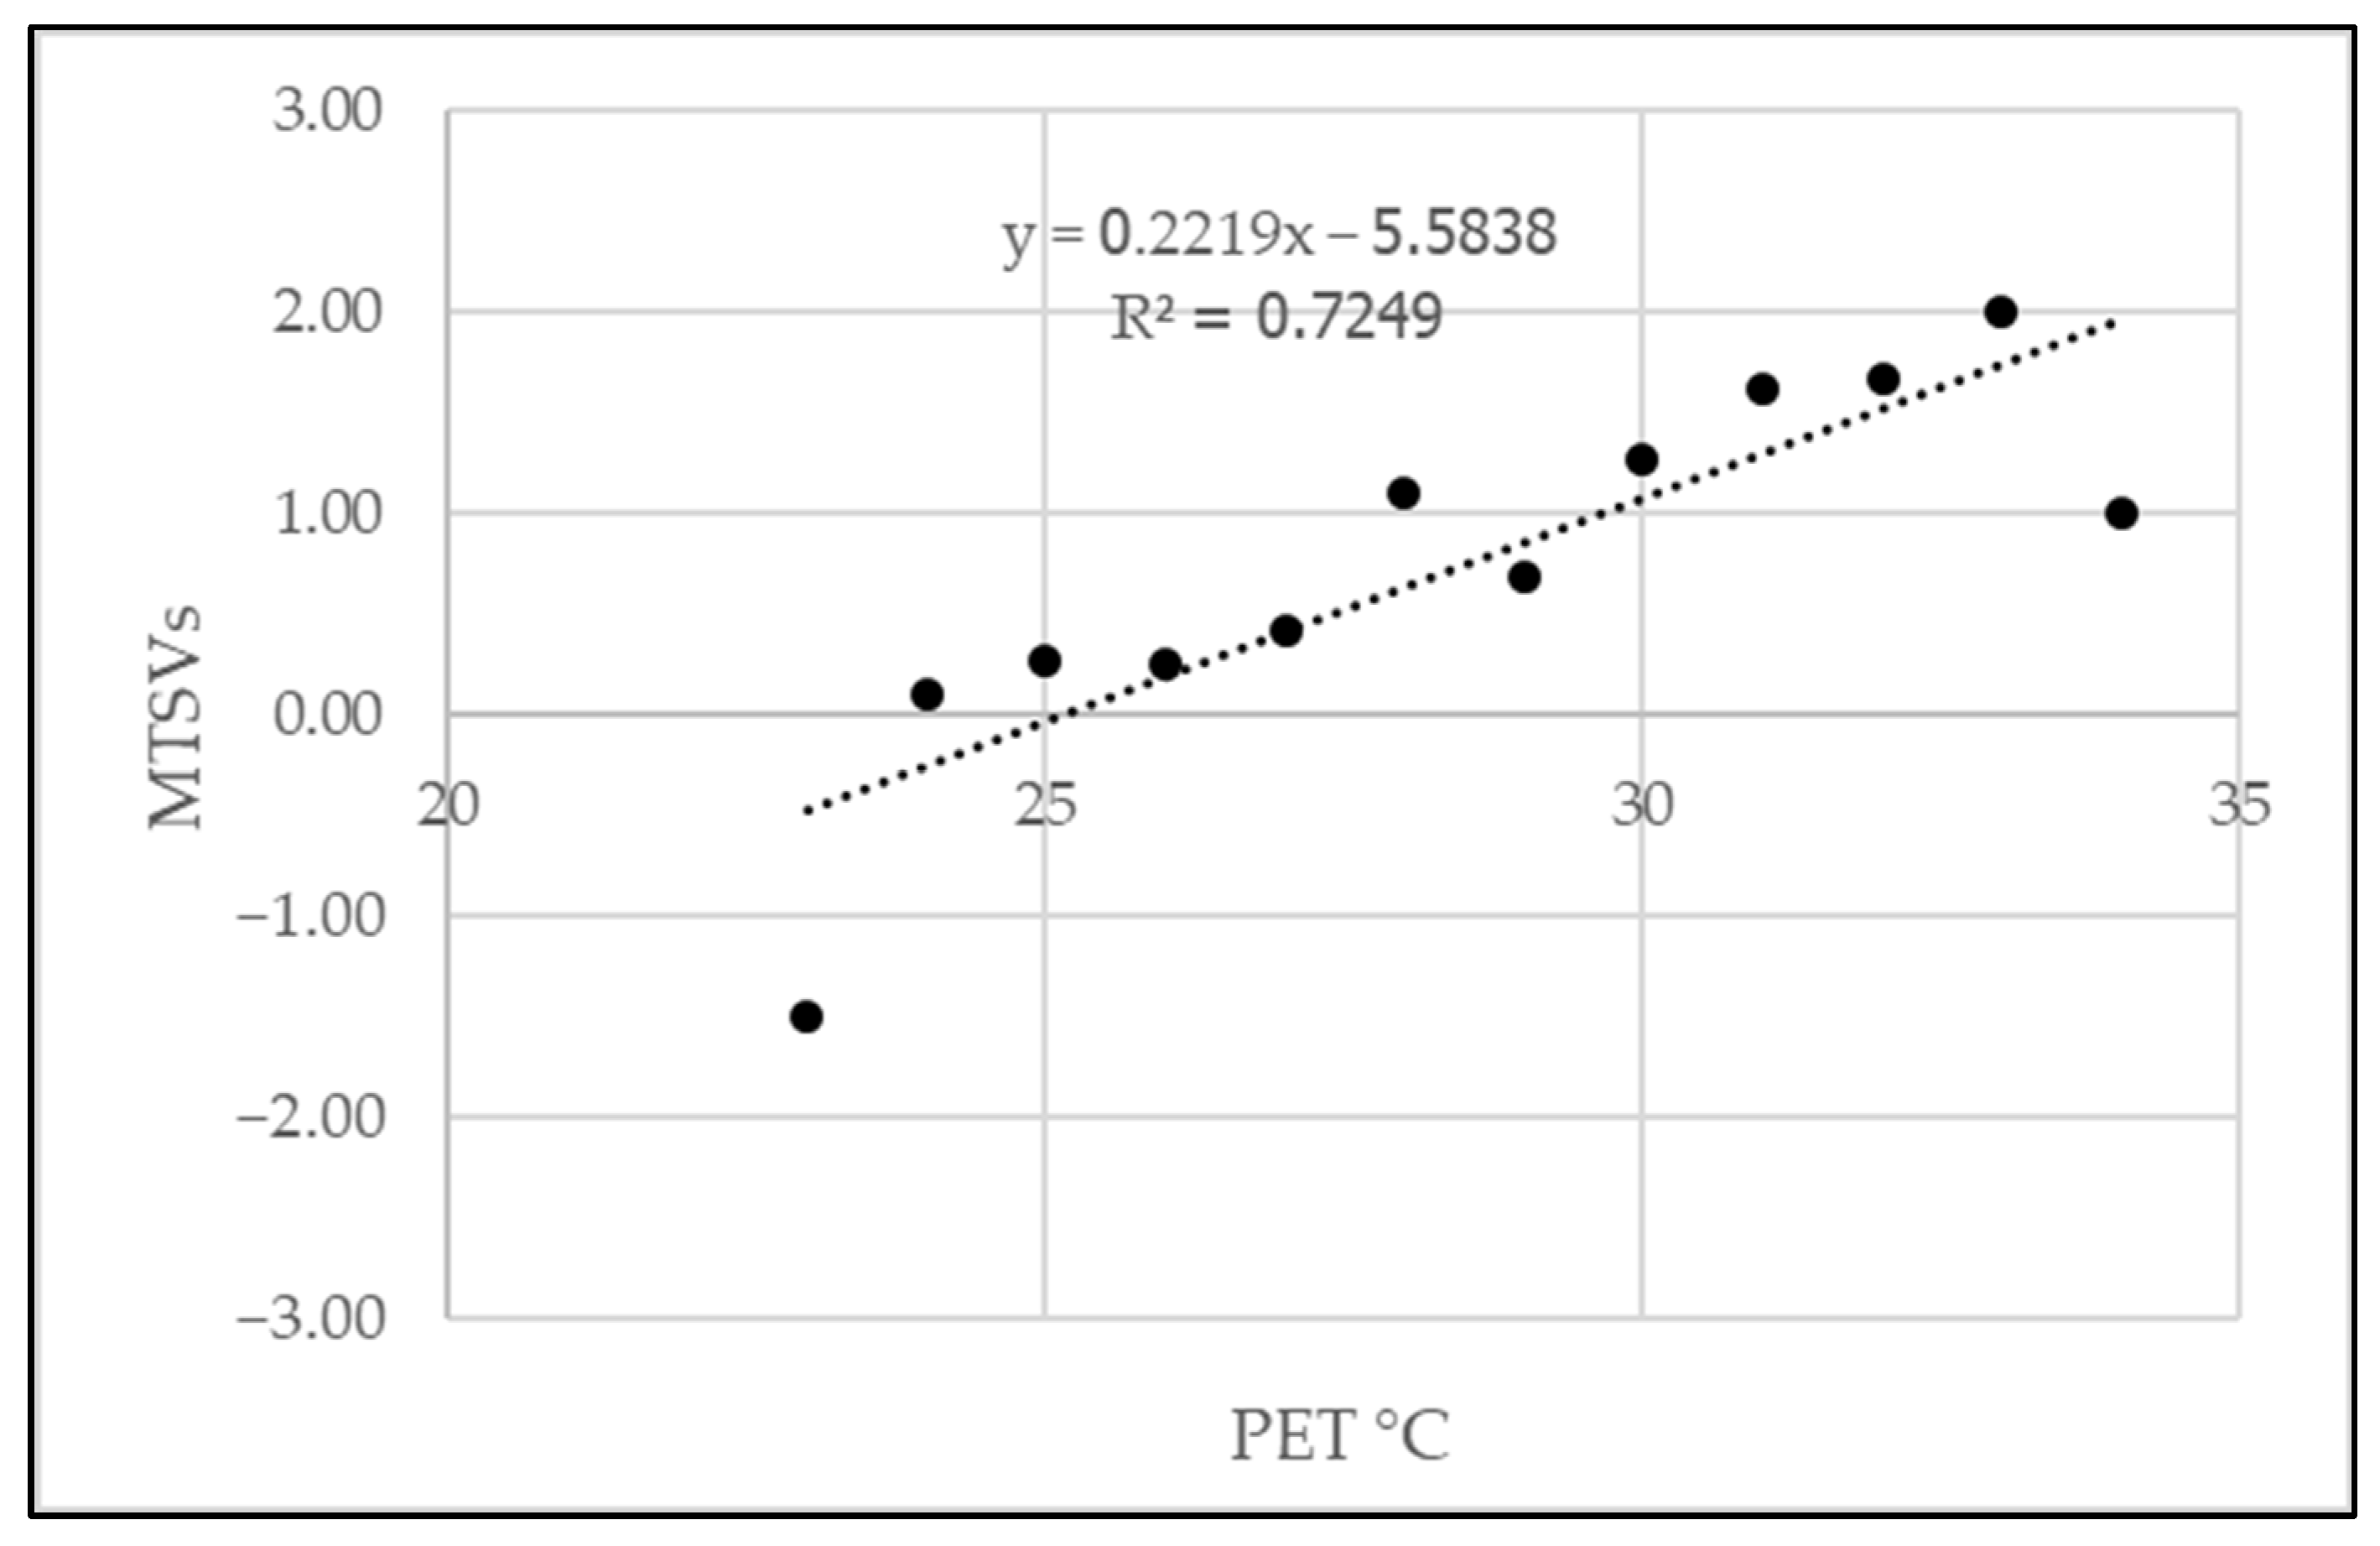
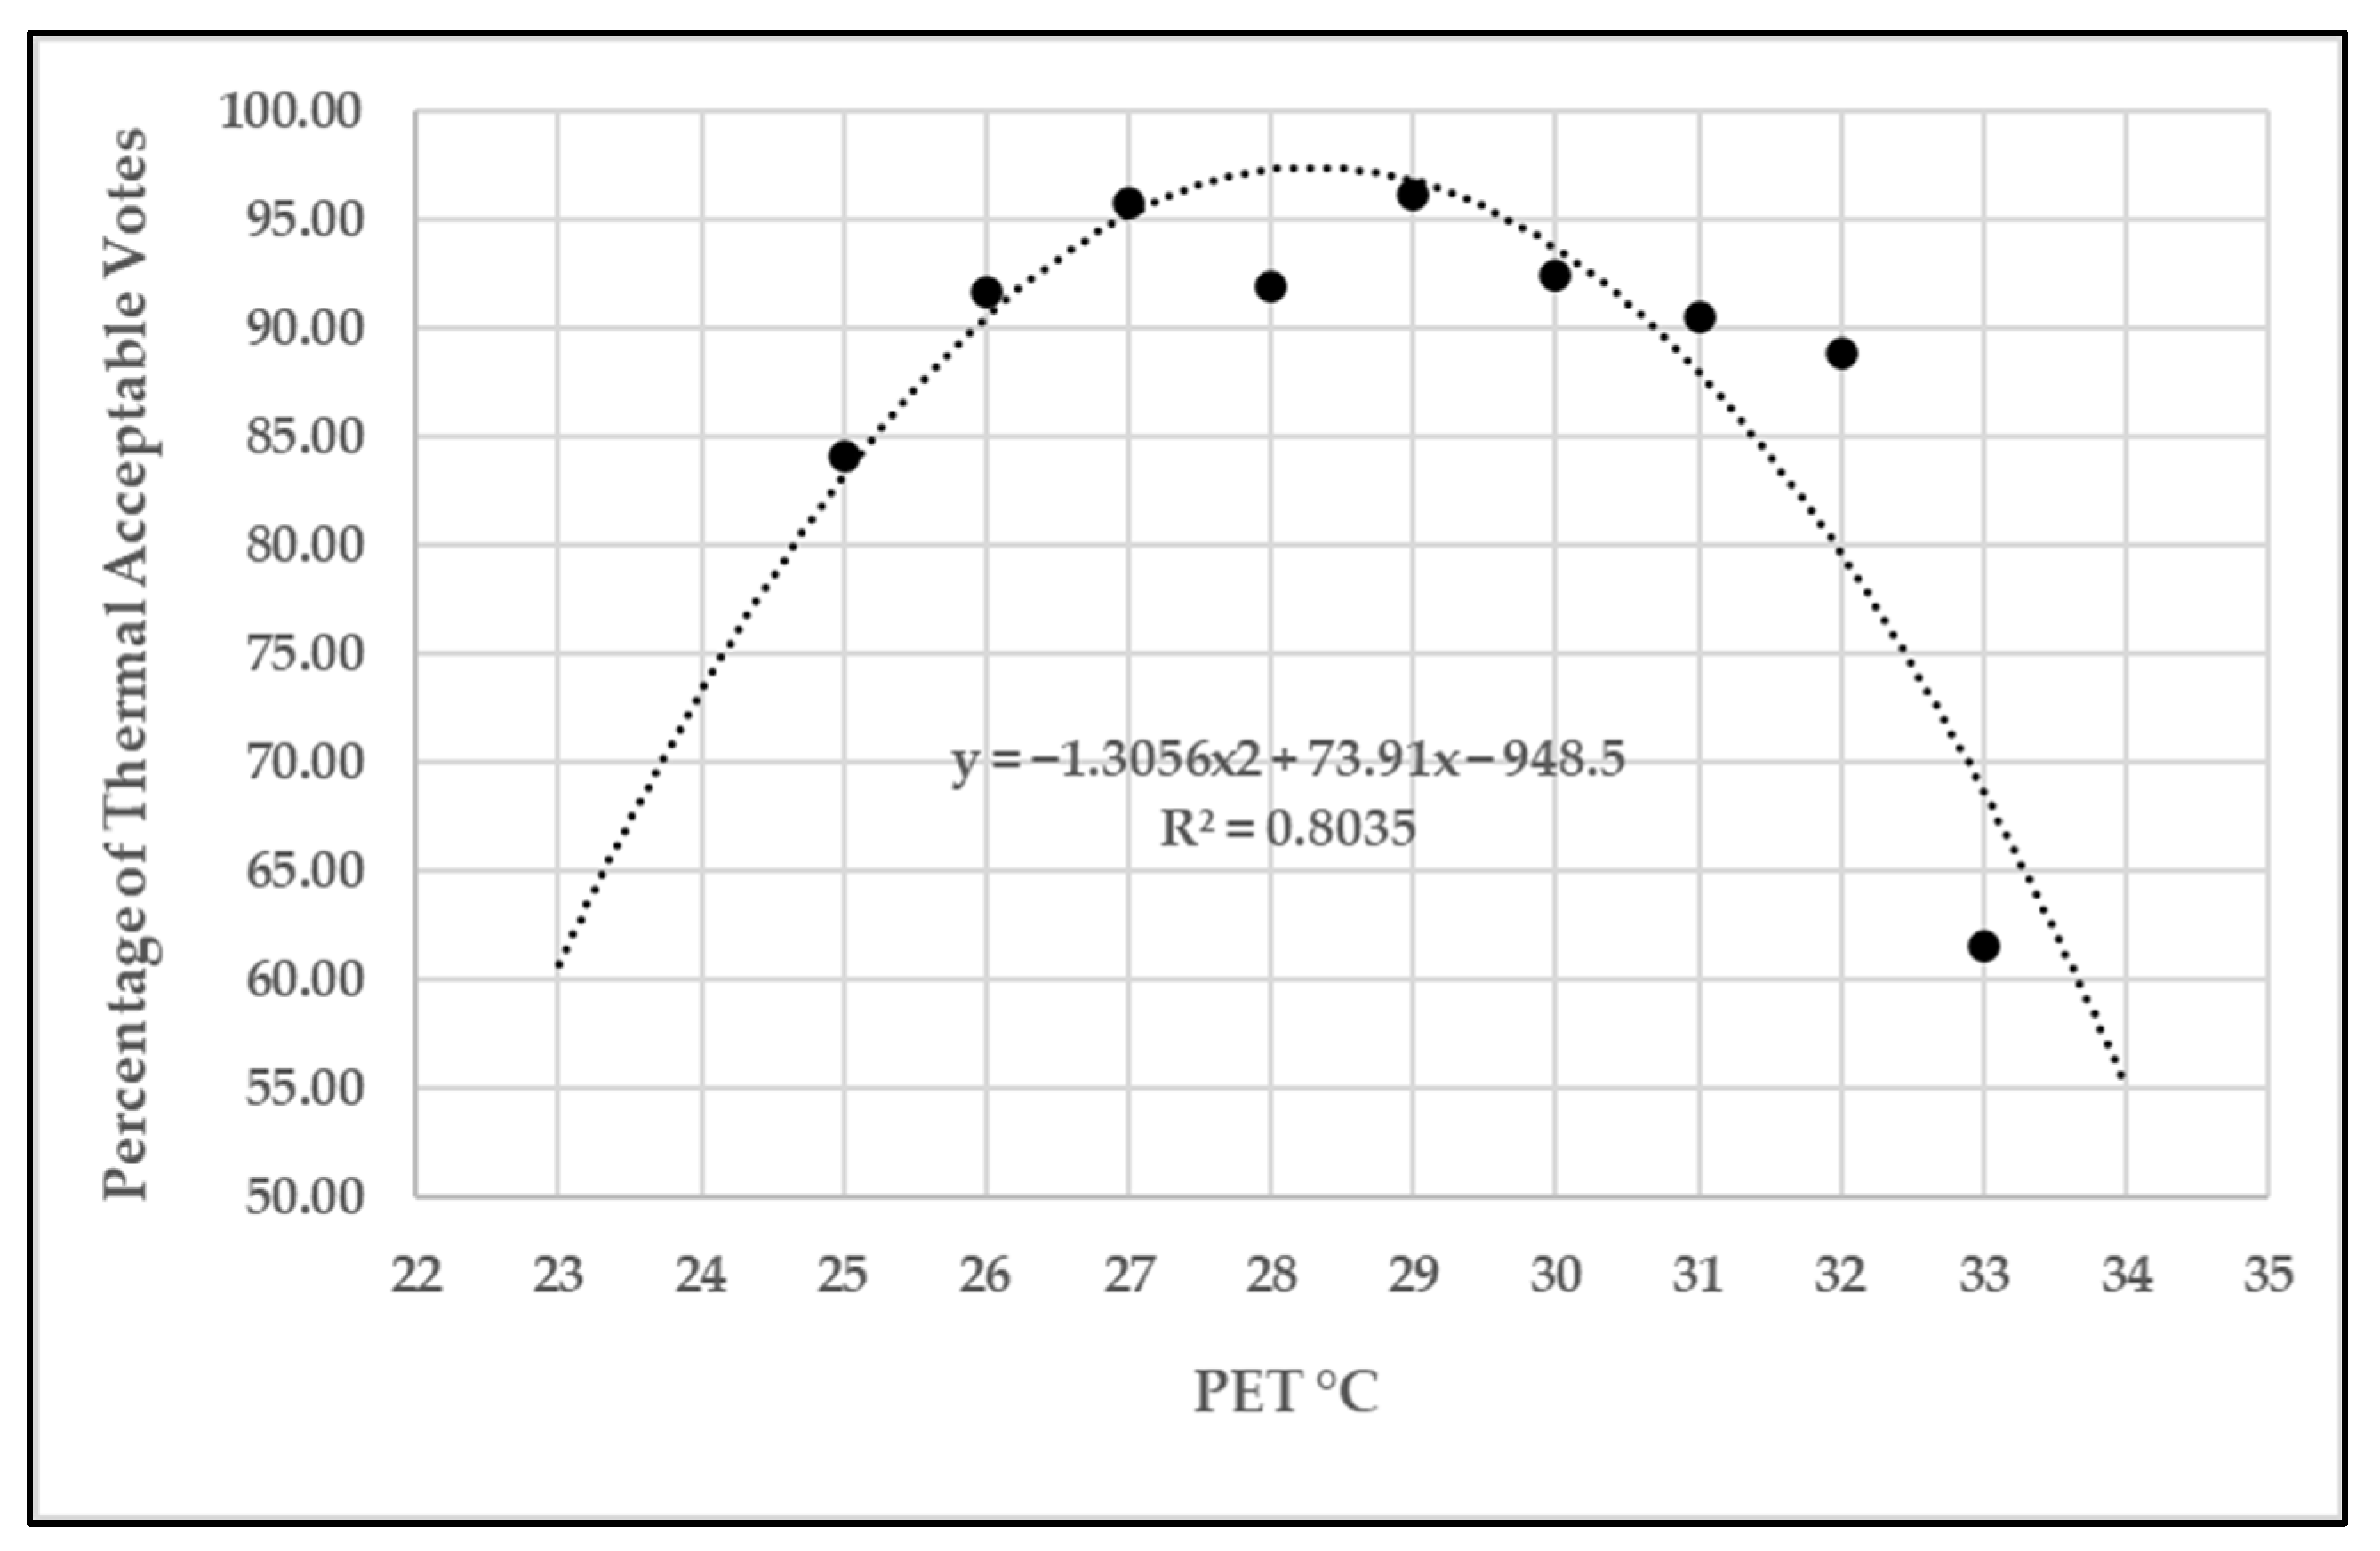
4.2. Analysis of Thermal Acceptability Range

This study analyzed the thermal acceptability range of pedestrian walkways in the study area. First, this study categorized the thermal sensation vote (TSV) of all pedestrian samples (n = 400) by the physiological equivalent temperature (PET) values as tabulated in Table 4. It is noted that the estimated PET values were derived from environmental and personal data, and the TSV values were obtained from interview surveys.
Next, according to the TSV of pedestrians, the mean thermal sensation vote (MTSV) was calculated for each PET value. Then, the linear relationship between MTSV and PET was developed, as shown in Figure 13. Using this relationship, the neutral temperature of PET can be determined to be 25.2 °C.
Finally, the thermal acceptability range was determined. Thermal accessibility represents the acceptability of humans to the thermal condition. It is defined as the range of PET (°C) in which thermal acceptability votes are greater than 80%. The last column in Table 4 presents the percentage of thermal acceptability votes, which is the ratio of the number of acceptable voters to the total voters at each PET. Then, the relationship between the percentage of thermal acceptability votes and PET was analyzed using the second-order quadratic polynomial equation as shown in Figure 14. This figure shows that the range of acceptable temperature PET at an 80% thermal acceptability vote is 24.6–32.0 °C PET.

4.3. Comparison of Other Outdoor Thermal Comfort Studies

To date, the study on outdoor thermal comforts in Thailand has been very limited. The main contribution of this research work is the investigation of urban outdoor thermal comfort in campus walkways in the hot and humid tropical climate of Thailand. This study applied PET and TSV as indicators to estimate the thermal comfort condition and thermal sensation similar to other outdoor thermal comfort studies.
Based on the results, the pedestrians’ neutral temperature was 25.2 °C PET and the acceptable temperature range was 24.6–32.0 °C PET from June to October in a university campus context in Chiang Mai, Thailand. The acceptable temperature ranges here were close to those in other neighboring countries with the same climatic zones. The acceptable temperature ranges were 25.9–32.3 °C PET in Malaysia, 24.7–27.8 °C PET in China (Changsha), 21.3–28.5 °C PET in Taiwan, and 21.3–27.3 °C PET in Hong Kong [11,19,27,48,52]. It can be seen that there were thermal adaptation behaviors among pedestrians in the study area. The acceptable temperature range (24.6–32.0 °C PET) of pedestrians was slightly warmer than their neutral temperature (25.2 °C PET). Moreover, the acceptable temperature range of pedestrians using campus walkways (24.6–32.0 °C PET) was higher than the neutral comfort range (PET < 30 °C) defined for tropical regions [24]. This implies that those pedestrians who felt neither too hot nor too cold accept slightly heat stress under outdoor conditions in tropical climates. This finding is in agreement with Lai et al. (2014) and Aghamohammadi et al. (2021) [11,16], in which the pedestrians in tropical climates have adapted to the warm environment.
It is also noteworthy that in tropical climates, shading is very necessary for outdoor spaces and walkways. In this study, pedestrians feel more comfortable in the shaded walkways, such as covered walkways, walkways with trees, or both. They accept the thermal condition of all campus walkways in the study area but at different levels of acceptability. The results indicate that the combination of shading level and air flow on pedestrian walkways would affect the thermal comforts of pedestrians, and thus the design of walkway conditions in hot and humid tropical regions must ensure the shading level to attain the acceptable thermal conditions.

5. Conclusions and Recommendations

This study presented an investigation of outdoor thermal comfort and the thermal perception of pedestrians using walkways within a university campus in Thailand, located in the hot and humid tropical climatic zone. The field study was carried out in summer from June to October. This study focused on examining a thermal comfort range and estimating neutral temperature and acceptable temperature ranges of pedestrians in campus walkways through questionnaire surveys and microclimatic measurements.
The neutral physiological equivalent temperature (PET) was 25.2 °C and the 80% acceptable temperature range was 24.6–32.0 °C in campus walkways in Chiang Mai, Thailand. The acceptable temperature range of pedestrians using campus walkways (24.6–32.0 °C PET) was higher than the neutral comfort range (PET < 30 °C) defined for tropical regions.
Based on field surveys, most pedestrians in the university campus accept the thermal condition of all walkways but at different levels of acceptability. Pedestrians expect a slightly warm climate in the existing outdoor walkways in a university campus. This study compared the thermal conditions and the thermal sensation of pedestrians among campus walkways under five physical and environmental conditions, including a walkway with sparse trees on one side, a walkway with sparse trees on both sides, a walkway with dense trees, a covered walkway with sparse trees, and a cantilever-covered walkway with sparse trees. The thermal conditions of these walkways vary according to their meteorological data. Among all, the cantilever-covered walkway with sparse trees is the most comfortable due to its lower air temperature, less sunlight, and better wind ventilation. The PET of this walkway type is closest to the neutral PET, compared to other types of walkways.
This study has some limitations and can be further investigated. First, the field study was conducted during daytime between June and October. To better understand the impact of the microclimate on pedestrian behaviors, further outdoor thermal comfort studies should consider seasonal and temporal variations. Second, the sample subjects in questionnaire surveys had age restrictions due to the university campus context. Most participants are students and young adults. To capture the population of pedestrians within a city or community, a wider range of pedestrian ages should be considered. Finally, several experimental design alternatives of walkway conditions should be further assessed to attain the optimal designs of campus walkways under different environmental conditions.
Outdoor thermal comfort studies are of considerable importance in evaluating the environmental quality of walkways and designing the physical and environmental conditions of walkways. It can further be applied to the design of sustainable transport in urban green university campuses, especially in hot and humid regions, for increasing the utilization rate of non-motorized transport. Shaded and naturally ventilated walkways should be considered to improve thermal comfort and thus provide pedestrians with an environmentally friendly outdoor lifestyle as well as promote green and sustainable university campuses.

Author Contributions

Conceptualization, N.K. and D.R.; methodology, N.S. and D.R.; formal analysis, N.S.; writing—original draft preparation, N.S. and C.S.; writing—review and editing, N.K.; supervision, K.A. and D.R.; funding acquisition, N.K. All authors have read and agreed to the published version of the manuscript.

Funding

This research work was financially supported by the Excellence Center in Infrastructure Technology and Transportation Engineering (ExCITE) of Chiang Mai University.

Institutional Review Board Statement

Not applicable.

Informed Consent Statement

Not applicable.

Data Availability Statement

The data presented in this study are available on request from the corresponding author.

Acknowledgments

The authors would like to gratefully acknowledge support of the work from the Green Infrastructure Transportation Technology (GITT) Research Center, Faculty of Engineering, Chiang Mai University.

Conflicts of Interest

The authors declare no conflicts of interest.

References

  1. Emmanuel, R. Urban Climate Challenges in the Topics: Rethinking Planning and Design Opportunities; Imperial College Press: London, UK, 2016. [Google Scholar]
  2. Krellenberg, K.; Bergsträßer, H.; Bykova, D.; Kress, N.; Tyndall, K. Urban sustainability strategies guided by the SDGs—A tale of four cities. Sustainability 2019, 11, 1116. [Google Scholar] [CrossRef]
  3. Pojani, D.; Stead, D. Sustainable urban transport in the developing world: Beyond megacities. Sustainability 2015, 7, 7784–7805. [Google Scholar] [CrossRef]
  4. Shafray, E.; Kim, S. A study of walkable spaces with natural elements for urban regeneration: A focus on cases in Seoul, South Korea. Sustainability 2017, 9, 587. [Google Scholar] [CrossRef]
  5. Biggar, M. Non-motorized transport: Walking and cycling. In Sustainable Cities and Communities. Encyclopedia of the UN Sustainable Development Goals; Leal Fihro, W., Azul, A., Brandli, L., Özuyar, P., Wall, T., Eds.; Springer: Cham, Switzerland, 2020; pp. 1–10. [Google Scholar]
  6. Turrell, G.; Hewitt, B.; Haynes, M.; Nathan, A.; Giles-Corti, B. Change in walking for transport: A longitudinal study of the influence of neighbourhood disadvantage and individual-level socioeconomic position in mid-aged adults. Int. J. Behav. Nutr. Phys. Act. 2014, 11, 151. [Google Scholar] [CrossRef]
  7. Kaplan, D.H. Transportation sustainability on a university campus. Int. J. Sustain. High. 2015, 16, 173–186. [Google Scholar] [CrossRef]
  8. Lin, T.-P.; Matzarakis, A.; Hwang, R.-L. Shading effect on long-term outdoor thermal comfort. Build. Environ. 2010, 45, 213–221. [Google Scholar] [CrossRef]
  9. Zhao, L.; Zhou, X.; Li, L.; He, S.; Chen, R. Study on outdoor thermal comfort on a campus in a subtropical urban area in summer. Sustain. Cities Soc. 2016, 22, 164–170. [Google Scholar] [CrossRef]
  10. Huang, Z.; Cheng, B.; Gou, Z.; Zhang, F. Outdoor thermal comfort and adaptive behaviors in a university campus in China’s hot summer-cold winter climate region. Build. Environ. 2019, 165, 106414. [Google Scholar] [CrossRef]
  11. Aghamohammadi, N.; Fong, C.S.; Mohd Idrus, M.H.; Ramakreshnan, L.; Haque, U. Outdoor thermal comfort and somatic symptoms among students in a tropical city. Sustain. Cities Soc. 2021, 72, 103015. [Google Scholar] [CrossRef]
  12. Blazejczyk, K. New climatological-and-physiological model of the human heat balance outdoor and its applications in bioclimatological studies in different scales. In Bioclimatic Research on the Human Heat Balance; Blazejczyk, K., Krawczyk, B., Eds.; ZESZYTY: Warsaw, Poland, 1994; Volume 28, pp. 27–58. [Google Scholar]
  13. De Freitas, C.R.; Grigorieva, E.A. A comprehensive catalogue and classification of human thermal climate indices. Int. J. Biometeorol. 2015, 59, 109–120. [Google Scholar] [CrossRef]
  14. Matzarakis, A.; Mayer, H.; Iziomon, M. Applications of a universal thermal index: Physiological equivalent temperature. Int. J. Biometeorol. 1999, 43, 76–84. [Google Scholar] [CrossRef]
  15. Höppe, P. The physiological equivalent temperature—A universal index for the biometeorological assessment of the thermal environment. Int. J. Biometeorol. 1999, 43, 71–75. [Google Scholar] [CrossRef] [PubMed]
  16. Lai, D.; Guo, D.; Hou, Y.; Lin, C.; Chen, Q. Studies of outdoor thermal comfort in northern China. Build. Environ. 2014, 77, 110–118. [Google Scholar] [CrossRef]
  17. Niu, J.; Liu, J.; Lee, T.-C.; Lin, Z.; Mak, C.M.; Tse, K.-T.; Tang, B.-S.; Kwok, K. A new method to assess spatial variations of outdoor thermal comfort: Onsite monitoring results and implications for precinct planning. Build. Environ. 2015, 91, 263–270. [Google Scholar] [CrossRef]
  18. Li, J.; Liu, N. The perception, optimization strategies and prospects of outdoor thermal comfort in China: A review. Build. Environ. 2020, 170, 106614. [Google Scholar] [CrossRef]
  19. Cheng, V.; Ng, E.; Chan, C.; Givoni, B. Outdoor thermal comfort study in a sub-tropical climate: A longitudinal study based in Hong Kong. Int. J. Biometerol. 2012, 56, 43–56. [Google Scholar] [CrossRef] [PubMed]
  20. Fanger, P.O. Thermal Comfort: Analysis and Applications in Environmental Engineering; McGraw-Hill Book Company: New York, NY, USA, 1972. [Google Scholar]
  21. Auliciems, A.; Szokolay, S.V. Thermal Comfort, 2nd ed.; University of Queensland: Brisbane, Australia, 2007; pp. 15–43. [Google Scholar]
  22. ASHARE Standard 55-2017; Thermal Environmental Conditions for Human Occupancy. American Society of Heating. Refrigerating and Air-Conditioning Engineers: Atlanta, GA, USA, 2017.
  23. Li, K.; Zhang, Y.; Zhao, L. Outdoor thermal comfort and activities in the urban residential community in a humid subtropical area of China. Energy Build. 2016, 133, 498–511. [Google Scholar] [CrossRef]
  24. Lin, T.-P.; Matzarakis, A. Tourism climate and thermal comfort in Sun Moon Lake, Taiwan. Int. J. Biometeorol. 2008, 52, 281–290. [Google Scholar] [CrossRef]
  25. Coccolo, S.; Kämpf, J.; Scartezzini, J.-L.; Pearlmutter, D. Outdoor human comfort and thermal stress: A comprehensive review on models and standards. Urban Clim. 2016, 18, 33–57. [Google Scholar] [CrossRef]
  26. Abraham, A.; Sommerhalder, K.; Adel, T. Landscape and well-being: A scoping study on the health-promoting impact of outdoor environments. Int. J. Public Health 2010, 55, 59–69. [Google Scholar] [CrossRef] [PubMed]
  27. Lin, T.-P. Thermal perception, adaptation and attendance in a public square in hot and humid regions. Build. Environ. 2009, 44, 2017–2026. [Google Scholar] [CrossRef]
  28. Nikolopoulou, M.; Baker, N.; Steemers, K. Thermal comfort in outdoor urban spaces: Understanding the human parameter. Sol. Energy 2011, 70, 227–235. [Google Scholar] [CrossRef]
  29. Mayer, H.; Höppe, P. Thermal comfort of man in different urban environments. Theor. Appl. Climatol. 1987, 38, 43–49. [Google Scholar] [CrossRef]
  30. Matzarakis, A.; Mayer, H. Another kind of environmental stress: Thermal stress. WHO collaborating centre for air quality management and air pollution control. Newsletters 1996, 18, 7–10. [Google Scholar]
  31. Potchter, O.; Cohen, P.; Lin, T.-P.; Matzarakis, A. Outdoor human thermal perception in various climates: A comprehensive review of approaches, methods, and quantification. Sci. Total Environ. 2018, 631–632, 390–406. [Google Scholar] [CrossRef] [PubMed]
  32. Cohen, P.; Potchter, O.; Matzarakis, A. Human thermal perception of coastal mediterranean outdoor urban environments. Appl. Geogr. 2013, 37, 1–10. [Google Scholar] [CrossRef]
  33. Zölch, T.; Rahman, M.A.; Pfleiderer, E.; Wagner, G.; Pauleit, S. Designing public squares with green infrastructure to optimize human thermal comfort. Build. Environ. 2019, 149, 640–654. [Google Scholar] [CrossRef]
  34. Matzarakis, A.; Amelung, B. Physiological Equivalent Temperature as indicator for impacts of climate change on thermal comfort of humans. Adv. Glob. Change Res. 2008, 30, 161–172. [Google Scholar]
  35. Zhang, L.; Wei, D.; Hou, Y.; Du, J.; Liu, Z.; Zhang, G.; Shi, L. Outdoor thermal comfort of urban park—A case study. Sustainability 2020, 12, 1961. [Google Scholar] [CrossRef]
  36. Zaninovic, K.; Matzarakis, A. Variation and trends of thermal comfort at the Adriatic coast. In Advances in Tourism Climatology; Matzarakis, A., de Freitas, C.R., Scott, D., Eds.; Meteorologisches Institut der Universität Freiburg: Freiburg, Germany, 2004; pp. 74–81. [Google Scholar]
  37. Kántor, N.; Égerházi, L.; Unger, J. Subjective estimation of thermal environment in recreational urban spaces. Part 1: Investigations in Szeged, Hungary. Int. J. Biometeorol. 2012, 56, 1075–1088. [Google Scholar] [CrossRef]
  38. Tsitoura, M.; Tsoutsos, T.; Daras, T. Evaluation of comfort conditions in urban open spaces. Application in the island of Crete. Energy Convers. Manag. 2014, 86, 250–258. [Google Scholar] [CrossRef]
  39. Yang, B.; Olofsson, T.; Nair, G.; Kabanshi, A. Outdoor thermal comfort under subarctic climate of north Sweden—A pilot study in Umeå. Sustain. Cities Soc. 2017, 28, 387–397. [Google Scholar] [CrossRef]
  40. Hwang, R.L.; Lin, T.-P. Thermal comfort requirements for occupants of semi-outdoor and outdoor environments in hot-humid regions. Archit. Sci. Rev. 2007, 50, 357–364. [Google Scholar] [CrossRef]
  41. Li, K.; Xia, T.; Li, W. Evaluation of subjective feeling of outdoor thermal comfort in residential areas: A case study of Wuhan. Buildings 2021, 11, 389. [Google Scholar] [CrossRef]
  42. Wang, Y.; Ni, Z.; Peng, Y.; Xia, B. Local variation of outdoor thermal comfort in different urban green spaces in Guangzhou, a subtropical city in South China. Urban For. Urban Green. 2018, 32, 99–112. [Google Scholar] [CrossRef]
  43. Cheung, P.K.; Jim, C.Y. Subjective outdoor thermal comfort and urban green space usage in humid-subtropical Hong Kong. Energy Build. 2018, 173, 150–162. [Google Scholar] [CrossRef]
  44. Makaremi, N.; Salleh, E.; Jaafar, M.Z.; GhaffarianHoseini, A. Thermal comfort conditions of shaded outdoor spaces in hot and humid climate of Malaysia. Build. Environ. 2012, 48, 7–14. [Google Scholar] [CrossRef]
  45. Esmaili, R.; Montazeri, M. The determine of the Mashad bioclimatic condition based on hourly data. Geogr. Environ. Plan. J. 2013, 49, 45–59. [Google Scholar]
  46. Ali, S.B.; Patnaik, S. Thermal comfort in urban open spaces: Objective assessment and subjective perception study in tropical city of Bhopal, India. Urban Clim. 2018, 24, 954–967. [Google Scholar] [CrossRef]
  47. Acero, J.A.; Koh, E.J.K.; Pignatta, G.; Norford, L.K. Clustering weather types for urban outdoor thermal comfort evaluation in a tropical area. Theor. Appl. Climatol. 2020, 139, 659–675. [Google Scholar] [CrossRef]
  48. Yang, W.; Wong, N.H.; Jusuf, S.K. Thermal comfort in outdoor urban spaces in Singapore. Build. Environ. 2013, 59, 426–435. [Google Scholar] [CrossRef]
  49. Thorsson, S.; Honjo, T.; Lindberg, F.; Eliasson, I.; Lim, E.M. Thermal comfort and outdoor activity in Japanese urban public places. Environ. Behav. 2007, 39, 660–684. [Google Scholar] [CrossRef]
  50. Shooshtarian, S.; Lam, C.K.C.; Kenawy, I. Outdoor thermal comfort assessment: A review on thermal comfort research in Australia. Build. Environ. 2020, 177, 106917. [Google Scholar] [CrossRef]
  51. Zhao, Q.; Sailor, D.J.; Wentz, E.A. Impact of tree locations and arrangements on outdoor microclimates and human thermal comfort in an urban residential environment. Urban For. Urban Green 2018, 32, 81–91. [Google Scholar] [CrossRef]
  52. Deng, Y.; Gan, D.; Tang, N.; Cai, Z.; Li, X.; Chen, S.; Li, X. Research on outdoor thermal comfort and activities in residential areas in subtropical China. Atmosphere 2022, 13, 1357. [Google Scholar] [CrossRef]
  53. Mayer, H.; Holst, J.; Dostal, P.; Imbery, F.; Schindler, D. Human thermal comfort in summer within an urban street canyon in Central Europe. Meteoral. Z. 2008, 17, 241–250. [Google Scholar] [CrossRef]
  54. Boussaidi, K.; Djaghrouri, D.; Benabbas, M.; Altan, H. Assessment of outdoor thermal comfort in urban public space, during the hottest period in Annaba City, Algeria. Sustainability 2023, 15, 11763. [Google Scholar] [CrossRef]
  55. Chen, L.; Mak, C.M.; Hang, J.; Dai, Y. Influence of elevated walkways on outdoor thermal comfort in hot-humid climates based on on-site measurement and CFD modeling. Sustain. Cities Soc. 2023, 100, 105048. [Google Scholar] [CrossRef]
  56. Fang, Z.; Lin, Z.; Mak, C.M.; Niu, J.; Tae, K.-T. Investigation into sensitivities of factors in outdoor thermal comfort indices. Build Environ. 2018, 128, 129–142. [Google Scholar] [CrossRef]
  57. Cochran, W.G. Sample Techniques, 3rd ed.; John Wiley & Sons: New York, NY, USA, 1977; pp. 72–88. [Google Scholar]
  58. Nasrollahi, N.; Ghosouri, A.; Khodakarami, J.; Taleghani, M. Heat-Mitigation Strategies to Improve Pedestrian Thermal Comfort in Urban Environments: A Review. Sustainability 2020, 12, 10000. [Google Scholar] [CrossRef]
Figure 1. The research method adopted in this paper.
Sustainability 16 00657 g001
Figure 2. A map of Chiang Mai city.
Sustainability 16 00657 g002
Figure 3. A map of university campus walkways in a study area.
Sustainability 16 00657 g003
Figure 4. The cross-section of walkway No. 1: walkway with sparse trees on one side.
Sustainability 16 00657 g004
Figure 5. The cross-section of walkway No. 2: walkway with sparse trees.
Sustainability 16 00657 g005
Figure 6. The cross-section of walkway No. 3: walkway with dense trees.
Sustainability 16 00657 g006
Figure 7. The cross-section of walkway No. 4: open-sided covered walkway with sparse trees.
Sustainability 16 00657 g007
Figure 8. The cross-section of walkway No. 5: cantilever-covered walkway with sparse trees.
Sustainability 16 00657 g008
Figure 9. A 180° fish-eye lens picture for sky view factor.
Sustainability 16 00657 g009
Figure 10. Environmental conditions within the study area: (a) air temperature; (b) relative humidity; (c) wind velocity; (d) sky view factor; (e) PET.
Sustainability 16 00657 g010
Figure 11. Frequency distribution of thermal sensation vote associated with each walkway.
Sustainability 16 00657 g011
Figure 12. Thermal acceptability votes associated with each walkway: (a) No. 1 walkway with sparse trees on one side; (b) No. 2 walkway with sparse trees; (c) No. 3 walkway with dense trees; (d) No. 4 open-sided covered walkway with sparse trees; (e) No. 5 cantilever-covered walkways with sparse trees.
Sustainability 16 00657 g012aSustainability 16 00657 g012b
Figure 13. Relationship between PET and MTSV.
Sustainability 16 00657 g013
Figure 14. Relationship between PET and percentage of thermal acceptability votes.
Sustainability 16 00657 g014
Table 1. Thermal perception classification by region.
Thermal
Sensation
Physiological
Stress
PET (°C) by Region
(Sub) Tropical Region
[24]
Temperate Region [30]
Very coldExtreme cold stress<14<4
ColdStrong cold stress14–184–8
CoolModerate cold stress18–228–13
Slightly coolSlight cold stress22–2613–18
Neutral No thermal stress26–3018–23
Slightly warmSlight heat stress30–3423–29
WarmModerate heat stress34–3829–35
HotStrong heat stress38–4235–41
Very hotExtreme heat stress<42<41
Table 2. Personal factors associated with each pedestrian walkway.
FactorsWalkway
AllNo. 1No. 2No. 3No. 1No. 5
GenderMale1703542423714
Female2304538384366
AgeAvg.21.622.624.621.620.218.9
Max.47.042.047.041.030.028.0
Min.17.018.018.017.018.018.0
S.D.5.76.08.25.32.92.1
Weight (kg)Avg.58.659.658.460.157.757.3
Max.99.079.080.083.099.076.0
Min.42.049.045.050.042.045.0
S.D.8.67.58.47.411.37.6
Height (cm)Avg.165.0166.2163.4166.7164.8163.7
Max.182.0181.0177.0180.0182.0180.0
Min.148.0148.0149.0149.0150.0150.0
S.D.7.07.06.87.37.46.2
Body Mass
Index, BMI
Avg.21.521.621.821.621.221.3
Max.34.328.727.727.734.327.1
Min.16.018.418.118.416.017.8
S.D.2.62.32.52.43.42.1
Clothing
insulation, clo
Avg.0.550.520.570.550.560.54
Max.0.670.610.670.670.670.57
Min.0.400.400.400.400.400.40
S.D.0.050.080.040.060.040.02
Table 3. Environmental factors associated with each pedestrian walkway.
ParametersWalkway
AllNo. 1No. 2No. 3No. 4No. 5
Tmrt (°C)Avg.30.3332.1731.2130.0430.0928.13
Max.37.9034.5037.9031.8034.9030.30
Min.25.7028.7026.9028.4027.4025.70
S.D.2.411.732.891.042.311.53
Va (m/s)Avg.0.570.660.510.520.550.60
Max.2.301.901.801.302.301.40
Min.0.000.000.000.000.000.00
S.D.0.510.540.540.440.510.51
RH (%)Avg.72.9271.0774.0072.0672.0975.38
Max.81.9081.3081.9078.8078.5080.60
Min.64.6066.4066.0065.3064.6069.70
S.D.4.554.364.784.224.283.86
Ta (°C)Avg.28.6929.8428.7328.6628.4527.77
Max.31.9031.3031.9030.3031.4029.70
Min.25.9027.9026.3027.0025.9025.90
S.D.1.521.091.330.931.911.44
SVFAvg.0.350.450.220.430.400.27
Max.0.570.570.280.500.430.29
Min.0.160.380.160.350.360.24
S.D.0.110.070.060.080.040.02
PET (°C)Avg.29.1830.729.829.228.927.3
Max.34.2033.734.231.833.831.1
Min.23.4027.025.526.524.223.4
S.D.2.482.02.41.52.72.5
Table 4. Pedestrian thermal sensation votes and acceptable votes at different PET values.
PET (°C)Thermal Sensation Votes (TSVs) TotalMTSVThermal
Acceptable Votes
3210−1−2−3
2300003306−1.506 (100.0%)
240076500180.1018 (100.0%)
2503814600310.2626 (83.9%)
260267500200.2518 (90.0%)
27051411800380.4236 (94.7%)
286183813500801.1074 (92.5%)
2926195900410.6939 (95.1%)
30527198320641.2859 (92.2%)
31822146000501.6345 (90.0%)
3261443200291.6726 (89.7%)
338642000202.0012 (60.0%)
34003000031.003 (100.0%)
Total3510313675465040038362 (90.5%)
Disclaimer/Publisher’s Note: The statements, opinions and data contained in all publications are solely those of the individual author(s) and contributor(s) and not of MDPI and/or the editor(s). MDPI and/or the editor(s) disclaim responsibility for any injury to people or property resulting from any ideas, methods, instructions or products referred to in the content.

