Article

Creating a Roadmap to Forecast Future Directions in Vertical Green Structures as a Climate Change Mitigation Strategy: A Critical Review of Technology-Driven Applications

by
Ozge Ogut
1,2,
Julia Nerantzia Tzortzi
1,* and
Chiara Bertolin
2
1
Department of Architecture, Built Environment and Construction Engineering, Politecnico di Milano, 20133 Milan, Italy
2
Department of Mechanical and Industrial Engineering, Norwegian University of Science and Technology, 7491 Trondheim, Norway
*
Author to whom correspondence should be addressed.
Sustainability 2024, 16(11), 4543; https://doi.org/10.3390/su16114543
Submission received: 25 March 2024 / Revised: 11 May 2024 / Accepted: 16 May 2024 / Published: 27 May 2024
(This article belongs to the Special Issue Benefits of Green Infrastructures on Air Quality in Urban Spaces)

Abstract

:
Urbanization exacerbates climate change impacts, making it crucial to develop innovative strategies for adaptation and mitigation. In this context, the “smartness” concept must be seen as the technical capability to forecast and adapt to changing conditions while maintaining livability and safety. This paper investigates the use of Vertical Green Structures (VGSs) as a mitigation strategy. Through a critical review of technology-driven applications, this research identifies key motivations and challenges in VGSs’ technological integration and implementation, governance frameworks, and community engagement. Methodologically, it employs a critical case analysis and categorizes the technologies based on multicriteria; it also explores the potential to implement smart green infrastructure (GI) in cities and the GI urban governance that was developed in previous decades to adopt these systems at an urban scale and increase the community’s awareness of them. The findings reveal diverse motivations driving technology and VGS integration, ranging from economic incentives to environmental sustainability. Additionally, this contribution explores possible future directions for VGSs and highlights three scenarios derived after the multidimensional impacts of climate change with their pros and cons in future cities. Multidisciplinary collaboration emerges as a crucial factor in optimizing technology implementations in VGSs and fostering a transition from nature-based solutions to technology-based solutions in urban sustainability initiatives.

Graphical Abstract

1. Introduction

1.1. Vertical Green Structures as Green Infrastructure

In recent years, there has been growing awareness of the need for city transformations to make them greener and more sustainable because of the impact of climate change and the related risk of natural hazards. Ecological and ecosystem concepts have been developed to address these concerns with a wide spread of green infrastructure (GI) in built environments [1]. A GI is defined as a natural and semi-natural structure that is strategically combined in networks, and it is characterized by its multi-functionality in regulating, provisioning, and supporting ecosystem services (ESs) [2,3]. On the other hand, nature-based solutions (NbS) are based on a multi-dimensional perspective on GIs and their ESs [4] and have emerged over time as an operationalization of ES approaches within spatial planning policies and practices [5]. In other words, the types of GIs are examples of NbS implementations regardless of their scales and sizes.
Vertical Green Structures (VGSs) are vertical surfaces covered with vegetation [6]. They are architectural elements, including green façades and living walls, designed to incorporate vegetation into vertical surfaces such as on the walls or façades of buildings. The initial implementation of these structures, thanks to novel materials, construction methods, as well as technological developments, has become more technologically advanced; similarly, the variety of VGS products has increased from traditional façades with climbing plants to more high-tech systems like living walls with a greater number of components and possible species to cultivate [6]. Despite the current challenges in the installation of some VGS typologies linked to the maintenance needs or the little long-term knowledge on VGS effects, their implementation is suggested as a NbS [7]. Furthermore, a VGS is a potential element of a GI network in a built environment, which may provide several ecosystem services, e.g., among ES regulations, they can help in the improvement of energy efficiency in buildings [8], the alleviation of sick building syndrome [9], the mitigation of the urban heat island effect (UHI) [10], the improvement of air quality [11], the drainage of water run-off [12], the retention of stormwater [13], noise reduction [14], attracting pollinators [15], and biodiversity [16]. The benefits of provisioning ESs include improving food production [17] and the growth of medicinal herbs [18], and the benefits of cultural Ess include improved aesthetical value [19] and mental and physical health [20]. In addition to these ESs, new efforts are present to investigate a VGS’s impact on increasing the potential of solar energy in the case of photovoltaic panels being combined with vertical green surfaces, such as in green roofs [21].
Considering the abovementioned benefits, VGSs can play a significant role in the framework of sustainable, inclusive, and resilient urban transformation through making cities greener. These systems correspond to the Sustainable Development Goals (SDGs) [22], primarily goals 3 (good health and well-being), 11 (sustainable cities and communities), and 12 (climate action). In rapidly developing urban areas where land availability is scarce, traditional horizontal green parks are not feasible options. This underscores the critical role of VGSs in maximizing green spaces within densely built environments. Using VGSs serves as the primary solution for increasing the amount of green surfaces and reinforcing the GI network on a larger scale.

1.2. Technology Integration with Green Infrastructures

Following the final developments, VGS implementation can be extended to a smart green infrastructure (SGI) in the concept of smart cities. Many new smart technologies have started to be combined with existing or new green infrastructures with the scope of improving their maintenance (e.g., automating irrigation), performance, and capabilities through sensing, controls, communications, and computing (e.g., requiring internet connection, electricity, and energy) [23]. In this context, a SGI can be defined as the combination of green and nature-based elements that help to solve urban and environmental challenges with smart technology and Information Technology (IT) [24].
Wireless Sensor Network (WSN)-based applications in agriculture are one of the earliest significant examples of SGI. WSNs can be used to predict crop health and production quality over time, predict irrigation schedules through monitoring the soil moisture, and check weather conditions [25]. Currently, these aspects are extremely important, as due to increasing water scarcity, irrigation has to be optimized. In addition to WSN-based applications, collected data have started to be managed by using the Internet of Things (IoT) and machine learning (ML) algorithms to achieve optimum water source utilization [26]. These technologies and learning capabilities can not only be integrated in VGSs for farming applications, but also for optimizing and predicting monitoring and irrigation needs in general VGSs applications.
Robotics is another technology that has started to be implemented in VGSs recently, especially for the maintenance of VGSs in tall façades. Over the past decade, robots have been used to clean the façades of skyscrapers [27] with different climbing mechanisms to reduce manual labor. There are various climbing mechanisms, e.g., cable, wire or rail, drone propeller, wheels and chains, hooks and sliding frames, arms and legs (telescopic or passive walking), or propeller stabilization systems [28,29]. When robotic technologies are implemented in VGSs, the movement, sensors, and control system must be analyzed by considering the functions of the tools, for example, monitoring, plant cropping and watering, or VG structural support maintenance, where panels move to create a flexible and aesthetic visual impact.
Another rapidly growing subject is biomimetics, where solutions are obtained by emulating strategies, mechanisms, and principles found in nature [30]. These biomimetic designs use environmental sensors linked to a built-in control system to produce the motion of the structure that is self-activating, humidity-sensitive, and light-sensitive. In the past few years, there have been recent efforts to use biomimicry as the design principle for VGSs [31,32].

1.3. The Aim of This Study

This review paper analyzes the technologies utilized in VGS case studies by considering the motivation behind each smart initiative, and it investigates the potential of VGSs to become SGIs in urban areas. Similar studies in the literature are limited to farming applications without discriminating vertical farming technologies. Therefore, thanks to its comprehensive data analysis, this study contributes to the existing knowledge on this topic, which was recently introduced.
The analysis was conducted using the collected data deals with novel technology implementations on VGSs to support sustainable development by emphasizing the benefits, e.g., climate change mitigation and thermal regulation. After reviewing the technologies in VGSs, this article aims to forecast the possible future directions of VGS developments. The advantages and disadvantages of smart VGSs are examined to enhance adaptability in future sustainable and resilient urban design as they represent a sustainable solution as a climate change mitigation strategy. As VGSs have been more popular in building and industry applications to mitigate climate change impacts, improve the microclimate, etc., this study mainly aims to target architects, manufacturers, developers, as well as researchers from different disciplines since it shows the trend of combining smart technologies with VGS design solutions.

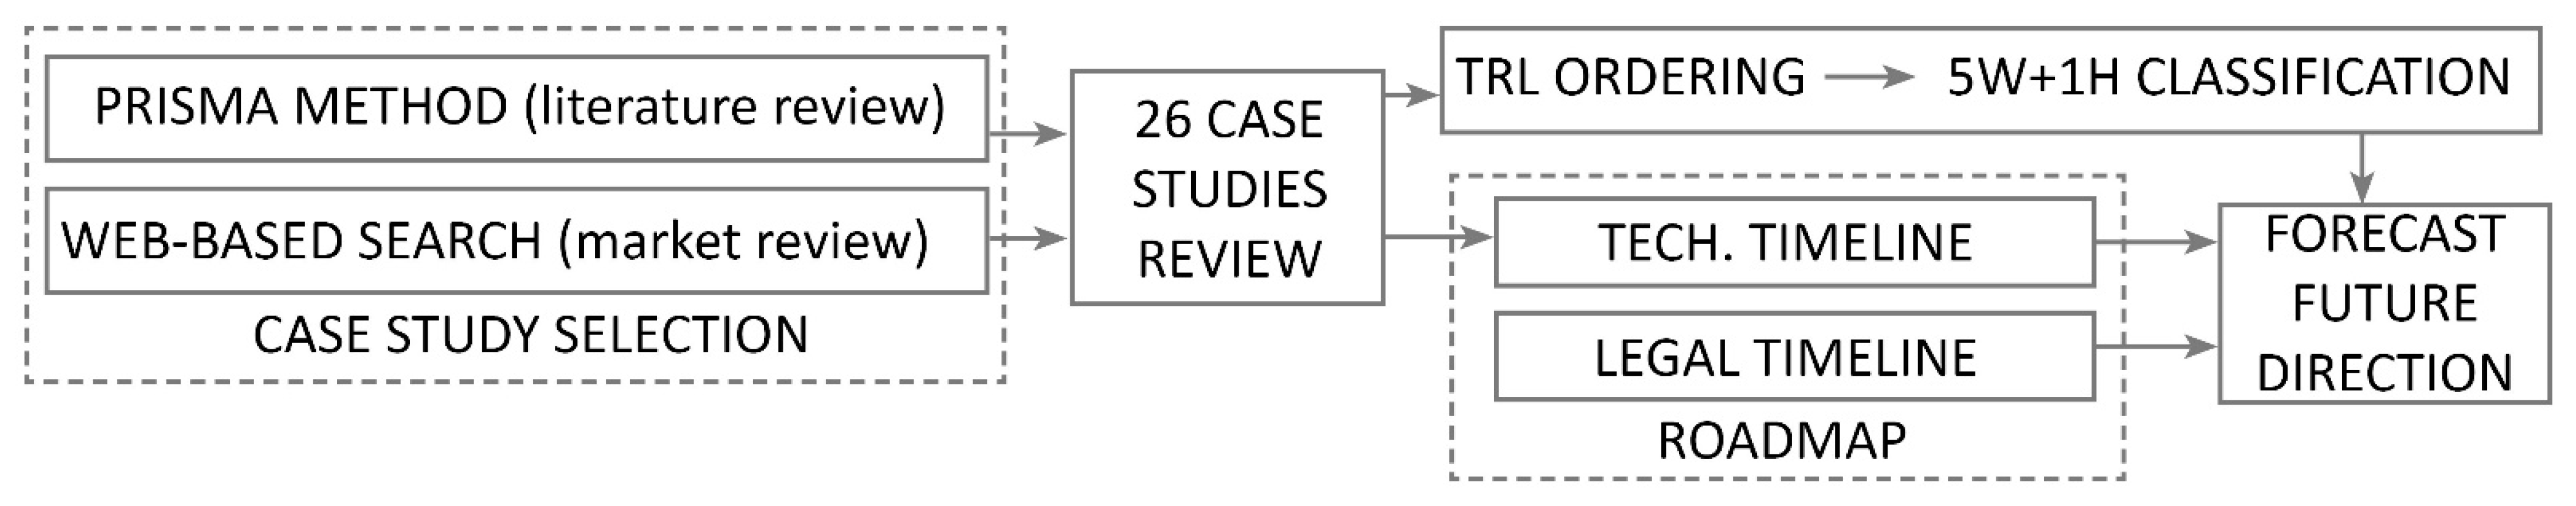
2. Materials and Methods

This study is a mixed methods research study as both qualitative and quantitative analyses are used with a focus on an inventory of smart technologies integrated with VGSs. A total of 17 peer-reviewed publications and 9 products/prototypes were analyzed through a literature review and market review to gain insights into the key factors influencing the implementation of technologies in VGSs. The literature review followed the Preferred Reporting Items for Systematic Re-views and Meta-Analysis (PRISMA) guidelines, while web-based research methods were adopted for the market review. A rigorous selection process yielded 26 case studies for detailed analysis. These case studies were further examined, selected, and ordered based on the Technological Readiness Level (TRL), which was determined using the 5W + 1H (WHAT, WHO, WHERE, WHEN, WHY, HOW) model. Additionally, case studies were categorized based on VGS implementation types and locations, providing insights into deployment trends across different contexts. The motivations driving the implementation of smart technologies in VGSs and the technological tools employed were analyzed using a bottom-up/reverse analysis approach, with the data being clustered and visualized to highlight key findings. Furthermore, a roadmap was developed to identify past trends and future research directions in the field of VGS technology integration. The methodological procedure followed in the analysis of the literature and the market review, in the case study selection, and in the examination of information is summarized in Figure 1. Each phase is explained in detail in the following subsections.

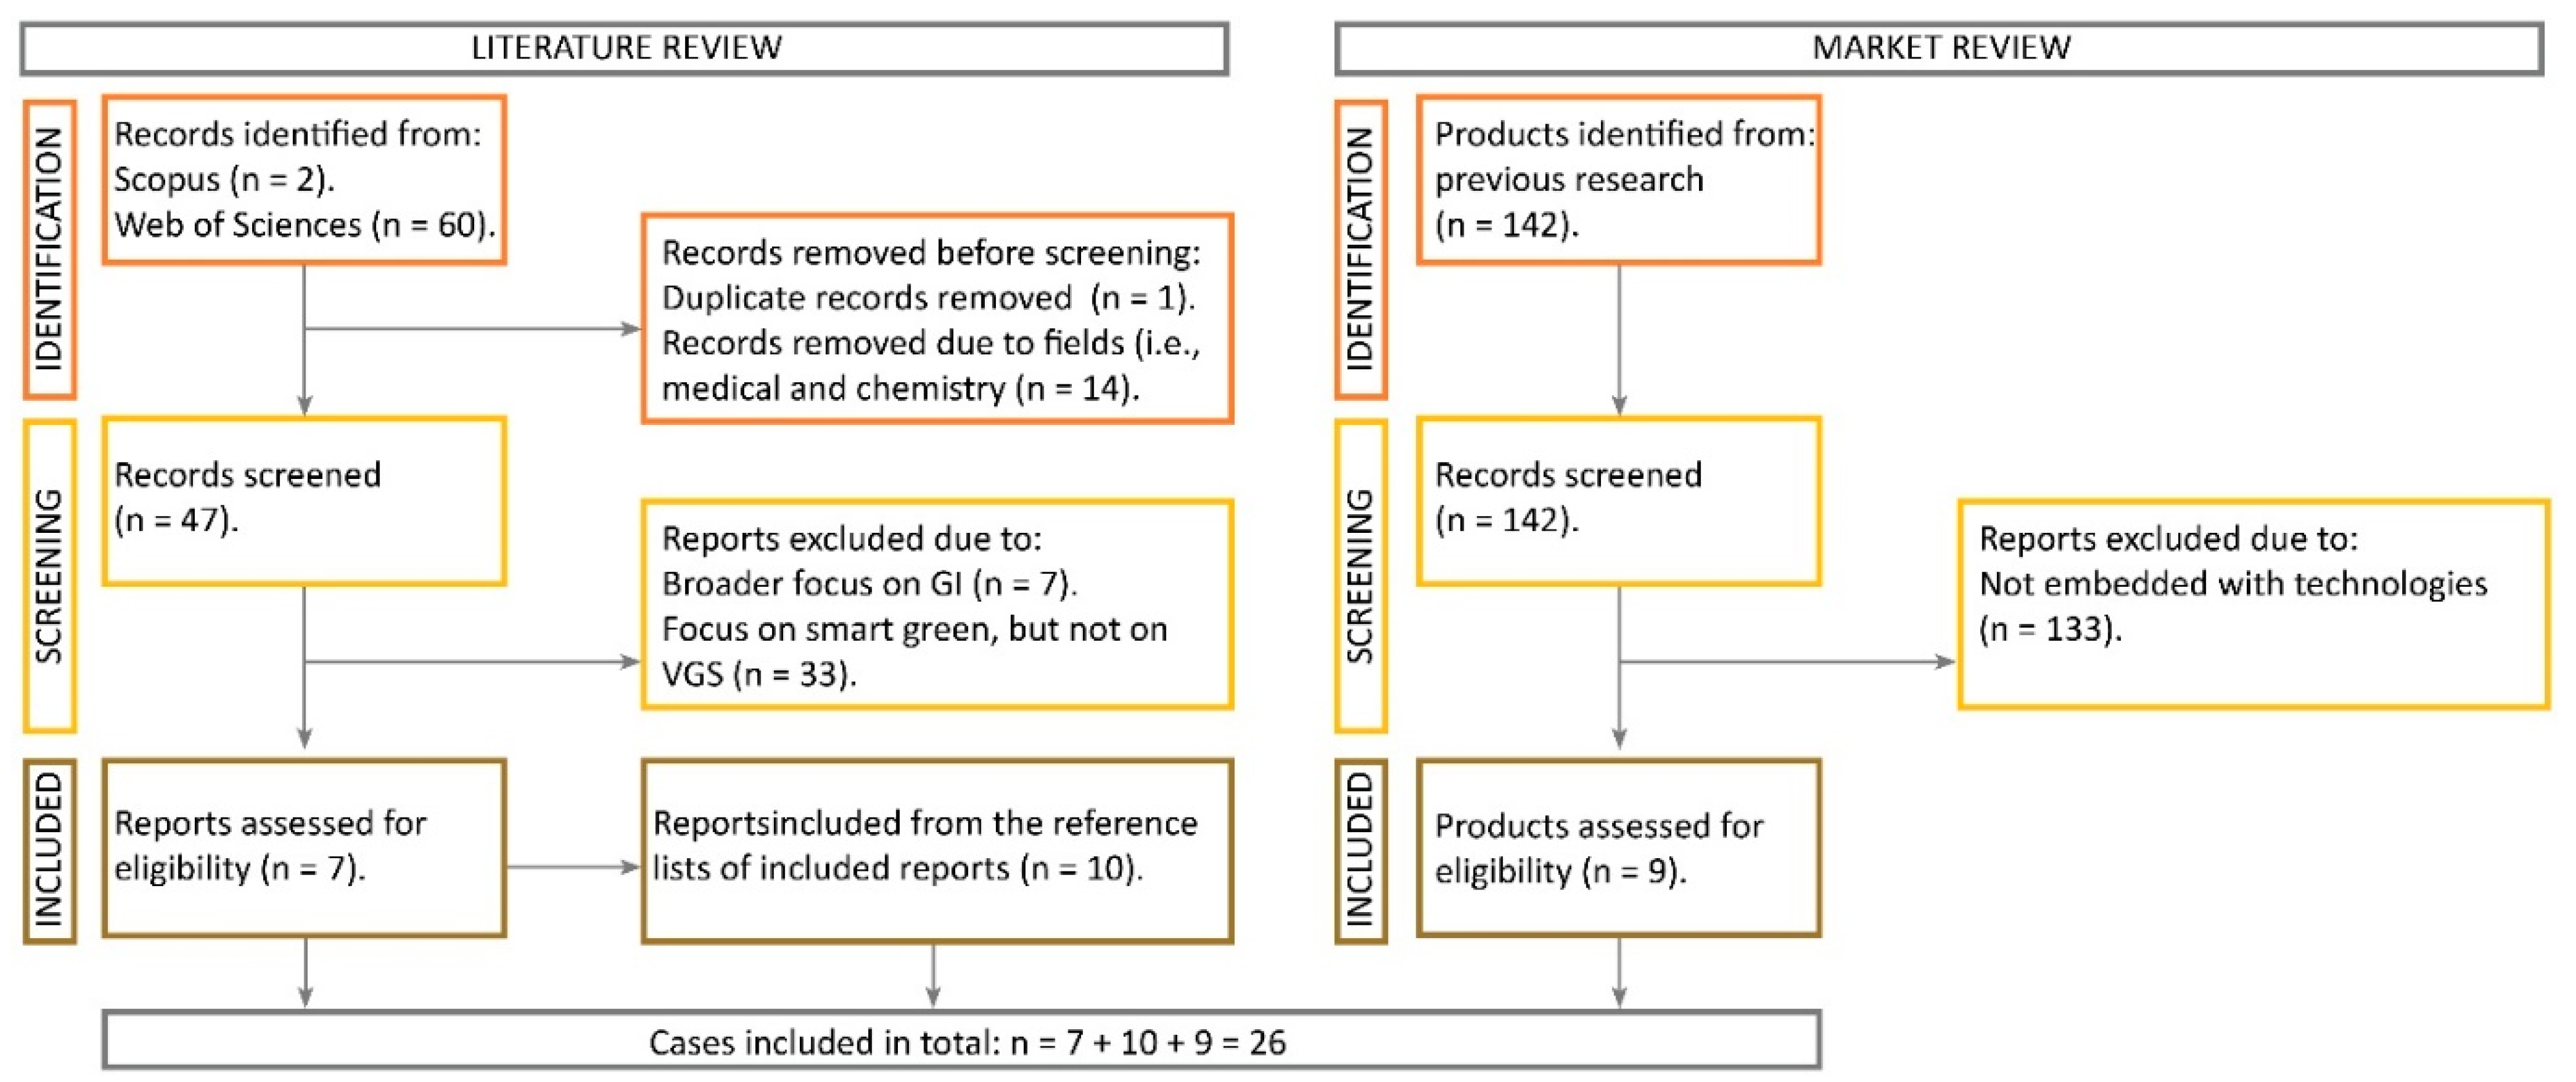
2.1. Data Source and Case Study Inclusion

The data used in this contribution are obtained from a market and literature review focused on recent research activities involving VGSs. In total, data from 17 peer-reviewed publications and 9 products and prototypes available in the market or under production and testing were reviewed and analyzed to obtain an in-depth understanding of the key factors in implementing technologies in VGSs.
For the literature review, the PRISMA guidelines were followed as represented in Figure 2 (left side). The PRISMA was used as a method to transparently systematize the search, findings, and exclusions [33]. Although the PRISMA is not commonly associated with urban planning and design research, its principles have been adapted to improve the documentation and dissemination of research reviews [34]. A previous review study with a similar focus and a contribution from a broad perspective identified the results of smart city development through the PRISMA guidelines [35].
For the market review, the web-based research methods already used and explained in a previous study [6] and reported in Figure 2 (right side) were adopted. The PRISMA method is based on a search strategy, article selection criteria, data extraction, and data analysis procedures. Main data sources are the Web of Science and Scopus search engines. To identify as many eligible papers as possible, search keywords were combined with synonyms and/or with operators. In the Scopus and Web of Science databases, a wide variety of search keywords were used (Boolean operator OR); all of them were combined with the term “technology” using the Boolean operation AND as follows:
‘smart vertical green structure’ OR ‘smart green facade’ OR ‘smart green wall’ OR ’smart living wall’ OR ’smart vegetated wall’ OR ’smart cultivation wall’ AND ‘technology’.
Only papers written in English and with open access were included, limiting the search (LIMIT-TO(OA, “all”)) AND (LIMIT-TO(LANGUAGE, “English”)). Additionally, in the screening step, the references of the examined papers that were included manually allowed us to include 10 additional papers.
In conclusion, 7 papers were included directly from the literature review by implementing the PRISMA method, 10 were included after reviewing their reference lists, and 9 available products were included after the market review [6], with a total of 26 case studies being fully analyzed.

2.2. Case Studies Analyzed through the 5W and 1H Model

An analysis of the included reviewed papers and products was conducted following the 5W + 1H model [36]. Even if this model originates from the discipline of journalism, it is implemented in other fields like architecture and engineering [37,38] since it provides a framework to discern the criteria and/or parameters embedded in research works from different perspectives.
The criteria and parameters detected after the search of information on case studies with different types of technologies implemented in VGSs and the case studies themselves become the reply to the question of WHAT. Additionally, the order criterion (Technological Readiness Level (TRL), explained in Section 2.3) and descriptive properties (given ID number and brief name) of case studies are reported as a reply to the question of WHAT. If the case study is a product from the market, the name given by the manufacturer is used as the brief name, such as C23, C24, and C25. If it is a prototype developed in a research project, the given prototype is considered as in C6 and C16. If it is a conceptual project, the project name is reported as in C1 and C2. Those detected in relation to the zone in which the technologies are implemented in the VGS as well as those related to the geographic areas of installation respond to the question of WHERE. The findings are explained in Section 3.3. Criteria and parameters detected after the search on the motivation behind the installation of technologies in VGSs and the installation modes reply to the questions of WHY and HOW (Section 2.4). The search for information which may be used to reply to the WHO question helps in identifying the beneficiaries of the VGSs and/or the stakeholders that were mostly interested in their installation. The search on this aspect is especially focused on three classes of beneficiaries, i.e., people, public, and private. Their level of benefit is ordered hierarchically and given a score of 1, 2, or 3, where the numbers stand for low, medium, and high interest, respectively. Based on the implementation place, the scoring is realized. The timeline of the TRL and the development of smart technologies in VGSs are depicted after having replied to the question of WHEN, i.e., reporting the year of the case study installation and/or the development time of the prototype.
It is worth mentioning that the information given about the details of technological tools is limited to the descriptions of the systems provided in open data sources.

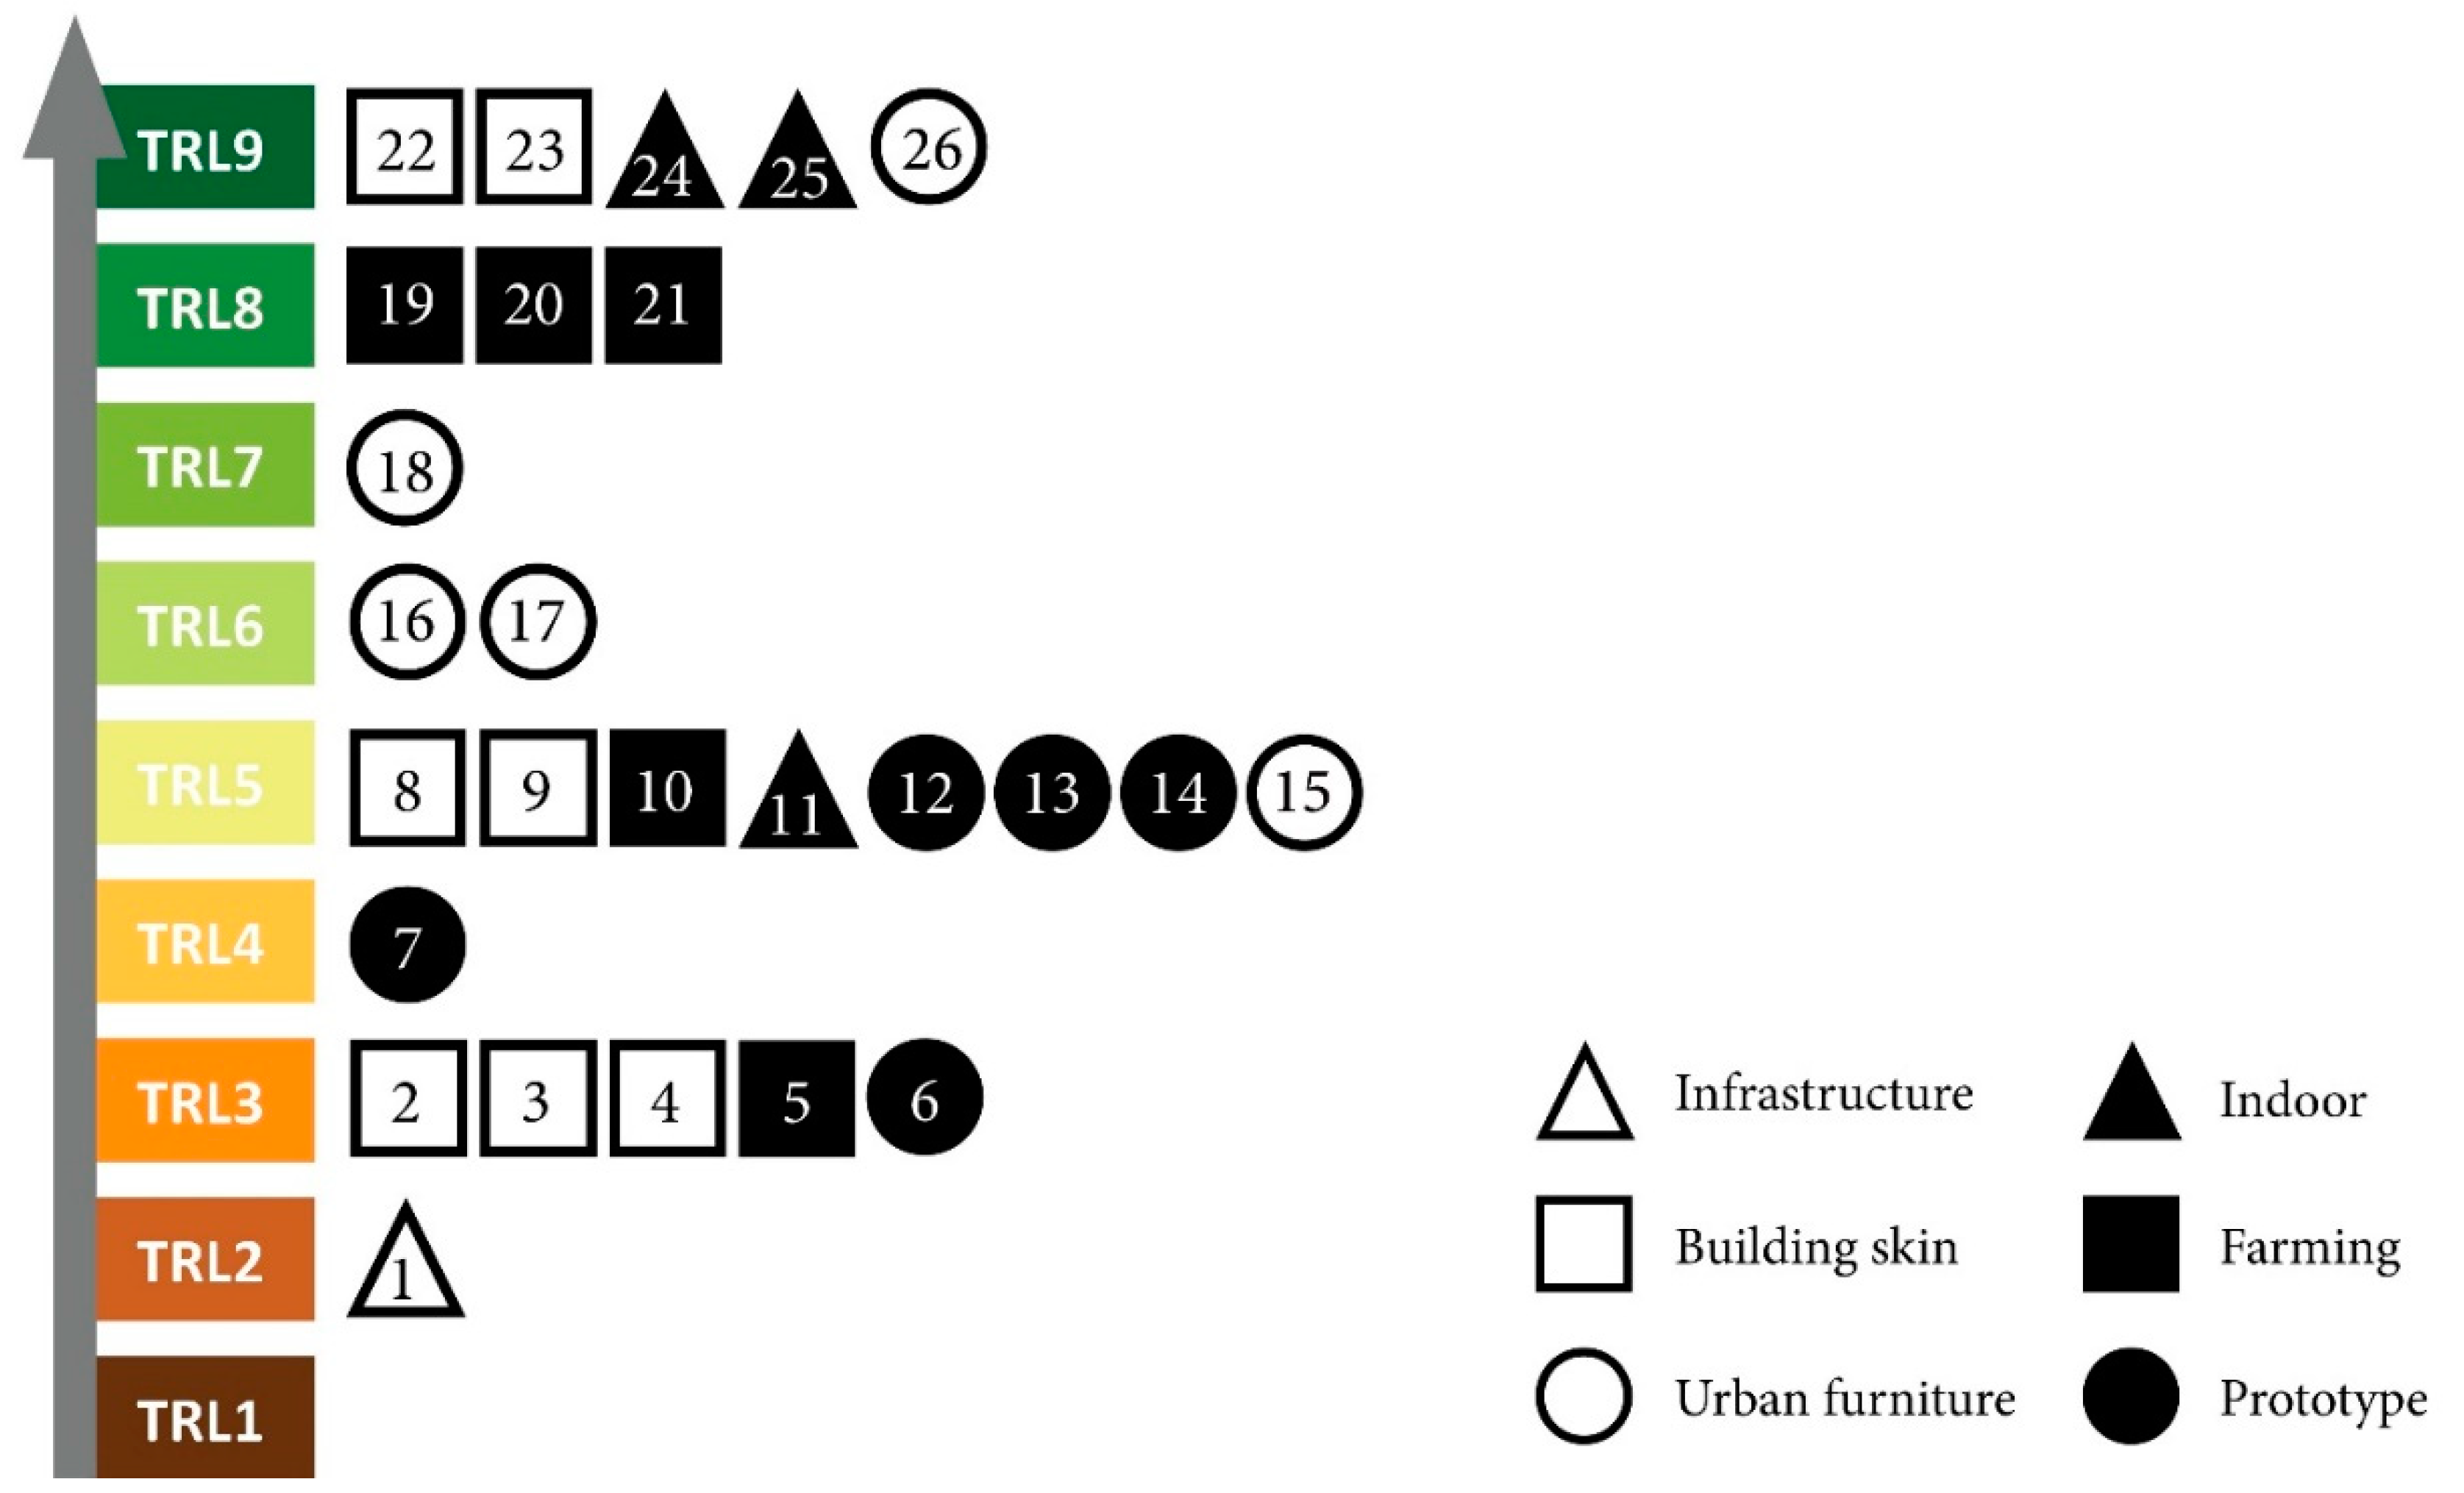
2.3. Case Study Ordering and Location

The case studies extracted from the 26 reviewed papers and other company sources were divided into six main types based on the adopted use of VGSs, i.e., prototype, indoors, building skin, urban furniture, green infrastructure, and farming. This classification is the first aspect of the search for information focused on the reply of the WHAT (case studies) and WHERE questions. The “Infrastructure” classification refers to the VGS case studies belonging to an infrastructure (i.e., bridge) itself in the built environment. If the system is installed in outdoor public areas for the community to use (e.g., as a bench), the implementation is tagged as “urban furniture”.
When a VGS is built indoors to improve the indoor air quality (IAQ), the case study is classified as “indoor”. The “building skin” classification refers to a VGS realized in an outdoor environment on a building façade. The “farming” classification refers to a VGS used as a vertical farming component for food production. Lastly, the implementation is classified as “prototype” when a VGS is developed through research activities and then produced in the form of a prototype.
Besides the implementation places, the countries where the VGSs are installed or developed were reported as well. This is the second aspect of the question of WHERE. In Section 3.3, VGSs with smart technologies are reported, highlighting the country, the implementation location, and the VGS classification—which is visualized with a dedicated symbol and ID number embedded inside the symbol. In particular, the ID number per case study is given after having ordered each case study by its TRL. The TRL is an index that assesses the maturity of the technology [39]. Six different symbols are used to depict VGSs with smart technologies: filled symbols represent the installations which are mostly developed in interiors (i.e., indoor, prototype, and farming), while empty symbols represent outdoor installations (i.e., building skin, urban furniture, and infrastructure).

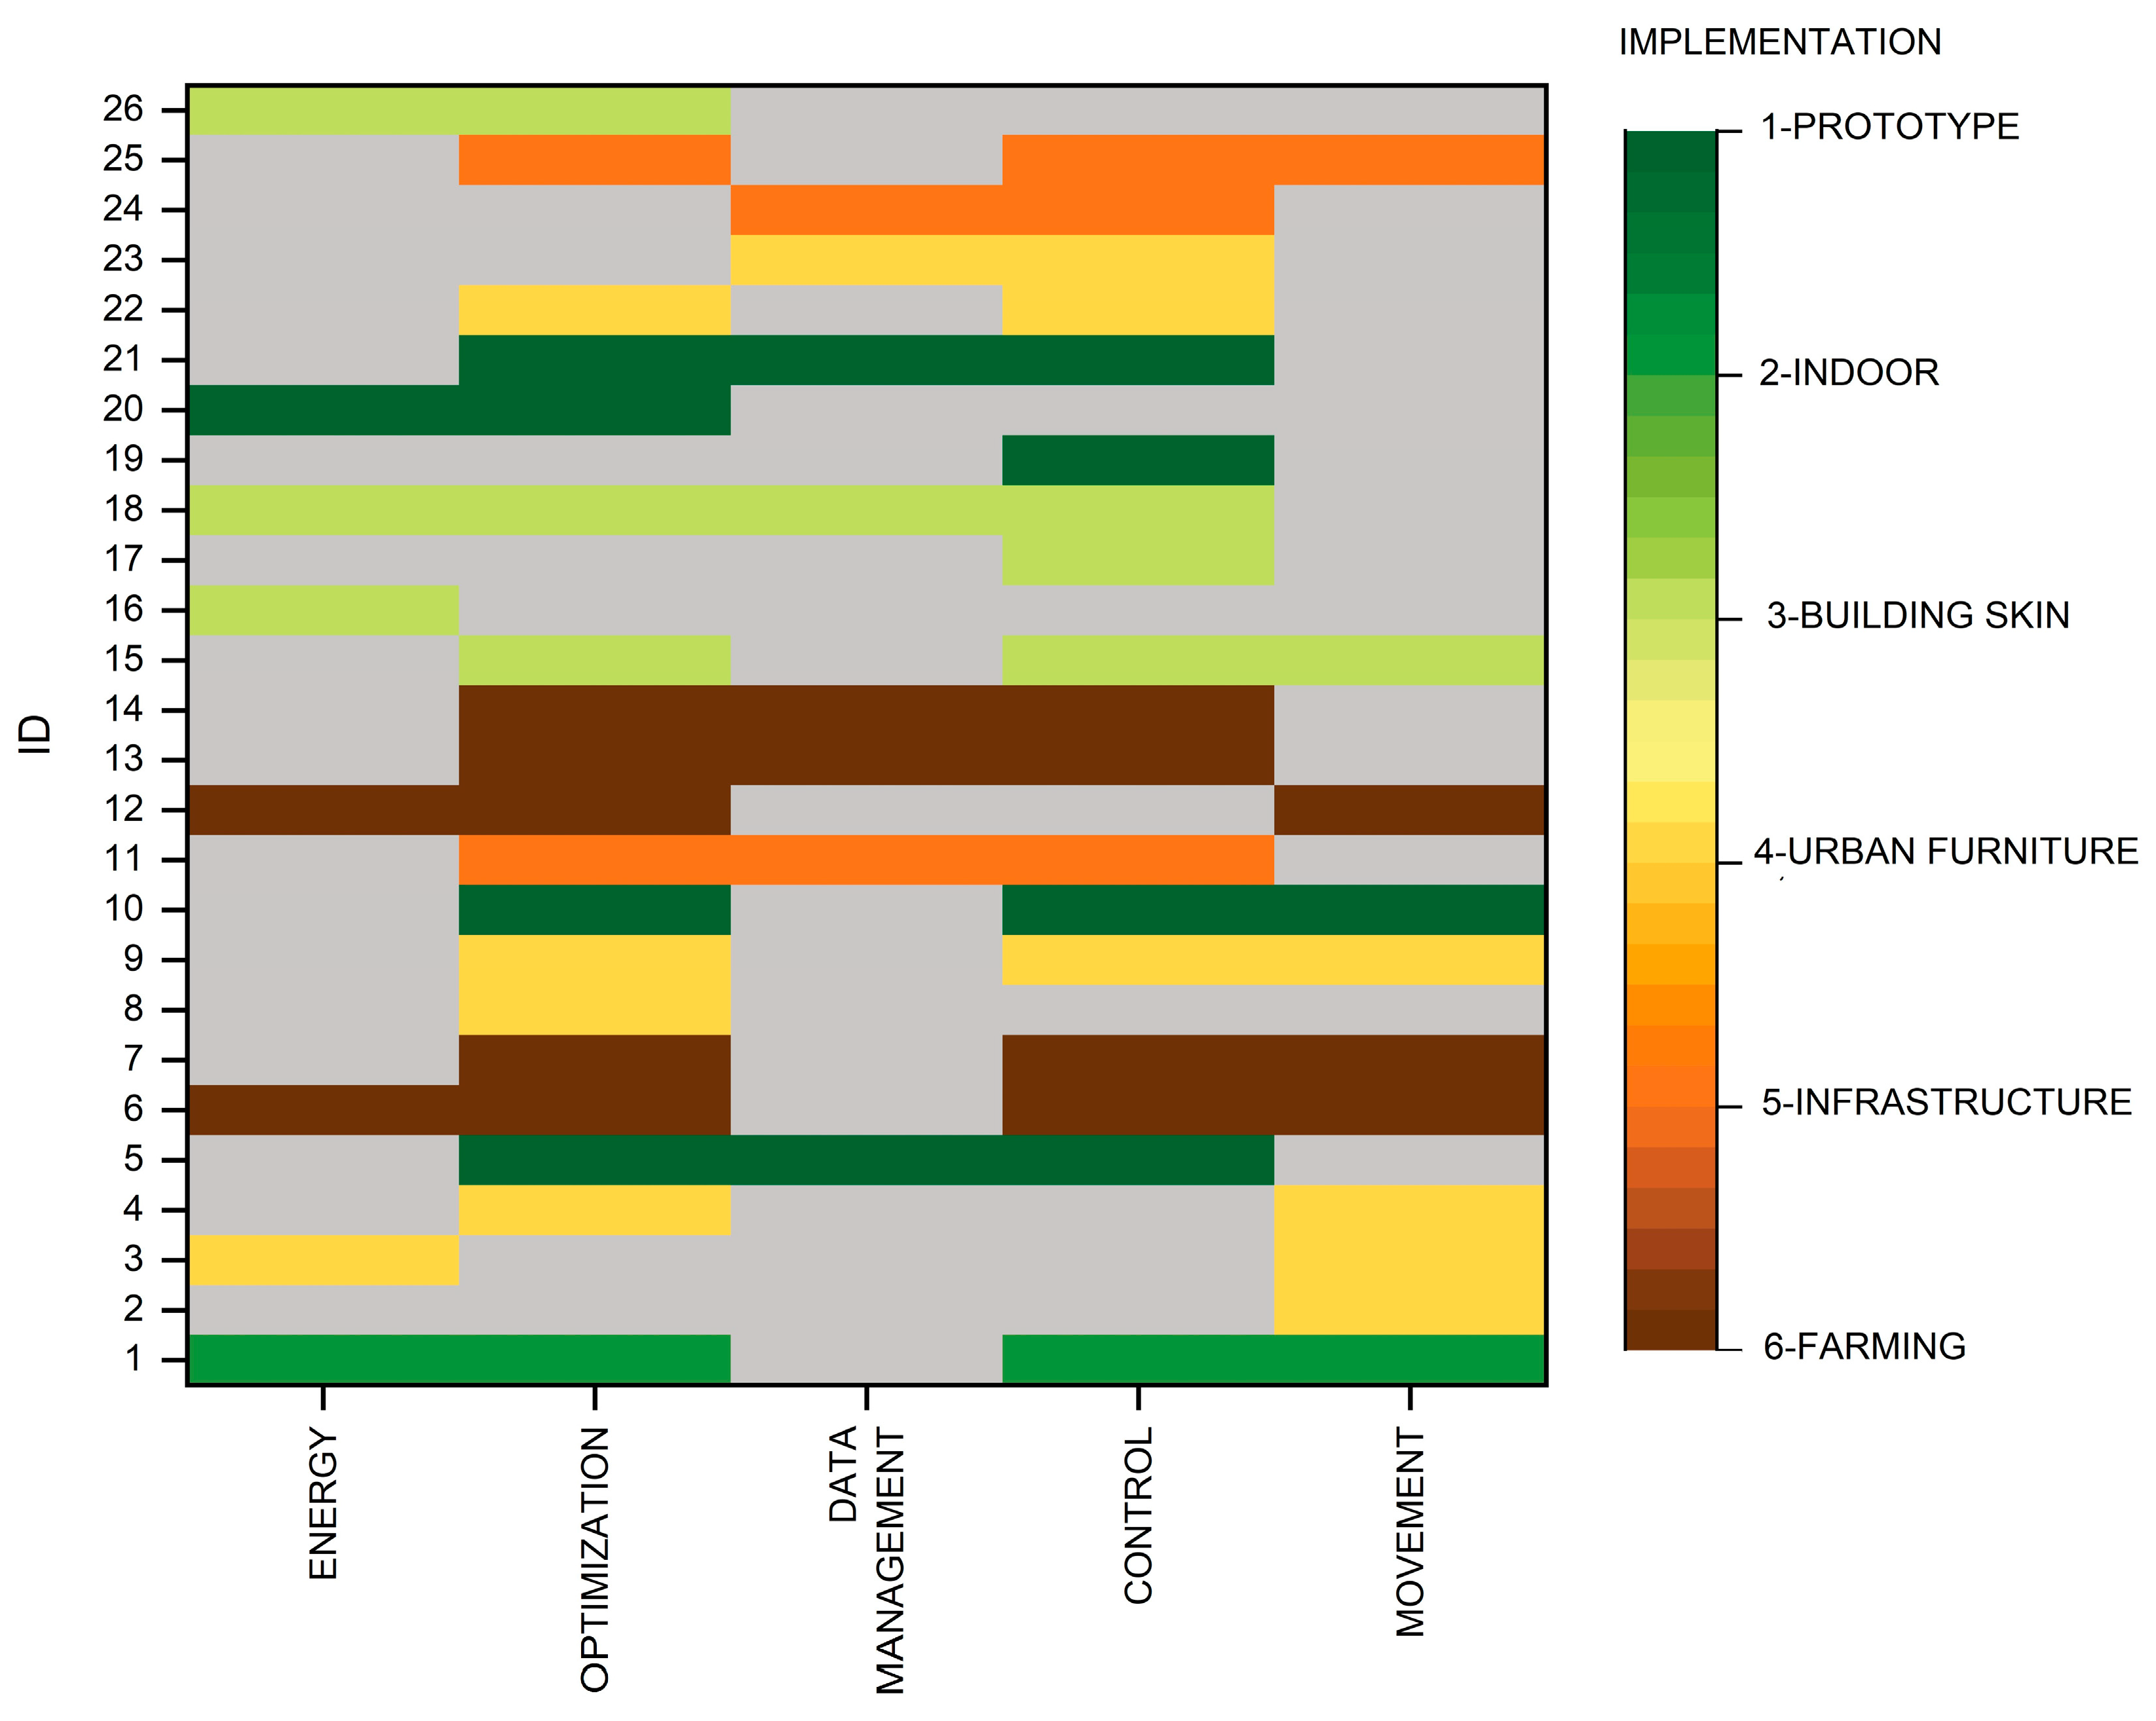
2.4. Main Motivation and Technological Tools in VGSs

Based on the information detected on the VGS case studies and technology inclusion, the main motivations behind the implementation of smart technologies in VGSs have been analyzed in the 26 case studies. The information retrieved for replying to the question of WHY has allowed us to determine that the motivations were strictly linked to the existing working stages of VGSs in use, i.e., for energy, optimization, data management, control, and movement. The process of clustering the information related to the motivation of smart technologies used in VGSs is based on a bottom-up/reverse analysis approach. It starts by reporting the motivations as extracted by the 26 case studies in the form of a detailed list, and then it progresses with the interpretation of the list through a discourse analysis, i.e., a qualitative analysis method used to draw meaning from language in context. In particular, the discourse analysis allowed for the identification of the 5 motivation keywords described above. Finally, it ends with a qualitative cluster analysis of the case studies based on the identification of the motivation keywords.
The same methodological approach has been used, on the other hand, to analyze the technological tools used in VGSs (replying to the question of HOW), grouping the detailed listed information from the 26 papers in 5 main technological tool keywords: hardware, information and communication technology (ICT), software, robotics, system, and other/not disclosed (ND). The percentage of distribution of each technological tool for each motivation is represented with bar charts in Section 3.4.
After the implementation of the 5W + 1H method, which was adopted to extract, analyze, order, and cluster the information in a manageable database, these data were elaborated using a heatmap data visualization technique to underline the magnitude (in case study ID numbers) of the development of smart technologies in VGSs as a color map in two dimensions. Two different heatmaps are presented with the same information on the x-axis and z-axis, which are the main motivation for implementing technologies (i.e., energy, optimization, data management, control, and movement) and the six implementation places (i.e., prototype, indoors, building skin, urban furniture, green infrastructure, and farming), respectively. The first heatmap is based on the TRL order of the case studies (y-axis), and it visualizes the replies to the questions of WHAT, WHY, and WHERE. The second one, instead, is based on the case study implementation year, ordered chronologically, and it visualizes the replies to the questions of WHEN, WHY, and WHERE. All of these findings are reported in Section 3.4.

2.5. Roadmap and Future Forecast

Another type of analysis was also conducted using the information extracted from the 26 case studies to highlight the technological framework that led to the development of smart technologies in VGSs over the past 22 years (one conceptual project from 1994 was not included) and to highlight the most likely directions of future research and practice in this field. This analysis is visualized using the roadmap tool, i.e., “a tool that allows to visualize the direction of a strategic plan (in such a case a technological plan) or that helps in highlighting the goals/outcomes over a specific temporal range, and the major steps or milestones needed to reach them”. In addition, the roadmap tools that were used by the authors in this paper help depict the possible future directions of research in this field.
In fact, in this study, two distinct roadmaps within a single timeline are deployed (Figure 8). The first roadmap, visualized through the symbols presented in Figure 3 and Figure 4, orders the case studies based on their implementation/publication year, effectively narrating the progression of technological milestones. On the other hand, the second roadmap encompasses other milestones such as legal implementations, pioneer iconic examples, and academic events associated with VGSs. The possible interconnections between these two roadmaps are identified and discussed in Section 3.4.
Based on these findings, scenarios of future smart VGS developments are depicted. This study uses a combination of a qualitative content analysis [40] and scenario planning [41] to build three outlines. The scenarios are built by considering the factors of the 5W + 1H models (heatmaps) as well as the PESTEL framework (i.e., political, economic, socio-cultural, technological, environmental, and legal roadmap) [42,43]. For each scenario, the best-case study among those reviewed was detected, and a pros and cons analysis was carried out to examine the positive and negative aspects. The results are reported and discussed in detail in Section 3.4.

3. Results and Discussion

A total of 26 case studies (17 papers and 9 products) are included in the final analysis under the framework of the 5W and 1H model. In the following three sub-sections, the findings of two questions are reported in each. In Section 3.2, Section 3.3 and Section 3.4, the replies to the WHO and WHEN; WHAT and WHERE; and WHY and HOW questions are discussed, respectively.
In addressing potential research deficiencies, the most notable limitation pertains to the relatively limited pool of cases and papers available on the case studies. This limitation stems primarily from the nascent stage of a VGS and its integration with technologies. Given the novelty of these advancements, the availability of relevant case studies and research papers is understandably constrained. Despite making efforts to mitigate this limitation through comprehensive literature and market reviews, the scope of available data remains relatively restricted as there might be other aspects that are not mentioned in the data sources.

3.1. Case Studies Analyzed through 5W and 1H Model

All of the replies to the questions in the 5W and 1H model are reported in a detailed table provided in the Appendix A.
To search for an answer to the question of WHO, beneficiaries and/or stakeholders of VGSs are grouped in three classes, i.e., people, public, and private. All of the cases have benefits towards the three classes, but the level of the benefit may depend on the implementation mode. For example, people may receive greater benefits from “urban furniture” than “indoor” implementation for air purification since the access in the second case is limited. However, private beneficiaries receive more benefits from Indoor implementations since they might increase the real estate values of their buildings. When sorting the scores from largest to smallest for “urban furniture” and “indoor”, the following succession pattern is considered: people > public > private and private > people > public. According to the order for “Building skin”, the analysis reveals that the level of benefits is the highest for private applications, followed by people, and finally, the least impact is observed in the public domain for “indoor” implementations. Notably, the impact on people is limited in the case of “indoor” implementations since they primarily benefit individuals within an enclosed environment in contrast to the broader impact of outdoor “Building skin” applications. Furthermore, the benefits for private applications persist throughout the lifespans of VGSs in both “indoor” and “building skin” implementations, whereas for people, it is limited to the times when they are using the space.
For the public, a VGS is always beneficial, especially when its implementation involves outdoor case studies, since it helps create healthier and resilient urban areas for inhabitants. In fact, VGS implementation contributes to enhancing the amount of green infrastructure networks available to ensure equality in each district by considering volume compactness.
During the case study analysis, buildings and/or infrastructure life cycle stages are considered to search for an answer to the question of WHEN the technologies are used in VGSs. In most cases, all of the technologies are used in the “Usage stage” of the VGS. In fact, there are a few examples of smart VGS technologies that are used in other stages, such as the “production” and “construction” or “end of life” stages. Despite the popularity of plastic-based products in the market, recent research has explored the use of more environmentally friendly materials with lower carbon footprints using different construction technologies. As an example, computer numerical control (CNC) production is used in C17 to build the components, which is one of the innovative examples for VGS production [44]. In addition, in C17, they use plywood as an environmentally friendly material. The second case where technology is used in the “construction” stage is C15. In this case, a 3D printing technique is used to materialize plant containers from wood fibers.
A rare case in which technology is used in the “resource production” stage is C6. In such example, a computational fluid dynamics (CFD) simulation is used to investigate the effects of the structure shape under the wind flow in the pre-design phase. A second example is case study C17, where a simulation model is used to automize plant selection.

3.2. Case Study Order and Location

The selected and investigated case studies’ TRLs vary from TRL2 (i.e., research to prove feasibility) to TRL9 (system test), as illustrated in Figure 3. There is only one case study (C1) which is classified as TRL2, since this Smart Green Bridge [45] was formulated according to its technological aspects but without any experimental proof implemented for validation. Most of the case studies are classified as TRL5 (i.e., technology development from C8 to C15) because the technologies were validated in the relevant environment. Five case studies have the TRL 9 classification (from C22 to C26) since these systems were both proven in an operational environment and available to be implemented. These five cases include two systems classified as Building skin [46,47], two Indoor products [48,49,50,51], and an Urban furniture system [52], i.e., a bench for open public areas.
As Figure 4 shows, the case studies are mainly distributed in Europe (n = 17), while few case studies are in Asia (n = 4), North America (n = 3), and Australia (n = 2). All of the studies from North America (C19, C20, and C21) are farming examples [53,54,55]. The case studies developed in Northern Europe, particularly C11 in Sweden [56], C14 in Norway [57], and C25 in Finland [51], are all focused on indoor implementation. This might have occurred due to the harsh climate at these high latitudes.

3.3. Main Motivation and Technological Tools in VGSs

A detailed interdisciplinary overview of the implemented smart technologies was carried out using a transversal approach. From the analysis of the selected papers, five main motivations for using technologies in VGSs, i.e., energy, optimization, data management, movement, and control, were identified. Each motivation has a few sub-categories (e.g., consumption, production, and storage in the case of energy), as illustrated in Figure 5, with the tools of the technologies used to achieve the purpose being highlighted according to a color code (see the legend in Figure 5). This figure represents the findings to the replies to the questions of WHY and HOW.
The energy cluster refers to the usage of renewable solar energy in a VGS system to produce (and stored) energy to make the different components work, e.g., the monitoring sensors or the robotic arms. The devices used to produce energy can be photovoltaic (PV) panels, as in C1; solar panels, as in C16 and C20; or both panel systems can be used together, as in C3. Additionally, the VGS in C3 is also reported to be compatible with other renewable energy production systems such as solar air panels, bio-reactive collectors, cogeneration solar collectors, and wind turbines [59]. This flexibility makes a VGS a more feasible and effective component to integrate with an energy production system because it provides the possibility of adapting the local renewable energy sources. C3 is also a significant example of how a VGS can be combined with other technological architectural solutions, like glazed façades and/or photovoltaic panels [59]. The energy can be used in addition to provide some other operations of VGSs. For example, lighting can be combined in a VGS system (consumption), and the energy can be used to control the light intensity in the area where different species require different amounts of light to grow (C5, C13, C20, and C21). Based on the information reported in the data sources, the tools used in the energy cluster are mainly hardware (orange color in Figure 5).
Measurements are the most used motivation in optimization (case studies n = 18). Based on the conditions one is interested in optimizing in a specific component, there are different parameters that need to be monitored. For instance, the temperature and relative humidity of the air and/or of the surface are the most measured parameters. The wind speed (C26), precipitation (C26), and atmospheric pressure (C6 and C26) are other environmental parameters that are only measured in few cases. For cases of “farming”, soil parameters are also measured, i.e., the soil moisture (C13 and C21), soil humidity, and soil temperature (C21), to achieve high efficiency in irrigation and soil nutrients (C20) and to check and/or to optimize the amount of nutrients to support plant development. This method of farming integrated in a VGS is called controlled-environment agriculture (CEA), where the acidity level and pathogens can be monitored [60] even if no case studies are reported for these two parameters. Air quality is another condition which is monitored by measuring the CO2 level and fine particulate matters in both indoor (C5, C12, and C25) and outdoor (C18 and C26) case studies. Then, the water level (C8, C12, and C20), water flow (C13), and water quality (C12) are also detected for water management; ambient noise for testing the efficiency of a VGS in decreasing noise pollution (C26); and real-time images to detect sickness in plants (C7, C9, and C10). On the other hand, the second aspect of optimization is modeling, which is only used in “prototypes” (C6 and C12) to simulate an upcoming environmental forecast and to optimize the VGS’s performance. For measurement, the most used tools are hardware due to the high numbers of sensors reported to be installed, whereas software is the most used tool in modeling.
Among all of the defined motivations in the data management analysis, software is the most used tool. It is mainly used to handle real-time data and to filter raw data [55,61,62] to detect anomalies if any exist [57]. The only tool used in the decision-making step is ICT, mainly for programming irrigation, as in C23 and C24 [47,48,49]. Transfer and warehousing are other motivations to use a technology in the data management stage for simultaneous purposes of optimization, control, and movement. Overall, the main tool used to achieve data management is ICT, followed by software (e.g., MATLAB app, containerization platforms like Docker and Kubernete, and open-source IDEs like Apache Flink) and hardware (e.g., processor, router, and Wi-Fi module), respectively.
In movement for VGS maintenance purposes, robotics is the technological tool that is the most used in C7, C9, and C10. Differently, in C9, the robotic technology includes cutting tools, and it crops the plants when needed [63]. It includes a tool for watering as well, and this system is feasible for tall façades. In C2 (the Nara tower project in Tokyo designed by Kenneth Yeang), robotics is used to create aesthetics [9,64]. This case study is one of the preliminary examples where a VGS was designed to be implemented in skyscrapers. This conceptual project has shown how tall buildings can become ecology friendly and has highlighted a few critical architectural issues in skyscraper design related to VGSs: (1) To provide heat, taller buildings need to optimize their use of solar energy. (2) Outdoor areas should be sheltered from wind, and building façades should be designed to respond quickly to changes in weather conditions. (3) The façades should be responsive to climatic changes in real time, with changes occurring within minutes rather than across seasons. C3 and C25, outdoor and indoor installations, respectively, use technology to move air for ventilation. In outdoor case studies, equipment is used to regulate air flow between the internal side and external side of the VGS, whereas in the indoor case studies, electrical equipment is used to return the pure air back into space.
Control is mentioned in 18 case studies, and so is optimization. Control is mainly achieved using hardware and ICT tools, and it is achieved a few times using software. In such case studies, alert systems are used for irrigation to water plants through sending a signal with LED lighting (C15) or to detect irrigation failures and inform the customer or operators (C24). For automation, artificial intelligence (AI) is used through machine learning in seven case studies in total, mainly for maintenance and watering. In C22, AI is exceptionally used to automate the processes of seed germination, transfection, and harvesting. Hardware and ICT are used together for operating purposes through the use of actuators, such as microcontrollers and supervisory systems. C6 [65] is the only case study that uses tools for setpoint modification. Particularly, the prototype is combined with a thermoelectric cooling chip board to reduce the surrounding temperature, thereby generating condensed water to drop-irrigate plants, and a heat recycle dehumidification ventilation device is used to dehumidify the inward air, exchange heat, and ventilate the environment.
Based on the first heatmap (Figure 6), the relationship between TRL, the motivation of using technology, and the implementation place (color code in the legend, z-axis) can be read. This heatmap synthesizes the replies to the questions of WHAT, WHY, and WHERE. First, the case studies which are implemented as building skin, indoor, and farming have high TRLs (ID > 18 has a TRL > 7), whereas the prototypes have lower TRLs as expected. It can be said that there is a trend of “building skin” and “indoor” implementations with higher TRLs in comparison to other implementations. It is reported that there is no single case study which used technology for all of the detected motivations (see Figure 5). However, the most completed ones are C1, C6, and C18, with smart technologies used to cope with four motivations out of five.
Optimization and control are the parts that are more developed with high TRLs, and they were developed together in parallel. Energy and data management are the less developed parts. Energy is mostly related to urban furniture because the case studies in public areas combine VGSs with solar panels. On the other hand, movement is mostly related to building skin, followed by prototype. Due to recent technological developments, more research was conducted to reduce manual maintenance through testing prototypes. Indoor, farming, and urban furniture are implementations of smart technologies VGSs that have—in the case of movement—only one case study each. Movement can reach up to TRL5 maximum except for one case study (C25). This means movement is the topic that still needs more research to be approved for an operational environment.
The second heatmap (Figure 7), with the same information on the x-axis and z-axis as that in Figure 6, but with the installation/publication year on the y-axis, shows either novel technological developments or their use in VGSs. This heatmap represents the replies to the questions of WHEN, WHY, and WHERE. The early examples of technology used in VGSs are mainly focused on urban furniture and farming and represent examples up to 2015. After 2015, the focus shifted towards building skin and prototype for optimization and data management. Energy, in earlier case studies, was the main purpose of smart technology, but its focus decreased after 2018.
Indoor case studies started to exist after 2018, when technology was mainly used for data management and control, since the main purpose of an indoor case study is data acquisition for an air purification check and the monitoring of the indoor air quality (IAQ). Based on the IAQ level, several system components’ control are realized. In contrast of the early case studies of farming, in 2020, a first case of movement mixed with optimization and control was published. Currently, it seems that the practice of using smart technologies in VGSs is carried out to provide control, optimization, and movement, respectively, among the main motivations.
Most completed case studies were carried out in 2015, 2018, and 2020, which are urban furniture, prototype, and infrastructure, respectively. In the case studies’ installation periods, optimization (n = 19) is the most studied topic, whereas energy (n = 8) and data management (n = 8) are the less studied ones. Control (n = 18) is the second most used, and it is followed by movement (n = 10).

3.4. Roadmap and Future Forecast

The final timeline that was created by combining different milestones in VGS research is presented in Figure 8. Even if VGS systems have appeared in urban areas since ancient times [66], the very first patent dates to 1938 [67]. Most of the developments occurred after 1980, which is also the year when a VGS was first recognized by public authorities through the Biotope Area Factor (BAF) [68]. The second most significant legal milestone was an Italian law [69] that included a VGS as an element to increase and develop public and private green areas while highlighting the importance of vegetation for the environment. From a practical point of view, new materials were introduced in the market for producing VGS components after 1980, i.e., geotextile layers, stainless steel cables, and modularized structural support systems. The earliest case study (C2) with such new materials appeared in 1994 in Japan, which was implemented immediately after the first pioneer examples were built in North America. Then, there was a break with no significant activity from 1994 to 2001. After 2001, research and informing events with exhibitions for education purposes took place, as well as governmental initiatives to encourage new VGS installations. Based on the analyzed case studies, it can be said that all of the technological milestones were realized since 2011 as a continuous development with at least one case study per year (except in 2016).
Based on the findings depicted by the legislative and technologic milestones in the roadmaps (Figure 8) and the trends read from the heatmaps (Figure 6 and Figure 7), in this study, we depict and discuss three different possible future scenarios for the further development of smart technologies in VGSs, as listed below:
1—the further implementation of technologies in VGSs in countries with a low GDP;
2—the further implementation of technologies in VGSs in countries with a high GDP;
3—the further implementation of technologies to trigger long-term durability and the economic and practical maintenance of VGSs, especially indoors.
Following the findings from the reviewed papers and products, the best practices recognized in the case studies (i.e., C16, C21, and C25) triggered the analysis of the three scenarios described above (see Figure 9). The best practices were chosen by considering the most necessary benefit for each scenario. These key benefits are reported as italicized text in the figure. However, as NbSs provide multi-benefits simultaneously, in all three scenarios, the ESs are provided in addition to the main key benefits, such as noise reduction, attracting pollinators, biodiversity (for flora and/or fauna), aesthetical value, and mental and physical health.
The first and second scenarios are based on the economic growth of the countries, as this relates to the potential investment in VGSs within those countries. According to the trends in GDP per capita (in US dollars) from 1990 to 2024 [70], countries classified as “advanced economies” have a high GDP with a value of USD 58.26 thousand, while “emerging market and developing economies” have a low GDP with a value of USD 6.7 thousand. As the biggest challenges in VGS implementations are related to economic aspects, this fact was determinative to build the future scenarios. This study aligns with the perspective of categorizing countries by classification into developed (Global North) and undeveloped (Global South) economies. This classification offers a reflection of the analysis, providing insights into the varying economic contexts in which VGSs are implemented.
C16 [71] is chosen as the best-case study for the first investigated scenario of the future direction of research regarding dealing with technology implementation in VGSs installed in low-GDP countries. In such a case, low-tech and economic solutions must be adopted. C16 combines VGSs with renewable energy sources, i.e., solar panels. Low-income countries are mainly located in the tropical/equatorial zone or at a low latitude in a temperate warm zone, e.g., in Africa [72], where the solar energy potential is high; this prototype that is implemented in such zone gives an opportunity to benefit from solar energy. In fact, C16 is initially implemented as a bus stop in open public areas, but it is designed to be scaled up to a range of self-powered sustainable buildings. Both options are stated as best cases for this scenario. In its installation as urban furniture in public areas, it helps to improve the microclimatic condition and mitigate the urban heat island effect (UHI) [10]. Therefore, the physiologically equivalent temperature (PET) is decreased thanks to the added GI. This contributes to the comfort level through a shading effect. This prototype can be scaled up to building skin in low-income countries for short volumes without increasing accessibility and maintenance costs. This helps to improve indoor conditions since the vegetation will act as a thermal insulation layer [8] under high temperature conditions. Research with a case study in Nigeria focused on low-income residences characterized by overcrowding and overheating in interior spaces [73]. Outdoors, the local climate had a high temperature and high humidity levels; hence, overheating indoor was a common problem. This study showed that the VGS caused a very small reduction in the air temperature outdoors, but there was a reduction of a maximum of 2.8 °C indoors in comparison to the bare reference wall. In addition, this study highlighted the importance of the VGS components’ material choice to better control the thermal efficiency performance. This system is also able to cultivate edible plants and allows for the implementation of “farming”.
In both urban furniture and building skin implementations of this type, a VGS provides the chance to improve air quality [11], as in these low-income countries, air pollution is a big threat in urban areas. In addition, the establishment of a VGS can provide new job opportunities [74], and this is the most important social benefit in such countries. It must be noted that all of these forecasted benefits can only be achieved with effective urban policy initiatives and programs in the framework of all green infrastructures adopted in the built environment where citizens should actively participate. Besides the political incentives, the drawback to such installation and maintenance of VGSs remains the availability of water.
As reported in Figure 4, the geographical distribution shows that the smart implementations in VGSs are developed mostly in countries with a high gross domestic product (GDP). This reveals a dichotomy between low-income and high-income countries, which may cause social inequality to continue increasing. In poor countries, VGS systems should be installed in areas where there is water availability, and they should work passively through low-tech and low-cost systems as much as possible. Instead, using a VGS with (smart) high technology can be a solution only in few high-income countries, especially in times of energy poverty, with climate change causing natural hazards. This is due to their high cost of installation and maintenance, high energy consumption with a high energy cost rate, and high water demand, which may become scarce or more expensive due to future expected scenarios of droughts and heat waves.
Although VGSs with smart technologies are novel methods for food production (farming), expanding food security in an urban context with limited landscape availability [62], all of these challenges described above currently exist and can make a smart VGS not fully sustainable within a circular economy framework. Despite a VGS being a component of vertical farming, it is a solution that needs to be further investigated to find a balance between its benefit as a mitigation solution (e.g., climate change threatens more and more arable lands) and its drawbacks. As an example, research in the direction of improving water recyclability and efficient water use in a VGS via smart technology use can enhance the development of a new greenhouse that circumvents the natural water cycle [65]. These cases are almost not feasible in low-income countries (first scenario) as the challenges of high maintenance cost, a lack of pest control, vandalism, tenure status, and socio-cultural misgivings about growing vegetables on walls ask—before the implementation of a smart VGS—for a social change to be implemented through education programs and policies, as highlighted in a recent study [75]. This scenario is optimal where there are existing abandoned buildings, such as former industrial facilities in need of refunctioning as a vertical farm on a larger scale. These cases require expertise in architecture and construction materials and renovation techniques.
C19 [53,62] is selected as the best case for depicting the second scenario since this study is based in a high-GDP country, it presents a smart VGS with a high TRL, and it covers most of the solutions implemented to improve maintenance and energy efficiency in comparison to other farming examples. Despite the positive aspects (e.g., it uses less than one percent of the land that conventional agriculture uses and it consumes one percent of the amount of water [76]; it also becomes independent of weather, season, or climate and shortens the travel distance between the producer and consumer [60]) for increasing food production, the economic feasibility of this system is still under discussion. Technology integration with vertical farming makes food production more efficient because the environmental and soil conditions are fully monitored and controlled thanks to AI. This technology integration increases the production rate [77], optimizes the growth rate, and increases its nutritional value [78]. These technologies come with additional costs for needed equipment as well, such as LEDs (light emitting diode) or HPS (high pressure sodium) lights due to limited daylight since the system is installed indoors [79]. These requirements hence increase the energy cost along with watering and waste management systems. The whole cost not only includes the equipment and/or the system’s cost, but also the high upfront cost [76]. All of these economic challenges decrease the viability to implement such VGS-integrated technology in vertical farming in low-income countries. However, in high-income countries, this system will be economically effective in the long term [80] as it is a current growing investment topic worldwide. However, due to the possible increased use of robotic technologies in the future for automation instead of manual labor, as used in traditional agriculture, it may cause job displacement or unemployment. This highlights an opposite influence of the level of technology with respect to the first scenario.
Finally, this second scenario may trigger an ethical and ecological debate about modern agricultural techniques, i.e., the overuse of genetically modified organisms (GMOs) [81]. From this perspective, using VGSs in vertical farms can be an advantage when GMO usage is not allowed because, thanks to the support of technology, the control of environmental conditions can improve the yield or growing conditions and times required by vegetables and fruits [82,83] despite the land consumed, or it may better cope with mitigation and adaptation solutions to climate change. However, it can also result in a growth of this ethical threat where GMOs are allowed because the combination of environmental and genetic modification can increase the variety of food production but cause long-term side effects that are still not well known [84].
The third and last future direction detected during the literature review combines smart technology with a VGS to enhance its ability to improve the IAQ [6]. IAQ has attracted more attention in terms of health, especially after the COVID-19 pandemic, because air pollution increases infection since the suspended particles of the COVID-19 virus are carried by polluted air (PM) over a longer time [85]. In the case of IAQ applications, indoor implementations are more practical to install, control, and maintain for a longer time. Hence, for the third scenario, C25 was selected as the best practice. This is one of the investigated “indoor” case studies with a particular focus on improving the IAQ through working as a fully automated indoor air purifier and humidifier. It is an active and tried-and-true system whose performance has been tested scientifically [51,86,87,88] and practically [50] after its installation in many countries. It takes advantage of the natural capacities of (1) roots and growing media to absorb polluted air and of (2) roots to purify polluted air. The process is finalized by returning clean air back to the indoor environment through fans before the next cycle starts. In this process, sensors are embedded into the system to measure the parameters, and AI directs the functions of the control automatically. In the meantime, a remote system simultaneously transmits data and sends notifications to the user to assess the IAQ levels and eventually improve maintenance when needed. It has an advantage in irrigation since there is no need to build a plump system; however, the water tank needs to be filled manually each week. From a social point of view, having these types of VGSs indoors helps to improve mood, reduce stress levels, and enhance cognitive capabilities and working performance. It gives many alternatives in dimension and color. It is also possible to plant one or both sides of the wall and to move or rotate it to avoid monotone areas and bring dynamism. It can also be used as an interior separator to divide spaces.

4. Conclusions

This study aimed to forecast the possible future directions of Vertical Green Structure (VGS) developments by examining the positive and negative aspects of smart VGSs, enhancing adaptability in future resilient cities. By analyzing 26 case studies from various countries, it assessed the technology that is currently utilized in VGSs, exploring the rationale behind each smart initiative and investigating the potential of VGSs to be transformed into SGIs in smart cities. While the number of reviewed case studies may appear limited, it is important to note that Vertical Green Structure (VGS) systems and their technology integration are relatively recent developments. As such, the available pool of case studies is inherently constrained by the novelty of these advancements.
The findings show a diverse technology utilization in VGSs, driven by motivations of energy-related aspects, optimization, data management, movement, and control mechanisms. The implementation modes varied, including prototype, indoor, building skin, urban furniture, green infrastructure, and farming. Technology is harnessed through hardware components, information and ICT, software programs, robotics, integrated systems, and other unclassified categories. Consequently, the incorporation of technology into VGSs yields distinct benefits to public and private entities and people as individuals with varying levels of benefits.
Based on a qualitative content analysis, this study presents three potential future scenarios for technology implementation in VGS, i.e., (1) in low-GDP countries, (2) in high-GDP countries, and (3) for long-term durability and economic and practical maintenance indoors. Each scenario has distinct pros and cons driven by multifactorial forces. Despite having differences, VGSs in all scenarios offer many ecosystem services simultaneously, such as the retention of stormwater [13], noise reduction [14], pollination by attracting pollinators [15], biodiversity enhancement [16], aesthetical value [19], and the improvement of mental and physical health [20], regardless of their primary motivation for installation. In a case where a VGS is scaled up to building skin, it can enhance energy efficiency in buildings [8] and alleviate sick building syndrome [9]. However, challenges include a lack of green infrastructure policy in urban design and limited community awareness, highlighting the need for early policy involvement and community education.
Considering each depicted scenario, despite the current emphasis on VGS irrigation and maintenance, there is a lack of focus on innovative pre-design approaches. Two potential avenues include prefabricated panels made from eco-friendly materials and the use of simulation tools for scenario evaluation. Multidisciplinary collaboration among stakeholders, including architecture, biology, civil engineering, and data science, is essential for successful VGS integration. Additional expertise, such as expertise in mechanical and agricultural engineering, growth management, and cybersecurity, is crucial for addressing challenges and fostering innovation. The third scenario specifically employs embedded sensors, AI automation, and remote systems to enhance air quality. While offering social benefits and design flexibility, challenges include manual water tank filling and limited plant options.
In conclusion, even if VGSs initially started to be implemented within the framework of NbSs, the current trends in the market and the growing interest in academia indicate a shift towards technology-based solutions (TbSs). This shift suggests a broader reliance on technological advancements and innovations to address sustainability challenges in smart urban environments. While NbSs emphasize nature-inspired solutions to be in harmony with natural systems, TbSs place a stronger emphasis on the integration of technology and data-driven solutions. In the case of GIs, including VGSs, TbSs leverage advancements in fields such as ICT, automation, data science, and robotics to optimize performance and functionality. The shift from NbSs to TbSs reflects the potential of technological tools to enhance the efficiency, effectiveness, and scalability of smart sustainability solutions in urban areas. By integrating smart technologies, e.g., advanced monitoring systems and automation through AI, TbSs offer opportunities for real-time performance optimization, predictive maintenance, and improved resource (i.e., soil, water, and vegetation) management within both VGS and GI projects. Since the thermal benefits of VGSs are evident day by day thanks to the growing amount of research in the literature, technology implementation will help increase these benefits in the framework of climate change. All three depicted scenarios are possible strategies to mitigate different challenges that emerged due to climate change.
However, it is important to note that this shift does not negate the value and importance of NbSs. Both approaches should complement each other, with NbSs providing the foundation of integrating nature into built environments and with TbSs enhancing and augmenting these NbSs with technological advancements.

Author Contributions

O.O.: conceptualization, writing—original draft, data curation, formal analysis, visualization, and writing—review and editing. J.N.T.: conceptualization, formal analysis, writing—original draft, writing—review and editing, and funding acquisition as a PhD supervisor and through the HARMONIA H2020 project. C.B.: conceptualization, formal analysis, data curation, writing—original draft, writing—review and editing, supervision, and funding acquisition as a PhD supervisor. All authors have read and agreed to the published version of the manuscript.

Funding

This paper is funded by the HARMONIA project under grant number 101003517 since the corresponding author is the coordinator of the HARMONIA project. Furthermore, this work was possible within the framework of the PhD scholarship in co-supervision with Politecnico di Milano (POLIMI) and the Norwegian University of Science and Technology (NTNU) under the cotutelle PhD agreement of the first author.

Institutional Review Board Statement

Not applicable.

Informed Consent Statement

Not applicable.

Data Availability Statement

The data will be made available by authors upon request.

Conflicts of Interest

The authors have no competing interests to declare.

Abbreviations

To simplify some aspects in the paper, the following abbreviations are utilized:
5W1Hwhat, who, where, when, why, and how;
AIartificial intelligence;
AQair quality;
Ccase study;
CFDcomputational fluid dynamics;
CNCcomputer numerical control;
ESecosystem services;
GDPgross domestic product;
GIgreen infrastructure;
IAQindoor air quality;
ICTinformation and communication technology;
ITinformation technology;
LEDlight emitting diode;
MLmachine learning;
NbSnature-based solution;
PESTELpolitical, economic, social, technological, legal, and environment;
PETphysiological equivalent temperature;
PRISMAPreferred Reporting Items for Systematic Reviews and Meta-Analysis;
PVPhotovoltaic;
SDGsustainable development goal;
SGIsmart green infrastructure;
Tbstechnology-based solution;
TRLtechnological readiness level;
UHIurban heat island;
VGSvertical green structure;
WSNwireless sensor network.

Appendix A

Table A1. Case studies analyzed through 5W and 1H model.
WHATWHO (PPP)WHEREWHENWHYHOW
TRLNo.Reference(s)PeoplePublicPrivateT-VGS ImplementationLocationYearMain MotivationMotivation in DetailMain TechnologyTechnology in Detail
21Smart Green Bridge [45]231InfrastructureCzech Republic2020EproductionHWphotovoltaic panels
Estorage (from PV and release when needed)HWelectrochemicals (energy/battery storage)
Coperation (not discussed)HWcontrol unit
Mirrigation (to collect water from road/highway)Oretention tank
Omeasurement (water content in soil)HWsensors (soil moisture sensors)
Mirrigation (to move water to plants)HWelectrical pumps
32Tokyo Nara Tower [9,64]213Building SkinJapan1994Maesthetic (to move on external track that spirals the tower in vertical circulation)Rrobot arms (cherry-picker devices)
Maesthetic (to rotate plectrum-shaped floor plates)Rrobot track system
3AIF (intelligent interactive façade) [59]213Building SkinCroatia2014Mventilation (to regulate air flow between interior and exterior)OTventilation ducts
Eproduction (to heat water)HWphoto-voltage solar panels
Eproduction (to heat water)HWthermal solar panels
Eproduction (to integrate with HVAC system for heat recovery)HWsolar air panels
Eproduction (to provide power)Sbio-reactive collectors
Eproduction (to provide power)Scogeneration solar collectors
Eproduction (to provide power)ASwind turbines
4Kinetic Green Canvas [65]213Building Skinnot discussed2017Maesthetic (to rotate cube modules)HWmotor in each cube module
Onot discussedHWsensors
Maesthetic (to reflect image on VGS)Salgorithm
5VFO (Vertical Farm Ontology) [89]231FarmingRepublic of Korea2013Omeasurement (temperature)HWsensors (temperature)
Omeasurement (humidity)HWsensors (humidity)
Omeasurement (CO2 level)HWsensors (CO2)
Omeasurement (light level)HWsensors (illuminance)
DMtransfer (to send values from sensors to server)ICTwireless communication protocol
Coperation (to control actuators)ICTwired communication protocol programmable logic controller (PLC)
6GEWA (Green Energy Water-Autonomous Greenhouse System) [65]123PrototypeTaiwan2018Eproduction (to convert absorbed light energy into electric energy)HW(solar power generation device)
Csetpoint modification (to reduce surrounding temperature, thereby generating condensed water to drop-irrigate plants)HWthermoelectric cooling chip board
Coperation (to regulate and control power supply acting as splitter or dimmer glass)HWsolar photovoltaic chip
Mirrigation (to recycle condensed water or rainfall)OTrecycle pipeline + inlet
Coperation (to control structure, thermoelectric cooling chip board and devices listed above)ICTElectronic supervisory system
Csetpoint modification (to adjust ventilation amount, air speed, air withdrawal, and air exhaustion)HWventilation device
Omeasurement (to detect temperature and humidity)HWsensors (thermo-hygrometer)
Omeasurement (to detect air pressure values)HWsensors (barometer)
Csetpoint modification (to dehumidify inward air, exchange heat, and ventilate)HWheat recycle dehumidification ventilation device
O(modeling) to simulate environmental simulations of wind flowSWCFD simulation (Windperfect DX)
47Wallbot prototype [28,90]123PrototypeAustralia2020Mmaintenance (to maneuver Wallbot’s body)OTactuated ropes
Mmaintenance (to control services of Wallbot across VGS)Rcomputer-controlled smart winches
O(measurement) to measure drum position and length of ropeHWelectromechanics (encoder)
Coperation (to control rotational speed of winch)HWmicrocontroller
Omeasurement (to track motions of Wallbot body)HWoptical tracking camera
Omeasurement (to build 3D map of detected scene)HWsensors (stereo infrared)
Omeasurement (to calculate NDVI and measure general health of VGS and track state of smart winch)HWmulti-spectral survey camera
58Smart Bio-façade [48]213Building SkinQatar2018Omeasurement (to indicate level of water and control amount of watering)HWsensors (water level indicator)
Omeasurement (to measure exterior surface temperature)HWsensors
Omeasurement (to measure interior surface temperature)HWsensors
9Green Wall Robot—concept 1 [63]213Building SkinGermanynot discussedOmeasurement (to check plants for diseases and give feedback)Rcable robot
Cautomation (to reduce manual maintenance)ICTartificial intelligence
Mmaintenance (to crop plants)Rcutting tool
Mirrigation (to water plants)Rspraying tool
Omeasurement (to scan plant conditions)HWcamera
10Green Wall Robot—concept 2 [63]231FarmingGermanynot discussedMmaitenance (to move autonomously on rails and undertake all planting, care, and maintenance work)Rrail-driven robot
Cautomation (to reduce manual maintenance and watering)ICTartificial intelligence
Omeasurement (to differentiate between various types of plants, remove individual submodules containing diseased or dead plants and replace them with new ones)SWimage processing
11Active plant wall based on Cloud and IoT [56]213IndoorSweden2018DMdata transfer (to transmit sensor data to and receive messages from cloud)HWmicroprocessor
Coperation (executing control functions to take care of plant wall)HWmicroprocessor
Csensor readingsHWmicrocontroller (Arduino Uno)
Omeasurements (temperature and relative humidity)HWsensor (Grove DHT11)
Omeasurements (luminosity level)HWsensor (SI1145 light sensor)
Omeasurements (CO2)HWsensor (MH-Z16)
Omeasurements (PM)HWsensor (Grove dust sensor)
Omeasurements (gas)HWsensor (Grove multichannel gas sensor)
Omeasurements (ultrasonic)HWsensor (UNAM 18U6903/S14)
CoperationHWactuators
Coperation (to connect gas sensor and light sensor)HWArduino board
Coperation (to connect PM, temperature, and humidity sensor)HWdigital IO
DMtransfer (to fetch data from CO2 sensor)HWUART
DMtransfer (communication between Arduino Uno and Edison)ICTSPI bus
DM
C
SWimplementation of local control unit
DMwarehousing and decision making (to enable remote monitoring and management system)ICTCloud
12System developed to obtain potable water [91]123PrototypeSlovakia2018Mirrigation (to accumulate rainwater)OTwater tank
Econsumption (to filtrate rain and gray water to obtain potable water)NDnot discussed
Omeasurement (grey water quality)HWsensors
Omeasurement (water quality after filtration)HWsensors
Omeasurement (water amount caught by substrate)HWsensors
Omeasurement (filtered water amount)HWsensors
Omeasurement (humidity)HWsensors
Omeasurement (temperature)HWsensors
Omeasurement (CO2 level)HWsensors
Omodeling (to know what total runoff will be)not dicussednot discussed
13System developed in University of Cordoba [61]123PrototypeSpain2019Coperation (to interact with objects and/or wide variety of switches and sensors, to control motors and other physical outputs)HWmicrocontroller board (Arduino UNO)
DManalysis (to develop it for boards)SWopen-source IDE
Cautomation (to create web displays of automating)HWethernet shield board
DMtransfer (to connect Arduino)ICTinternet protocol suite (TCP/IP)*
DMtransfer + warehousing (data received from sensors)ICTIoT platform service/website (ThingSpeak)
DManalysis (for numerical computation)SWMATLAB App
DMwarehousingHWRaspberry Pi processor
DMdecision making (to program data collection system of VGS)ICTserver configuration (Linux, Apache, MySQL, and PHP-LAMP)
Omeasurement (to determine moisture in soil and generate value based on level of moisture)HWsensors (FC-28 soil moisture)
Omeasurement (relative humidity and temperature)HWsensors (DHT22)
Omeasurement (light intensity reaching to VGS)HWsensors (light dependent resistor (LDR))
Omeasurement (rain drops and carry out operations, e.g., switching system off when it rains)HWsensors (Y8L3-r8a3i nrasienn)
Omeasurement (to determine flow of water in VGS and indicate level of water consumption)HWsensors (YF-S402 water flow)
Coperation (to program all sensors)HWsensors (YF-S402 flow)
14Fog-cloud data processing and orchestration implemented in VGS [57]123PrototypeNorway2021Omeasurement (temperature, humidity, and light)HWelectronics with embedded sensors (single-board computer (Raspberry Pi))
DManalysis (to configurate and virtualize hardware resources)ICTCloud (Docker + Openstack)
DMdeployment (to configurate and virtualize hardware resources)ICTfog (Docker)
DManalysis (to package software components and their independencies)SWDocker
DManalysis (to automate fog-clod application deployment, scale, and management)SWKubernete
DManalysis (to support event-driven and data-flow applications)ICTCloud (Flink)
ICTfog (Flink)
DManalysis (to handle real-time data feeds)ICTCloud (Kafka)
DManalysis (to handle real-time data feeds)ICTfog (Kafka + MQTT)
DManalysis (to read real-time data and filter primitive data)SWprocess engine(s)
DMtransfer (to send processed data)SWprocess engine(s)
DMwarehousing (locally or push for further process)ICTfog nodes (through Kafka)
DMtransfer + warehousing (to push data for data analytics and long-term storage)SWApache Flink
Cautomation (data inference for automatic decisions (e.g., watering))ICTartificial intelligence
15Smart responsive VGS [32]321Urban FurnitureRomania2020Cautomation (to control all stations)ICTSCADA system or expert system*
Cautomation (to control artificial LED lighting)HWPLC type CPU
Cautomation (to control light to plants, ambient light for people and night lighting)HWsensors (light intensity sensors)
Maesthetic (to open photomorphic structure)SWnot discussed
Omeasurement (humidity)HWsensors (humidity sensors)
Calert (to send signal to water plants)HWLED
Calert (to respond to service (or number) of people)HWelectronics (motor) and actuators
616P2P (Plant to Power) Solar Hub [71]321Urban FurnitureEngland2014Eproduction (to generate negative and positive charges)HWsolar panels
Eproduction (to harness solar light and generate electrical current)OTbioelectrochemical system (plant-BES)
17Green Structure [44]321Urban FurniturePoland2023Cautomation (to automize plant selection)SWsimulation (Rhinoceros + Grasshopper + Ladybug)
718CityTree [92,93]321Urban FurnitureGermany2015Coperation (to supply electronic components in control and steering circuit)HWphotovoltaic system
DMtransfer (to provide cloud connection)HWLTE router
Econsumption (to provide light)HWLED lighting
Omeasurement (temperature and humidity for optimal care of mosses)HWsensors (moss control sensors)
Omeasurement (fine dust)HWsensors
819Podponics [53,62]231FarmingUSA2014Cautomation (to sense and control growing environment and manage growing process)ICTLinux-based IoT autonomous system
20Gotham Greens [54,62]231FarmingUSA2011Omeasurement (light intensity)HWsensors (lighting)
Omeasurement (soil nutrient)HWsensors (soil nutrients)
Omeasurement (level of water)HWsensors (water level)
Omeasurement (temperature)HWsensors (temperature)
Omeasurement (humidity)HWsensors (humidity)
Eproduction (to provide electricity)HWsolar photovoltaic renewable energy system
21City Farmers [55,62]231FarmingUSA2011Omeasurement (soil moisture)HWsensors (YL69)
Omeasurement (soil humidity)HWsensors
Omeasurement (temperature and relative humidity)HWsensors (DHT22 OR DHT11)
Omeasurement (soil temperature)HWsensors (DS18B20)
Omeasurement (luminosity)HWsensors (AD-018 photo resistor module)
Coperation (not discussed)HWlamp control relay
Coperation (not discussed)HWpump control relay
Coperation (not discussed)HWArduino nano shield (Funduino)
DMtransferHWWi-Fi module (ESP8266-01)
DManalysisICTCloud (Thingspeak)
922System developed by Patrick Blanc [46]213Building SkinFrance2012Cautomation (to automize process of seed germination)ICTartificial intelligence
Cautomation (to automize process of transfection)ICTartificial intelligence
Cautomation (to automize process of harvesting)ICTartificial intelligence
Omeasurement (temperature)HWsensors (N153)
Omeasurement (moisture)HWsensors
23VP-MODULO by Verde Profilo Srl [47]213Building SkinItaly2018Cautomation (to program irrigation system)HWnot discussed
DMdecision making (to program irrigation system)ICTnot discussed
24Vicinity [48,49]213IndoorAustralia2018C(alert) to detect irrigation failures and alert customer and operatorsHWnot discussed
DMdecision making (to change pump and irrigation timing, adjust settings on irrigation, and set up alerts)ICTweb-based management platform
25Naava One system (Naturvention Pty) [50,51]213IndoorFinland2018Mventilation (to return pure air back into space)HWelectrical fan
Mirrigation (to move water to plants)HWelectrical pump
Omeasurement (quality of indoor air and plants)HWsensors
Omeasurement (quality of indoor air and plants)ICTNAAVA app
CoperationICT
Mirrigation (to supply water for plants)OTwater reservoir
26Smart Living Bench by Nemec [52]321Urban FurnitureCzech Republic2022Econsumption (to provide light in public areas)HWintegrated LED light
Econsumption (to provide free Wi-Fi hotspot)ICTnot discussed
Econsumption (to provide free charging spot)HWnot discussed
Eproduction (to power irrigation system)Ssolar energy (not discussed)
Omeasurement (CO2 level)HWsensors
Omeasurement (temperature and relative humidity)HWsensors
Omeasurement (atmospheric pressure)HWsensors
Omeasurement (ambient noise)HWsensors
Omeasurement (precipitation)HWsensors
Omeasurement (wind speed)HWsensors
NOTES: E: Energy, M: Movement, C: Control, O: Optimization, DM: Data Management. ICT: Information and Communication Technology, HW: Hardware, SW: Software, R: Robotics, S: System, OT: Other, ND: Not Discussed.

References

  1. Ramyar, R.; Saeedi, S.; Bryant, M.; Davatgar, A.; Hedjri, G.M. Ecosystem services mapping for green infrastructure planning–The case of Tehran. Sci. Total Environ. 2020, 703, 135466. [Google Scholar] [CrossRef] [PubMed]
  2. Benedict, M.; McMahon, E. Green Infrastructure: Linking Landscapes and Communities; Island Press: Washington, DC, USA, 2012. [Google Scholar]
  3. Directorate-General for Environment. Green Infrastructure-Environment-European Commission n.d. Available online: https://ec.europa.eu/environment/nature/ecosystems/index_en.htm (accessed on 13 January 2023).
  4. Almenar, J.B.; Elliot, T.; Rugani, B.; Philippe, B.; Gutierrez, T.N.; Sonnemann, G.; Geneletti, D. Nexus between nature-based solutions, ecosystem services and urban challenges. Land Use Policy 2021, 100, 104898. [Google Scholar] [CrossRef]
  5. Haase, D. Nature-based solutions for the contemporary city/Re-naturing the city/Reflections on urban landscapes, ecosystems ser-vices and nature-based solutions in cities/Multifunctional green infrastructure and climate change adaptation: Brownfield greening as an adaptation strategy for vulnerable communities?/Delivering green infrastructure through planning: In-sights from practice in Fingal, Ireland/Planning for biophilic cities: From theory to practice. Plan. Theory Pract. 2016, 17, 276–280. [Google Scholar]
  6. Ogut, O.; Tzortzi, N.J.; Bertolin, C. Vertical Green Structures to Establish Sustainable Built Environment: A Systematic Market Review. Sustainability 2022, 14, 12349. [Google Scholar] [CrossRef]
  7. Helman, D.; Yungstein, Y.; Mulero, G.; Michael, Y. High-Throughput Remote Sensing of Vertical Green Living Walls (VGWs) in Workplaces. Remote Sens. 2022, 14, 3485. [Google Scholar] [CrossRef]
  8. Baghaei Daemei, A.; Jamali, A. Experimental and simulation study on thermal effects and energy efficiency of a green wall in the humid condition of Rasht. J. Energy Manag. Technol. 2022, 6, 15–21. [Google Scholar] [CrossRef]
  9. Sheweka, S.; Magdy, A.N. The Living walls as an Approach for a Healthy Urban Environment. Energy Procedia 2011, 6, 592–599. [Google Scholar] [CrossRef]
  10. Perera, T.A.N.T.; Jayasinghe, G.Y.; Halwatura, R.U.; Rupasinghe, H.T. Modeling Building Envelop with Vertical Green Living Walls as an Urban Heat Island (UHI) Mitigation Strategy. In Proceedings of the ICSECM 2021, Kandy, Sri Lanka, 18–19 December 2021; Volume 266, pp. 657–664. [Google Scholar] [CrossRef]
  11. Pandey, A.K.; Pandey, M.; Tripathi, B. Assessment of Air Pollution Tolerance Index of some plants to develop vertical gardens near street canyons of a polluted tropical city. Ecotoxicol. Environ. Saf. 2016, 134, 358–364. [Google Scholar] [CrossRef]
  12. Rullander, G.; Grünewald, N. Charcoal Vertical Gardens as Treatment of Drainwater for Irrigation Reuse; UPTEC W 20014; Department of Earth Sciences, Geotryckeriet, Uppsala University: Uppsala, Sweden, 2019. [Google Scholar]
  13. Yau Seng Mah, D.; Author, C.; Lau, J.T.; Mah, D.Y.S. Green wall for retention of stormwater Water Resources Integrated Management View project Spatial Distribution of Rainstorms View project SCIENCE & TECHNOLOGY Green Wall for Retention of Stormwater. Artic. Pertanika J. Sci. Technol. 2018, 26, 283–298. [Google Scholar]
  14. Yan, F.; Shen, J.; Zhang, W.; Ye, L.; Lin, X. A review of the application of green walls in the acoustic field. Build. Acoust. 2022, 29, 295–313. [Google Scholar] [CrossRef]
  15. Coronado, S. Grow a Living Wall: Create Vertical Gardens with Purpose: Pollinators-Herbs and Veggies-Aromatherapy-Many More; Cool Springs Press: Brentwood, TN, USA, 2015. [Google Scholar]
  16. Filazzola, A.; Shrestha, N.; MacIvor, J.S. The contribution of constructed green infrastructure to urban biodiversity: A synthesis and meta-analysis. J. Appl. Ecol. 2019, 56, 2131–2143. [Google Scholar] [CrossRef]
  17. Mårtensson, L.-M.; Fransson, A.-M.; Emilsson, T. Exploring the use of edible and evergreen perennials in living wall systems in the Scandinavian climate. Urban For. Urban Green. 2016, 15, 84–88. [Google Scholar] [CrossRef]
  18. Khudairi, S. Designboom 2014. Available online: https://www.designboom.com/architecture/jose-levy-vivifies-mapharmacie-drugstore-in-paris-04-03-2014/ (accessed on 13 January 2023).
  19. Magliocco, A. Vertical Greening Systems: Social and Aesthetic Aspects. In Nature Based Strategies for Urban and Building Sustainability; Butterworth-Heinemann: Oxford, UK, 2018; pp. 263–271. [Google Scholar] [CrossRef]
  20. Ling, T.-Y.; Hung, W.-K.; Lin, C.-T.; Lu, M. Dealing with Green Gentrification and Vertical Green-Related Urban Well-Being: A Contextual-Based Design Framework. Sustainability 2020, 12, 10020. [Google Scholar] [CrossRef]
  21. Zluwa, I.; Pitha, U. The Combination of Building Greenery and Photovoltaic Energy Production—A Discussion of Challenges and Opportunities in Design. Sustainability 2021, 13, 1537. [Google Scholar] [CrossRef]
  22. THE 17 GOALS|Sustainable Development n.d. Available online: https://sdgs.un.org/goals (accessed on 10 August 2023).
  23. Meng, T.; Hsu, D. Stated preferences for smart green infrastructure in stormwater management. Landsc. Urban Plan. 2019, 187, 1–10. [Google Scholar] [CrossRef]
  24. Kaluarachchi, Y. Potential advantages in combining smart and green infrastructure over silo approaches for future cities. Front. Eng. Manag. 2020, 8, 98–108. [Google Scholar] [CrossRef]
  25. Ojha, T.; Misra, S.; Raghuwanshi, N.S. Wireless sensor networks for agriculture: The state-of-the-art in practice and future challenges. Comput. Electron. Agric. 2015, 118, 66–84. [Google Scholar] [CrossRef]
  26. Goap, A.; Sharma, D.; Shukla, A.K.; Krishna, C.R. An IoT based smart irrigation management system using Machine learning and open source technologies. Comput. Electron. Agric. 2018, 155, 41–49. [Google Scholar] [CrossRef]
  27. Wei, C.; Wang, P.; Ma, Y.; Li, R. Innovative Design of a Healthy and Environmentally Friendly Intelligent Cleaning Robot in a Smart City Public Environment. J. Environ. Public Health 2022, 2022, 1602125. [Google Scholar] [CrossRef]
  28. Wilkinson, S.; Carmichael, M.; Khonasty, R. Towards smart green wall maintenance and Wallbot technology. Prop. Manag. 2021, 39, 466–478. [Google Scholar] [CrossRef]
  29. Schmidt, D.; Berns, K. Climbing robots for maintenance and inspections of vertical structures—A survey of design aspects and technologies. Robot. Auton. Syst. 2013, 61, 1288–1305. [Google Scholar] [CrossRef]
  30. Badarnah, L.; Kadri, U. A methodology for the generation of biomimetic design concepts. Arch. Sci. Rev. 2014, 58, 120–133. [Google Scholar] [CrossRef]
  31. Anghel, A.A.; Giurea, D.; Mohora, I.; Hapenciuc, A.-D.; Milincu, O.C.; Frigura-Iliasa, F.M. Green Interactive Installations as Conceptual Experiments towards a New Meaning of Smart Design. Buildings 2022, 12, 62. [Google Scholar] [CrossRef]
  32. Anghel, A.A.; Mohora, I.; Frigura-Iliasa, F.M.; Giurea, D.; Preda, A.-D.; Milincu, C. Smart Responsive Green Walls for Public Transportation Areas in Timisoara. In Proceedings of the 2019 IEEE International Conference on Environment and Electrical Engineering and 2019 IEEE Industrial and Commercial Power Systems Europe (EEEIC/I&CPS Europe), Genova, Italy, 11–14 June 2019; pp. 1–4. [Google Scholar]
  33. Page, M.J.; McKenzie, J.E.; Bossuyt, P.M.; Boutron, I.; Hoffmann, T.C.; Mulrow, C.D.; Shamseer, L.; Tetzlaff, J.M.; Akl, E.A.; Brennan, S.E.; et al. The PRISMA 2020 statement: An updated guideline for reporting systematic reviews. BMJ 2021, 372, 71. [Google Scholar] [CrossRef] [PubMed]
  34. Elshater, A.; Abusaada, H. Developing Process for Selecting Research Techniques in Urban Planning and Urban Design with a PRISMA-Compliant Review. Soc. Sci. 2022, 11, 471. [Google Scholar] [CrossRef]
  35. Lim, Y.; Edelenbos, J.; Gianoli, A. Identifying the results of smart city development: Findings from systematic literature review. Cities 2019, 95, 102397. [Google Scholar] [CrossRef]
  36. Pan, Z.; Kosicki, G.M. Framing analysis: An approach to news discourse. Politi. Commun. 1993, 10, 55–75. [Google Scholar] [CrossRef]
  37. Dereli, T.; Durmusoglu, A. An integrated framework for new product development using who-when-where-why-what-how (5W1H), theory of inventive problem solving and patent information—A case study. Int. J. Ind. Syst. Eng. 2010, 5, 354. [Google Scholar] [CrossRef]
  38. Lee, J.; Kim, J.; Ahn, J.; Woo, W. Context-aware risk management for architectural heritage using historic building information modeling and virtual reality. J. Cult. Heritage 2019, 38, 242–252. [Google Scholar] [CrossRef]
  39. Mankins, J.C. Technology readiness assessments: A retrospective. Acta Astronaut. 2009, 65, 1216–1223. [Google Scholar] [CrossRef]
  40. Forman, J.; Damschroder, L. Qualitative Content Analysis. Adv. Bioeth. 2007, 11, 39–62. [Google Scholar]
  41. Scenario Method—European Foresight Platform n.d. Available online: http://foresight-platform.eu/community/forlearn/how-to-do-foresight/methods/scenario/ (accessed on 21 April 2023).
  42. Shilei, L.; Yong, W. Target-oriented obstacle analysis by PESTEL modeling of energy efficiency retrofit for existing residential buildings in China’s northern heating region. Energy Policy 2009, 37, 2098–2101. [Google Scholar] [CrossRef]
  43. Yüksel, I. Developing a Multi-Criteria Decision Making Model for PESTEL Analysis. Int. J. Bus. Manag. 2012, 7, 52. [Google Scholar] [CrossRef]
  44. Sędzicki, D.; Cudzik, J.; Nyka, L. Computer-Aided Greenery Design—Prototype Green Structure Improving Human Health in Urban Ecosystem. Int. J. Environ. Res. Public Health 2023, 20, 1198. [Google Scholar] [CrossRef]
  45. Žák, J.; Kraus, M.; Machová, P.; Plachý, J. Smart Green Bridge—Wildlife Crossing Bridges of New Generation. IOP Conf. Series Mater. Sci. Eng. 2020, 728, 012010. [Google Scholar] [CrossRef]
  46. Blanc, P. The Vertical Garden: From Nature to the City; WW Norton & Company: New York, NY, USA, 2008. [Google Scholar]
  47. Green Wall Interior Designer Indoor Green Solution | Verde Profilo n.d. Available online: https://verdeprofilo.com/en/ (accessed on 17 April 2023).
  48. Fadli, F.; Zaina, S.; Bahrami, P.; Usa, O.D.L. Smart biofaçades; An innovative living construction technology. In Proceedings of the Fifth International Conference on Sustainable Construction Materials and Technologies, London, UK, 14–17 July 2019. [Google Scholar]
  49. VICINITY | Modular Vertical Garden n.d. Available online: http://www.modularverticalgarden.com/ (accessed on 17 April 2023).
  50. Experience the Power of Nature. Indoors. n.d. Available online: https://www.naava.io/en/ (accessed on 17 April 2023).
  51. Torpy, F.; Clements, N.; Pollinger, M.; Dengel, A.; Mulvihill, I.; He, C.; Irga, P. Testing the single-pass VOC removal efficiency of an active green wall using methyl ethyl ketone (MEK). Air Qual. Atmosphere Health 2018, 11, 163–170. [Google Scholar] [CrossRef] [PubMed]
  52. Living Smart Bench n.d. Available online: https://cascadegarden.nemec.eu/en/our-products/living-smart-bench (accessed on 17 April 2023).
  53. AGM Services n.d. Available online: https://www.agrinamics.com/ (accessed on 17 April 2023).
  54. Gotham Greens n.d. Available online: https://www.gothamgreens.com/ (accessed on 17 April 2023).
  55. New Stories from “Urban Agriculture Notes”—City Farmer News n.d. Available online: https://cityfarmer.info/ (accessed on 17 April 2023).
  56. Liu, Y.; Hassan, K.A.; Karlsson, M.; Weister, O.; Gong, S. Active Plant Wall for Green Indoor Climate Based on Cloud and Internet of Things. IEEE Access 2018, 6, 33631–33644. [Google Scholar] [CrossRef]
  57. Lan, D.; Liu, Y.; Taherkordi, A.; Eliassen, F.; Delbruel, S.; Lei, L. A federated fog-cloud framework for data processing and orchestration: A case study in smart cities. In Proceedings of the 36th Annual ACM Symposium on Applied Computing, Virtual Event, Republic of Korea, 22–26 March 2021. [Google Scholar]
  58. World Map—Simple|MapChart n.d. Available online: https://www.mapchart.net/world.html (accessed on 26 March 2023).
  59. Bugarin, M.; Nizetic, S.; Domazet, Ž.; Nižetić, S. INTELLIGENT GLAZED FACADES NEARLY NET ZERO-ENERGY BUILDINGS. In Energy and Environment; 2014; pp. 445–455. Available online: https://www.researchgate.net/profile/Sandro-Nizetic-2/publication/305477500_Intelligent_Glazed_Facades_Nearly_Zero-Energy_Buildings/links/5790b05008ae64311c119a1d/Intelligent-Glazed-Facades-Nearly-Zero-Energy-Buildings.pdf (accessed on 15 May 2024).
  60. Nera, K. What If We Grew Plants Vertically? EPRS|European Parliamentary Research Service: Brussels, Belgium, 2022. [Google Scholar]
  61. Rivas-Sánchez, Y.A.; Moreno-Pérez, M.F.; Roldán-Cañas, J. Environment Control with Low-Cost Microcontrollers and Microprocessors: Application for Green Walls. Sustainability 2019, 11, 782. [Google Scholar] [CrossRef]
  62. Halgamuge, M.N.; Bojovschi, A.; Fisher, P.M.J.; Le, T.C.; Adeloju, S.; Murphy, S. Internet of Things and autonomous control for vertical cultivation walls towards smart food growing: A review. Urban For. Urban Green. 2021, 61, 127094. [Google Scholar] [CrossRef]
  63. Fraunhofer Institute for Manufacturing Engineering and Automation IPA. Green Wall Robot—Automated, Smart Green Facades—Fraunhofer IPA 2021. Available online: https://www.ipa.fraunhofer.de/en/reference_projects/Green_wall_robot.html (accessed on 19 August 2022).
  64. Holdsworth, B. Ecological high-rise: Solar architects of the 21st century: Dr. Ken Yeang. Refocus 2005, 6, 58–60. [Google Scholar] [CrossRef]
  65. Hung, P.; Peng, K. Green Energy Water-Autonomous Greenhouse System: An Alternative Technology Approach Toward Sustainable Smart–Green Vertical Greening in a Smart City. In Green City Planning and Practices in Asian Cities: Sustainable Development and Smart Growth in Urban Environments; Springer International Publishing: Zurich, Switzerland, 2018; pp. 315–335. [Google Scholar] [CrossRef]
  66. Manso, M.; Castro-Gomes, J. Green wall systems: A review of their characteristics. Renew. Sustain. Energy Rev. 2015, 41, 863–871. [Google Scholar] [CrossRef]
  67. White, S.H. Vegetation-Bearing Architectonic Structure and System. U.S. Patent 2,113,523, 5 April 1938. [Google Scholar]
  68. De Lotto, R.; Casella, V.; Franzini, M.; Gazzola, V.; di Popolo, C.M.; Sturla, S.; Venco, E.M. Estimating the biotope area factor (BAF) by means of existing digital maps and GIS technology. In Proceedings of the ICCSA 2015, Banff, AB, Canada, 22–25 June 2015; Volume 9157, pp. 617–632. [Google Scholar] [CrossRef]
  69. MITE. Gazzetta Ufficiale. Ministry of Ecological Transition (Ministero della Transizione Ecologica). 2013. Available online: https://www.gazzettaufficiale.it/eli/id/2013/02/01/13G00031/sg (accessed on 22 August 2022).
  70. IMF—International Monetary Fund. World Economic Outlook (April 2024)—GDP per Capita, Current Prices n.d. Available online: https://www.imf.org/external/datamapper/NGDPDPC@WEO/OEMDC/ADVEC/WEOWORLD (accessed on 8 May 2024).
  71. University of Cambridge. Plant to Power Solar Hub|Department of Plant Sciences 2014. Available online: https://www.plantsci.cam.ac.uk/p2p (accessed on 17 April 2023).
  72. The World Bank. GNI per Capita, Atlas Method (Current US$)|Data n.d. Available online: https://data.worldbank.org/indicator/NY.GNP.PCAP.CD?most_recent_value_desc=false (accessed on 19 April 2023).
  73. Oluwafeyikemi, A.; Julie, G. Evaluating the Impact of Vertical Greening Systems on Thermal Comfort in Low Income residences in Lagos, Nigeria. Procedia Eng. 2015, 118, 420–433. [Google Scholar] [CrossRef]
  74. Başdoğan, G.; Çığ, A. Ecological-Social-Economical Impacts of Vertical Gardens in the Sustainable City Model. Yuz. Yıl Univ. J. Agric. Sci. 2016, 26, 430–438. [Google Scholar]
  75. Adegun, O.B.; Olusoga, O.O.; Mbuya, E.C. Prospects and problems of vertical greening within low-income urban settings in sub-Sahara Africa. J. Urban Ecol. 2022, 8, juac016. [Google Scholar] [CrossRef]
  76. Benke, K.; Tomkins, B. Future food-production systems: Vertical farming and controlled-environment agriculture. Sustain. Sci. Pract. Policy 2017, 13, 13–26. [Google Scholar] [CrossRef]
  77. Shieber, J. Billionaires Make It Rain on Plenty, the Indoor Farming Startup|TechCrunch. 2017. Available online: https://techcrunch.com/2017/07/19/billionaires-make-it-rain-on-plenty-the-indoor-farming-startup/?guccounter=1&guce_referrer=aHR0cHM6Ly93d3cuZ29vZ2xlLmNvbS8&guce_referrer_sig=AQAAABrJboQbEZR5nglG0CEHJY4FXhYBJDeVI1j8pXM_YP959Tk8rIb-xIFuzJPBUbUfe203nwkax6VgGSC3C5-hiKUy9Bb_j-nW-e6gyv7yYlKNvfMr3p_JXNzEknGY2bE4Voto2rBsOCzAL8QBKfM4zGiPYIWB00WwXkg61Q7lReY- (accessed on 18 April 2023).
  78. Goldstein, H. The Green Promise of Vertical Farms—IEEE Spectrum 2018. Available online: https://spectrum.ieee.org/the-green-promise-of-vertical-farms (accessed on 18 April 2023).
  79. Al-Chalabi, M. Vertical farming: Skyscraper sustainability? Sustain. Cities Soc. 2015, 18, 74–77. [Google Scholar] [CrossRef]
  80. Mir, M.S.; Naikoo, N.B.; Kanth, R.H.; Bahar, F.A.; Bhat, M.A.; Nazir, A.; Mahdi, S.S.; Amin, Z.; Singh, L.; Raja, W.; et al. Vertical farming: The future of agriculture: A review. Pharma Innov. J. 2022, 11, 1175–1195. [Google Scholar]
  81. Schmidt, S.M.; Belisle, M.; Frommer, W.B. The evolving landscape around genome editing in agriculture: Many countries have exempted or move to exempt forms of genome editing from GMO regulation of crop plants. EMBO Rep. 2020, 21, e50680. [Google Scholar] [CrossRef]
  82. Huebbers, J.; Buyel, J. On the verge of the market—Plant factories for the automated and standardized production of biopharmaceuticals. Biotechnol. Adv. 2021, 46, 107681. [Google Scholar] [CrossRef]
  83. SharathKumar, M.; Heuvelink, E.; Marcelis, L.F.M. Vertical Farming: Moving from Genetic to Environmental Modification. Trends Plant Sci. 2020, 25, 724–727. [Google Scholar] [CrossRef]
  84. van Delden, S.H.; SharathKumar, M.; Butturini, M.; Graamans, L.J.A.; Heuvelink, E.; Kacira, M.; Kaiser, E.; Klamer, R.S.; Klerkx, L.; Kootstra, G.; et al. Current status and future challenges in implementing and upscaling vertical farming systems. Nat. Food 2021, 2, 944–956. [Google Scholar] [CrossRef] [PubMed]
  85. Elsaid, A.M.; Ahmed, M.S. Indoor Air Quality Strategies for Air-Conditioning and Ventilation Systems with the Spread of the Global Coronavirus (COVID-19) Epidemic: Improvements and Recommendations. Environ. Res. 2021, 199, 111314. [Google Scholar] [CrossRef] [PubMed]
  86. Cerrone, D.; Grönroos, M.; Hui, N.; Luukkonen, A.; Mäkelä, I.; Nurminen, N.; Oikarinen, S.; Parajuli, A.; Puhakka, R.; Roslund, M.I.; et al. Indoor green wall affects health-associated commensal skin microbiota and enhances immune regulation: A randomized trial among urban office workers. Sci. Rep. 2022, 12, 6518. [Google Scholar] [CrossRef] [PubMed]
  87. Mikkonen, A.; Li, T.; Vesala, M.; Saarenheimo, J.; Ahonen, V.; Kärenlampi, S.; Blande, J.D.; Tiirola, M.; Tervahauta, A. Biofiltration of airborne VOCs with green wall systems-Microbial and chemical dynamics. Indoor Air 2018, 28, 697–707. [Google Scholar] [CrossRef] [PubMed]
  88. Ala-Kortesmaa, S.; Laapotti, T.; Mikkola, L. Narrative Start-up Identity Construction as Strategic Communication. Int. J. Strat. Commun. 2022, 16, 222–238. [Google Scholar] [CrossRef]
  89. Sivamani, S.; Bae, N.; Cho, Y. A Smart Service Model Based on Ubiquitous Sensor Networks Using Vertical Farm Ontology. Int. J. Distrib. Sens. Networks 2013, 9, 161495. [Google Scholar] [CrossRef]
  90. Carmichael, M.; Khonasty, R.; Wilkinson, S.; Schork, T. The Wallbot: A Low-cost Robot for Green Wall Inspection. In Proceedings of the Australasian Conference on Robotics and Automation (ACRA) 2020, Brisbane, Australia, 8–10 December 2020. [Google Scholar]
  91. Vranayova, Z.; Kaposztasova, D.; Poorova, Z. Water management of “smart” buildings and cities. Czas. Inżynierii Lądowej Sr. I Archit./J. Civ. Eng. Environ. Archit. 2018, 65, 45–52. [Google Scholar]
  92. CITYTREE—Green City Solutions n.d. Available online: https://greencitysolutions.de/en/citytree/ (accessed on 17 April 2023).
  93. Splittgerber, V. The CityTree: A vertical plant wall. Air Pollut. XXIII 2015, 295, 295. [Google Scholar] [CrossRef]
Figure 1. Methodological procedure followed in this study. Solid frames show the sequential phases, while dashed frames indicate the simultaneous steps taken during the phases.
Sustainability 16 04543 g001
Figure 2. Review of PRISMA chart (literature review on left side and market review on right side).
Sustainability 16 04543 g002
Figure 3. Case studies ordered based on the TRL. This increasing order is used to give ID numbers to the case studies. The legend reports the types of applications of smart technologies in VGSs.
Sustainability 16 04543 g003
Figure 4. The case studies’ locations with countries highlighted in yellow, ID numbers based on the ordering using the TRL, and the types of smart technologies implemented represented with full/empty symbols. (The base map is derived from World Map—Simple [58].)
Sustainability 16 04543 g004
Figure 5. The operational flow of motivation detected in the use of smart technologies in VGSs (boxes) and the tools used in each sub-motivation/category (color codes in the legend). The bar charts present the percentage of the tools’ usage in the specific sub-motivation/category.
Sustainability 16 04543 g005
Figure 6. A heatmap based on the motivation for the use of smart technologies in VGSs (x-axis) and the TRL order of the selected case studies (the ID numbers are on the y-axis).
Sustainability 16 04543 g006
Figure 7. A heatmap based on the motivation for the use of smart technologies in VGSs (x-axis) and the year increase in order (y-axis).
Sustainability 16 04543 g007
Figure 8. Two distinct roadmaps within a single timeline, i.e., case studies based on their implementation/publication year to represent technological milestones with symbols and other milestones such as legal implementations, pioneer iconic examples, and academic events associated with VGSs. Numbers represent the case studies.
Sustainability 16 04543 g008
Figure 9. The three forecasted scenarios for the future of VGSs with pros and cons. The key benefits are highlighted in the PROS column, indicated by italicized text. In scenario 1, where a VGS is scaled up to building skin*, certain items are marked with an asterisk to denote their inclusion. Each scenario is represented with different frame colors. The representative schemes are derived from www.plantsci.cam.ac.uk, https://www.freepik.com, and https://www.naava.io for each scenario respectively (last accessed on 10 August 2024).
Sustainability 16 04543 g009
Disclaimer/Publisher’s Note: The statements, opinions and data contained in all publications are solely those of the individual author(s) and contributor(s) and not of MDPI and/or the editor(s). MDPI and/or the editor(s) disclaim responsibility for any injury to people or property resulting from any ideas, methods, instructions or products referred to in the content.

