1. Introduction
The world is experiencing a significant shift towards urban living, with more than half of the global population already residing in cities and projections indicating an increase to over 65% by 2050 [
1]. This urbanization trend brings with it a host of challenges, particularly concerning air quality. Presently, more than 80% of urban populations are exposed to air pollution levels that exceed the guidelines set by the World Health Organization [
2]. This dire situation has severe health implications, contributing to an annual toll of seven million premature deaths [
3] and the exacerbation of various diseases. In Europe, where over 70% of the population resides in urban areas, addressing air pollution is a top priority [
4]. Recent reports have revealed that, despite temporary improvements during COVID-19 pandemic lockdowns, urban air quality remains an ongoing concern [
5].
To comprehensively understand urban air quality, it is essential to evaluate the concentration of various air pollutants present in the atmosphere. These pollutants can be broadly categorized as primary and secondary. Primary pollutants, such as carbon monoxide (CO), sulfur dioxide (SO
2), ammonia (NH
3), and particulate matter (PM), originate from a range of sources, including transportation, industrial activities, agriculture, fires, and natural events like volcanic eruptions. On the other hand, secondary pollutants, including sulfuric acid (H
2SO
4), nitric acid (HNO
3), ozone (O
3), and certain particulate matter components, result from the chemical transformation of primary pollutants through processes like oxidation and exposure to solar radiation [
4]. The dispersion of pollutants within cities is influenced by various factors, primarily wind patterns, which lead to varying pollutant concentrations across urban areas. Additionally, air pollutants undergo deposition processes, either dry or wet, further influencing their distribution within urban environments [
6]. Despite considerable reductions in exposure to higher levels of air pollution in European countries, more than 20% of the population remains exposed to high concentrations of ozone and PM
10 [
7,
8].
Efforts to address air pollution in urban areas have gained momentum in recent years, focusing on strategies for mitigation. Various sustainable urban models have emerged with the aim of creating livable and healthier cities. Nieuwenhuijsen [
9] presents four notable models, including the “15-min city” in Paris, “super blocks” in Barcelona, low-traffic neighborhoods in London, and the car-free Vauban in Freiburg. These models prioritize reducing vehicular traffic, expanding green spaces to enhance urban ecosystem services, and promoting social areas for community interaction.
Mitigating urban air pollution can be categorized into two primary approaches: direct reductions in emission rates and indirect measures aimed at enhancing pollutant dispersion and deposition. The implementation of green infrastructure (GI) falls within the latter category. While GI has been extensively studied for its potential in mitigating urban heat and sequestering carbon dioxide, its impact on air quality is multifaceted. Vegetation plays a crucial role in removing gaseous pollutants (e.g., O
3, NO
2, SO
2, NH
3, HNO
3, CO) and fine particulate matter PM
10 (PM < 10 µm) through dry deposition. However, it also emits Biogenic Volatile Organic Compounds (BVOC), which can exacerbate the formation of secondary pollutants, particularly O
3 and CO, and contribute to allergens and asthma triggers. Selecting appropriate vegetation types and infrastructure during the design phase is critical to mitigate these adverse effects. There is an ongoing debate regarding the effectiveness of GI in improving air quality, with some studies showing contradictory results based on implementation methods. Therefore, the careful consideration of GI design and its interaction with microclimatic conditions is essential. Modeling different GI designs before implementation is a prudent approach to optimize outcomes [
10,
11,
12,
13,
14].
Incorporating GI into urban street canyon design, as advocated by the Green Infrastructure for Air Quality (GI4AQ) approach, offers a valuable strategy for mitigating air pollution. However, this intervention should be seen as a third-order option, following emission reduction and spatial planning adjustments [
15]. The comprehensive modeling of potential interventions and thorough evaluation of final designs are critical steps in GI implementation within urban areas [
16]. Various types of GI interventions exhibit promise in improving air quality. Green walls, vertical green screens, trees, hedges, and green roofs each boast unique advantages and challenges. For instance, green walls efficiently trap airborne particles, yet their placement can influence pollutant dispersion [
14]. Vertical green screens find suitability in areas with limited planting space, delivering benefits for both air quality and biodiversity. Trees, while advantageous for urban environments, can hinder ventilation processes, thereby increasing pollutant concentrations within street canyons. Hedges, when strategically placed near emission sources, act as barriers to reduce pedestrian exposure to pollutants. Green roofs, while less studied, have the potential to remove various air pollutants through dry deposition, with effectiveness varying depending on the type of pollutant [
17,
18,
19]. Analyzing urban morphology plays a crucial role in determining the suitability of GI interventions for specific locations. The ability to model these interventions and evaluate results before implementation is essential for achieving optimal outcomes.
Italy, with 71% of its population residing in urban areas, faces significant air quality challenges, particularly in cities like Brindisi, where pollution levels are notably high [
20]. Policy changes aimed at mitigating air pollution have shown promise, particularly when targeting sectors beyond transportation [
21]. Green infrastructure initiatives in Italian cities have demonstrated positive impacts on air quality and economic benefits, including reductions in PM
10 and O
3 levels and substantial savings [
22].
The United Nations Sustainable Development Goal 11 emphasizes the need for sustainable, resilient, and inclusive cities. A key aspect of this sustainable community is the atmospheric conditions in areas where people develop their life, particularly the air quality and the thermal comfort. In this sense, urban climate design is central to achieving this goal, requiring a localized understanding of climate patterns to inform urban planning, mitigation, and adaptation strategies [
6]. The concept of Local Climate Zones (LCZs) offers a valuable framework for classifying urban environments based on surface cover, structure, materials, and human activities. Originally developed for meteorological instrument placement, LCZs have gained prominence in urban morphology analysis and urban planning. Studies have shown that LCZs can help identify areas with varying thermal comfort and energy footprints, guiding climate change adaptation and urban design efforts [
23].
Urban climate design, when combined with GI and air quality considerations, becomes a powerful tool for urban planners. Such an integrated approach can lead to more sustainable and healthier urban environments. In this context, Brindisi serves as an illustrative case study for exploring the intersection of LCZ characteristics, GI implementations, and air quality improvements. The paper aims to contribute to the advancement of performance-based GI planning, focusing on its impact on urban air quality and comfort across different LCZs. The primary objective is to formulate best practice recommendations for GI interventions by assessing their effects on NOX concentration, PM10 levels, and thermal comfort. The study concludes by emphasizing the importance of evaluating the practical applicability of GI interventions, considering their broader impacts beyond heat reduction, and promoting sustainable urban design prioritizing people over cars in alignment with Sustainable Development Goal 11.
2. Methodology
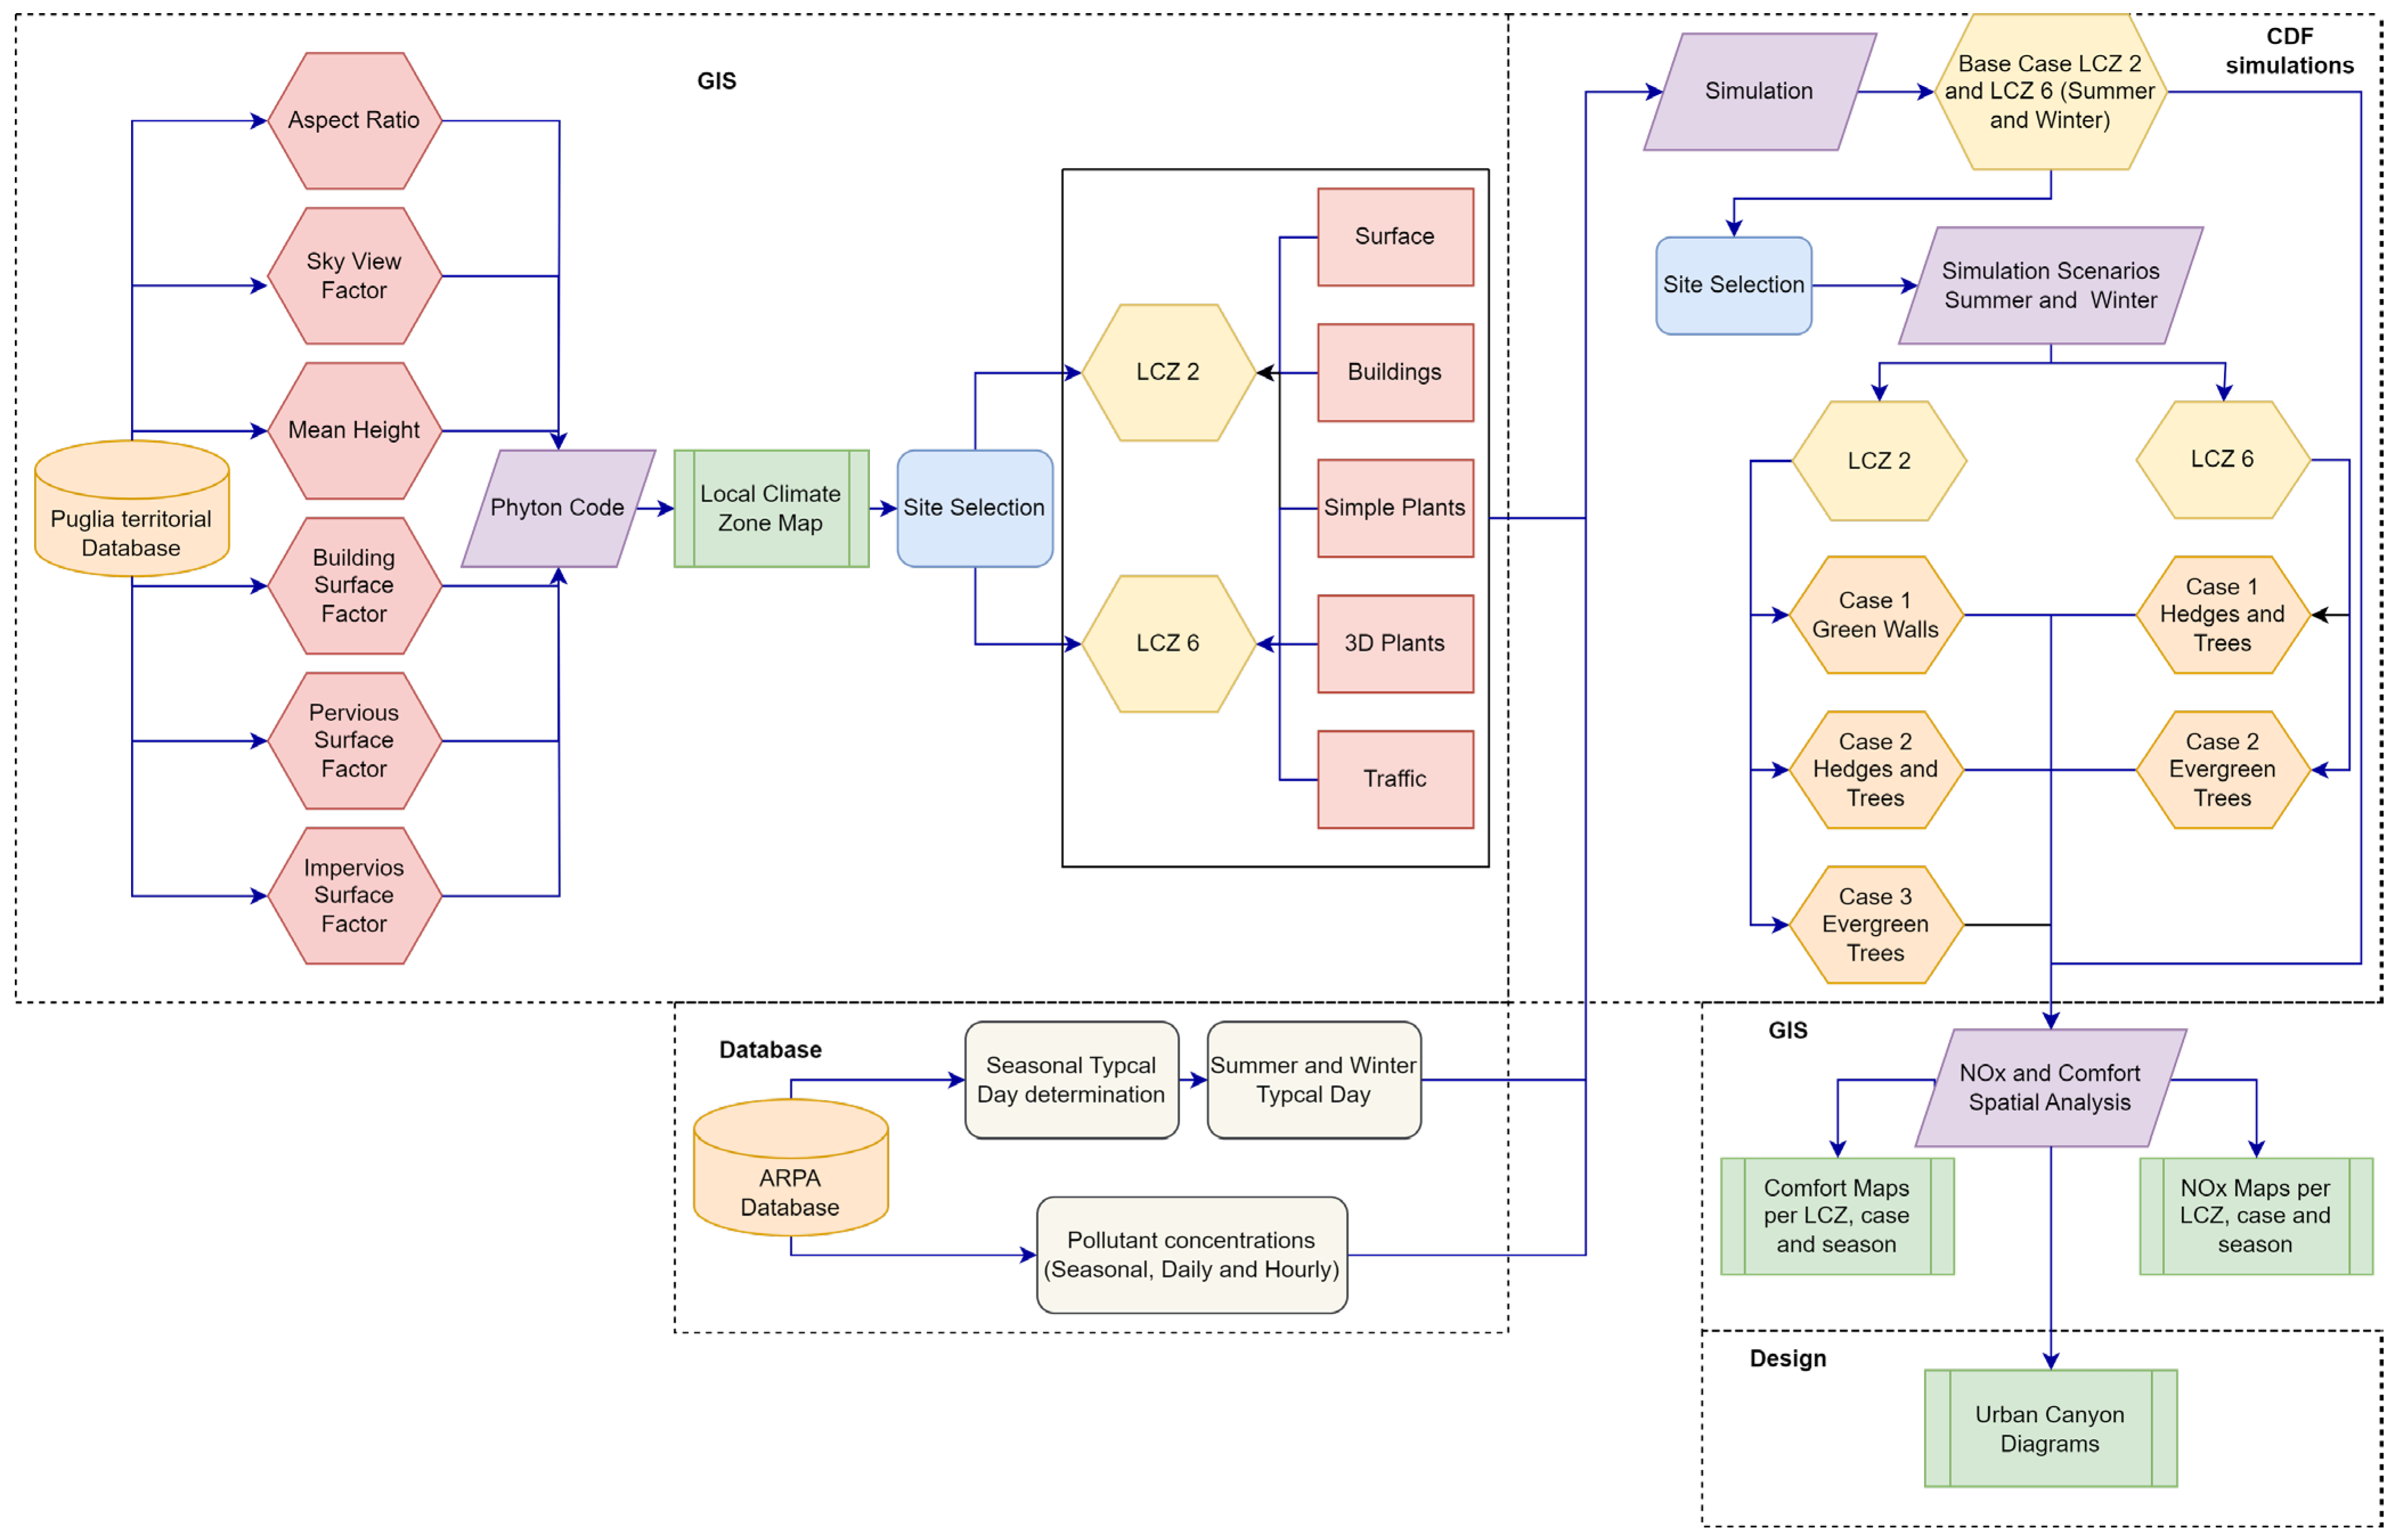
The approach employed is summarized in
Figure 1. There are two primary data sources: the Puglia Territorial Database [
24] to obtain the city landscape information, and the ARPA-Puglia (Agenzia Regionale per la Prevenzione e la Protezione dell’Ambiente) website (
https://www.arpa.puglia.it, accessed on 19 September 2023) to download meteorological and air quality data.
To analyze city characteristics, a GIS approach was utilized to generate a Local Climate Zone (LCZ) map, obtaining a more detailed map than WUDAPT as it is based on LCZ parameters instead of a supervised image classification [
25]. Following this, the two most populated and common LCZs were chosen to investigate how the city’s structure influences air quality. Simulations in ENVI-met 5.1 were conducted for typical summer and winter days. After obtaining these initial results, smaller areas within the LCZ with elevated pollution levels were identified. In these zones, various GI interventions were introduced and simulated in ENVI-met. The impacts were assessed in terms of NOx concentrations and thermal comfort. The results were imported into ArcGIS Pro to perform spatial analyses of NOx concentration and thermal comfort variations between the base case and each GI intervention scenario. Lastly, detailed urban canyon analyses were carried out. The final outcomes yielded a series of implications and recommendations for urban planners and researchers in the field.
Table 1 shows the different objectives and methodological approaches used in each case. The details of the main methodological steps are provided in the following subsections.
2.1. Description of the Case Study and Generation of the LCZ Map
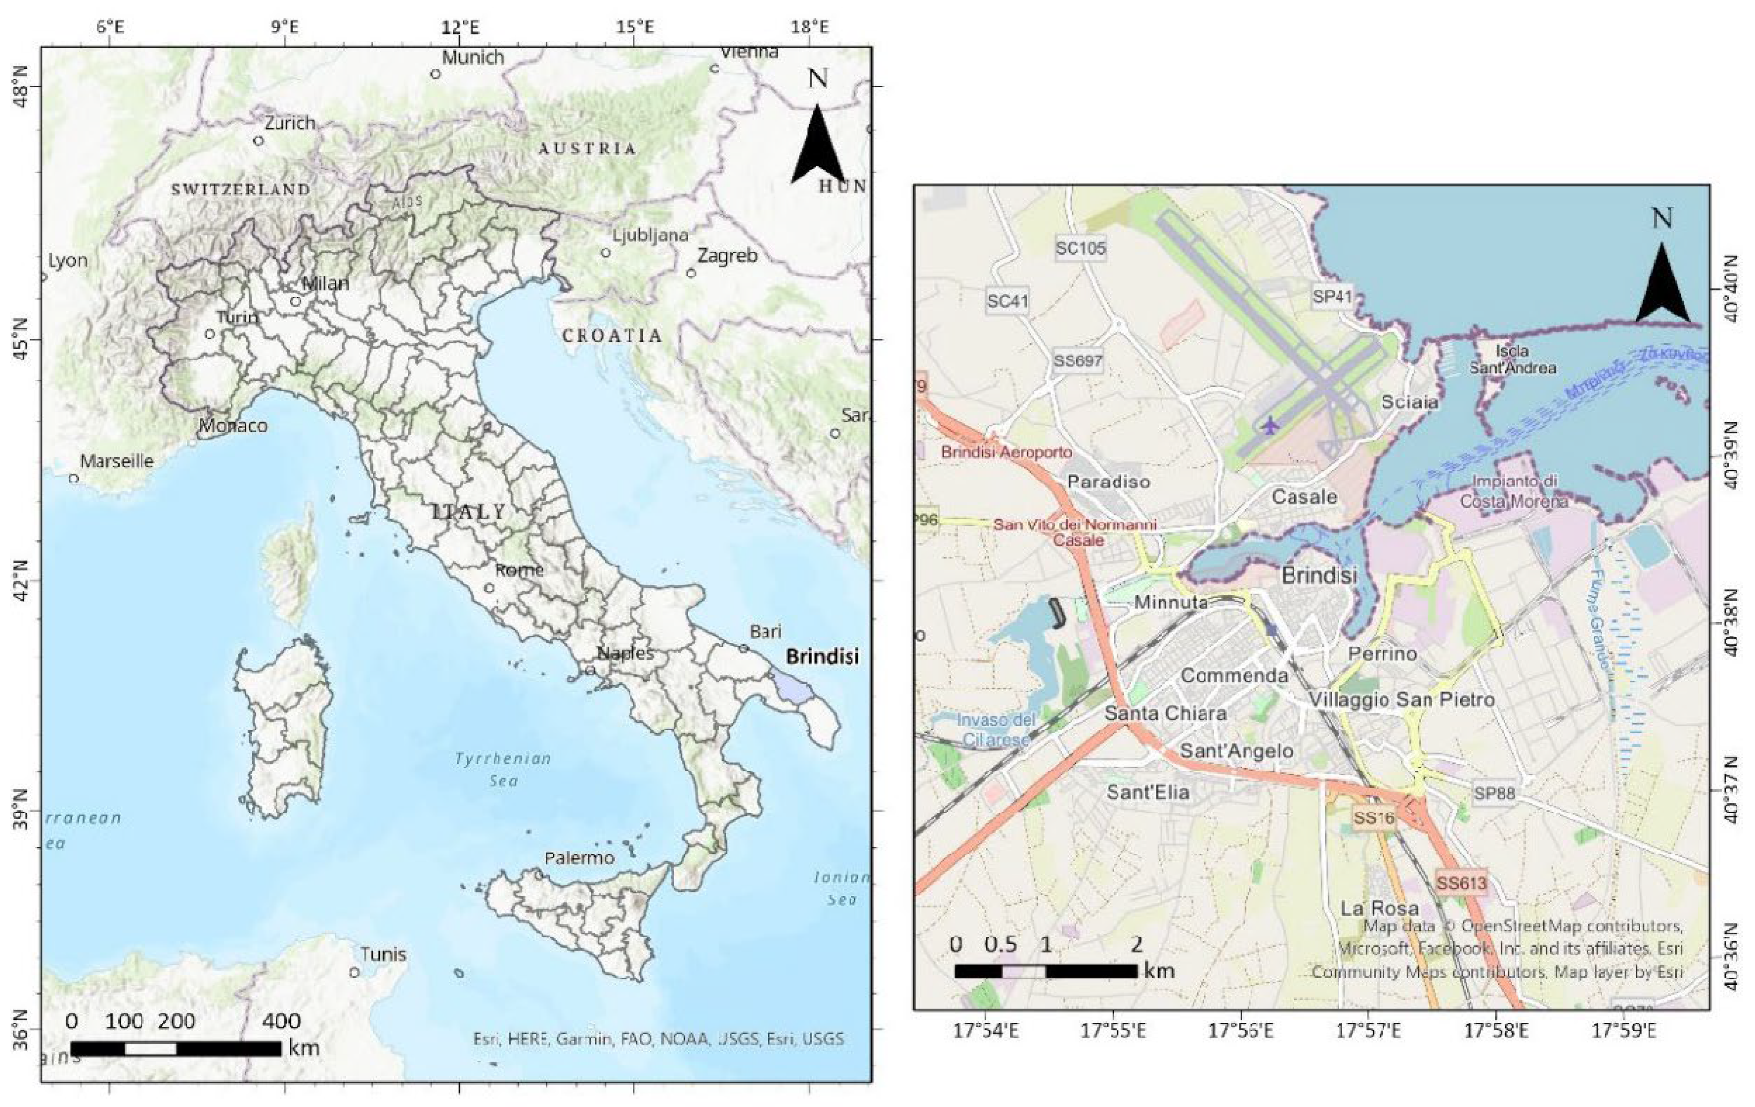
The city chosen to fulfill the aims of this study is Brindisi, a medium-sized urban center situated in the Puglia region of southern Italy (
Figure 2). Located along the Adriatic Sea coastline, Brindisi boasts a Mediterranean climate classified as Csa in the Knöppen system, characterized by warm, arid summers and mild winters. As the capital of the Brindisi province, the city is home to approximately 83,317 residents [
26] and plays a pivotal role as a prominent port and industrial hub. First, the LCZ map of the city was generated.
The LCZ scheme, pioneered by Stewart and Oke [
27], serves as a methodology for characterizing urban areas where meteorological observations can be conducted. Recently, it has gained traction as a tool to delineate urban regions and elucidate their distinctive morphological attributes. This method encompasses ten distinct build-up and natural classes, each defined by specific morphological and coverage parameters. Notably, it provides the flexibility to combine various types. Of utmost importance in this classification is the local scale, mandating that each zone occupies a minimum area of 400 square meters. This classification has become a standard within the urban climate community and has found applications in diverse fields, primarily serving as a means of communication with urban planners [
23,
28]. Consequently, this classification holds exceptional significance, enabling the dissemination of urban climate knowledge and insights to other domains, including urban planning.
The WUDAPT (World Urban Database and Access Portal Tools) represents an initiative aimed at consolidating LCZ and establishing the first global database of cities, providing pertinent information for decision-makers in the realm of urban climatology [
29,
30]. This approach leverages Landsat satellite imagery, insights from local experts, and the capabilities of Google Earth and GIS to generate data products. The project encompasses three classification levels, each offering varying degrees of detail: Level 0, serving as the foundational classification; Level 1, which incorporates urban morphology data; and Level 2, providing precise information on materials and albedo. Building upon this international protocol, an LCZ generator has been developed [
31], enabling the creation of LCZ maps through the utilization of the Google Earth Engine while continuing to tap into the knowledge of local experts. To date, regional and global products have been derived from these methodologies.
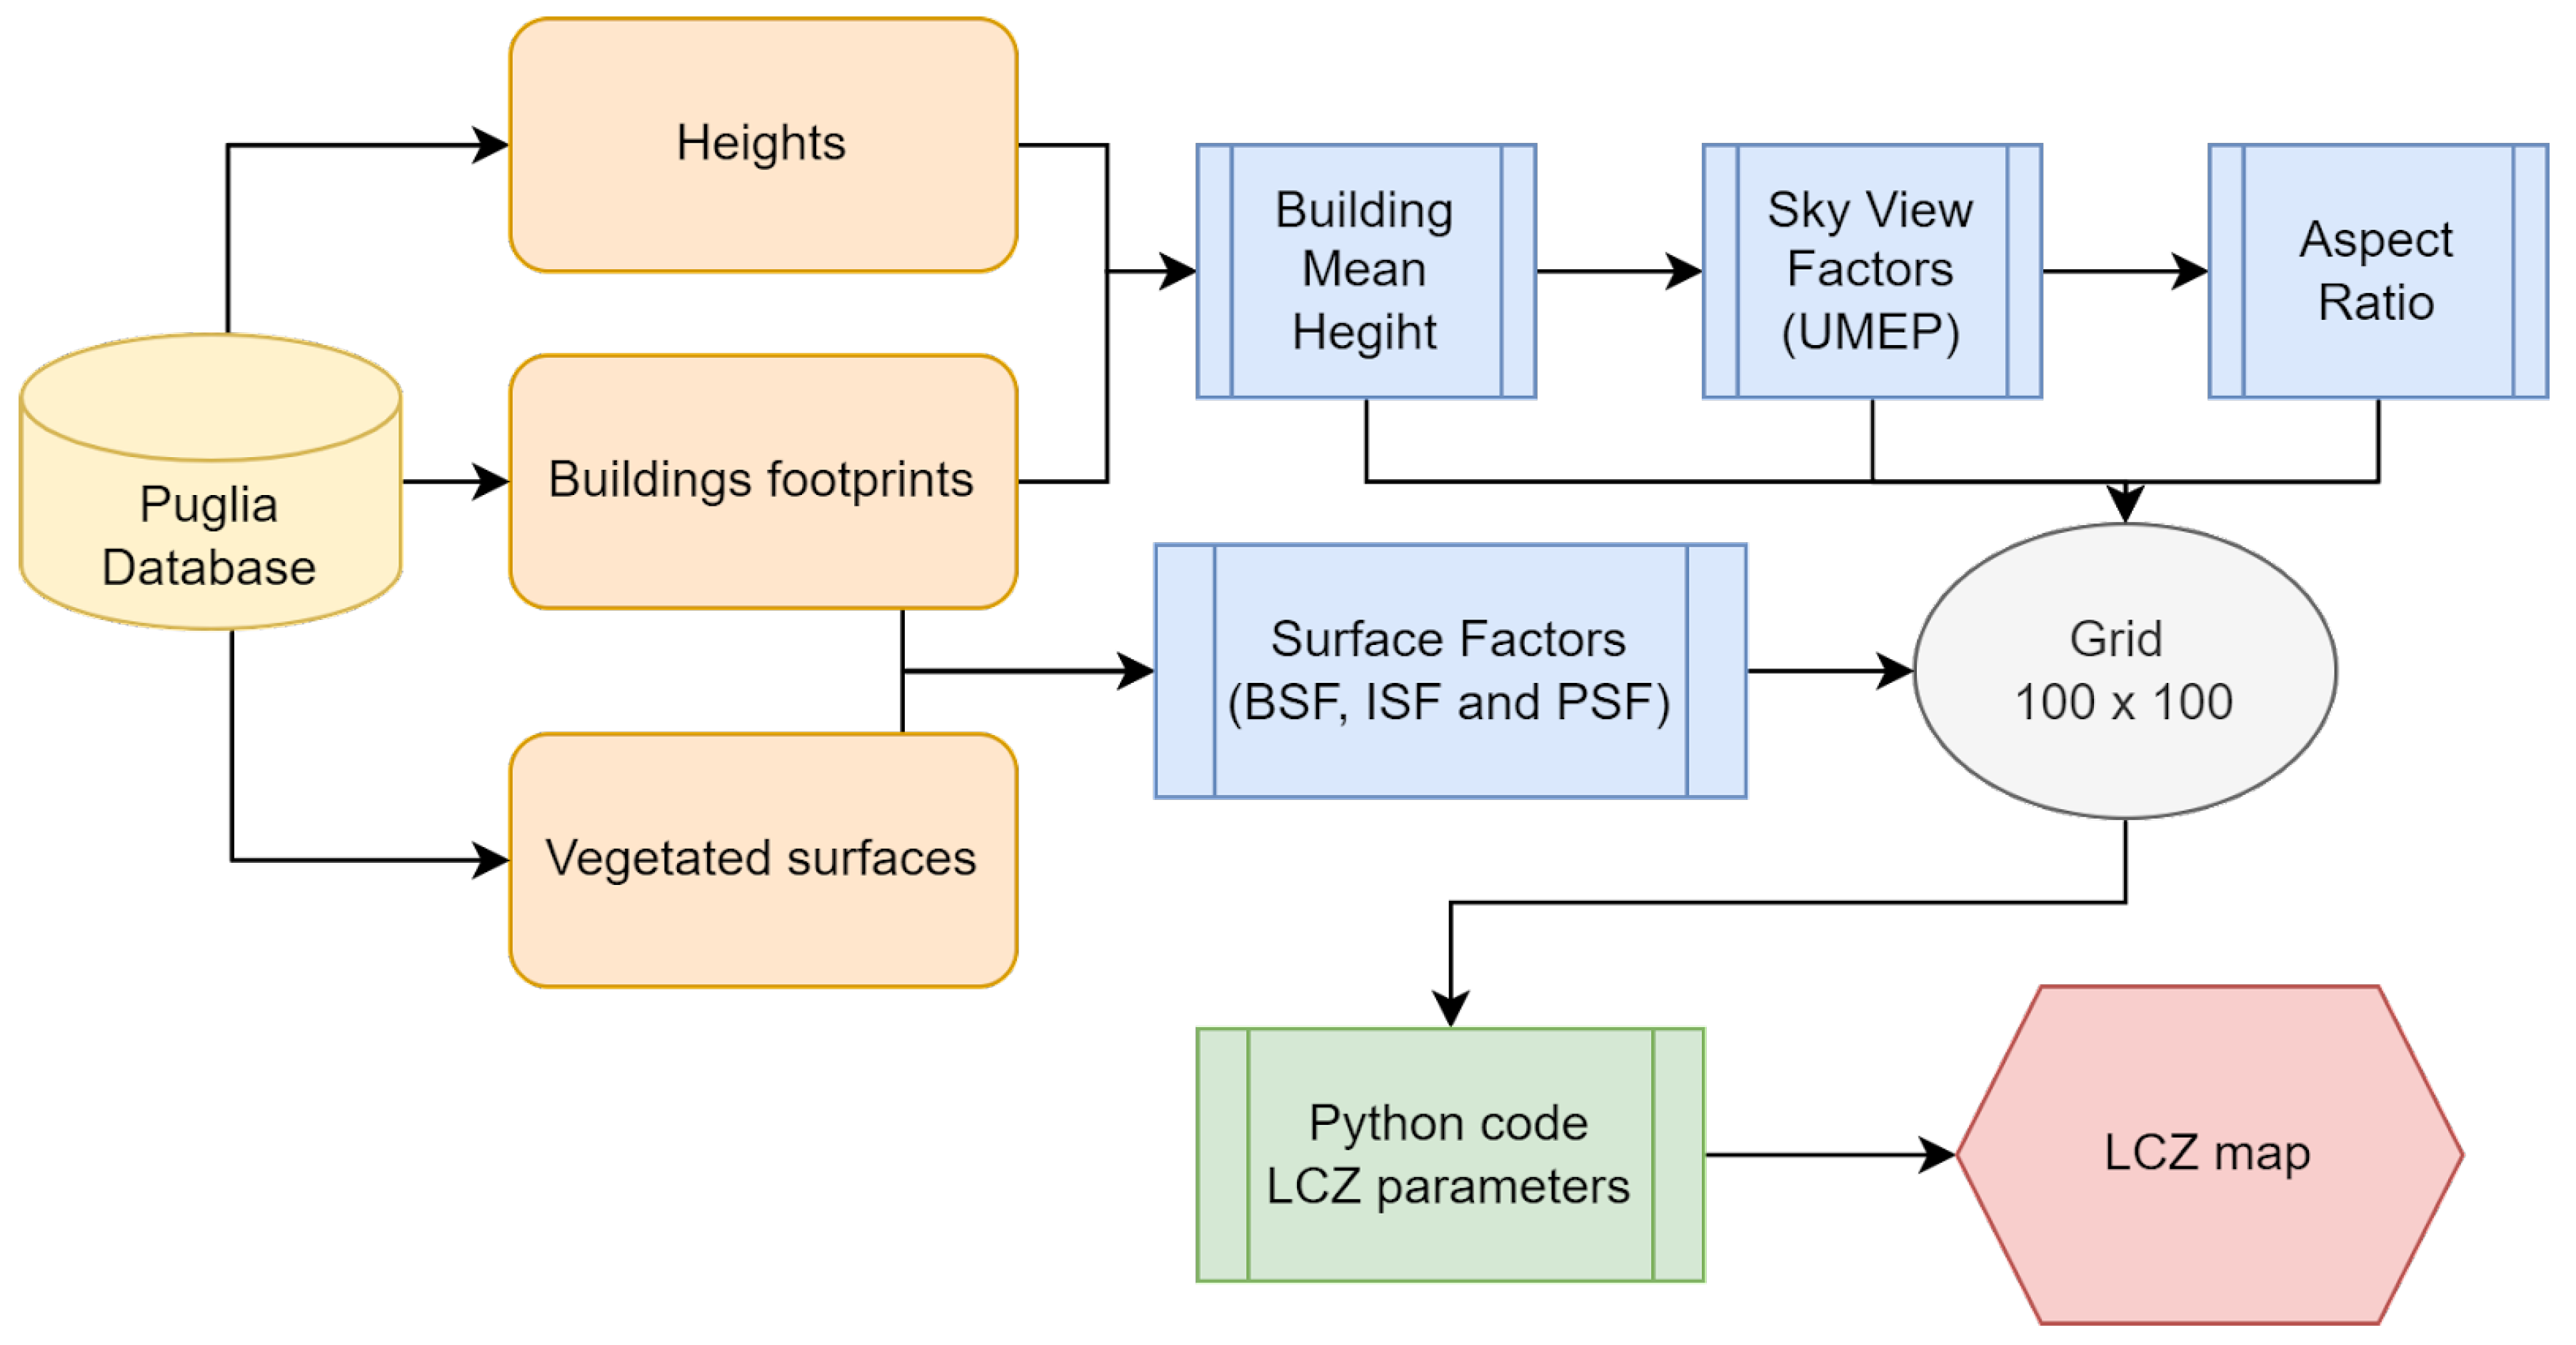
In this work, an alternative approach was employed to generate LCZ maps, utilizing a GIS methodology that allowed the production of more detailed maps. This process encompassed several steps, as outlined in previous studies [
25,
32]. Initially, data were sourced from an official provider in Puglia, the Territorial Data Consortium [
24], focusing on areas characterized by vegetative cover, built-up zones, and elevated points. Subsequently, within the QGIS environment, various urban parameters pertaining to coverage and morphology were calculated.
Coverage data calculations included the determination of the Built-up Surface Factor, which quantified the proportion of land occupied by buildings in relation to the total area; the Permeable Surface Factor, indicating the extent of green surfaces relative to the overall surface area; and the Impervious Surface Factor, derived by subtracting the combined area of green and built-up surfaces from the total land area. Regarding urban morphology, computations were performed to establish parameters such as the Average Building Height, determined by analyzing the difference between the base points of each structure and their respective height values. Additionally, the Sky View Factor was generated utilizing the UMEP—Sky View Factor add-on tool, incorporating building and height data. Lastly, the Aspect Ratio, quantifying the relationship between building height and street width, was derived from the resulting product.
Following these calculations, a grid measuring 10 km × 10 km was established, with individual cells measuring 100 m × 100 m. Within this grid, mean values for the six aforementioned parameters were calculated for each cell using the Zonal Statistics tool. The corresponding parameter ranges for each LCZ were determined based on established criteria [
28]. These parameters were subsequently incorporated into a Python code, enabling the generation of the LCZ map within the QGIS environment. It should be noted that this classification predominantly focuses on built-up classes, with natural cover classes primarily represented in extra-urban areas. A visual representation of this comprehensive process is provided in
Figure 3.
2.2. ENVI-met Simulations
The LCZ map served as a valuable tool for characterizing the urban area (see
Section 3). Concurrently, we selected the LCZ classes that were most frequently observed on the map to conduct site analyses and generate simulation files. The ENVI-met software was employed to assess the impact of GI on air pollution. ENVI-met is a 3D modeling tool tailored to microclimates within urban environments, encompassing considerations of building materials, morphology, vegetation (both surface cover and 3D tree models), pollution sources, surface characteristics, and meteorological conditions. This approach has been previously employed in various studies to investigate urban microclimates, vegetation effects, and their correlation with air quality [
33,
34,
35,
36,
37,
38]. Several procedural steps were taken to generate the necessary data for simulating the Brindisi case. All the processes described below are shown in
Figure 4.
2.2.1. GIS Data Preparation
During the simulation process, the initial step involved preparing data for modeling the selected areas. Information pertaining to building footprints, heights, the distribution of green areas, tree presence, and surface coverage was acquired from the Puglia Database [
20] and processed using QGIS 3.23. Manual verification was conducted to update this information, particularly in green areas and tree locations, utilizing resources such as Google Earth and the Planet Net webpage. Additionally, a shapefile for traffic was generated, depicting circulation routes within the selected sites. In each shapefile, a column was introduced to incorporate ENVI-met codes, facilitating data transfer between software.
2.2.2. Full Seasonal Forcing
Meteorological data from the ARPA-Puglia SIRSI Station spanning 2017 to 2022 were employed to calculate typical summer and winter days in Brindisi. This involved calculating hourly mean values for temperature, humidity, pressure, radiation, wind direction, and wind speed for both summer and winter. Subsequently, these data were integrated into the simulation using the full forcing mode.
2.2.3. Database: Traffic Sources
In relation to pollution inputs, three types of traffic circulation were defined using the ENVI-met Database. Two of these circulation types were associated with urban traffic (with peak vehicle concentrations at 8 a.m. and 5 p.m.), comprising 16,000 vehicles on high-traffic streets and 8000 on less congested roads; both were applied to LCZ 2 scenarios. The third type corresponded to suburban roads (with peak vehicle concentrations at 7 a.m. and 6 p.m.), featuring 8000 vehicles, and was applied in LCZ 6 cases. The variation in peak hours is linked to different population movements associated with activities in these areas (LCZ 2 for commercial and LCZ 6 for residential).
2.2.4. Simulation Preparation
The data prepared in QGIS were imported into the ENVI-met Monde, where each shapefile was transformed into the model-specific format. After creating the model, it was incorporated into ENVI-met Spaces to construct the 3D model, introduce the nesting grid, and inspect spatial resolution. In ENVI-met ENVI-guide, simulations were configured with the following parameters: a 30 h duration (to ensure that the calculation stabilized after a spin-up phase), input model (which varied in each case, see
Section 2.2.5), meteorological data with full forcing (typical summer and winter days, see
Section 2.3.1), and pollution characteristics (background concentration for each site and pollutant, see
Section 2.3.1, and dispersion-only models).
The set up employed in this paper is similar in terms of turbulence model, initial and boundary conditions, and grid size to that used by previous studies [
35]. Specifically, the 3D simulation area (computational domain) of the investigated area had a dimension of 220 m (x direction) × 214 m (y direction) with a vertical height (z direction) of 105 m. The studied area was meshed with a grid resolution of 2 m × 2 m × 3 m (using a telescopic vertical grid by 6%), except for the lowest five cells (close to the ground) whose vertical resolution was 0.6 m. This grid resolution permitted us to capture physical phenomena like shear layers and vortices [
39]. To improve model accuracy and stability and minimize the undesired effects caused by the boundary, 7 nesting grids were also employed. The initial and boundary conditions used in the ENVI-met simulations are shown in
Table 2.
Finally, in ENVI-met ENVI-Core, the simulations were executed. Seven simulations were conducted for winter (four for LCZ 2 and three for LCZ 6) and seven for summer (four for LCZ 2 and three for LCZ 6).
2.2.5. Changes in Conditions for Case Studies
The selection of GI interventions considered urban morphological parameters, available space, and tested GI. The selected interventions included green walls, hedges, and various tree species [
19,
40]. The base cases reflected the existing arrangements at each site for typical winter and summer days. For the GI intervention cases, existing tree species in the area were considered for selection (see
Table 3 for details of GI interventions for each simulated case).
2.3. Data Analysis
2.3.1. Meteorological and Air Quality Data
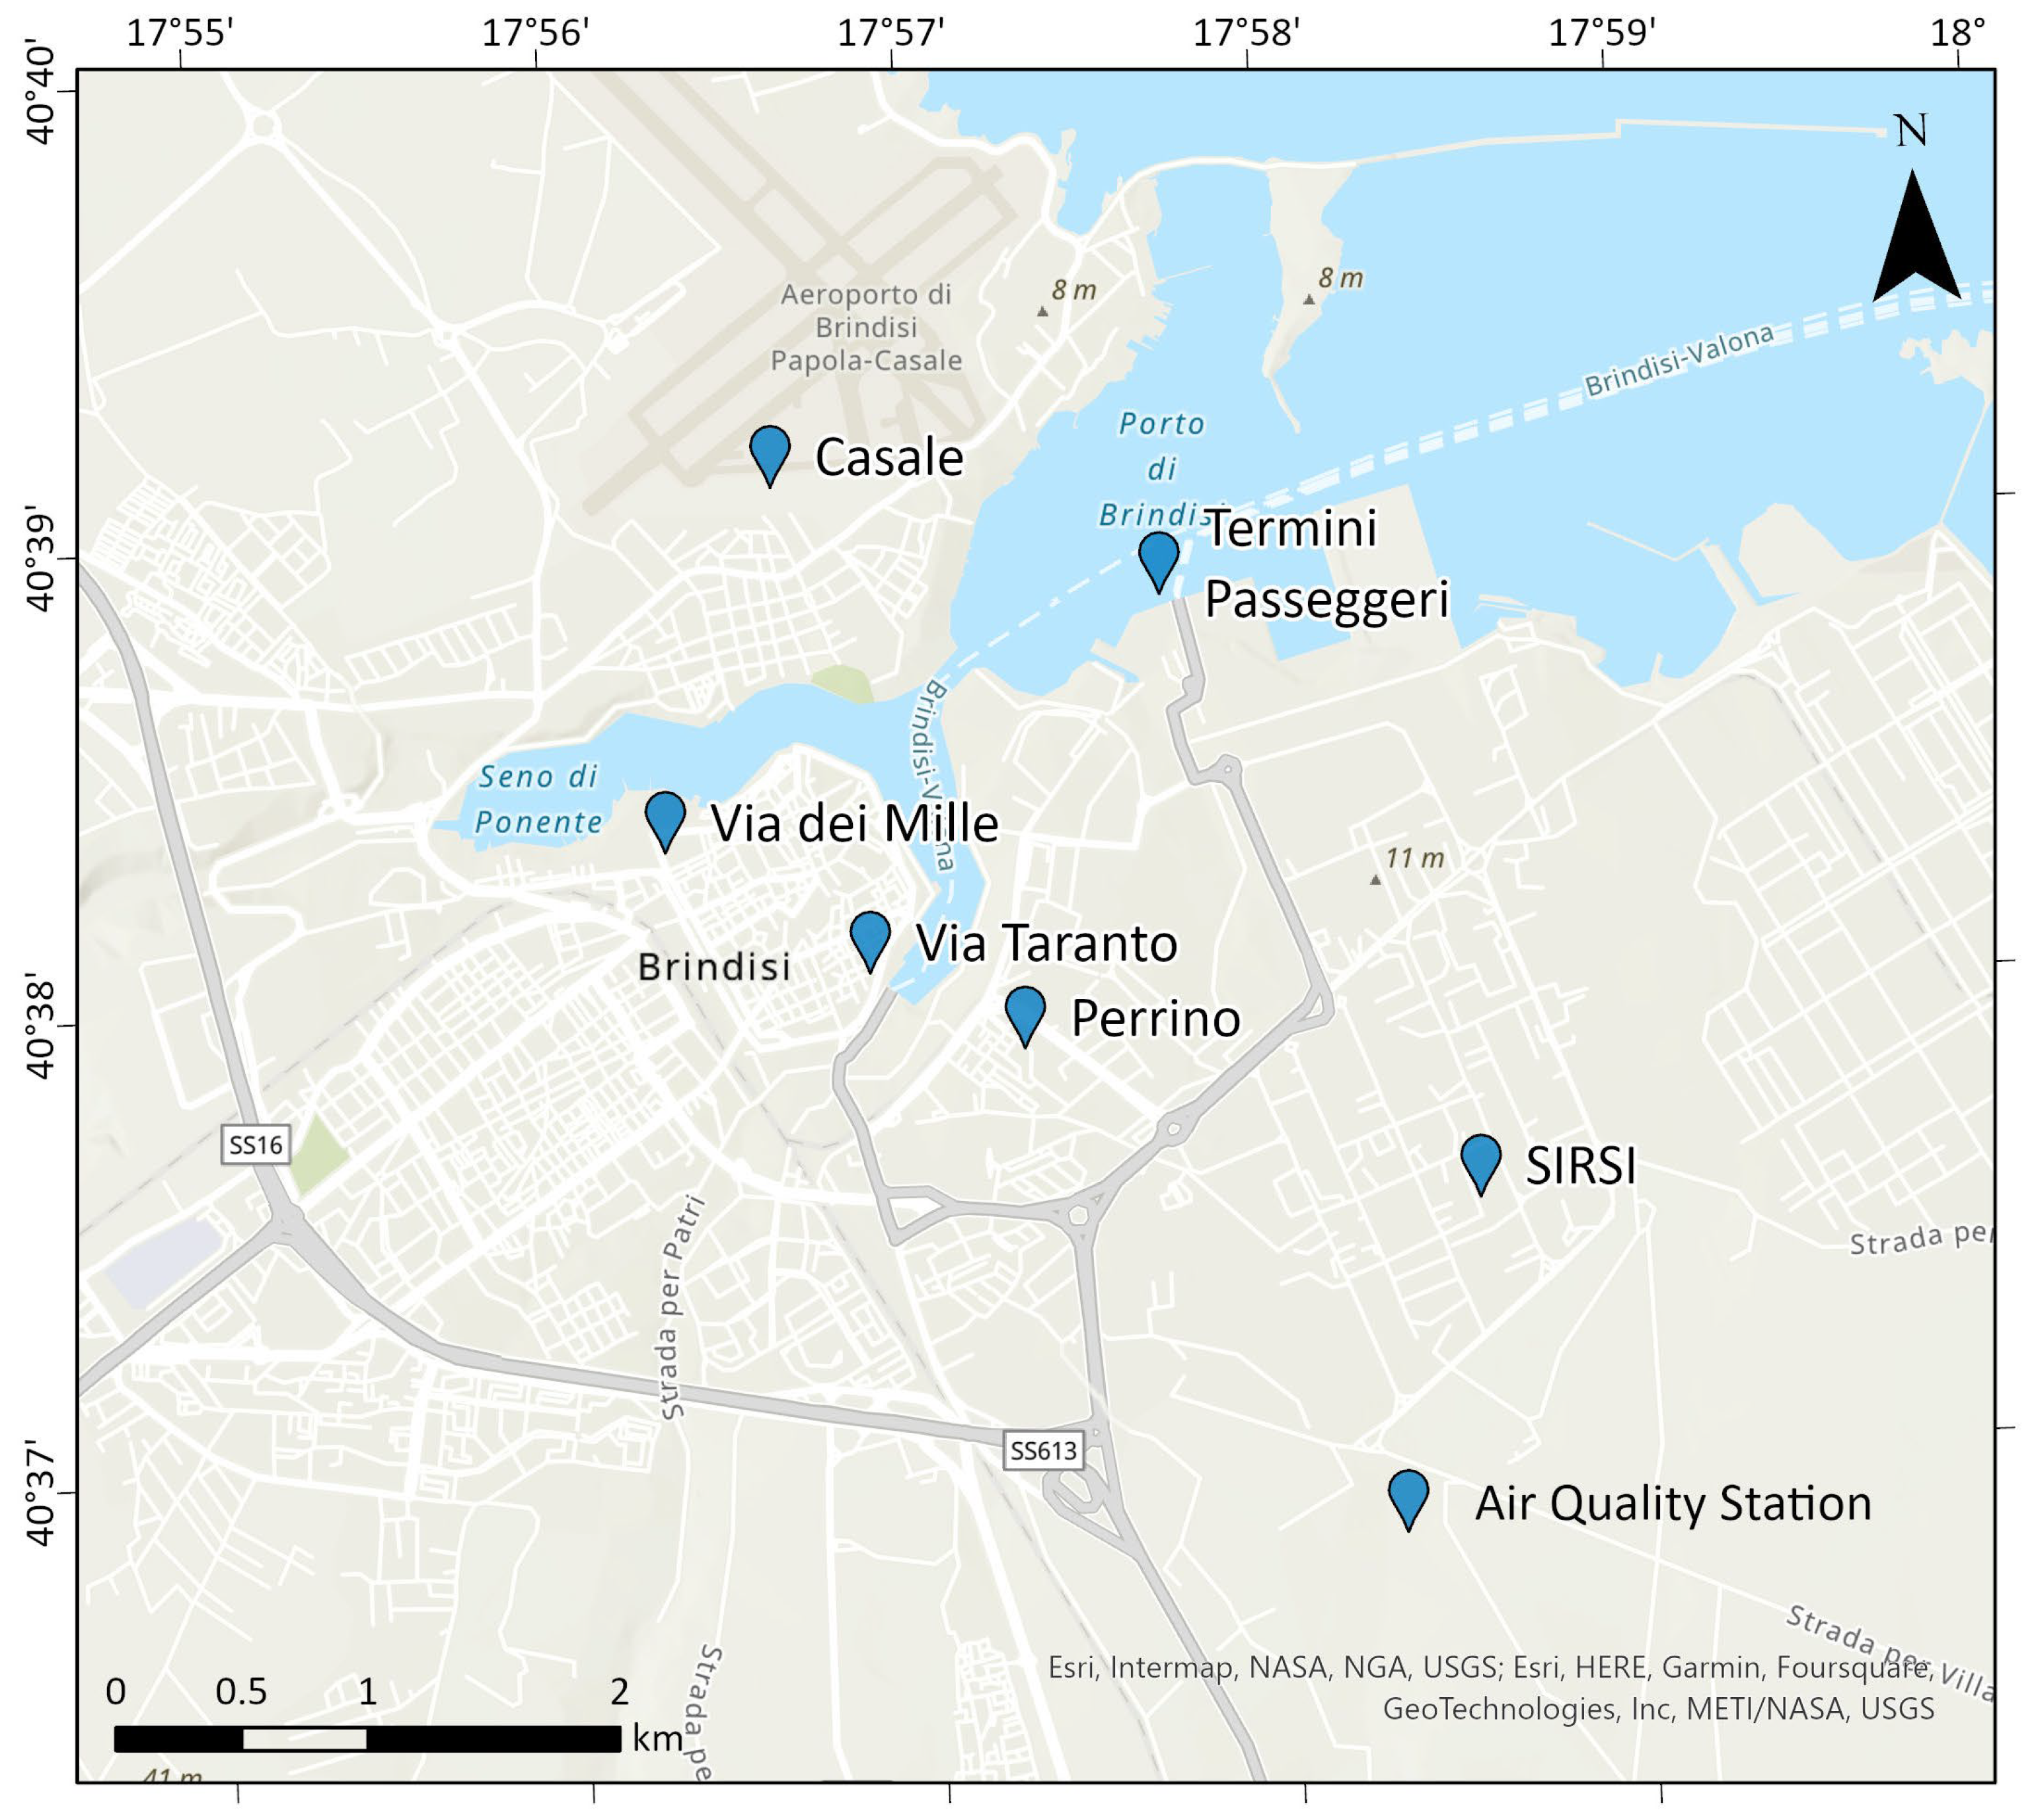
Meteorological and air quality data were sourced from the ARPA-Puglia database. The meteorological data, spanning from 2017 to 2022, obtained from the SIRSI Station, were scrutinized to generate typical summer and winter days for Brindisi (as discussed in
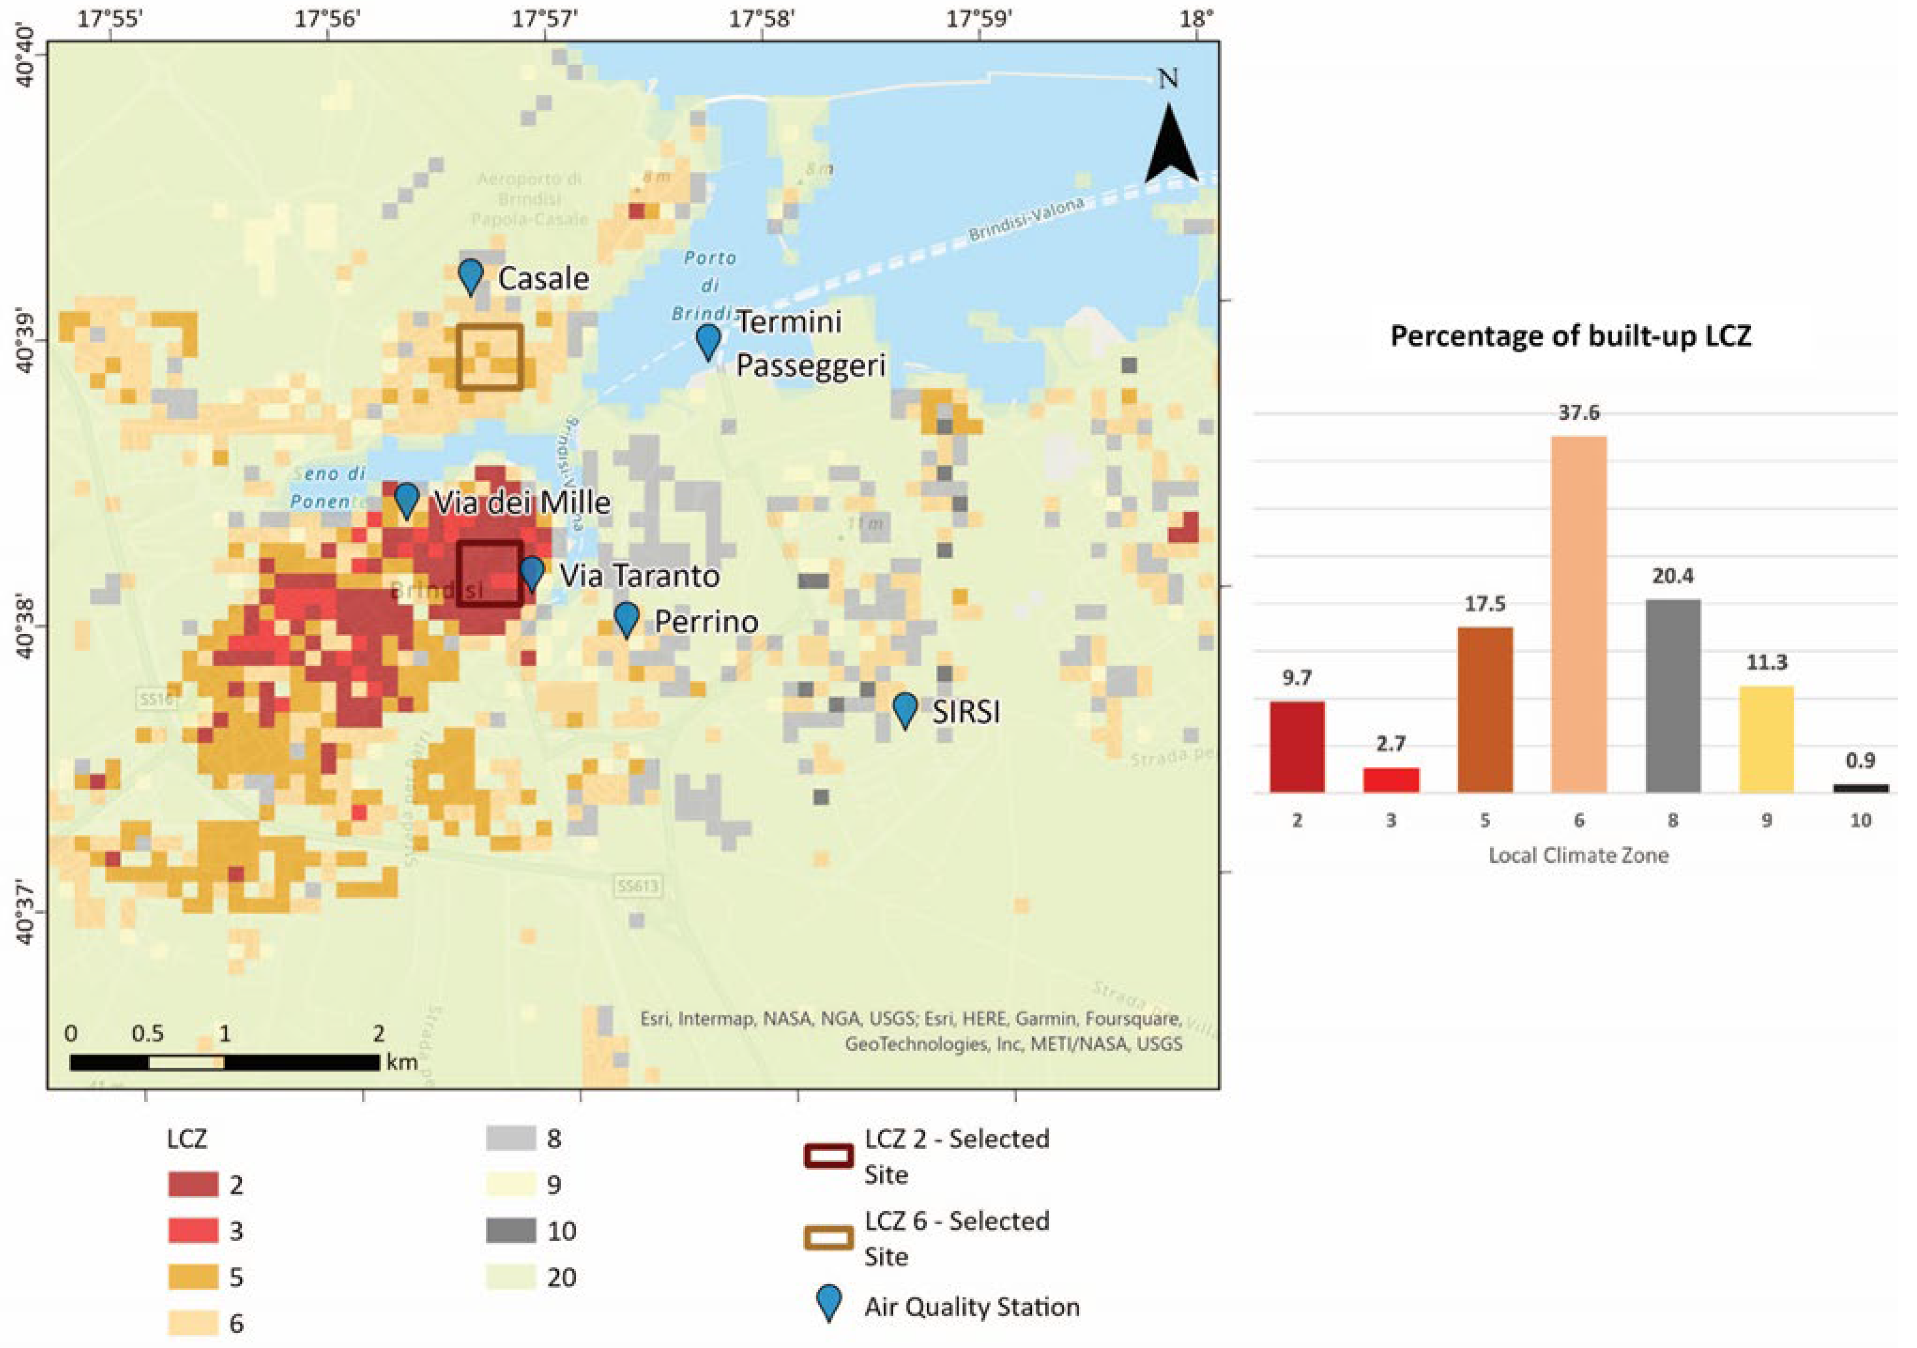
Section 2.2.2). Regarding air pollution data, there are five monitoring stations (Via Millie, Perrino, Casale, SISRI, and Via Taranto) within the study area. Unfortunately, data were available only for the year 2021. Each station’s characterization was based on its local environment. Casale and Perrino stations represent background pollution levels, the SIRSI station monitors pollution linked to industrial activities, while Via Mille and Via Taranto stations focus on traffic-related pollution (see
Figure 5). The analysis primarily concentrated on seasonal and daily concentrations of PM
10 and NOx, as these pollutants were identified as the most pertinent for the study area [
20]. The background values for each pollutant were a mean value derived from Casale and Perrino stations. All data processing was performed using Microsoft Excel (Microsoft 365).
2.3.2. Simulation Results
Two key parameters were chosen for detailed analysis: NOx concentration and UTCI (Universal Thermal Climate Index).
Regarding the NOx concentration, peak levels during the day were identified (8 a.m. and 5 p.m. for LCZ 2, and 7 a.m. and 6 p.m. for LCZ 6). These data were then used to study the spatial and temporal distribution of NOx and how each GI implementation influenced it.
UTCI was selected as the appropriate thermal index for human biometeorological analysis [
41]. It is a comprehensive index used to assess human thermal comfort by considering various meteorological parameters, and it is defined as the isothermal air temperature that would produce the same thermal response in humans under a specific set of reference conditions [
42]. It is calculated using Fiala’s heat balance model, which considers the human body’s physiological response to meteorological conditions. This model is based on a thermoregulation model comprising 12 human body elements and 187 tissue nodes. UTCI can be rapidly approximated using a polynomial procedure to determine the offset of UTCI from air temperature (UTCI − Ta) with the following formula [
43]:
where Ta represents the air temperature, V is the wind speed, e is the vapor pressure and Tmrt is the mean radiative temperature. UTCI is categorized into 10 levels, ranging from extreme cold stress to extreme heat stress (
Table 4). These categories have been rigorously validated through climate chamber and wind tunnel experiments, and are widely accepted by the International Society on Biometeorology and researchers in the field.
In this paper, the UTCI was calculated using the BIO-met plugin. Comfort conditions were assessed for summer cases, assuming a male individual aged 35 years wearing summer clothing. These calculations explored how the implementation of GI affected the thermal comfort of the population.
All results were imported into Excel for comparative analysis across different cases. The percentage changes in each case relative to the Base Case were calculated. Positive values indicated an increase in pollution or temperature, while negative values denoted a reduction in both parameters. Subsequently, the data tables were imported into ArcGIS Pro for spatial analysis and the visualization of each parameter and variations between cases.
To investigate microscale effects within urban canyons, two areas per LCZ were selected. In ArcGIS Pro, urban canyon values per meter were extracted for NOx concentrations during morning and afternoon conditions in both winter and summer, as well as UTCI values for summer. These tables were further analyzed in Excel to calculate differences between the Base Case and each GI implementation. The information was visualized using graphs and incorporated into Illustrator for better presentation. This comprehensive data analysis facilitated the achievement of the thesis objectives, particularly the evaluation of the impacts of GI in different LCZs.
3. Results and Discussion
3.1. NOx and PM10 Measured Concentrations
Air quality in Brindisi is monitored by five ARPA-Puglia weather stations. Two parameters were selected to analyze the air quality: NOx and PM
10. Both have been associated with developing diseases and, according to Minutolo et al. [
20], present the highest concentrations among the analyzed pollutants in the city. The study of the parameters was done on a seasonal scale, using the mean daily value of the three months for summer and winter.
The NOx label encompasses several nitrogen oxides associated with fossil fuel combustion in urban areas, mainly by vehicles. Prolonged exposure to this gas is related to developing respiratory diseases and premature deaths.
Figure 6 shows the daily average concentration of NOx (µg/m
3) for winter and summer, compared to the WHO/EU regulation standard of 25 µg/m
3 daily average (dashed lines in the figure). During winter, all the stations, except SISRI, present more than ten days where the values are over the standard, which implies a high risk of exposure to this pollutant. The situation is better in summer than in winter. As can be seen in
Figure 6, Casale and Perrino (background station) present only one day over the 25 µg/m
3. At the same time, stations near traffic (Via Millie and Via Taranto) offer the highest concentrations and higher numbers of days with exposure over the standards.
PM
10 is associated with the development of respiratory diseases and allergies. According to the WHO, the safety limit average is 45 µg/m
3 for 24 h, and the EU regulation is 50 µg/m
3 for the same period (dashed lines in the figure).
Figure 6 shows each air quality station’s daily mean value for winter and summer. In winter, none of the stations present any day over the standards. On the other hand, in summer, only three stations (Perrino, Taranto and SISRI) present one day over the WHO standard. This implies that the concentrations are not related to the activities surrounding the stations, as the three of them represent different characteristics.
After analyzing both pollutants and their recurrence, it can be concluded that NOx is the essential air pollutant in the Brindisi area. This is why the detailed study of each modeled area will focus on its variations.
3.2. Local Climate Zone Map and Site Selection
The LCZ maps generated by the GIS methodology (
Figure 7) show that the study area presents mostly natural cover areas, including agricultural production surrounding the city (mainly fruit trees). As for the built-up LCZ, the lack of LCZ 1 and 4, representing areas of very tall buildings (more than ten floors), is noteworthy. Regarding the densely built areas, LCZ 2 occupies 9.7% and LCZ 3 2.7%, both in the city center. On the other hand, the open or less densely built-up areas, which are the most crucial segment of the city, are LCZ 5 (17. 8%), LCZ 6 (37.6%) and LCZ 9 (12%). Finally, LCZ 8 (warehouses) is 20.4%, and LCZ 10 (industries) occupies only 0.9%.
This map is considered a Level 1 product, as it has more detailed information about the urban morphology (aspect ratio; Built-up Surface Factor; pervious and impervious ratios; mean height; Sky View Factor). This means the resulting classification cannot be validated with the available products. This is why the corroboration was done visually against 3D images from Google Earth. Most results in the urban areas are good, especially in the city center and surrounding zones. The biggest problems arose in the classification of LCZ 8 and 10, where most of the areas classified as such had to be re-classified to the second option of the code, mainly to LCZ 5 and 6.
The present LCZ map is the first one produced for the city of Brindisi. This level of information regarding the city can be used not only for this work, but also for further studies in the urban area or to conduct comparative research.
Figure 7 also shows the selected sites modeled in this paper. LCZ 2 and LCZ 6 are the two most frequent LCZs in each segment of built-up. At the same time, we will focus on areas where the population is higher and is exposed to poor air quality. The figure also shows the location of the air quality stations; LCZ 2 can be related to Via Taranto’s conditions, while LCZ 6 to Casale’s conditions.
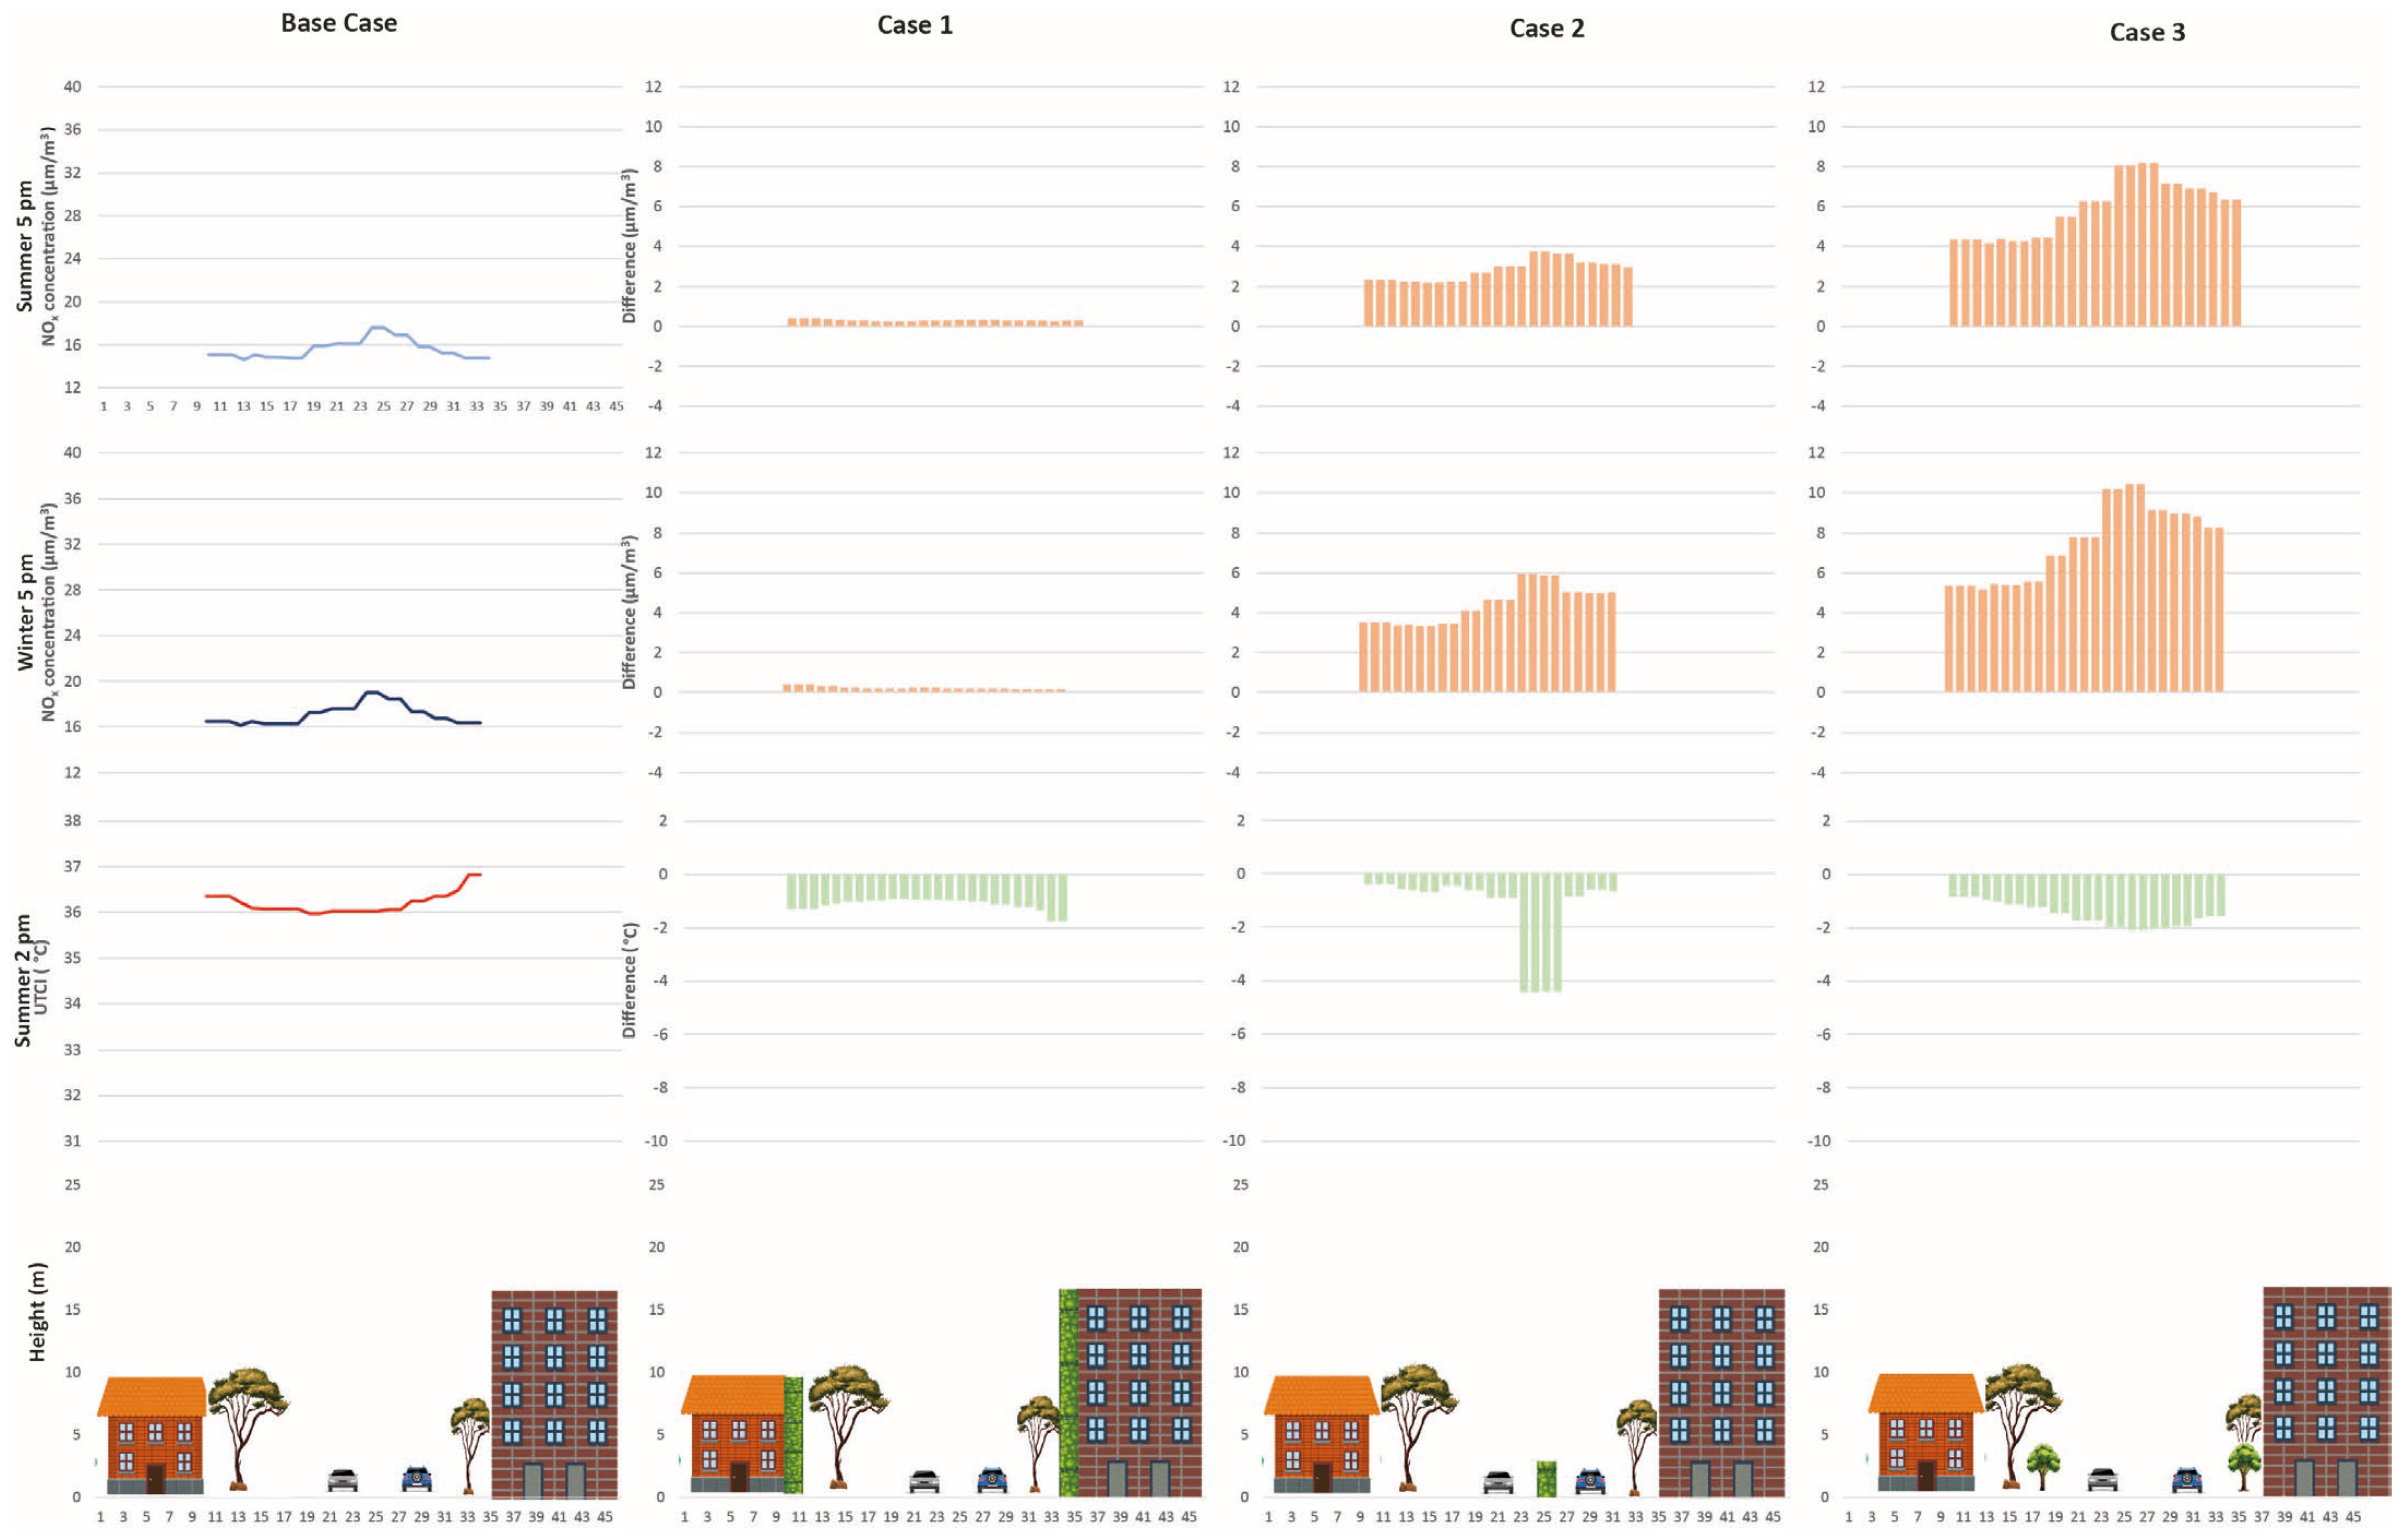
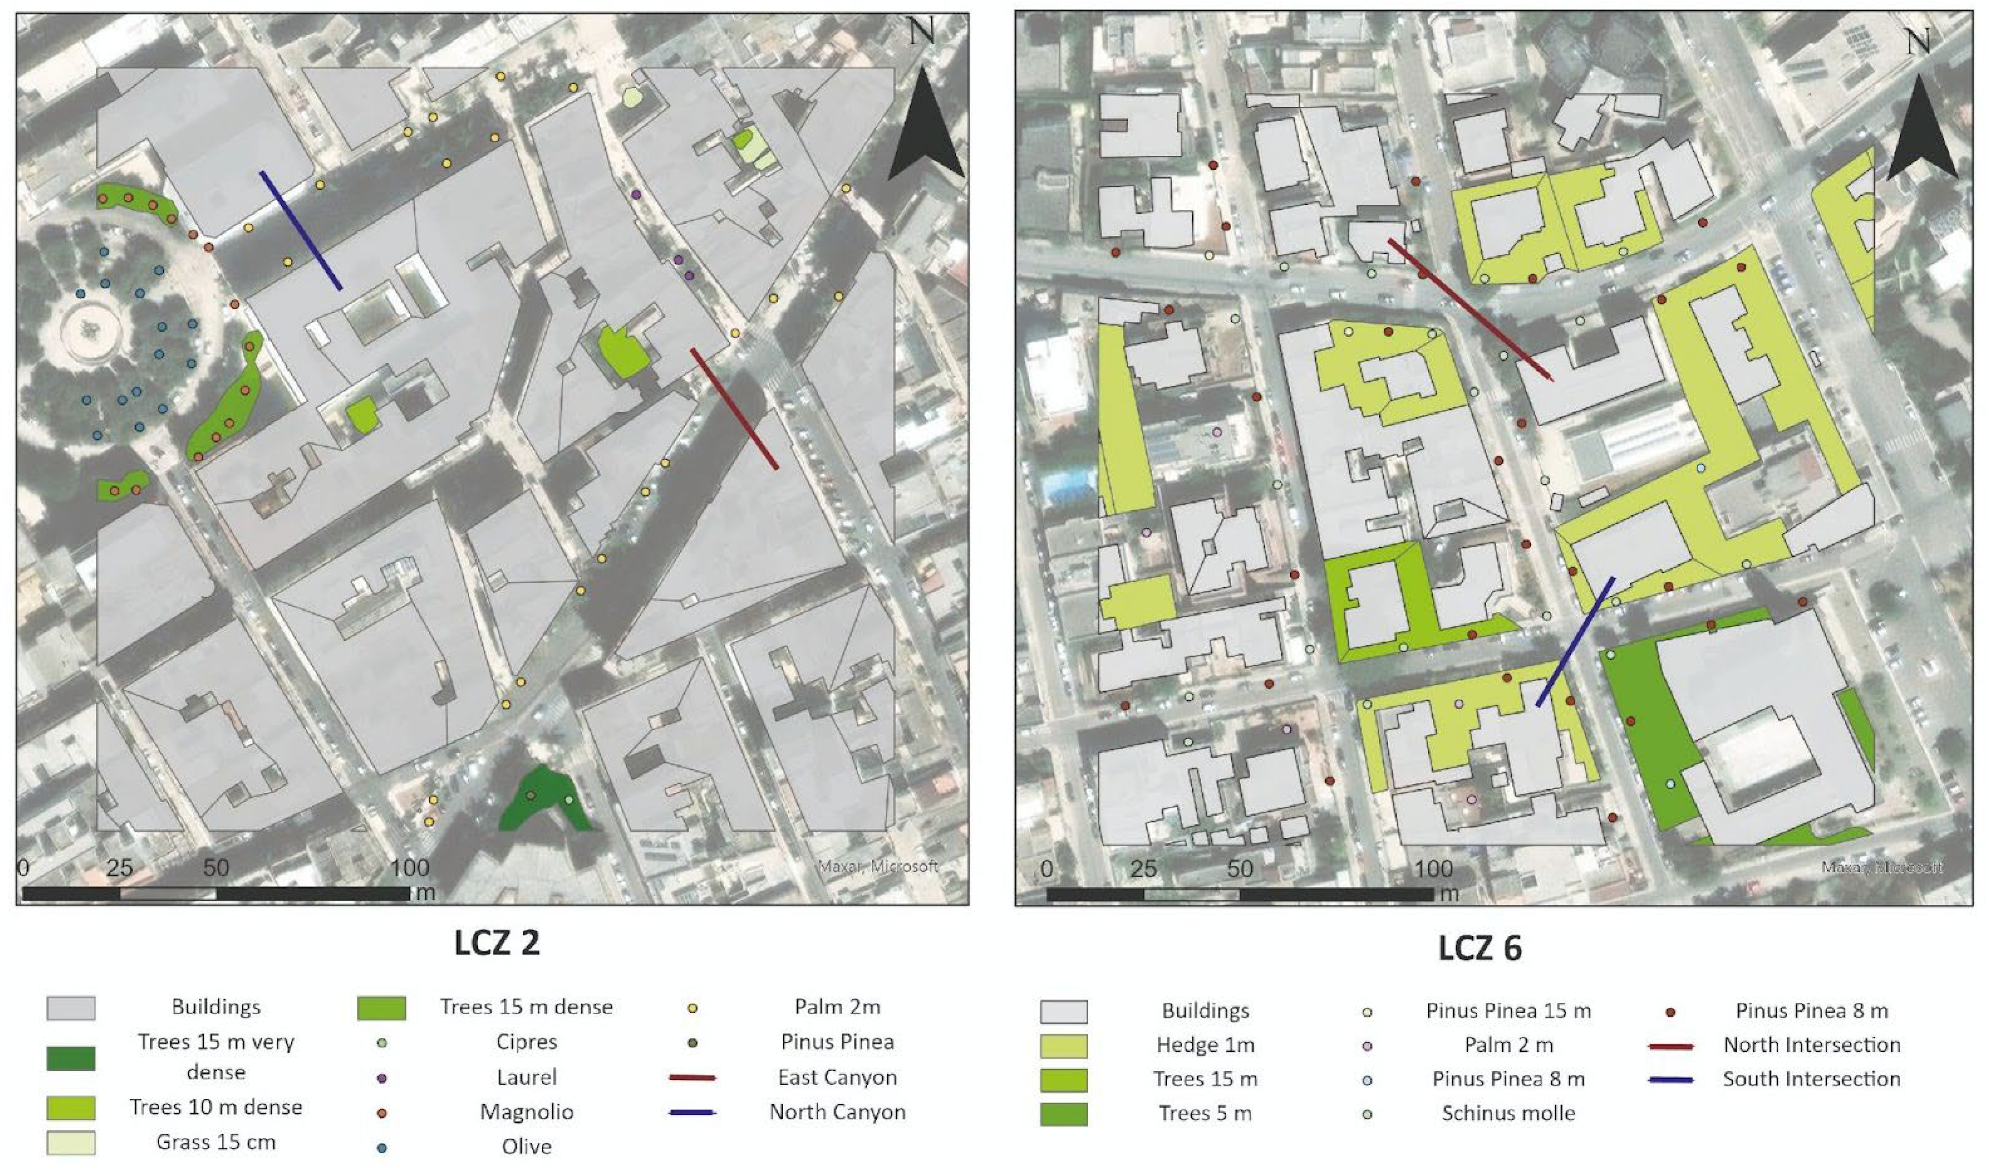
3.3. LCZ 2—Impact of Urban GI on Concentrations and Comfort
The selected LCZ 2 site is in the city center of Brindisi. The area presents commercial and residential uses. As can be seen in
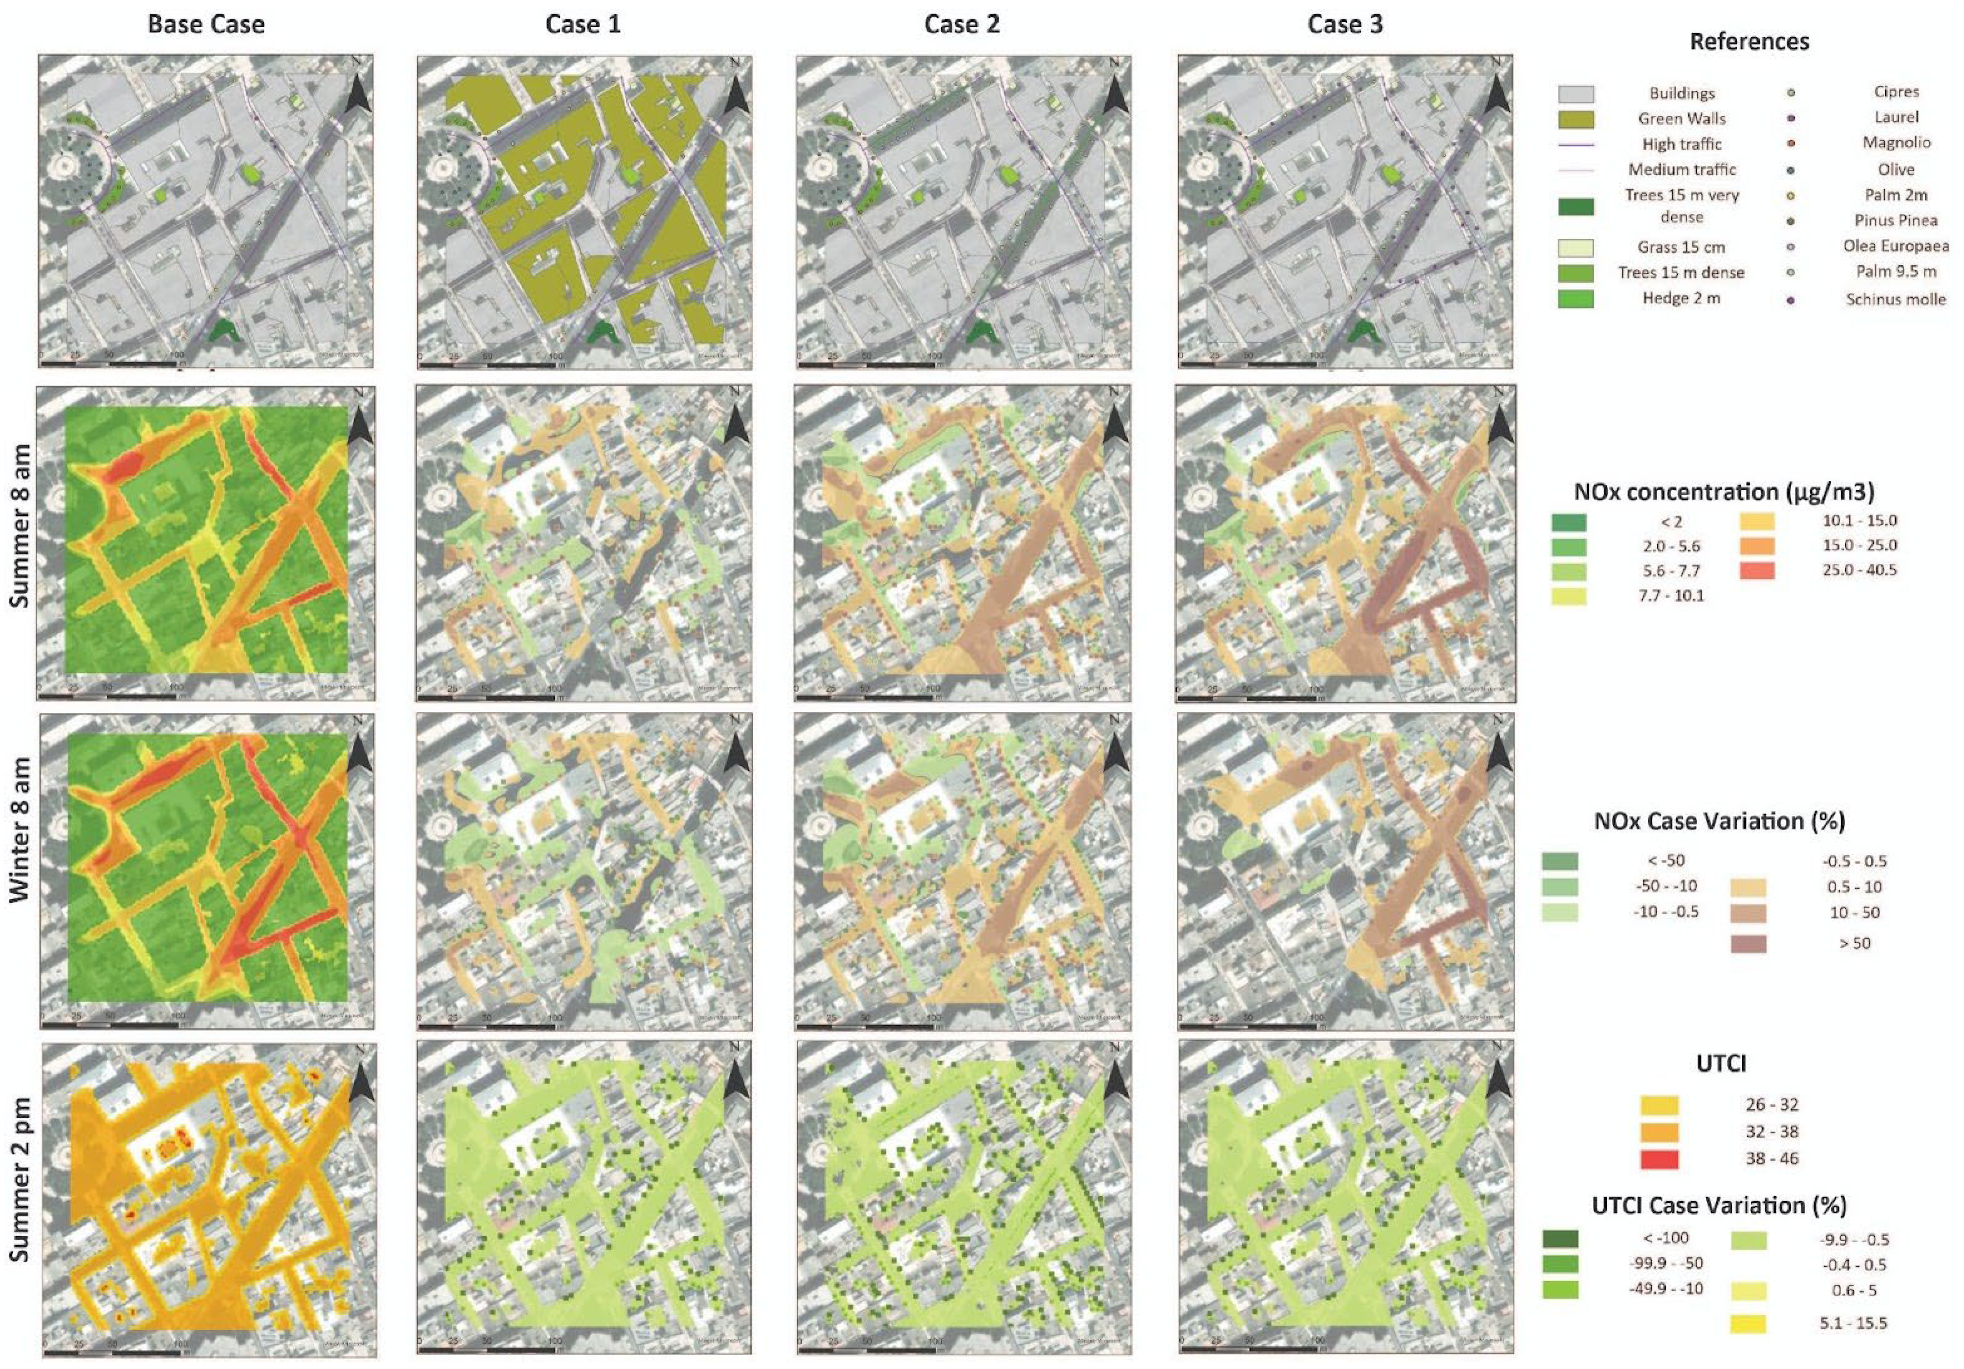
Figure 8 (Base Case), it has three main roads with heavier traffic. Buildings are between 9 and 25 m high, and for the proposed model, the walls and roof materials are the default ones from the ENVI-met database. Regarding the vegetation on the roundabout, there are olive and magnolia trees; in the southern part of the area, there are several big cypresses and pines; and in the main avenues, there are palm trees.
For the case development, we selected for each model a combination (
Figure 8). Case 1 presents several buildings with green walls (the ones around the primary traffic) to analyze the effect of this GI on pollution distribution. In Case 2, a combination of hedges in the middle of the roads, like boulevards, and an increase in the number of trees were implemented. Finally, Case 3 only considers more evergreen trees to evaluate their impacts in both seasons (summer and winter).
As shown in
Table 5, all the cases present the same value for minimum concentration, and the main difference lies in the maximum concentrations, which have higher values than the WHO and EU regulations (25 µg/m
3) in all of them. All the cases present higher values than the Base Case. Case 3 has an exceptionally high concentration, almost duplicating the original case and increasing the values by 30 µg/m
3 compared to the rest. Comparing winter with summer, the minimum value is the same for all the cases while the maximum values show different behavior, but are again over the regulations. Base Case and Case 1 have lower values in summer, but Case 2 and 3 present higher maximum values during winter. In all analyses, Case 3 is the worst scenario, with a maximum over 85 µg/m
3 duplicated in all other cases.
Figure 8 shows the NOx concentration from the Base Case at 8 a.m. for summer and winter. During summer, the cases show the worst results, with higher values over the regulations near the roundabout, the northeastern street, and the road in the south of the area. In Case 1 (green walls), air quality conditions are improved near the roundabout and the southeastern area of the site, while some areas of North Avenue and the diagonal avenue present worst conditions. Case 2 (trees and hedges) shows that the conditions are worse compared to previous cases. Morning conditions are worse in the southeast of the selected site, but an improvement is attained in the center of the area and some areas of the northern avenue. The last case (evergreen trees) results in the worst case of all considered. The pollution increase, with respect to the Base Case, is greater than 50%, showing a great deterioration in the air quality. As a general result, all the considered cases show a worsened concentration of NOx, particularly in the avenues, except the open space of the roundabout. The case that generates a minor impact is the implementation of green walls, which produces higher deposition rates, especially downwind (considering that the prevailing winds in the area are from the northeast). The winter spatial distribution of NOx concentrations shows that the Base Case presents a more extensive area with higher pollution values than in summer, especially in the northern and diagonal avenues. Case 1 offers the largest improvement, with reductions of up to 10% distributed around the study area. Two areas are worth highlighting: the south and the roundabout. This last one has some parts showing a higher improvement. The second case has a poorer performance than the previous ones, with a decrease in the air quality with respect to the Base Case. Finally, Case 3 is again the worst scenario, as the evergreen trees have significant effects trapping NOx in the lower atmosphere, thus generating the highest concentration values along the avenues.
Regarding the UTCI, it reaches its maximum values in the inner courtyards, where very strong heat stress is achieved. Strong heat stress is generally distributed in avenues and streets, while only in some sidewalks is moderate heat stress present. This shows that the area is quite uncomfortable, according to thermal analysis. Related to the changes generated by GI, all the cases show an improvement over the 10% in the thermal sensation. Case 2 has better conditions, primarily related to the hedges in the avenues, while Cases 1 and 3 show almost the same spatial distribution. In all cases concerning UTCI, there is a reduction in the thermal sensation, reaching a general distribution of moderate warm stress.
In conclusion, in LCZ 2, where the urban canyon is the narrowest, the GI intervention associated with the best air quality is green walls, as presented in Case 1. However, the range of spatial distribution is not homogenous. On the other hand, any tree intervention (Cases 2 and 3) generates a general deterioration of the urban canyon as it presents higher values of pollutants concentrations, preventing good ventilation, as stated by Abhijith et al. [
19]. It is worth emphasizing that in this environment, one should first ponder how to improve the air quality by decreasing traffic in the area. According to Nieuwenhuijsen [
9], these are direct ways to reduce pollutant levels in the urban environment. In the Brindisi case, with areas whose pollution levels exceed the regulations, these measures should be explored, and in a second stage, GI could be incorporated not only to improve air quality, but also to address thermal comfort and other ecosystem services.
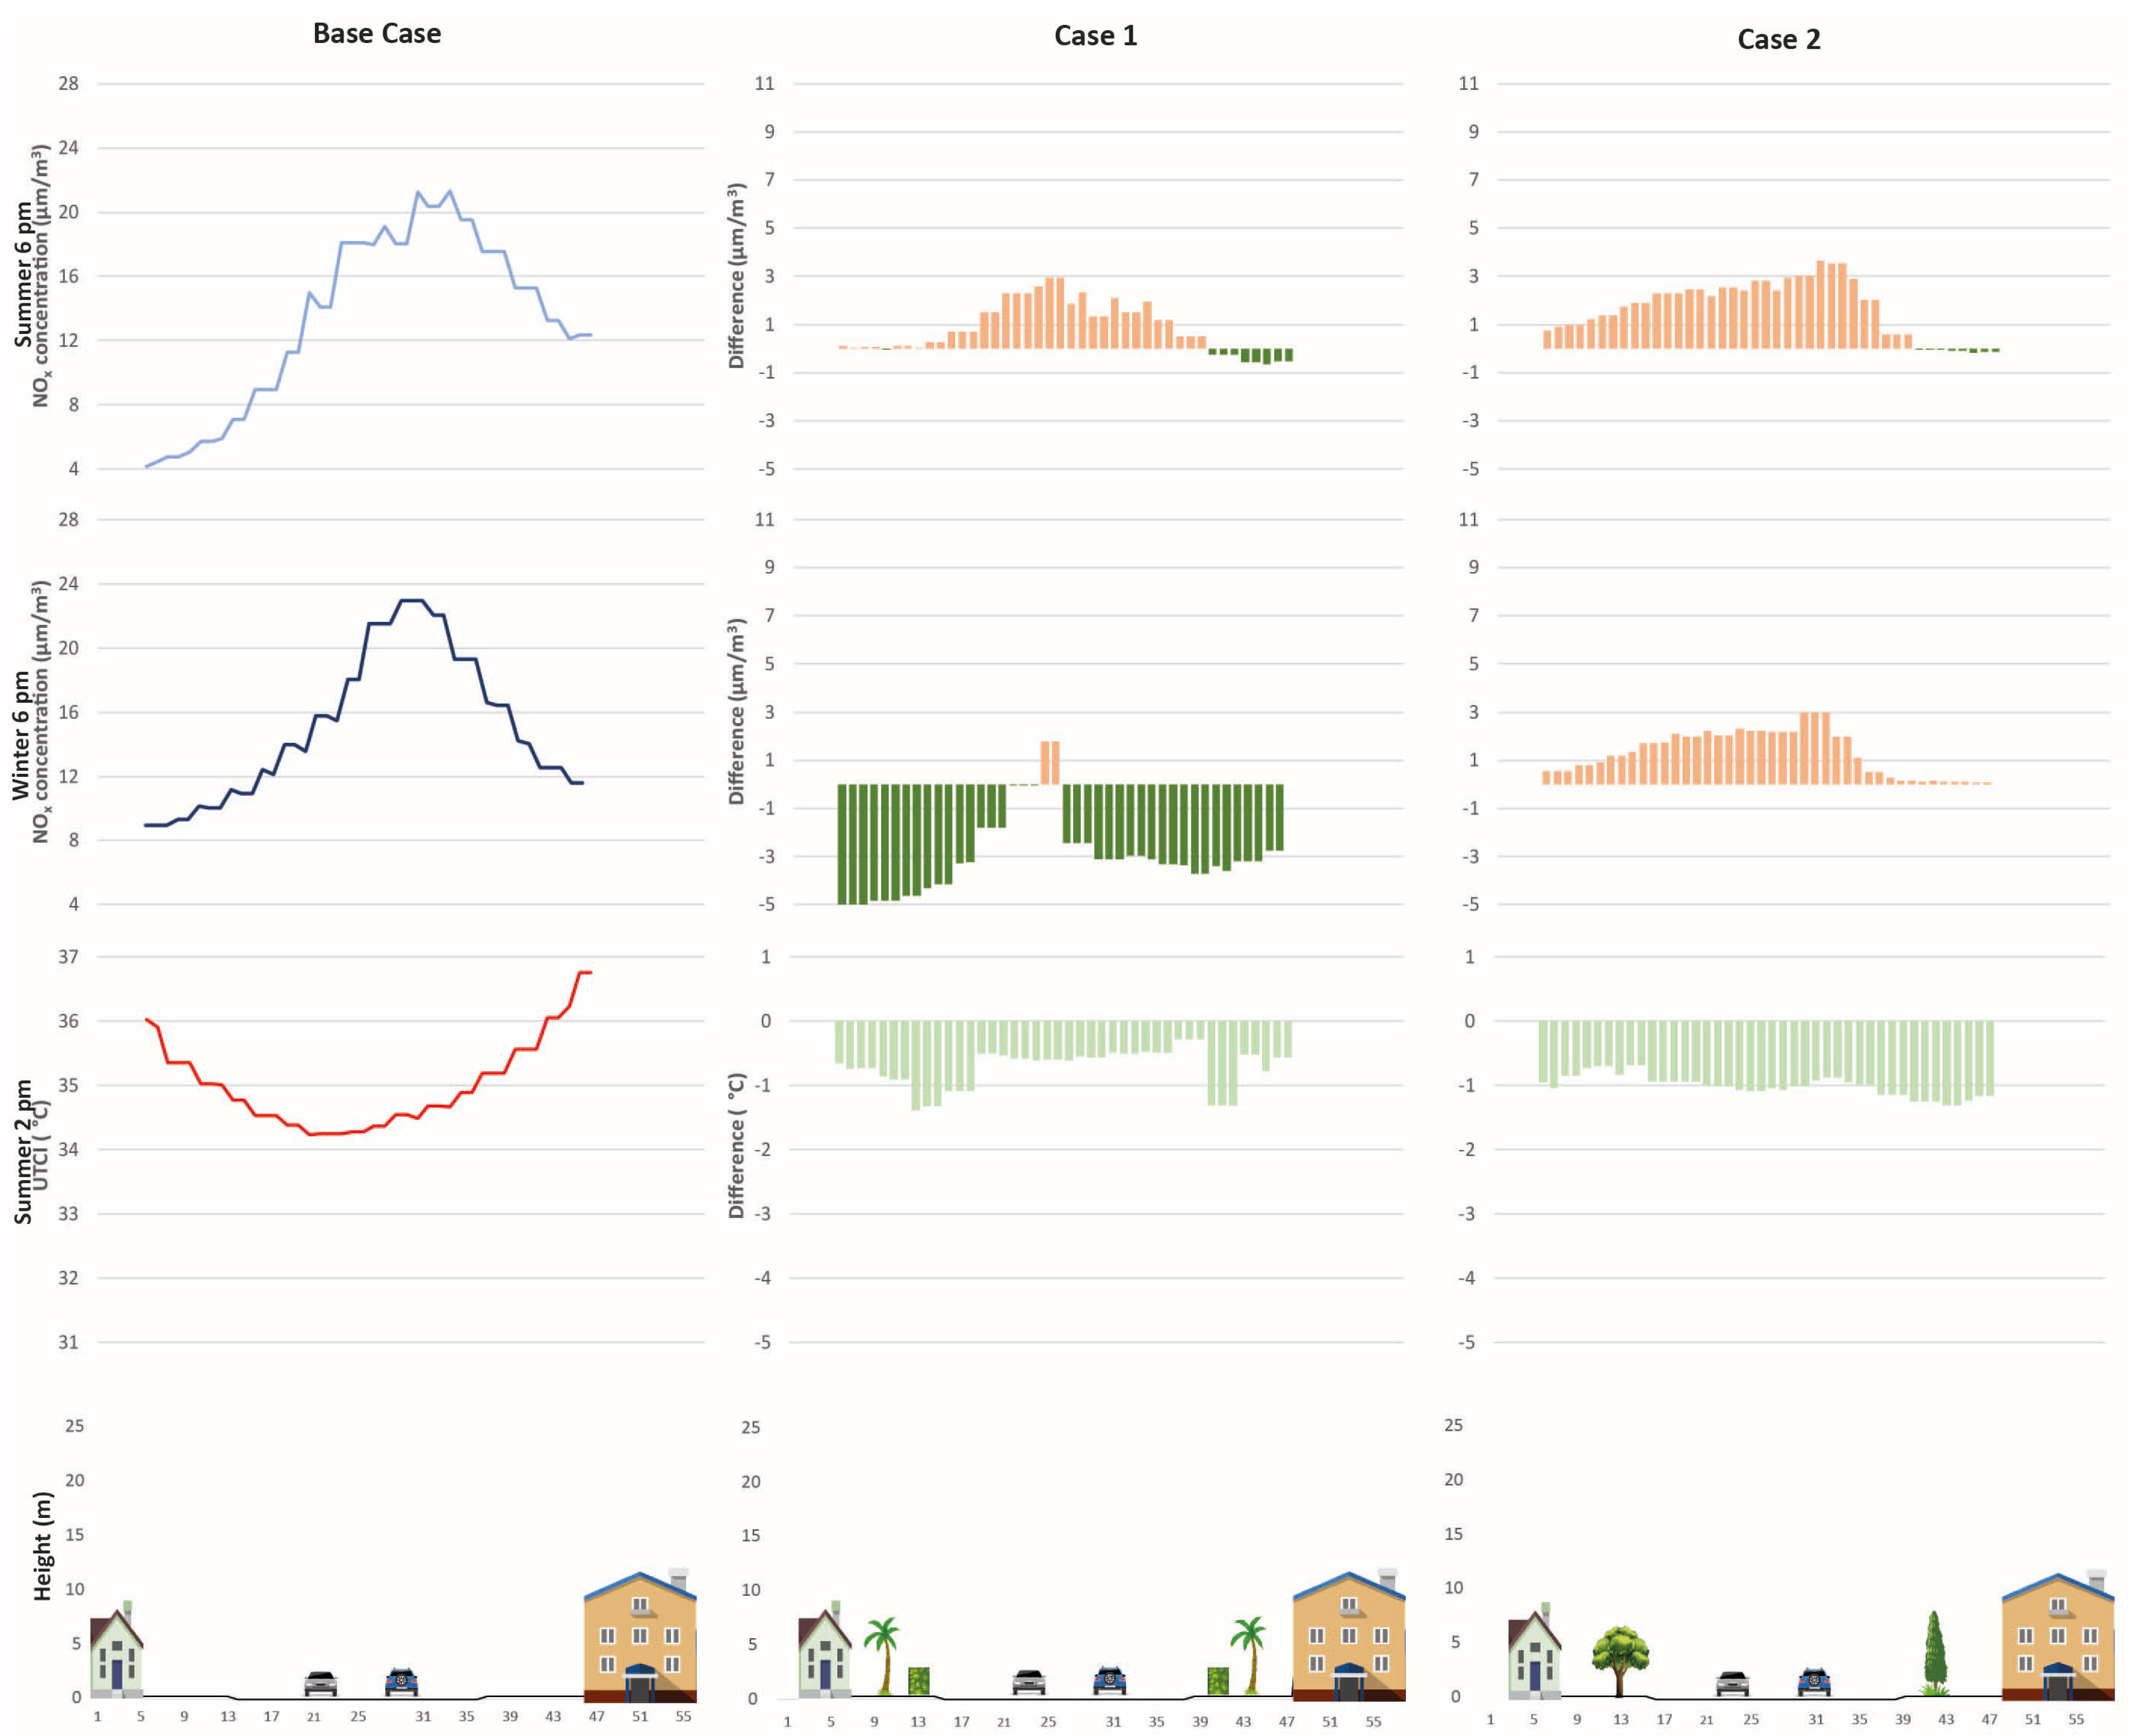
3.4. LCZ 6—Impact of Urban GI on Concentrations and Comfort
The most common LCZ in the area is LCZ 6 (
Figure 7); the site selected to test different GI values is located north of Brindisi, near the bay. It is primarily for residential use, and the traffic here is composed of suburban roads (peaks of traffic at 7 a.m. and 6 p.m.). The area has more vegetation in comparison to LCZ 2. These are represented by hedges and trees (pines and palm trees) with different heights (
Figure 9).
Two different GI implementations were tested on the site (
Figure 9). Case 1 assumes a higher density of public trees on sidewalks and the addition of hedges in some corners where pollution is higher. Case 2 involves more evergreen trees to study their differential effects between summer and winter. The NOx concentrations in LCZ 6 are lower than in LCZ 2, which can be easily explained considering the different traffic flows in each area. During summer, only Case 2 overcame the WHO and EU regulations, while in winter, all the cases exceeded them; this implies that the climatic conditions interact with the concentrations of the pollutants. The comparison between models in LCZ 6 is shown in
Table 6. Both summer and winter present lower values in the Base Case, while Case 1 shows a 10% increase and Case 2 presents a 50% increase.
Figure 9 shows the NOx spatial distribution and the variations in each GI intervention case. During summer in the Base Case, no values exceed the threshold regulations imposed. Higher concentrations are found in all the intersections, mainly the two crossings located in the center of the area. In Case 1 (hedges and trees), there is an evident deterioration in the atmospheric conditions during the morning, with 10 to 50% higher NOx concentrations in almost all the area. Case 2 (evergreen trees) generates the worst scenario of the series, with an increase of more than 50% in NOx concentrations in some areas, and in general, with values higher than the Base Case ones. During winter, the Base Case presents higher values in the streets running east to west, relating to the prevailing winds from the east. Regarding the changes in Case 1, the worst deterioration occurs in the central area, while some places on the edges present some improvement. Case 2 is the worst scenario, with changes that present 50% or more NOx in several parts of the study area. In this case, the results demonstrate a better impact of the GI than in LCZ 2. This can be traced back to lower traffic levels (half the cars on the main roads of LCZ 2) and broader urban canyons, which allow for a better circulation of local dominant winds. This is especially true considering hedges.
The UTCI conditions are again similar to those of LCZ 2, with strong heat stress. The cases present improvements—a 10% reduction is achieved in both, which reduces the thermal sensation to moderate heat stress. The main difference is on the southern street, where the evergreen trees present better conditions than the hedges.
The obtained results correlate well with the existing literature on trees’ negative impact on air quality, particularly in areas with narrow urban canyons [
7,
44,
45]. As presented by Abhijith et al. [
19] and Tomson et al. [
40], trees are not a promising intervention for narrow street canyons. It is of particular importance, before any GI intervention, to have in mind the canyon geometry, the local meteorological conditions and the vegetation characteristics. As Hewitt et al. [
15] presented, it is crucial to model the implementation of GI and study the possible impacts on the urban environment. In this sense, this study has shown that not all GI interventions will positively impact air quality, but some of them do. For example, in LCZ 2, green walls prevent the trapping of pollutants in the canyon and improve the air quality conditions, while in LCZ 6, the hedges and some trees improve local wind circulations and generate more positive effects.
3.5. Urban Canyons Analysis
This section examines the NOx concentration and the comfort results in selected urban canyons in each LCZ. The comparison will focus on the UTCI and NOx concentrations of summer and winter afternoons.
Figure 10 shows the canyons selected. Each one is named after the location it represents in the area.
3.5.1. LCZ 2
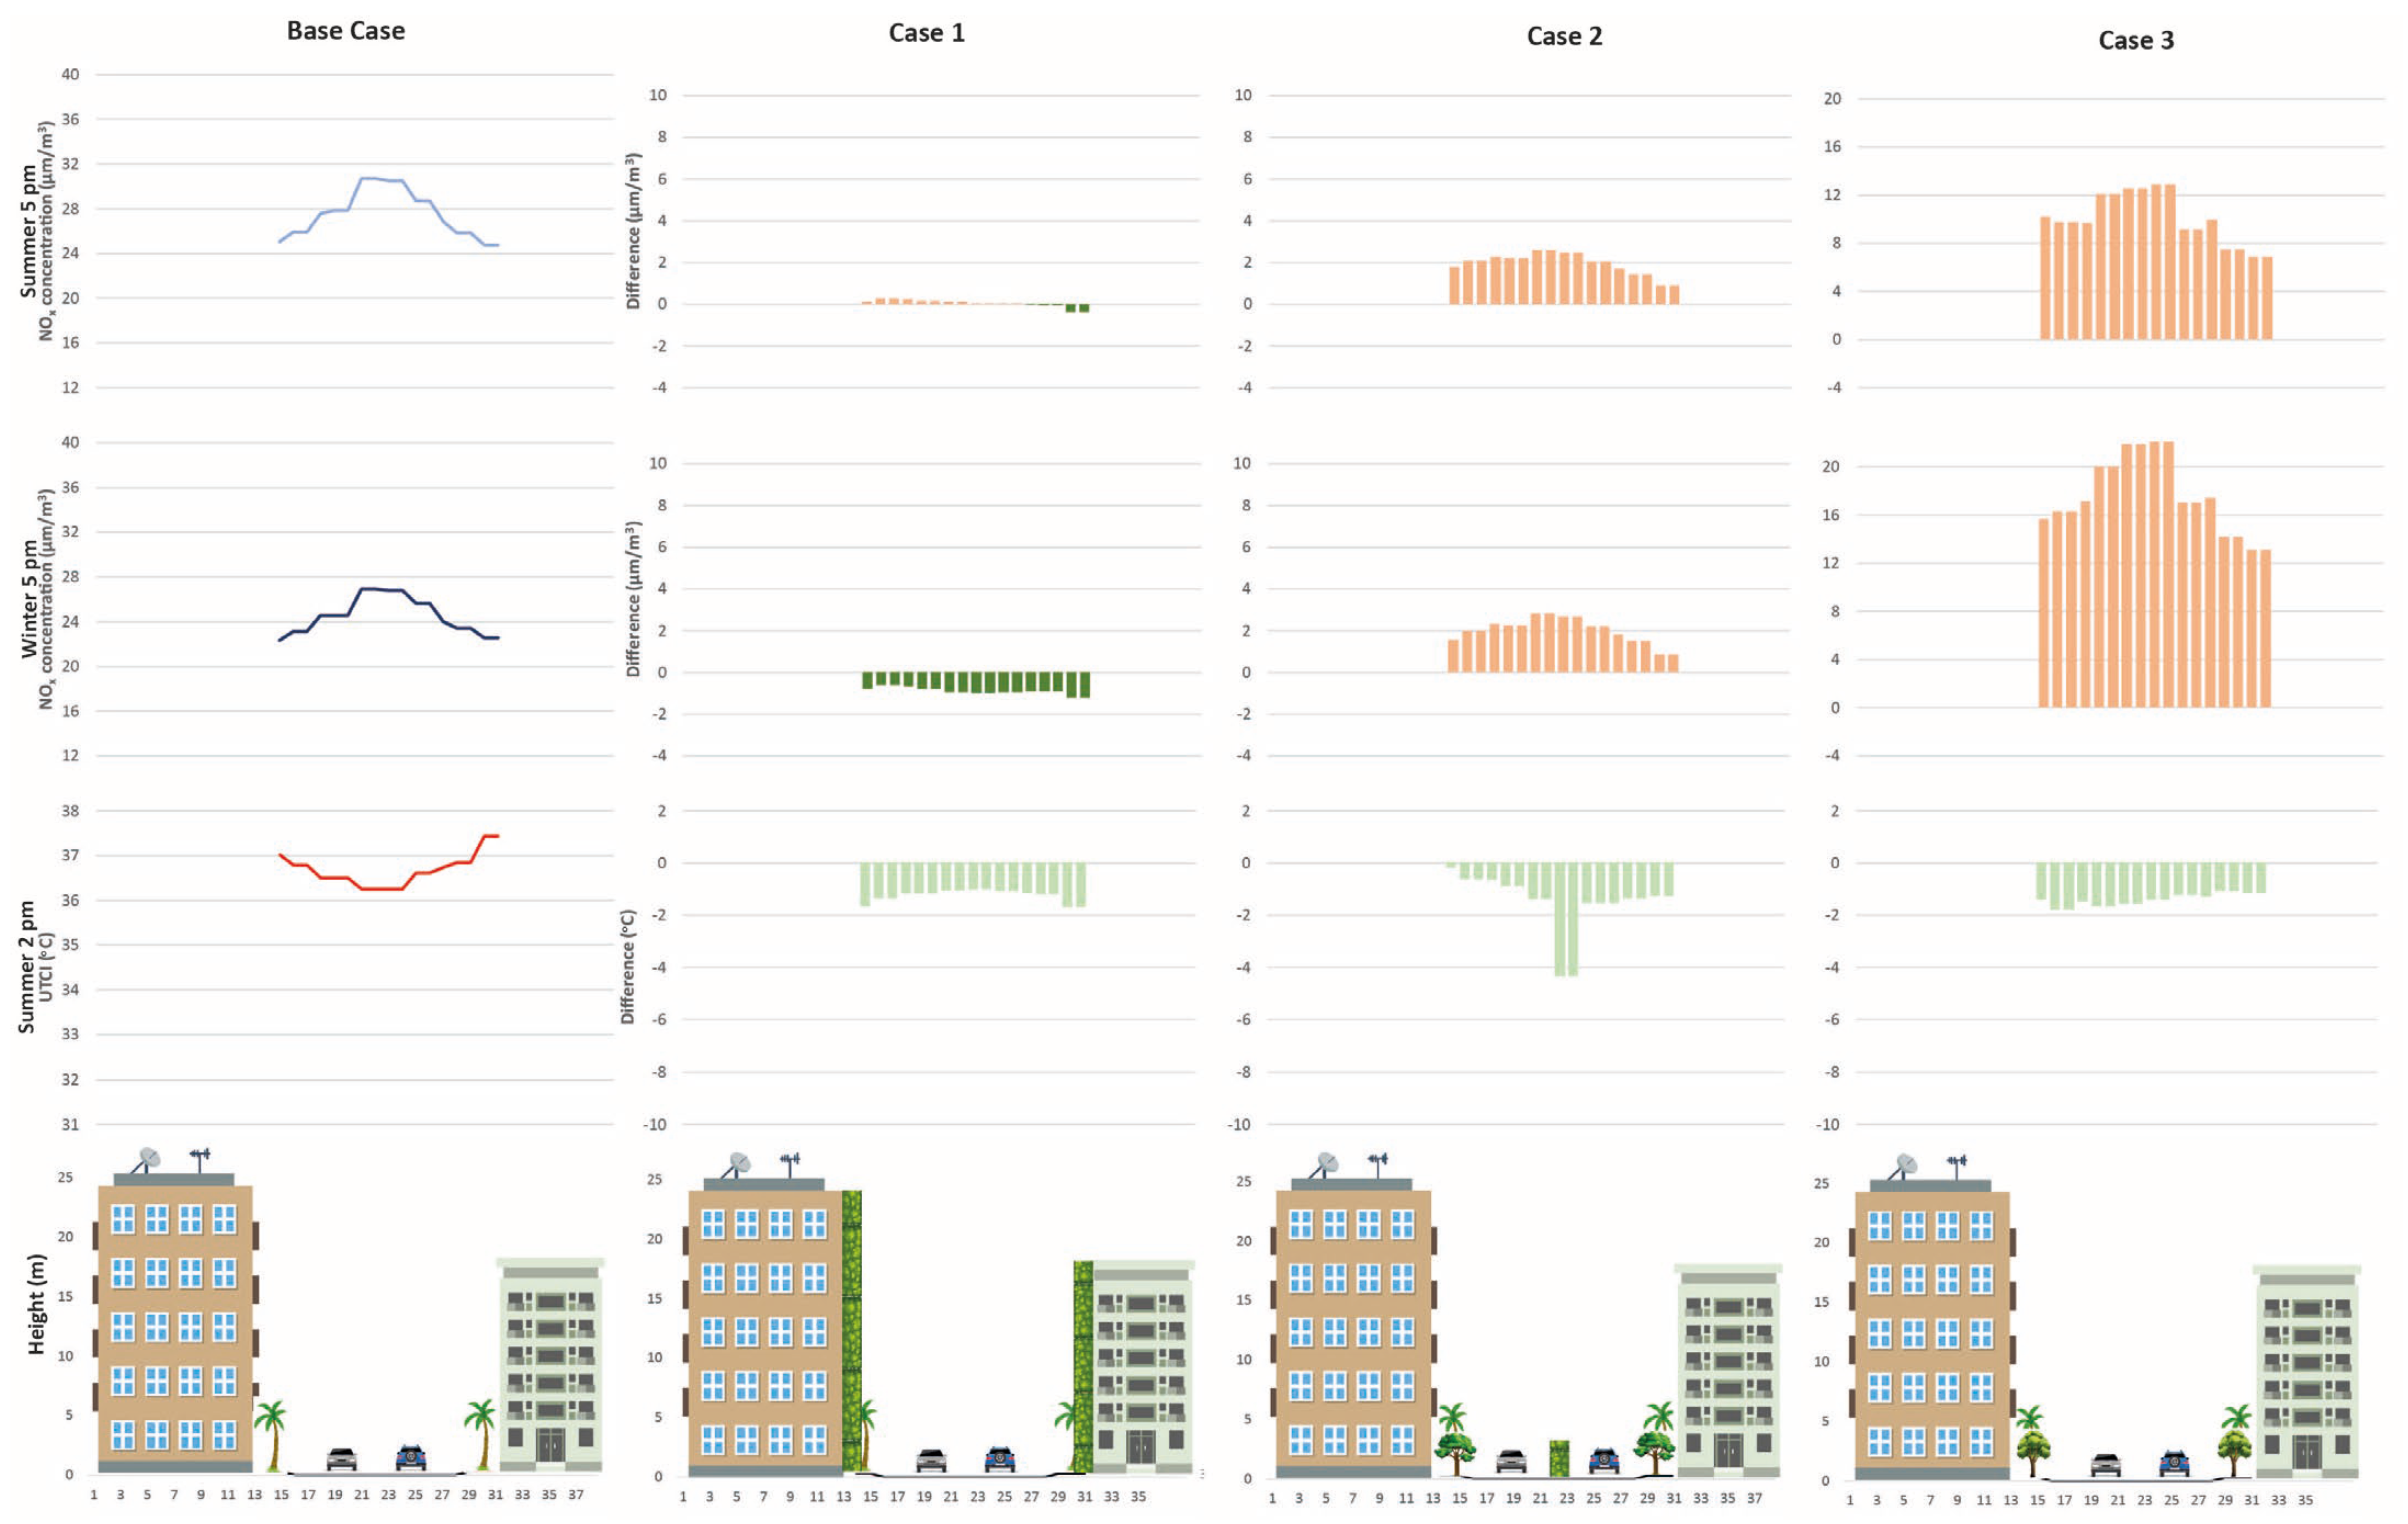
The northern urban canyon within LCZ 2 has an aspect ratio of 1.22, which is the highest among the selected sites. In
Figure 11, you can observe that the building heights are 25 and 18 m, while the street and sidewalks occupy 18 m. The canyon is analyzed for three key parameters: UTCI, and NOx concentrations during summer and winter afternoons. Because the shorter building faces south, the maximum UTCI is higher near the facade, while lower values are found in the center of the canyon due to a combination of wind turbulence and building shading. When it comes to NOx concentrations, both seasons exhibit a similar pattern with higher values in the central area of the canyon. Notably, NOx levels are generally higher in summer (ranging from 25 to 31 µm/m
3) compared to winter (21 to 27 µm/m
3), with most values exceeding regulatory limits.
When analyzing the effects of each case on the spatial distribution of these variables, it is evident that in all three cases, vegetation reduces UTCI by more than 1 °C. Hedges, in particular, make a more significant impact by lowering it by 4 °C. In terms of NOx concentrations, the figures show that Case 1 (green walls) is the only one that improves the situation in winter and has minimal impact during the summer. In contrast, Case 2 exacerbates the situation, increasing values by 2 µm/m3. Lastly, Case 3 leads to the worst-case scenario, adding more than 8 µm/m3 to the atmosphere per meter. These effects are more pronounced in winter compared to summer. It is important to note that a correction was applied to fit the values accurately.
The second urban canyon within LCZ 2 is situated along a diagonal street (see
Figure 10). It has an aspect ratio of 0.7 with an average building height of 14 m (16.5 m on the north side and 10 m on the south side), while the street and sidewalks together occupy 21 m. Notably, the sidewalks are more extensive on the southern side, closer to the area of heaviest traffic (see
Figure 12). In terms of the analyzed parameters, variations within this canyon are milder than those observed in the previous site. The UTCI experiences changes of less than 1 °C, with the highest values on the northern building whose facade faces south. NOx concentrations in this canyon are considerably lower than in other areas, and they exhibit no significant seasonal variation, ranging from a minimum of 16 µm/m
3 to a maximum of 19 µm/m
3.
When assessing the effects of the GI cases,
Figure 12 demonstrates that hedges notably reduce UTCI. Green walls have a more localized impact, while trees contribute to a general improvement in comfort within the canyons. Regarding the impact on NOx concentrations, Case 1 marginally decreases air quality within the area. In contrast, the other two cases present less favorable scenarios. Case 2 results in an increase of over 3 µm/m
3 in concentrations, and Case 3 shows an increase of 5 µm/m
3 or more. Both cases exhibit higher values in the center of the street, which suggests a concentration point near the source, likely due to traffic emissions.
3.5.2. LCZ 6
In the LCZ 6 cases, two intersections were selected due to their high NOx concentration levels. The first intersection is located to the south of the area, with an aspect ratio of 0.4. Both sides of the intersection feature buildings of the same height (12 m), while the intersection itself spans 25 m. The UTCI varies by 1.5 °C, with higher values observed on both building facades, particularly the one facing south. Notably, there is a significant improvement in comfort provided by the hedge on the south sidewalk, which offers shade from the building. Regarding NOx concentrations, both seasons exhibit a similar pattern: concentrations increase at the street center and decrease on the sidewalks, especially on the south side. Summer values surpass those of winter.
This intersection consistently demonstrates an improvement over the Base Case, except for the winter concentrations in Case 2. Upon closer examination, Case 1 reveals a more significant impact during winter, especially on the north side. This effect transitions to a general improvement, though with a lower magnitude, during summer. Simultaneously, UTCI shows an enhancement of 0.5 °C, except on the south sidewalks, where it results in increased discomfort. Conversely, Case 2 exhibits a more pronounced influence, with UTCI decreasing by over 0.5 °C. The effect on NOx concentrations changes between seasons, with a significant improvement during summer and a deterioration in conditions during winter (see
Figure 13).
Finally, the last intersection is the one north of LCZ 6 (
Figure 14). It has an aspect ratio of 0.25 with a mean building height of 11 m and a street and sidewalk area of 40 m. The UTCI presents the highest variability of all cases considered, at almost 3 °C, with lower values in the street center and higher ones near the buildings, especially the south-facing ones. Regarding the NOx concentrations, the site presents the lowest values out of all the urban canyons analyzed. Still, at the same time, with higher variability (16 µm/m
3), the focus is on the street center, but the reduction in values at the sidewalks is different, with higher values in the north than in the south.
As regards the effects generated by the considered cases, UTCI shows a general improvement that varies from 0.5 °C to more than 1 °C, and is more homogeneous in Case 2 than in Case 1. Regarding the NOx concentrations, each case presents particularities. Case 1 generates an improvement during winter, with a reduction from 2 to 5 µm/m3, except where traffic runs. At the same time, in summer, there is an increase in the concentrations (1 to 3 µm/m3), except on the north sidewalks, which present a light reduction. Finally, Case 2 shows that in both seasons, the NOx concentration increased (from 2 to 4 µm/m3), with a focus on the street center and the south of the intersection.
3.6. Discussion
The outcomes of the study underline the impact of GI interventions on air quality and thermal comfort in different urban contexts, specifically within LCZ 2 and LCZ 6 in Brindisi. In LCZ 2, characterized by a narrower urban canyon, the GI interventions, including green walls and varying tree configurations, present mixed results.
The assessment in LCZ 2 reveals that green walls (Case 1) have a positive influence, preventing the trapping of pollutants and improving air quality conditions. In contrast, interventions involving trees (Cases 2 and 3) exacerbate air pollution, particularly in winter, showcasing a complex interplay between vegetation and the local environment. The spatial distribution of NOx concentrations illustrates that green walls contribute to localized improvements, while tree interventions lead to increased pollution levels, especially along avenues. Furthermore, the Urban Thermal Comfort Index (UTCI) demonstrates that, despite the changes in air quality, all considered GI cases contribute to an improvement in thermal sensation, with Case 2 showing the most favorable conditions. However, it is noteworthy that the overall air quality in LCZ 2 does not meet WHO and EU regulations, emphasizing the need for complementary measures to address pollutant levels in the urban environment.
Moving to LCZ 6, characterized by broader urban canyons and lower traffic levels, the study considers the impact of GI interventions, such as hedges and trees, on NOx concentrations and thermal comfort. Results indicate that, unlike LCZ 2, tree interventions in LCZ 6 (Case 2) do not lead to a substantial increase in NOx concentrations, showcasing the potential positive role of trees in broader urban contexts. Hedges (Case 1) demonstrate a more localized impact on air quality but contribute to improved thermal comfort. The UTCI conditions consistently show an enhancement in comfort across all cases. Nevertheless, it is crucial to highlight that even in LCZ 6, GI interventions alone do not ensure the compliance of air quality with regulations, reinforcing the importance of holistic strategies to address pollutant levels.
Further analysis of selected urban canyons in each LCZ provides insights into the complex relationship between GI interventions, canyon geometry, and local meteorological conditions. The aspect ratio, building height, and street configurations influence the effectiveness of GI measures.
In conclusion, the study underscores the need for context-specific approaches in implementing GI interventions. While green walls prove effective in narrower canyons, the role of trees varies based on canyon geometry and traffic patterns. The study emphasizes the importance of considering multiple factors, including traffic reduction strategies, to achieve comprehensive improvements in air quality and thermal comfort. Future research should explore integrated approaches and extend the analysis to different urban settings to provide a more comprehensive understanding of the potential benefits and challenges associated with GI interventions.
4. Conclusions
The planning of green infrastructure (GI) can yield substantial societal benefits, enhancing the sustainability, health, and overall well-being of urban areas. This paper makes a valuable contribution to developing performance-based GI planning by investigating the impact of various GIs on urban air quality and comfort in Brindisi, Italy, across different Local Climate Zones (LCZ), to formulate best practice recommendations. Brindisi’s LCZ map was created using a GIS approach, demonstrating its potential in producing Level 1 LCZ maps. This map highlights the prevalence of LCZ 6 (Open low-rise) and LCZ 2 (Compact midrise) in the city, aiding in urban morphology description and facilitating communication in various fields. NOx concentration assessments were conducted in LCZ 2 and LCZ 6. These zones were modeled using ENVI-met through QGIS, with various GI interventions. The primary findings of this research are as follows:
NOx and PM10 values measured at the five weather stations reveal that Brindisi experienced low particulate matter levels in both summer and winter. However, the NOx levels occasionally exceeded WHO and EU thresholds, exposing the population to health risks like heart disease and premature death;
In LCZ 2, several primary GI interventions were implemented to assess their impact on air quality, including green walls, hedges and trees, and evergreen trees. Notably, green walls yielded the best results, though they were not as effective as previously assumed. Conversely, trees worsened air quality more than expected;
Tree models were developed to evaluate GI’s effect on air quality in LCZ 6, with results indicating improvements in air quality due to a combination of regional wind, GI, and urban canyon enhancements;
The comfort analysis revealed that GI, regardless of type, consistently improved conditions by reducing thermal sensation values (UTCI) by at least 10% and lowering thermal discomfort in selected areas;
In-depth urban canyon analysis reinforced the idea that GI enhances sidewalk comfort. However, it also highlighted that tree aspect ratios over 0.7 increased pollutant levels, indicating a higher exposure risk. Areas with lower aspect ratios exhibited varying conditions influenced by dominant regional winds.
Some limitations and avenues for future research should be acknowledged. The findings and recommendations are specific to Brindisi’s urban context. Generalizing these conclusions to other cities requires caution. Implementing GI should be carefully assessed, considering urban morphology, traffic patterns, and climatic conditions. These factors play a pivotal role in determining the positive or negative effects of GI interventions. The adverse impact of trees on air quality in certain scenarios also suggests a need for a nuanced understanding of tree species and their specific effects. Investigating the influence of different tree species on air quality could refine recommendations for urban greenery. Addressing these limitations and pursuing future research directions will contribute to a more robust and widely applicable understanding of the intricate relationship between GI, air quality, and urban well-being.
Although considering the limitations mentioned above, the present study underscores the potential of integrating LCZ methodology, GI interventions, air quality analysis, and comfort impacts as a comprehensive approach to inform and guide urban planning decisions. This holistic framework not only enhances the understanding of urban climate but also facilitates effective communication across various disciplines. LCZ maps, a key component of this approach, prove invaluable for urban climate studies and other fields related to the urban environment. Expanding on the implications for GI, the study emphasizes that its impacts extend beyond mere heat reduction, and should be subject to thorough evaluation to prevent unexpected side effects. This includes the careful consideration of specific interventions, such as green walls and tree planting, considering their effectiveness in optimizing air quality and overall urban well-being.
By exploiting the GIS approach utilized in creating Brindisi’s LCZ map, planners can gain insights into local climate zones, facilitating a more nuanced understanding of the urban context. The findings stress the importance of considering local conditions, traffic patterns, and urban morphology during the implementation of GI. For planners, this implies a strategic integration of features like green walls while maintaining awareness of the choice of tree species to ensure optimal air quality outcomes.
Further, in alignment with Goal 11 of the Sustainable Development Goals (SDGs), the study highlights the critical role of reducing private vehicle circulation. This becomes especially relevant in high-aspect-ratio urban canyons, where GI implementation could otherwise lead to negative impacts on air quality.


