
Characterization of the Thermal Behavior of Semi-Exterior Laundry Spaces in an Overheating Passivhaus Residential Building in Bilbao, Spain


Abstract
1. Introduction
2. Materials and Methods
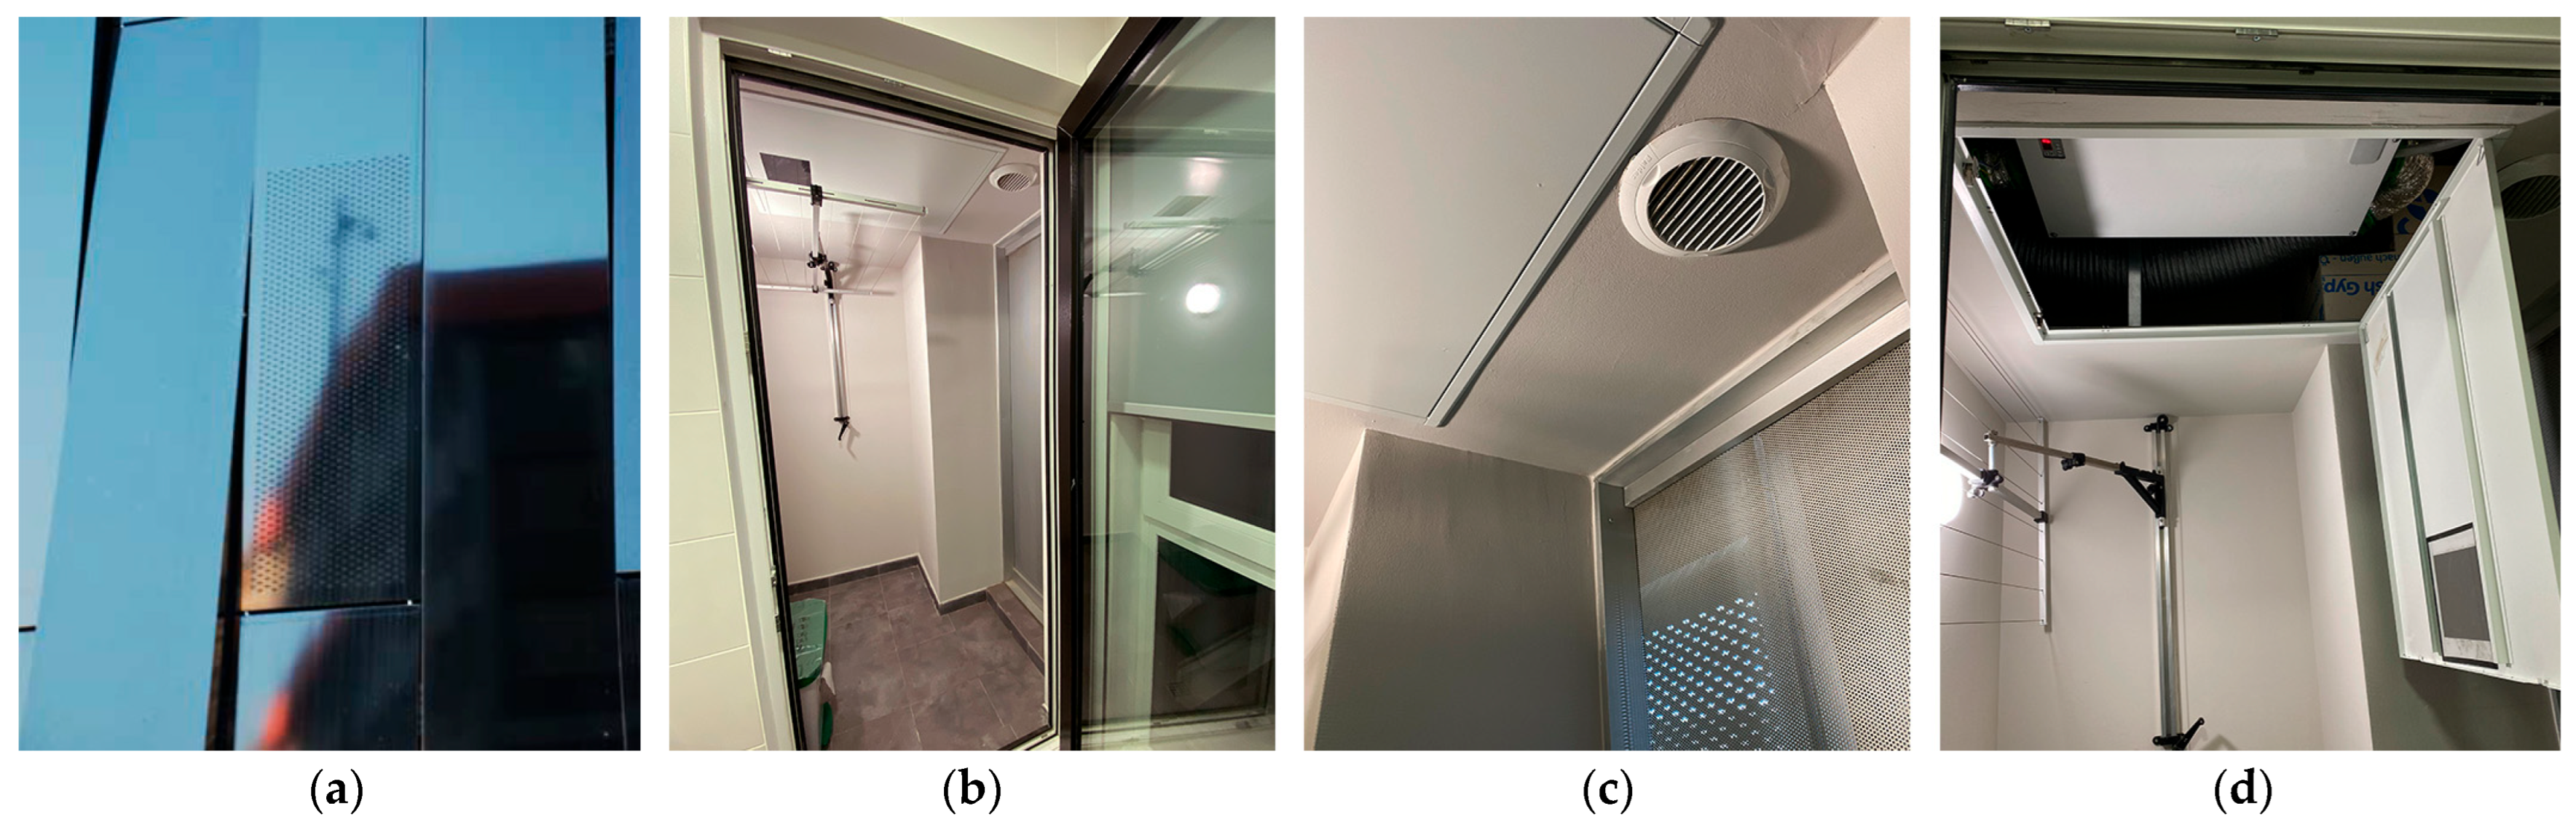
2.1. Description of the Case Study
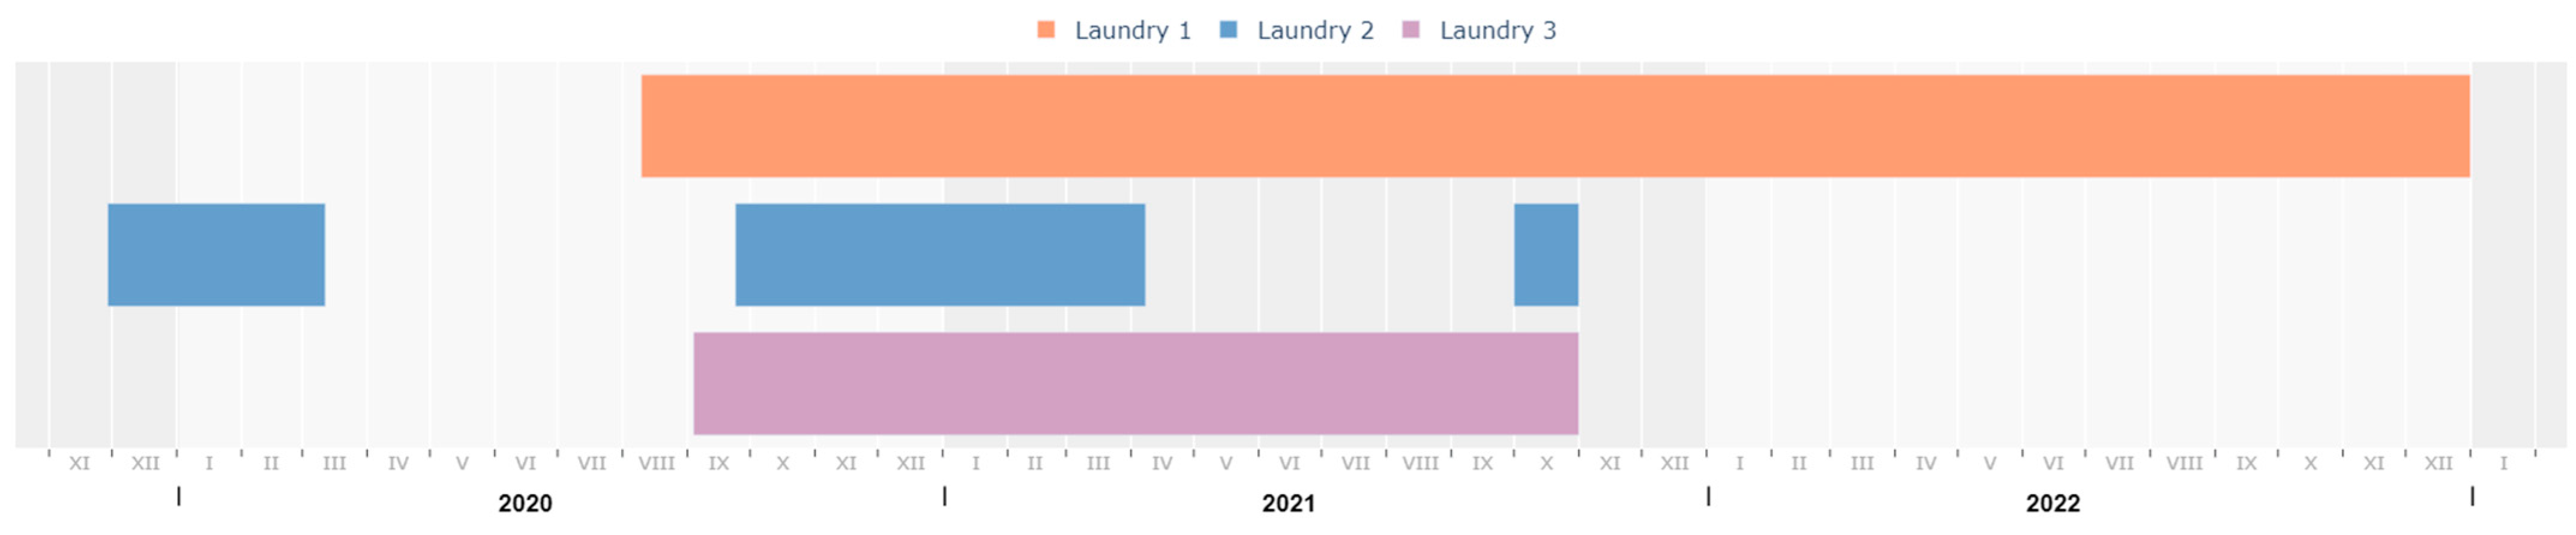
2.2. Data Sourcing and Monitoring
2.3. Data Analysis
- Proximity of the weekly maximum/minimum temperature to the maximum/minimum temperature range of the period (summer/winter).
- Proximity to the average temperature of the respective summer or winter period or to the highest/lowest weekly averages, as the case may be.
- Proximity to the average or maximum heating or cooling degree hours, as appropriate.
3. Results
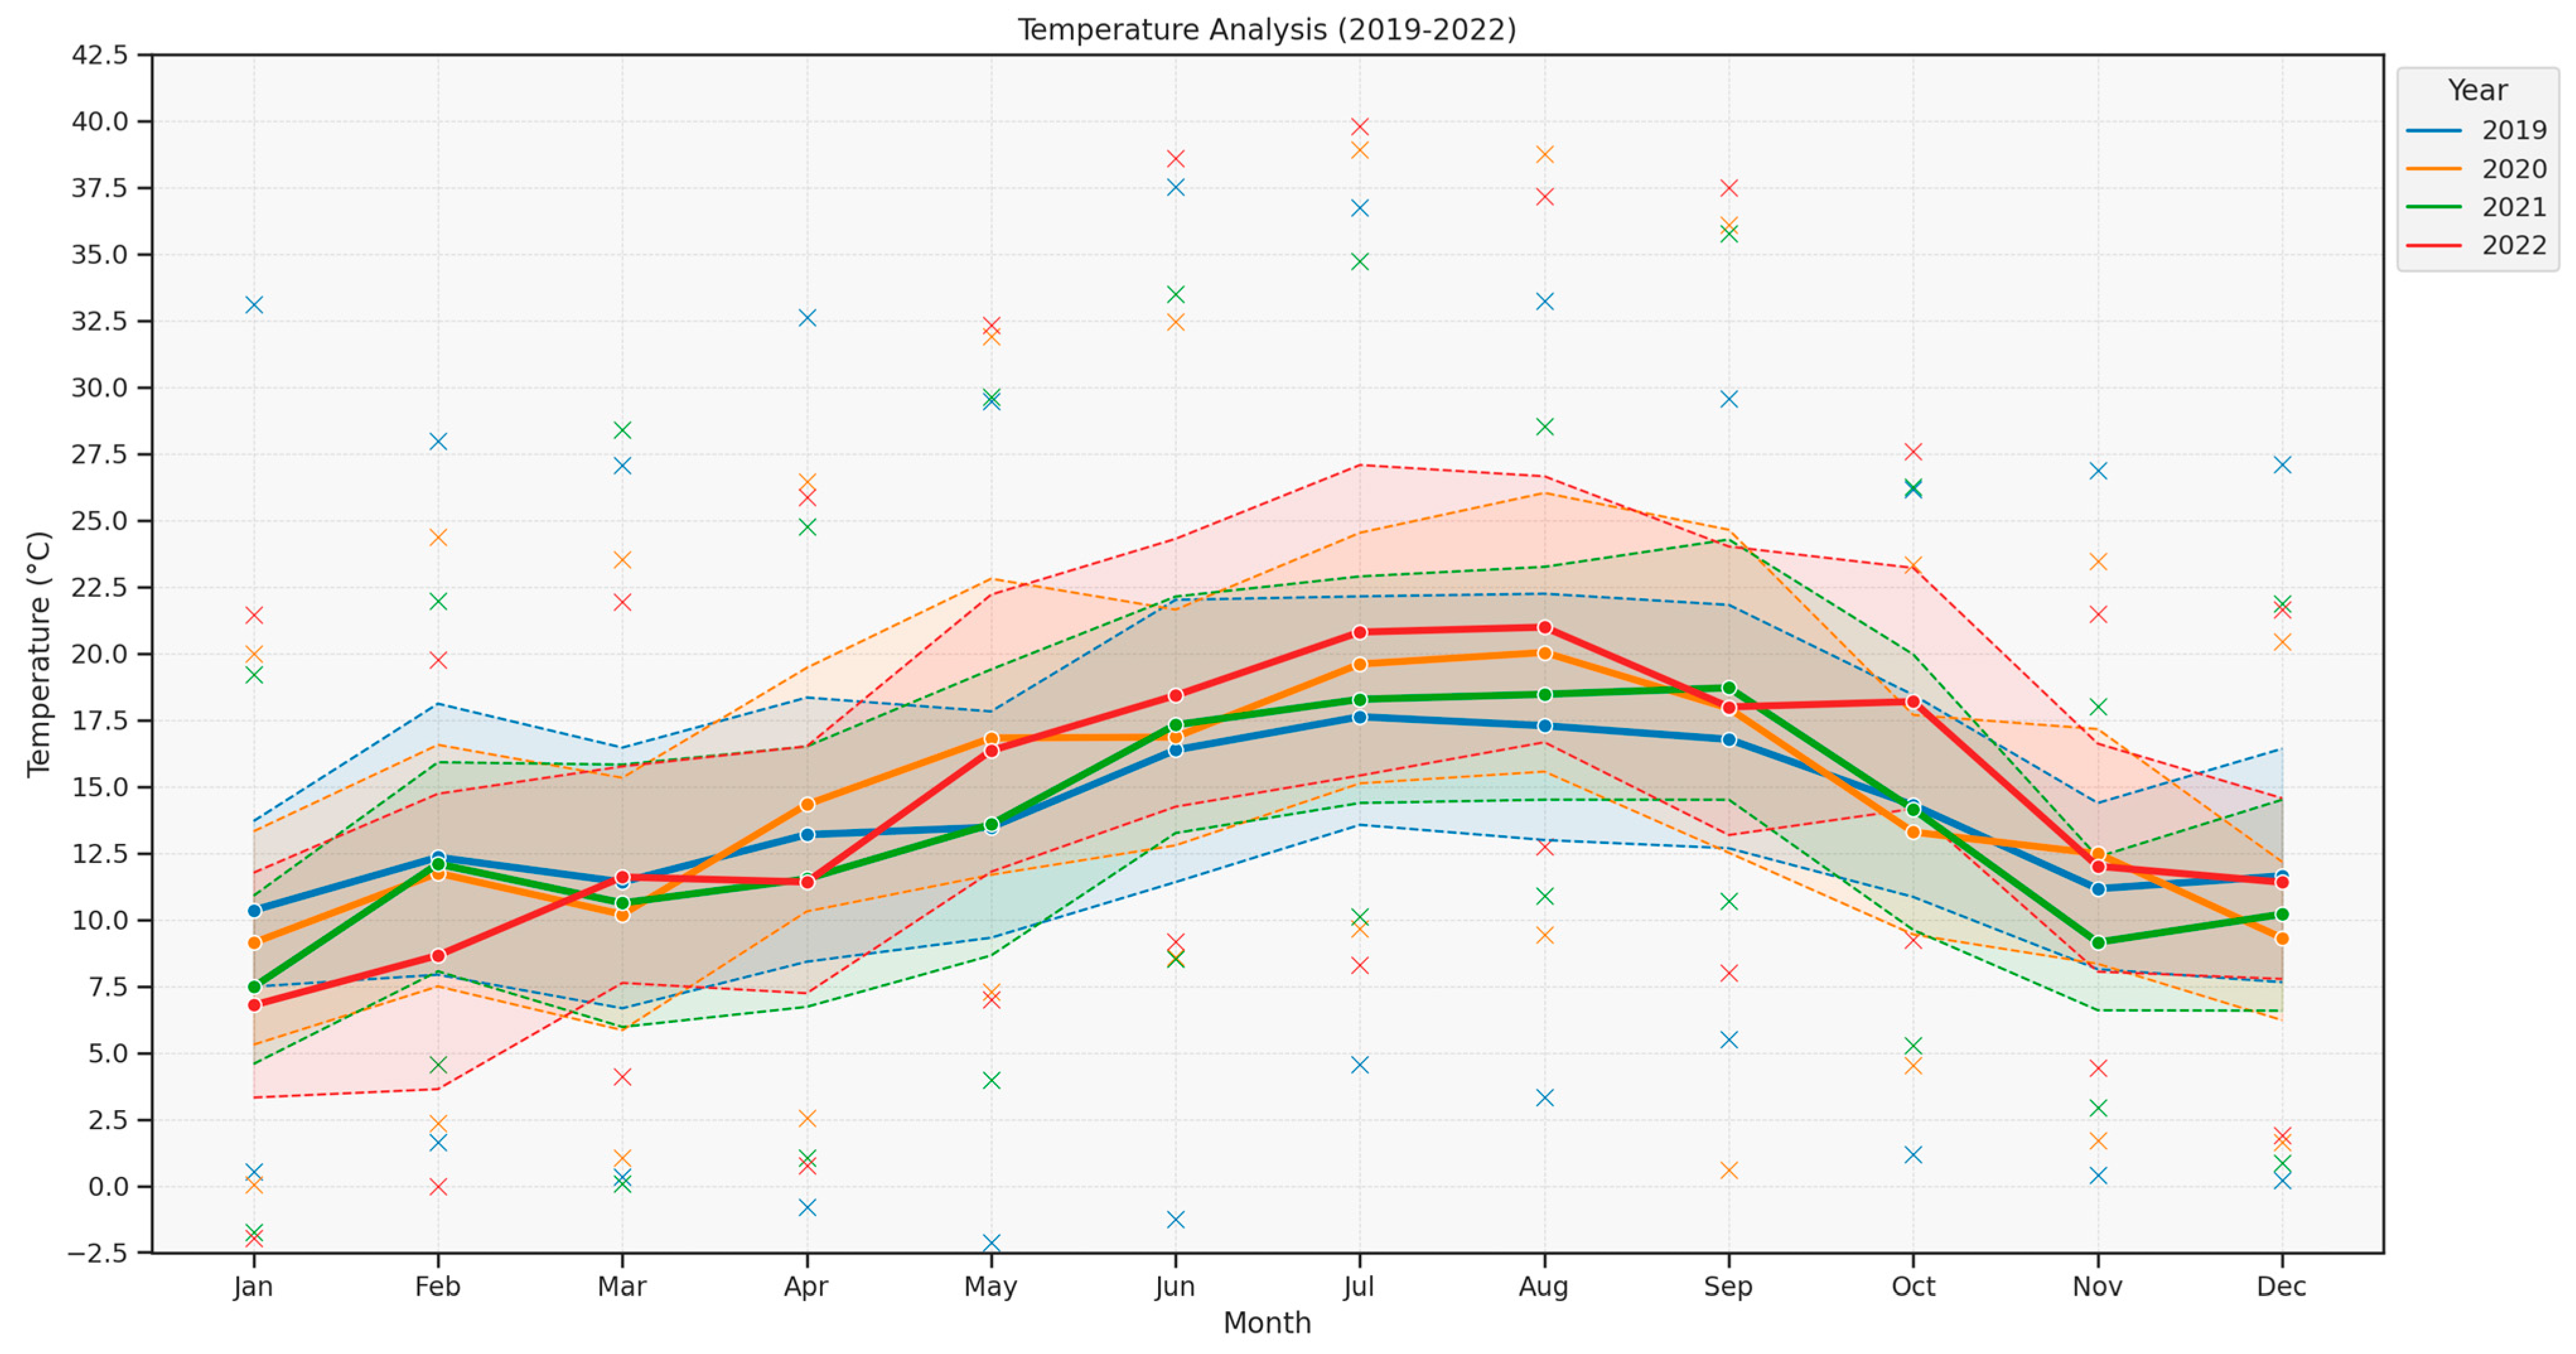
3.1. Exterior Climate Contextualisation
3.2. Results of the Exploratory Analysis
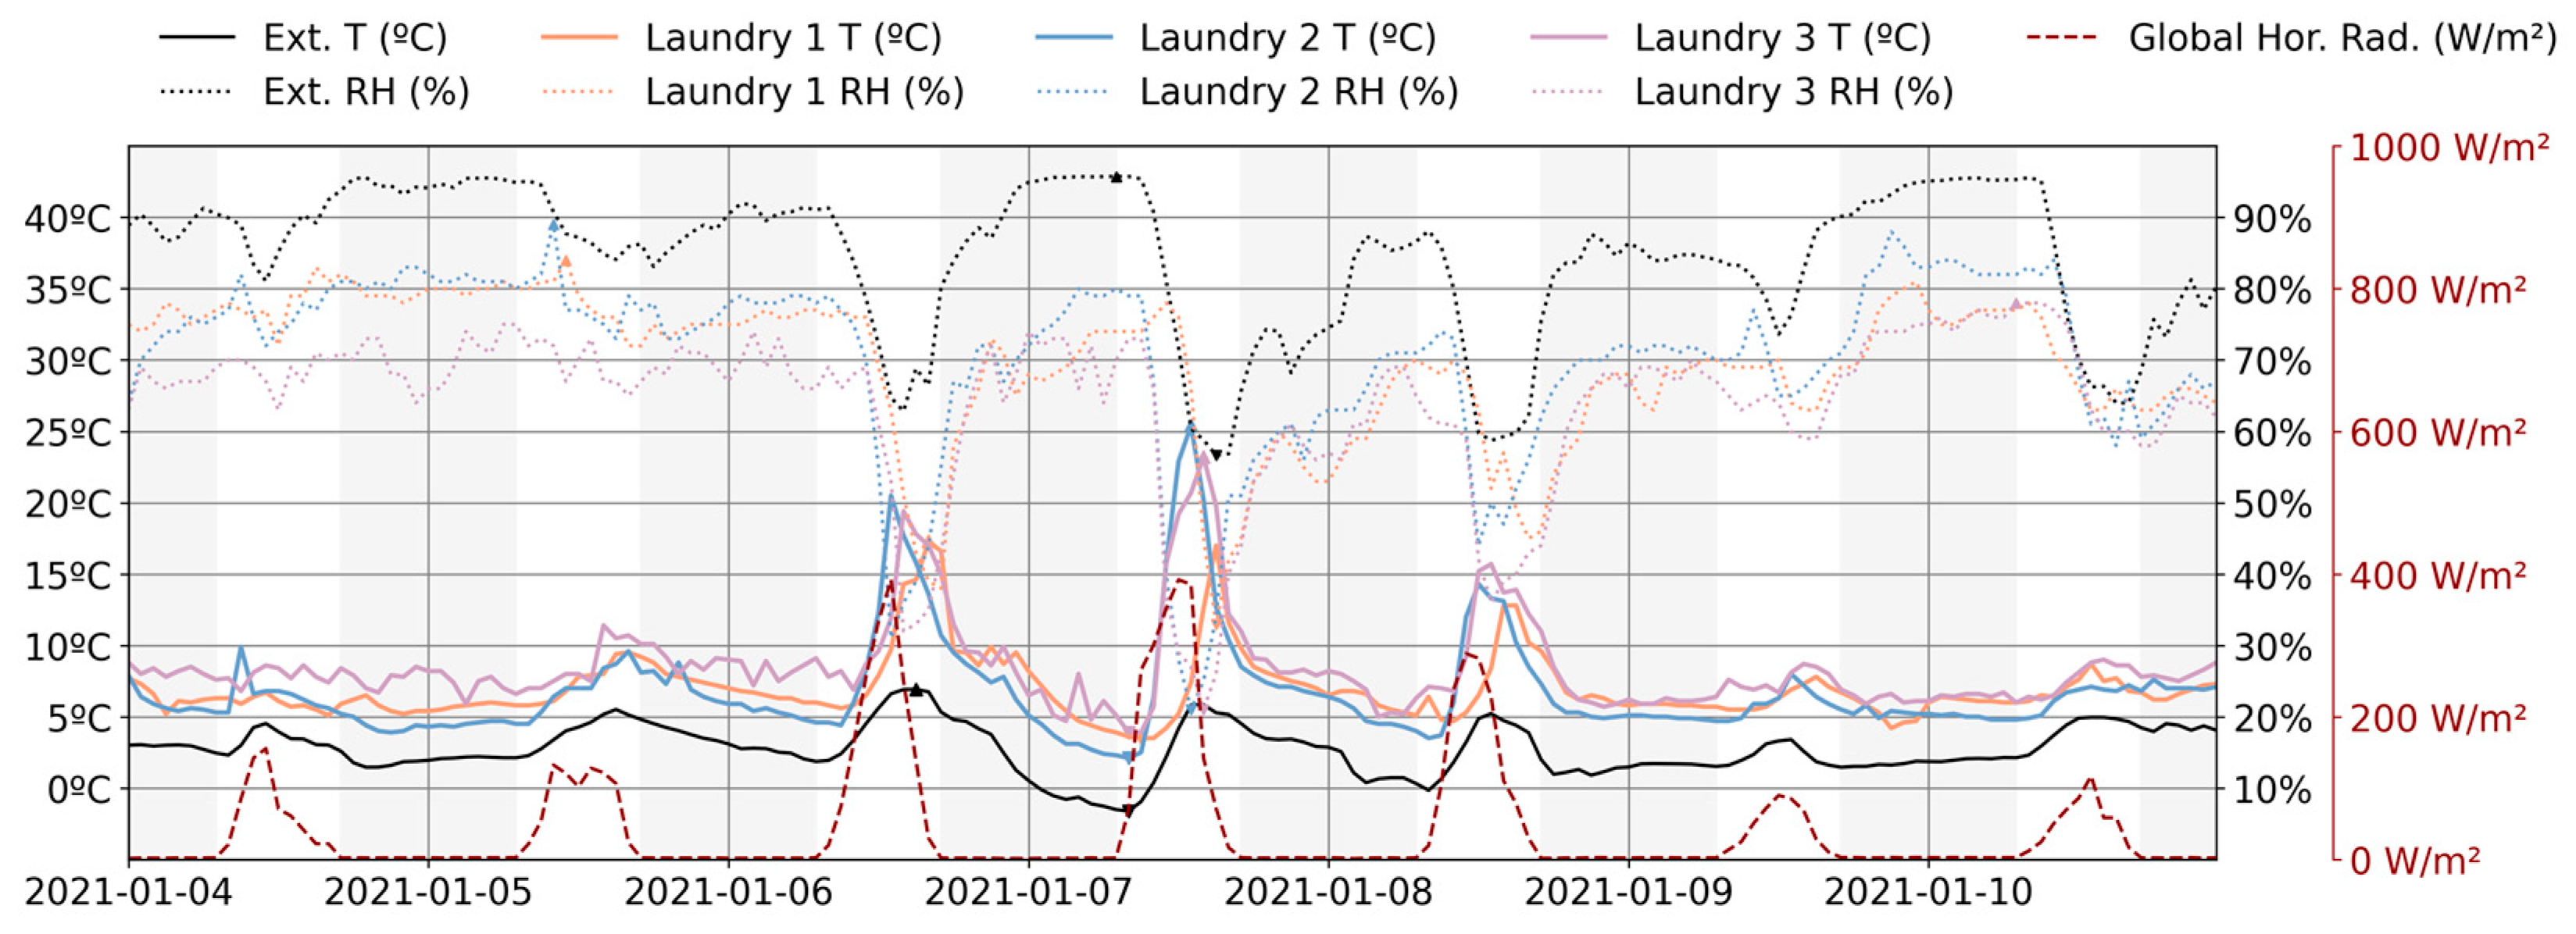
3.2.1. Week 1: A Cold Winter Week
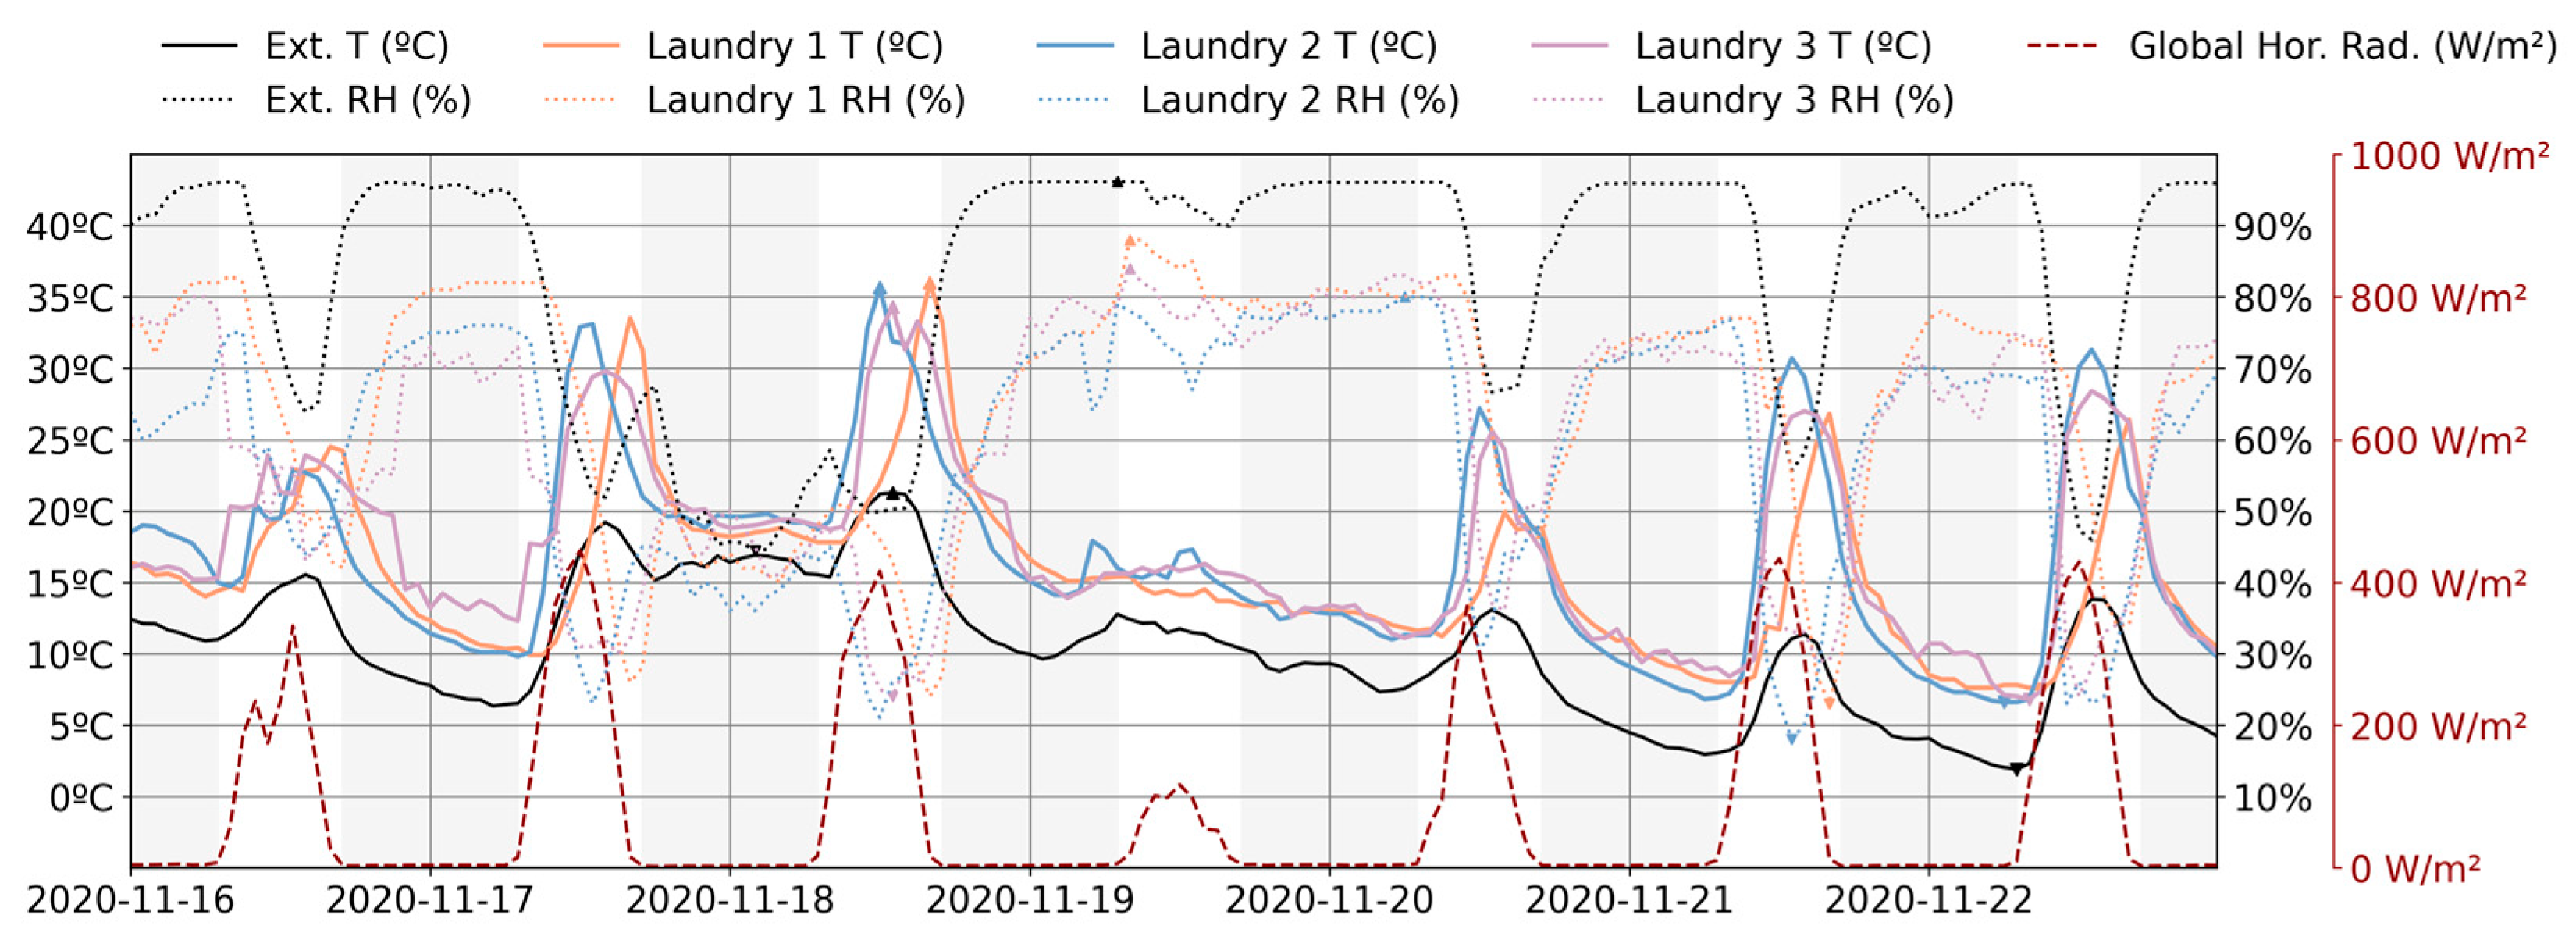
3.2.2. Week 2: A Typical Winter Week
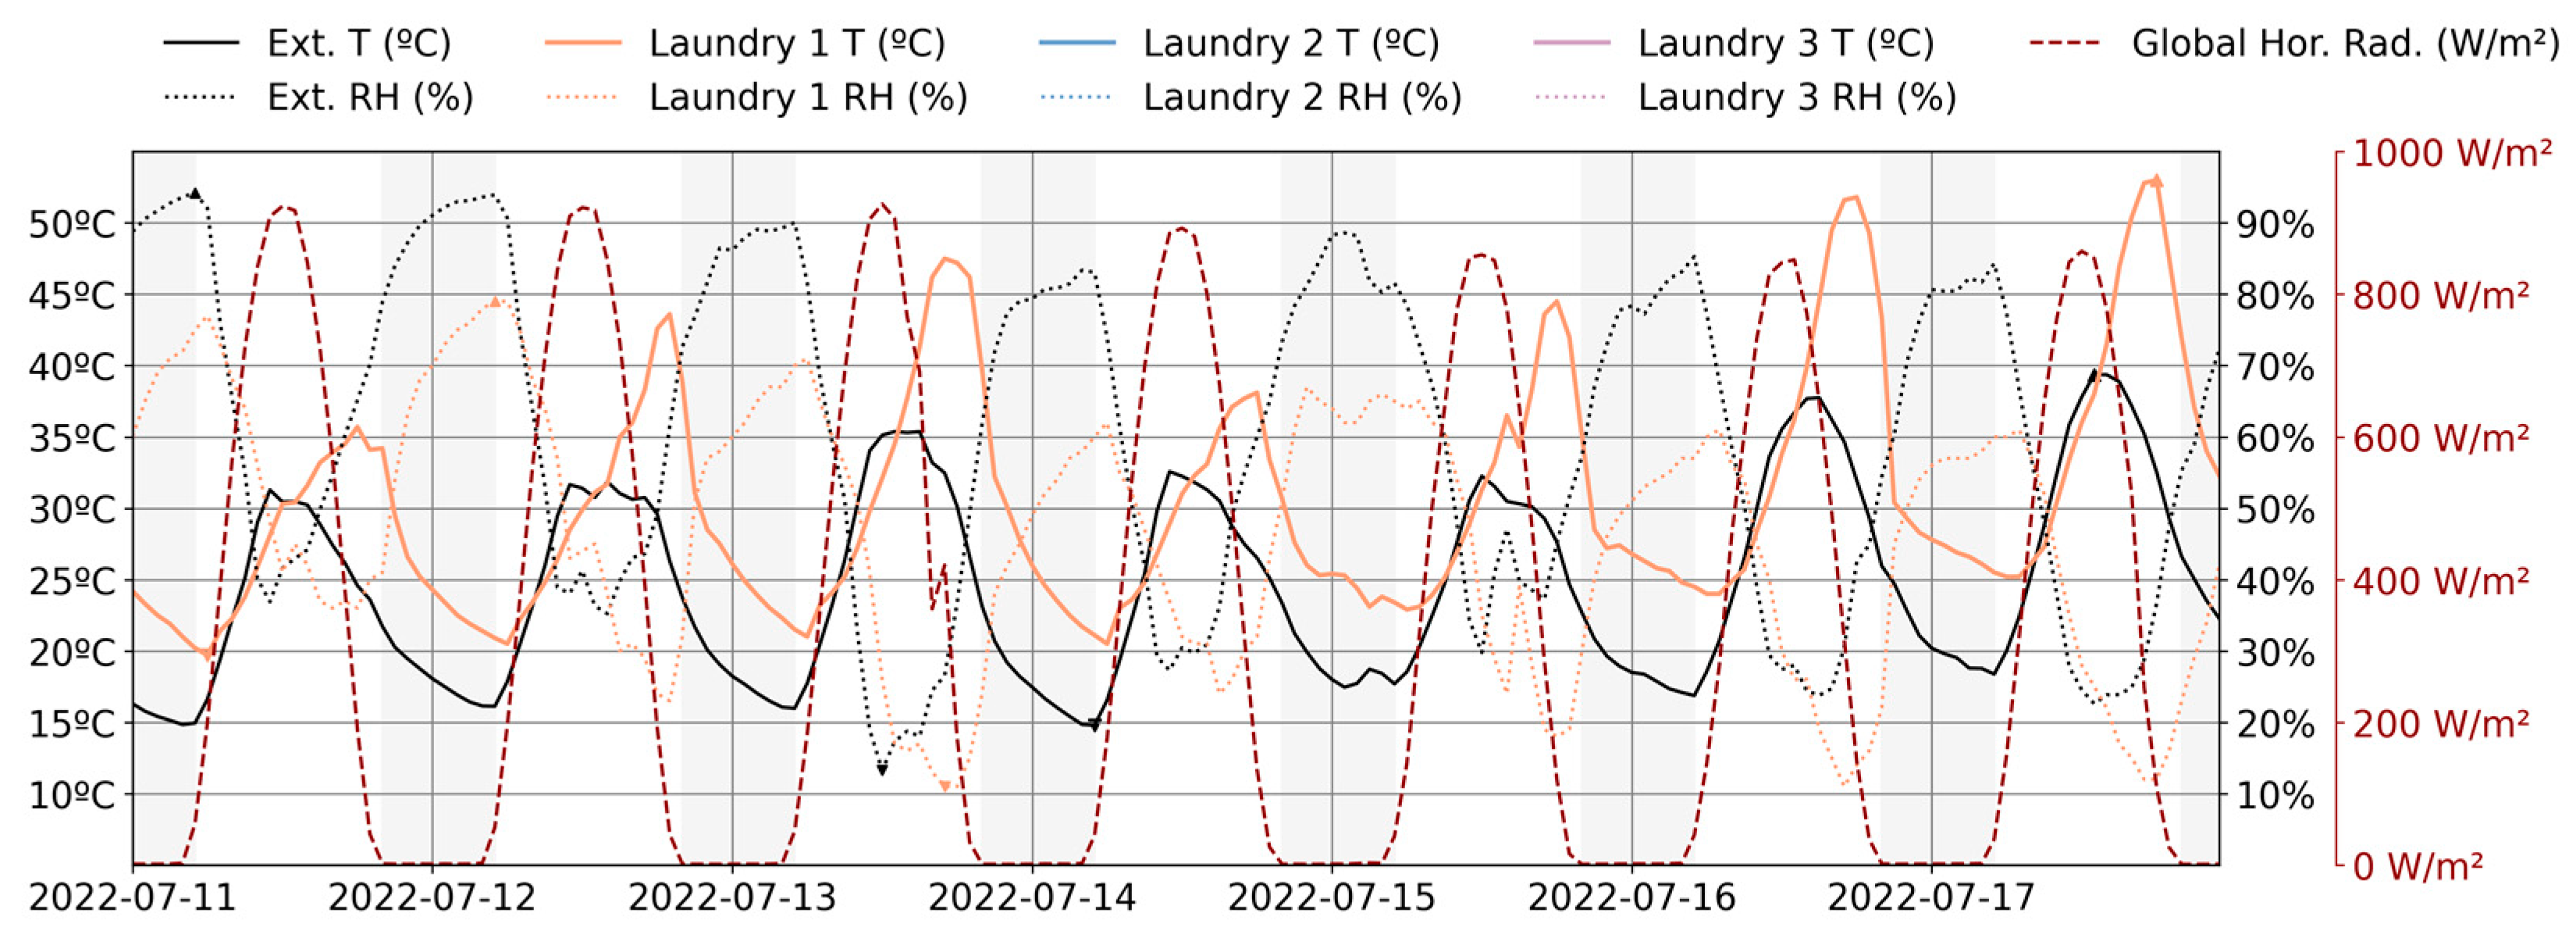
3.2.3. Week 3: A Hot Summer Week
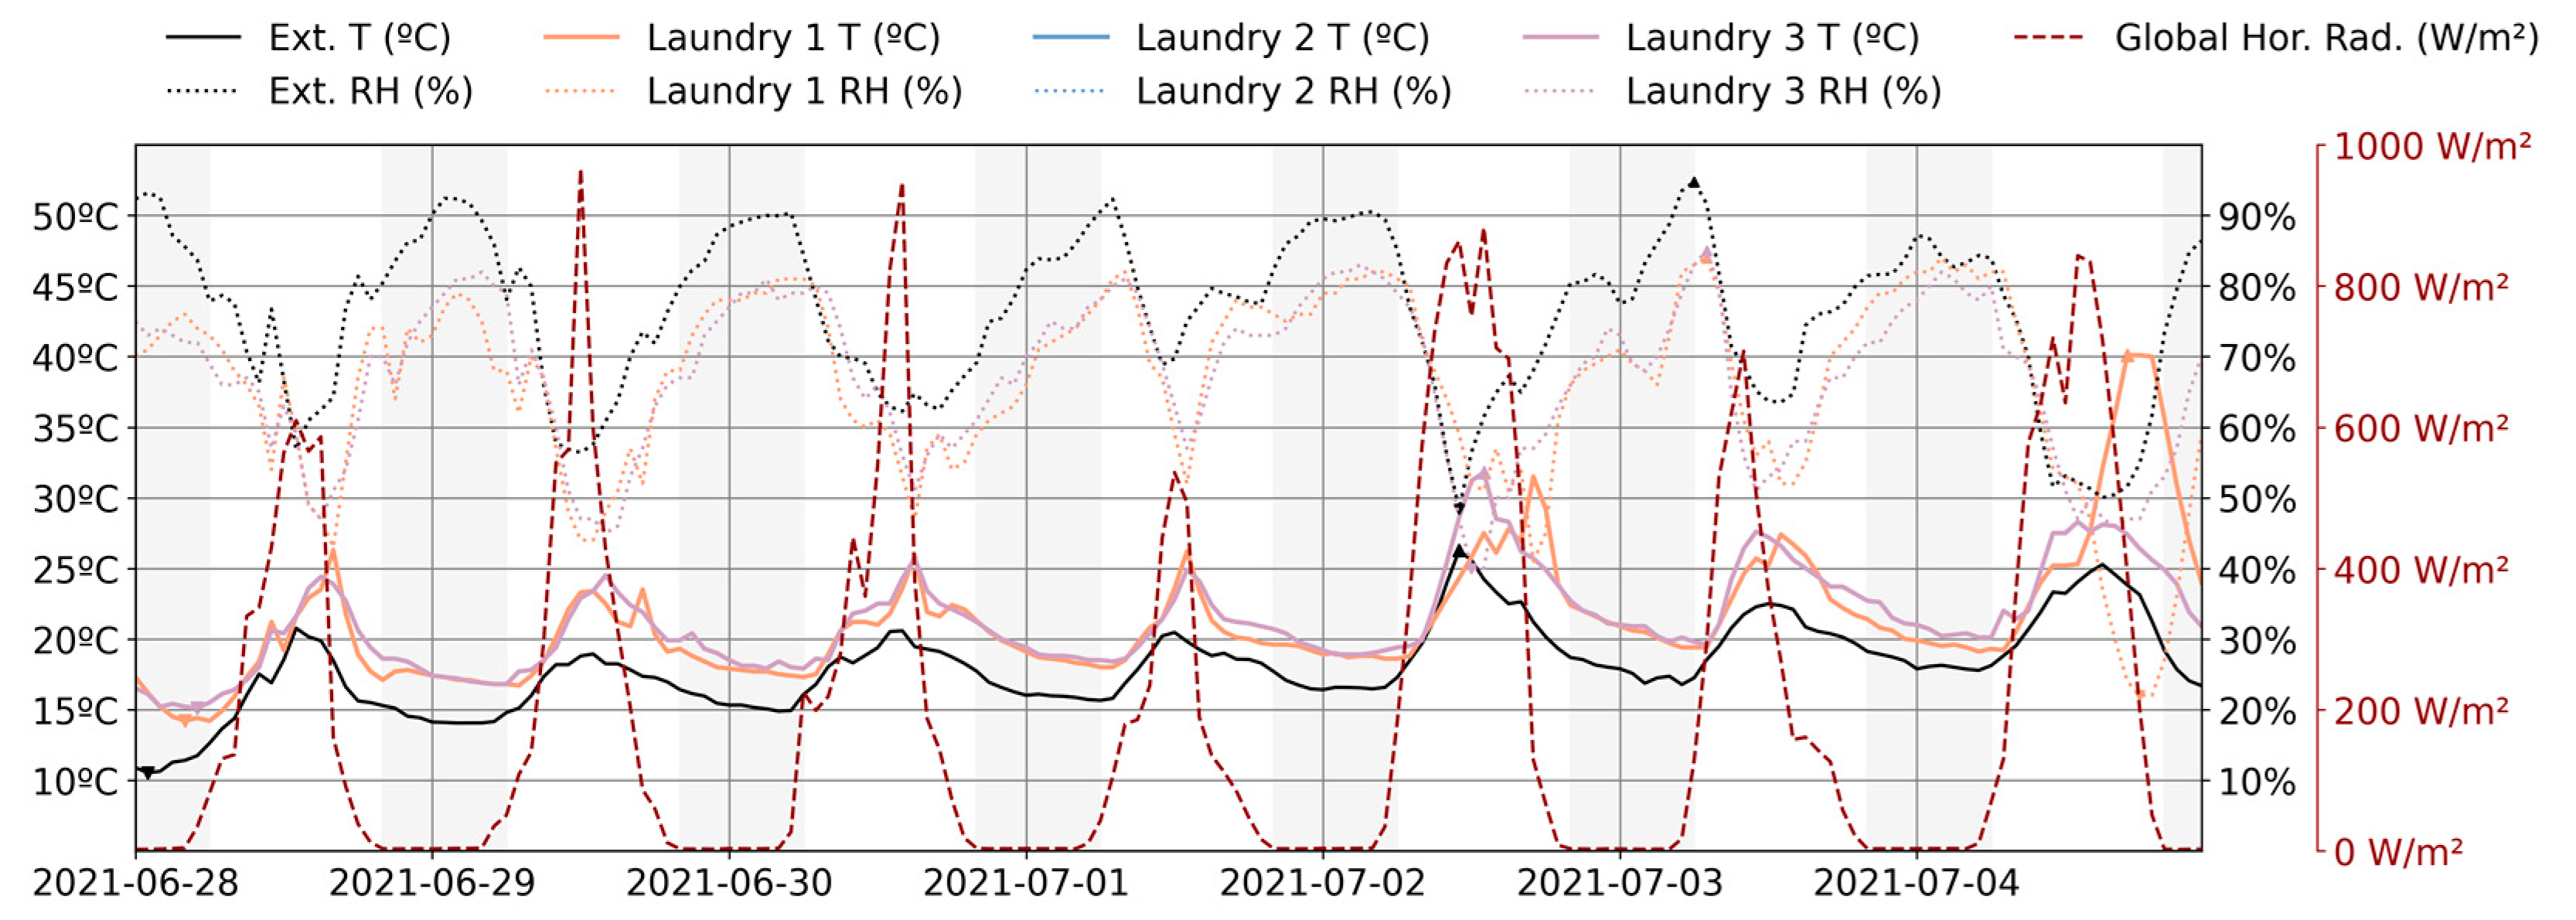
3.2.4. Week 4: A Typical Week in the Summer
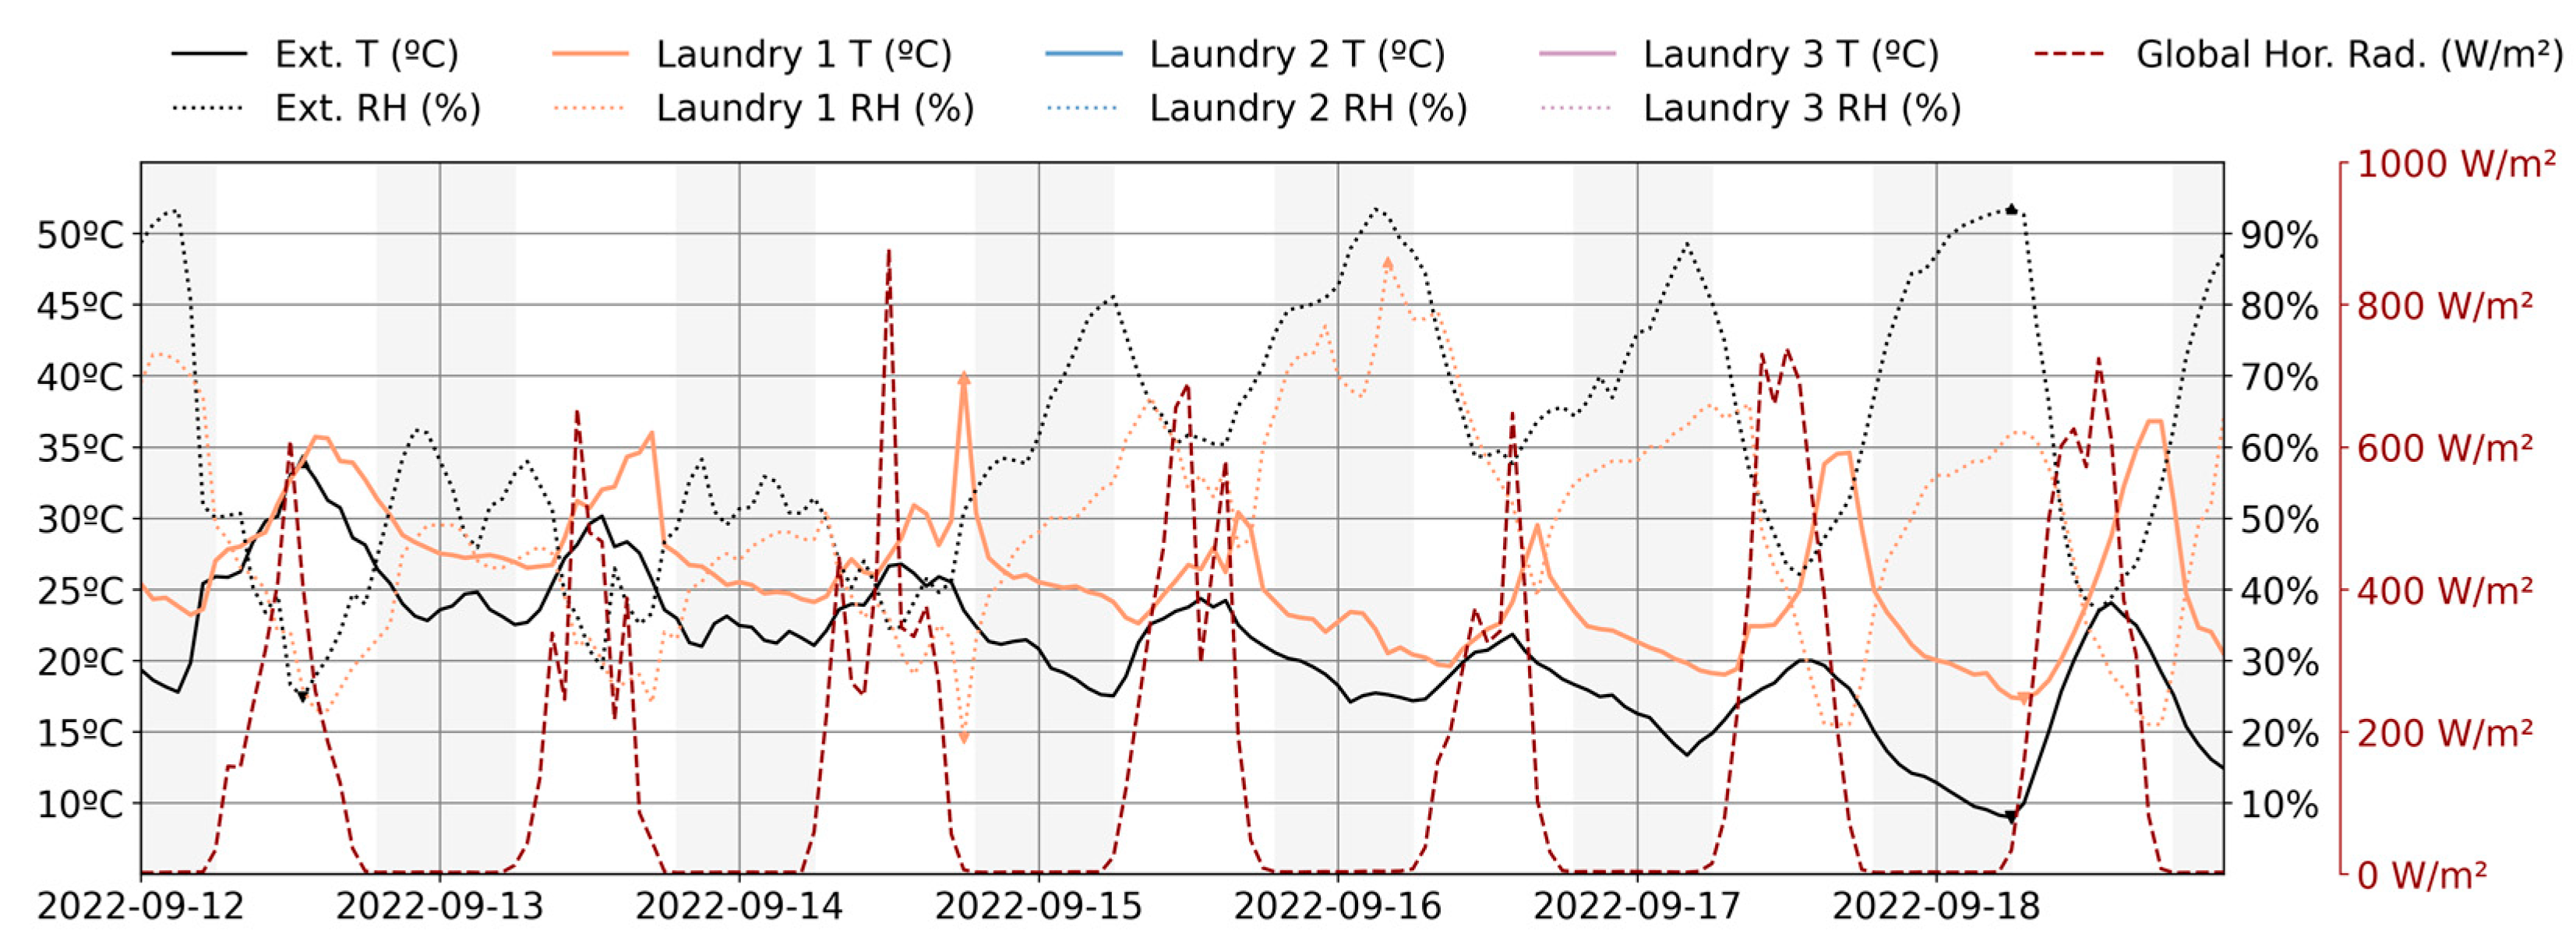
3.2.5. Week 5: A Summer Week with Limited Night Cooling
3.3. Results of the Quantitative Analysis
4. Discussion
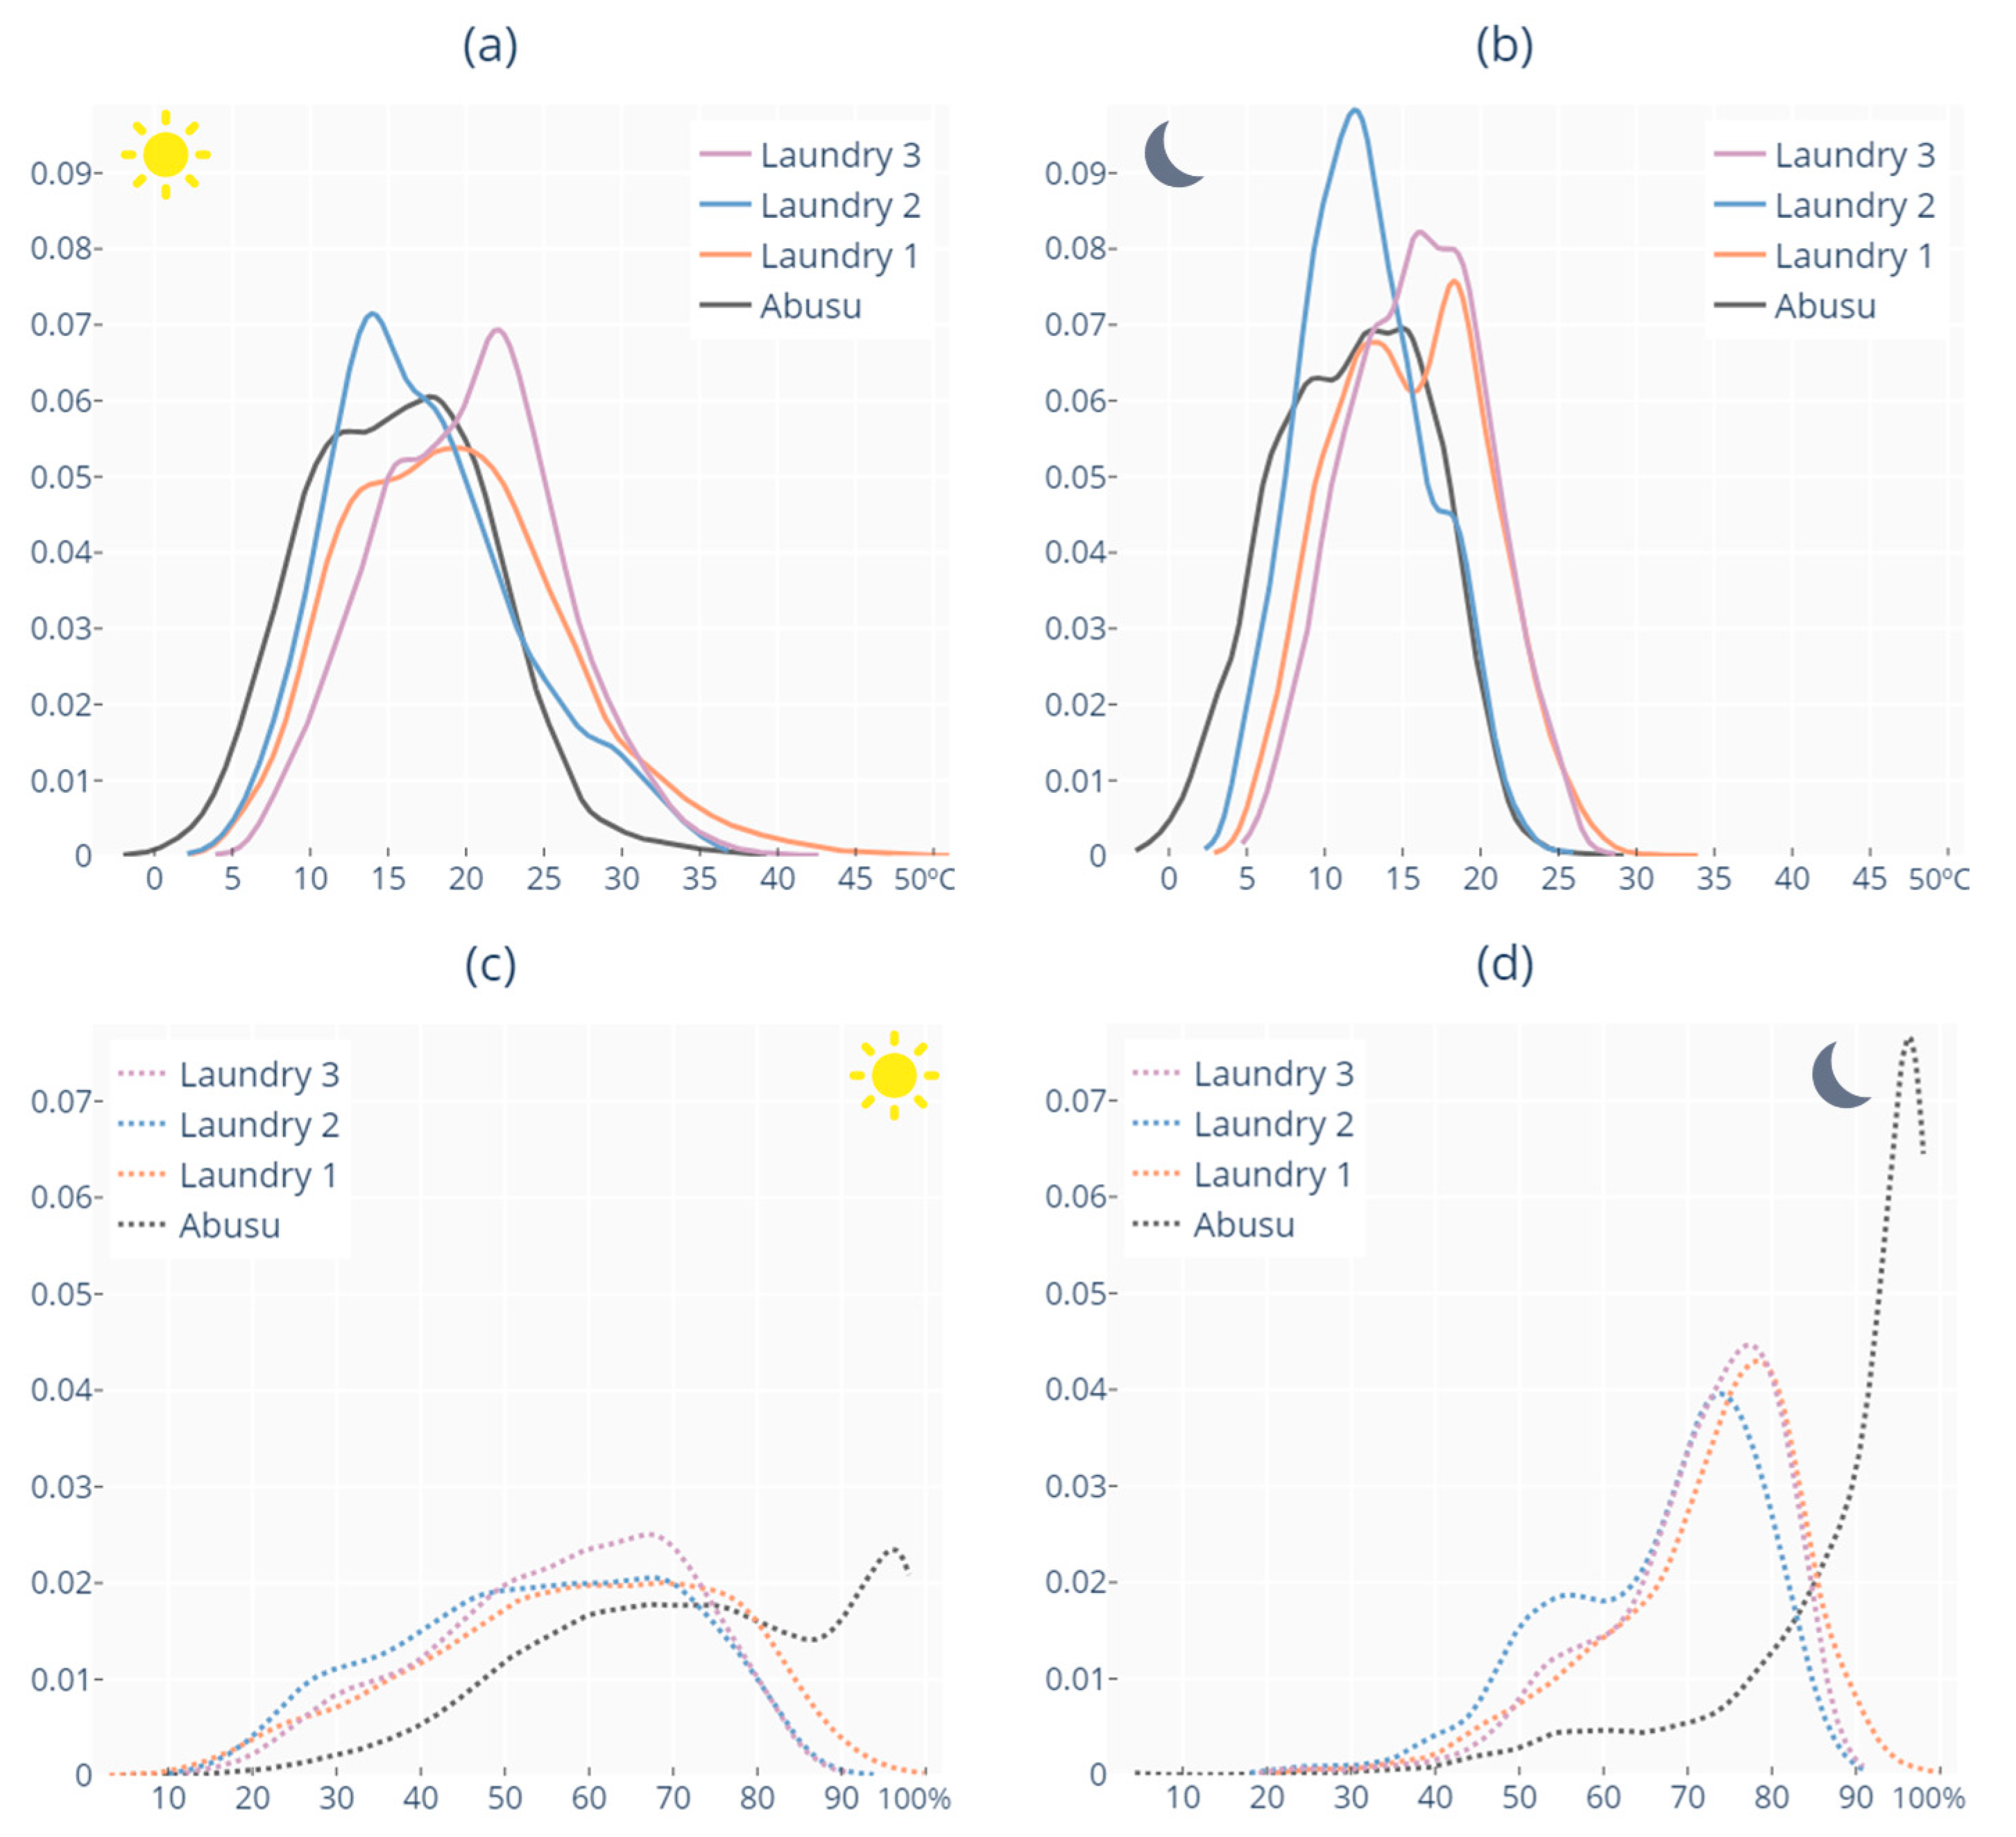
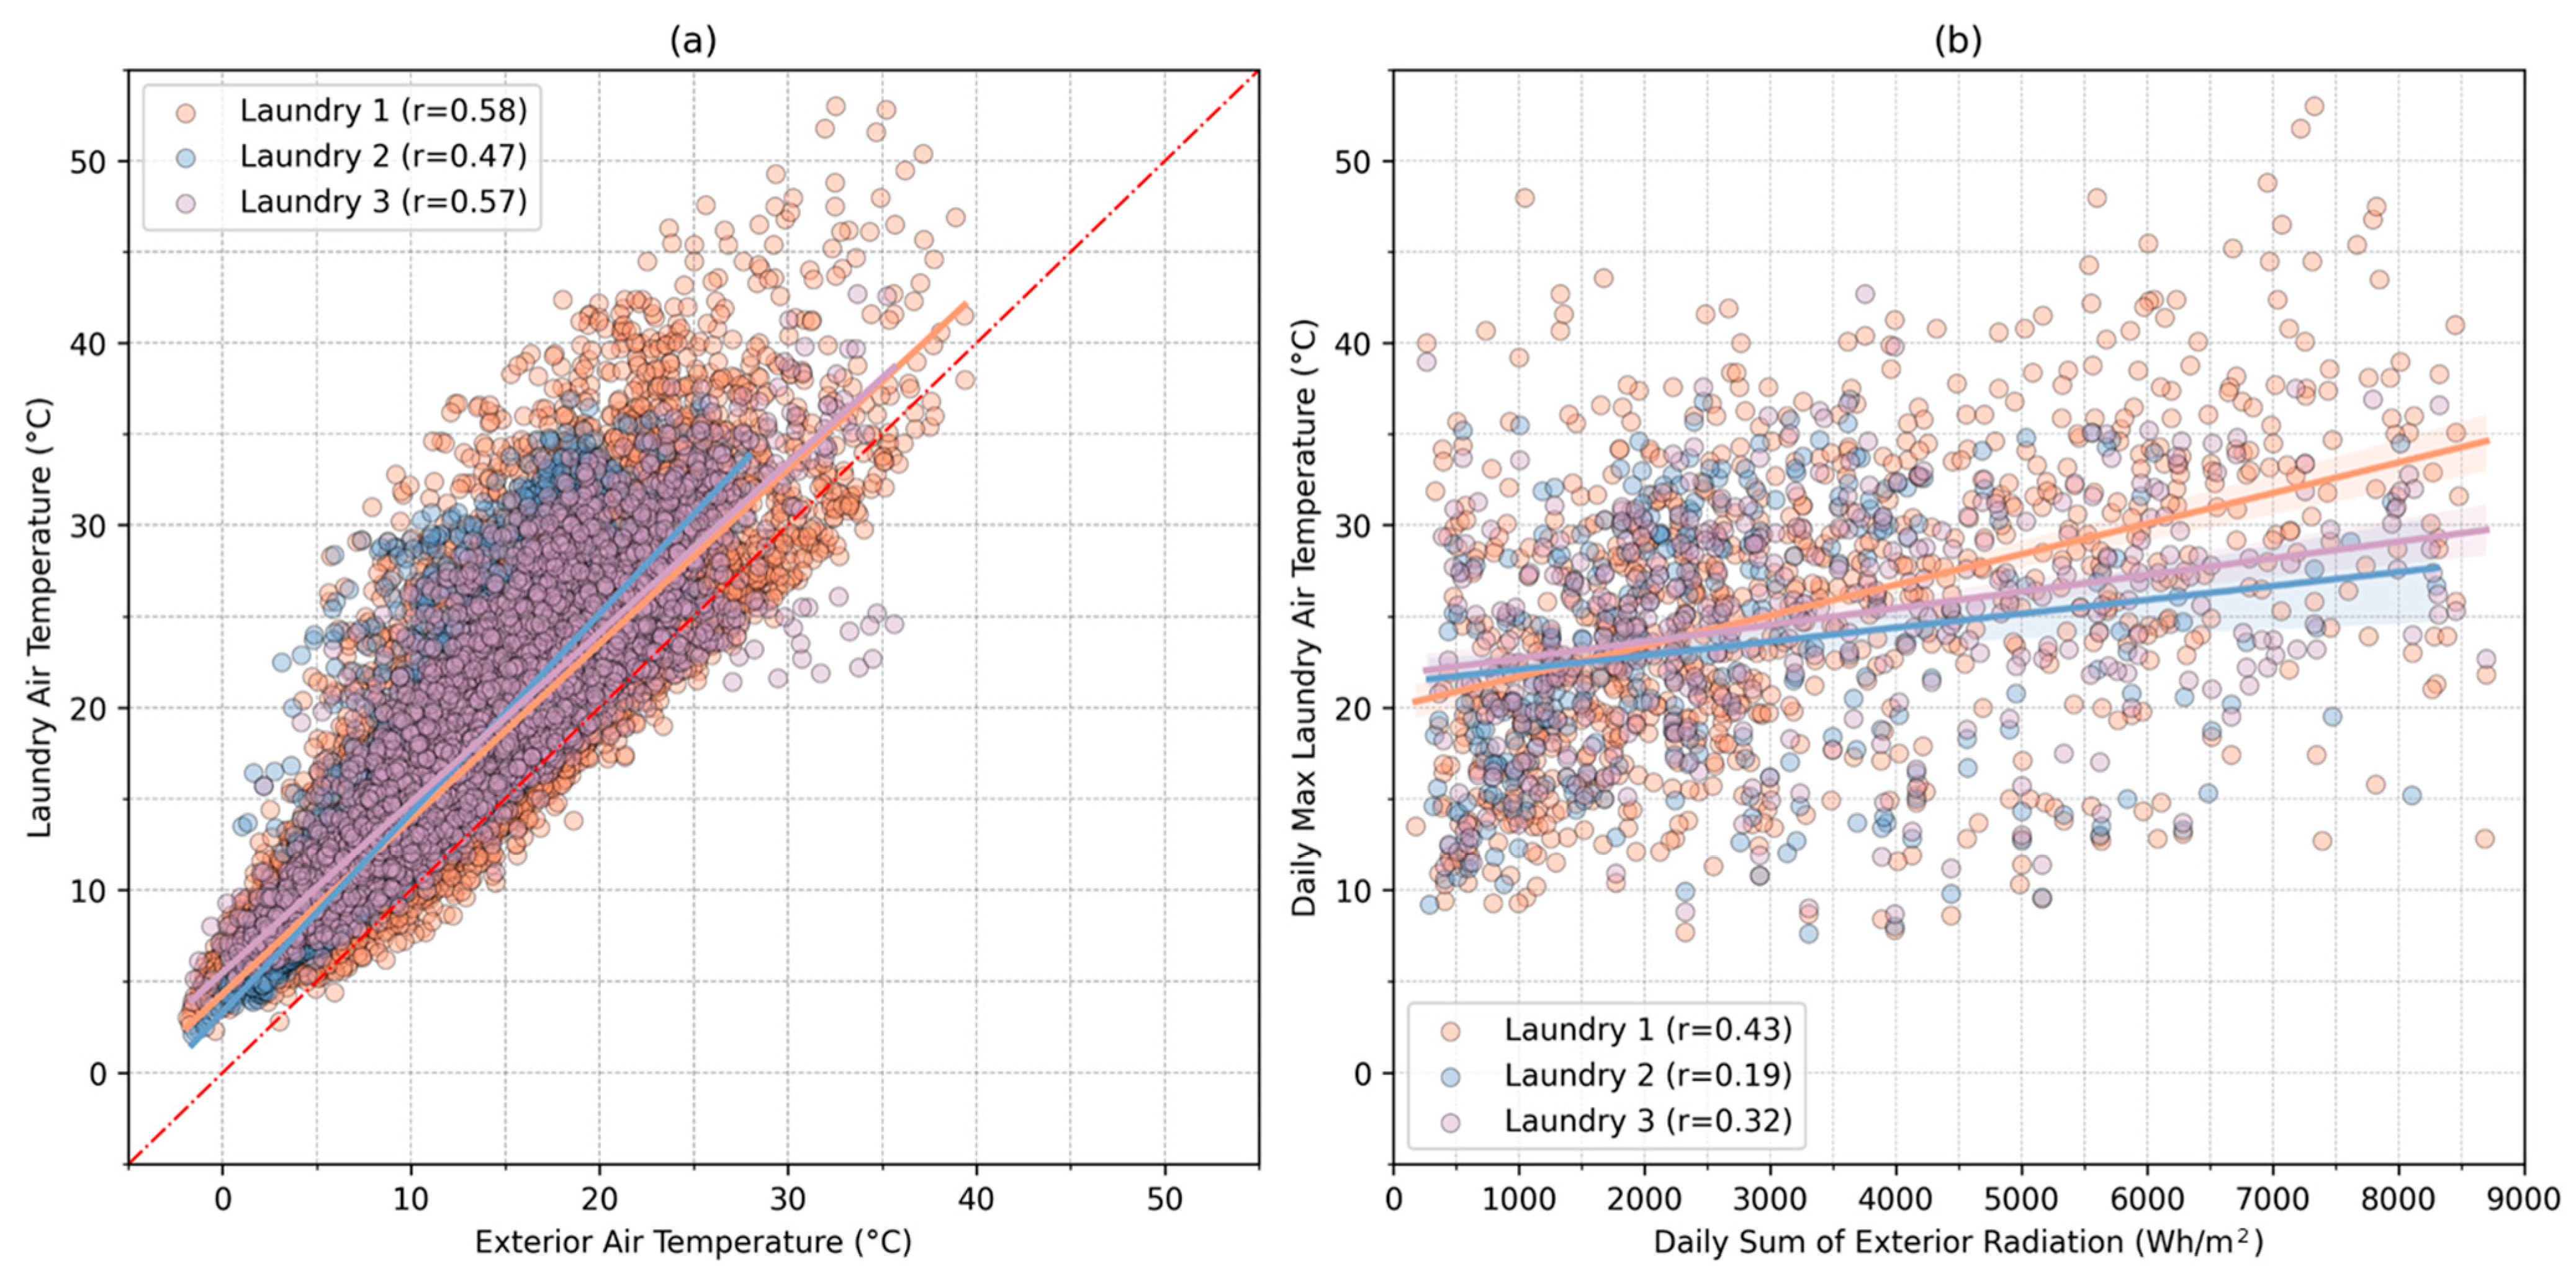
- Temperature and humidity variation with solar radiation: The temperature and relative humidity in the laundry spaces significantly deviate from the outdoor conditions in response to solar radiation. On sunny days, temperatures in the laundries rise notably above the exterior temperatures, while the relative humidity in these spaces drops below the outdoor levels. The highest laundry temperatures, thus, the lowest RH, occur under hot weather with high solar radiation.
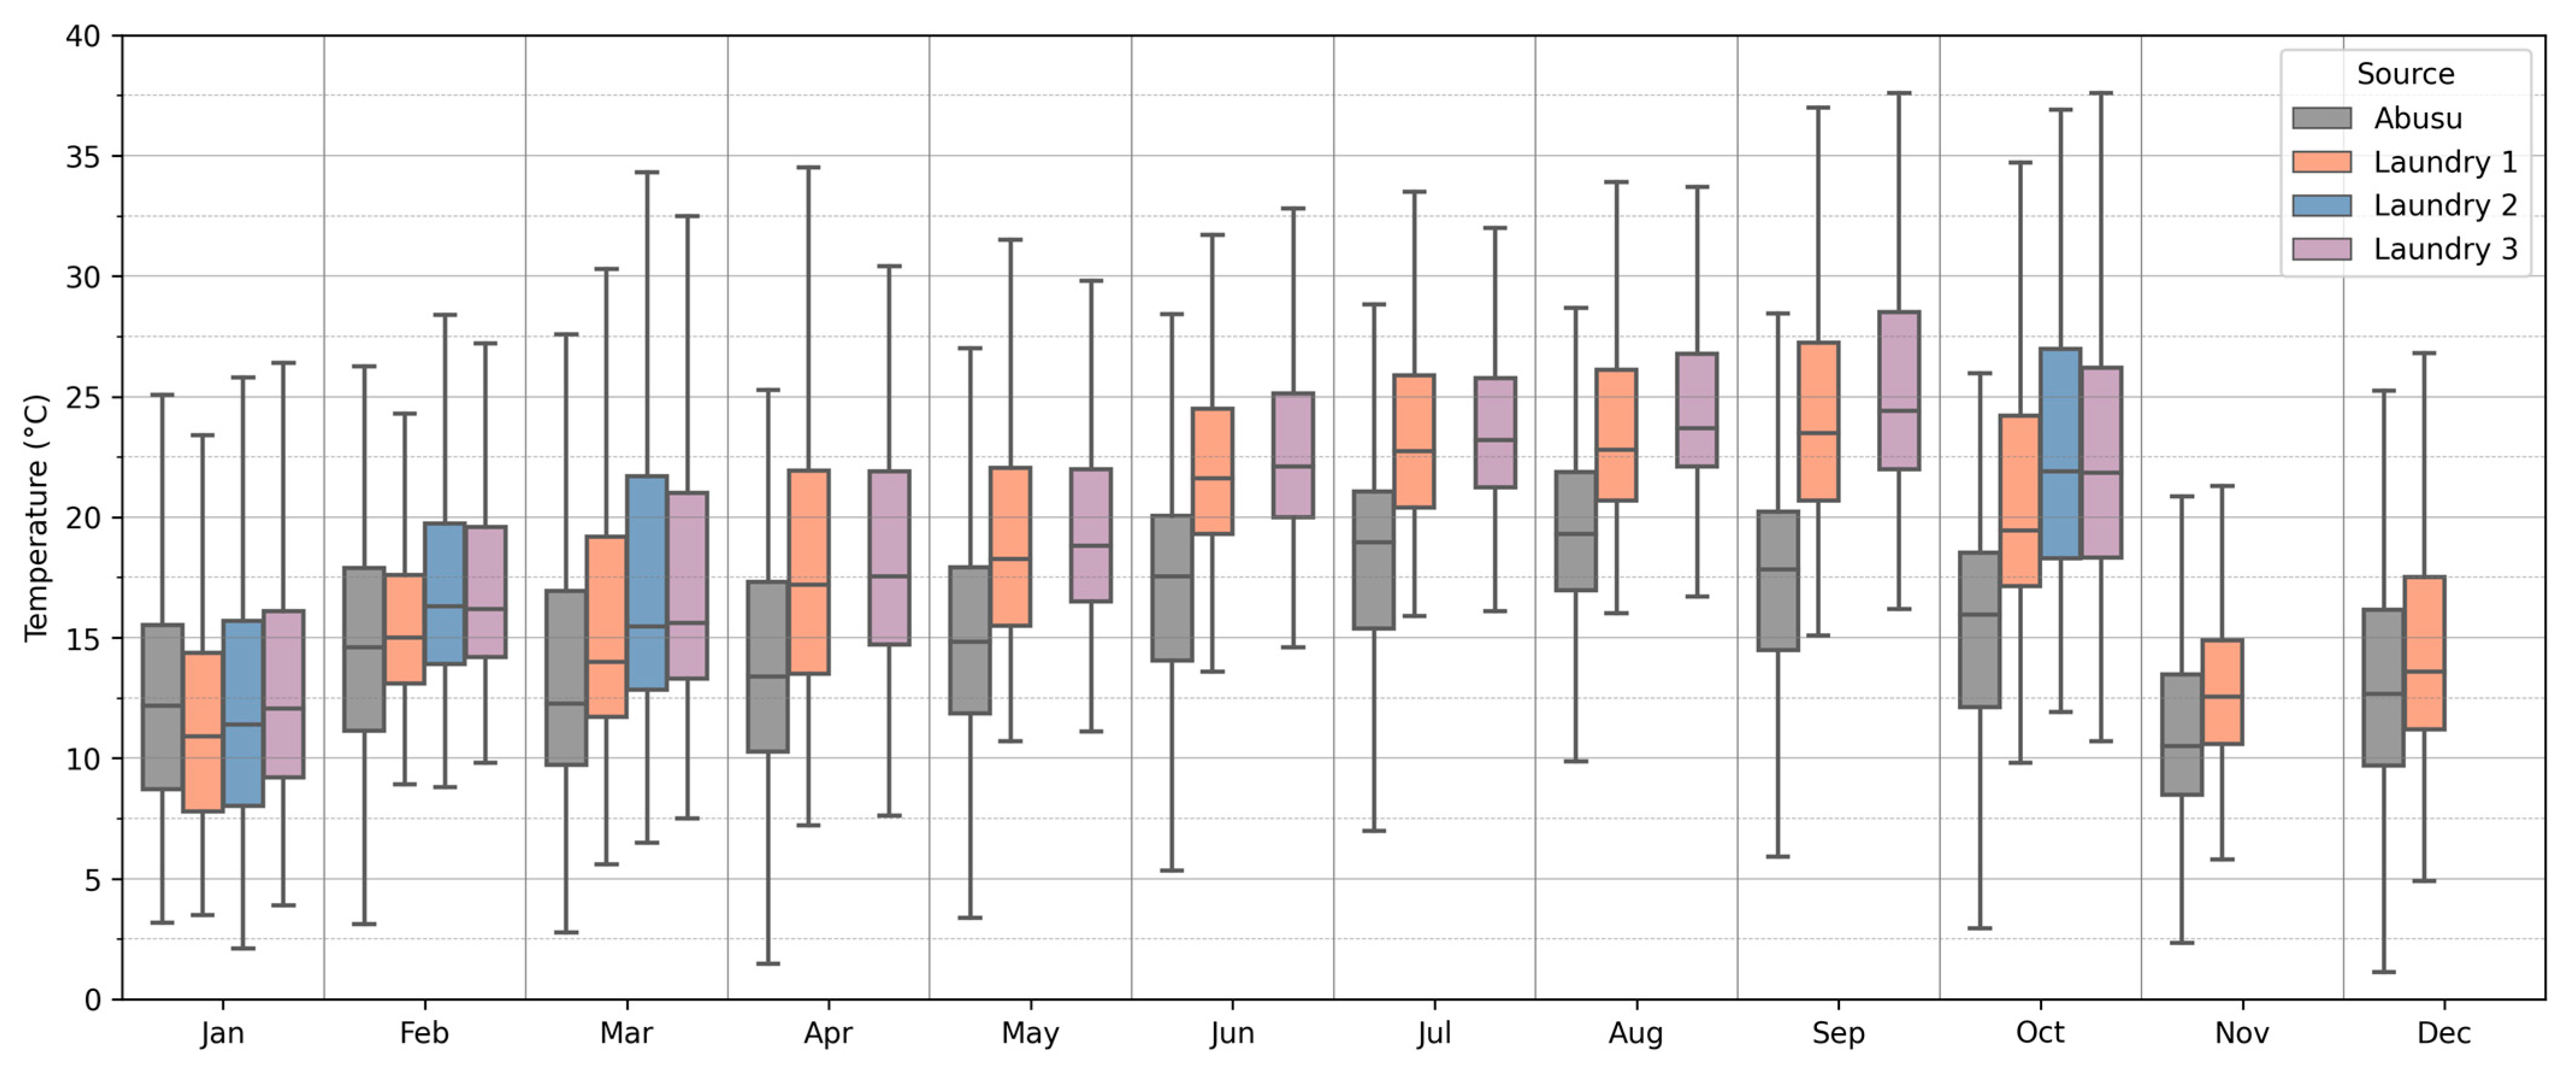
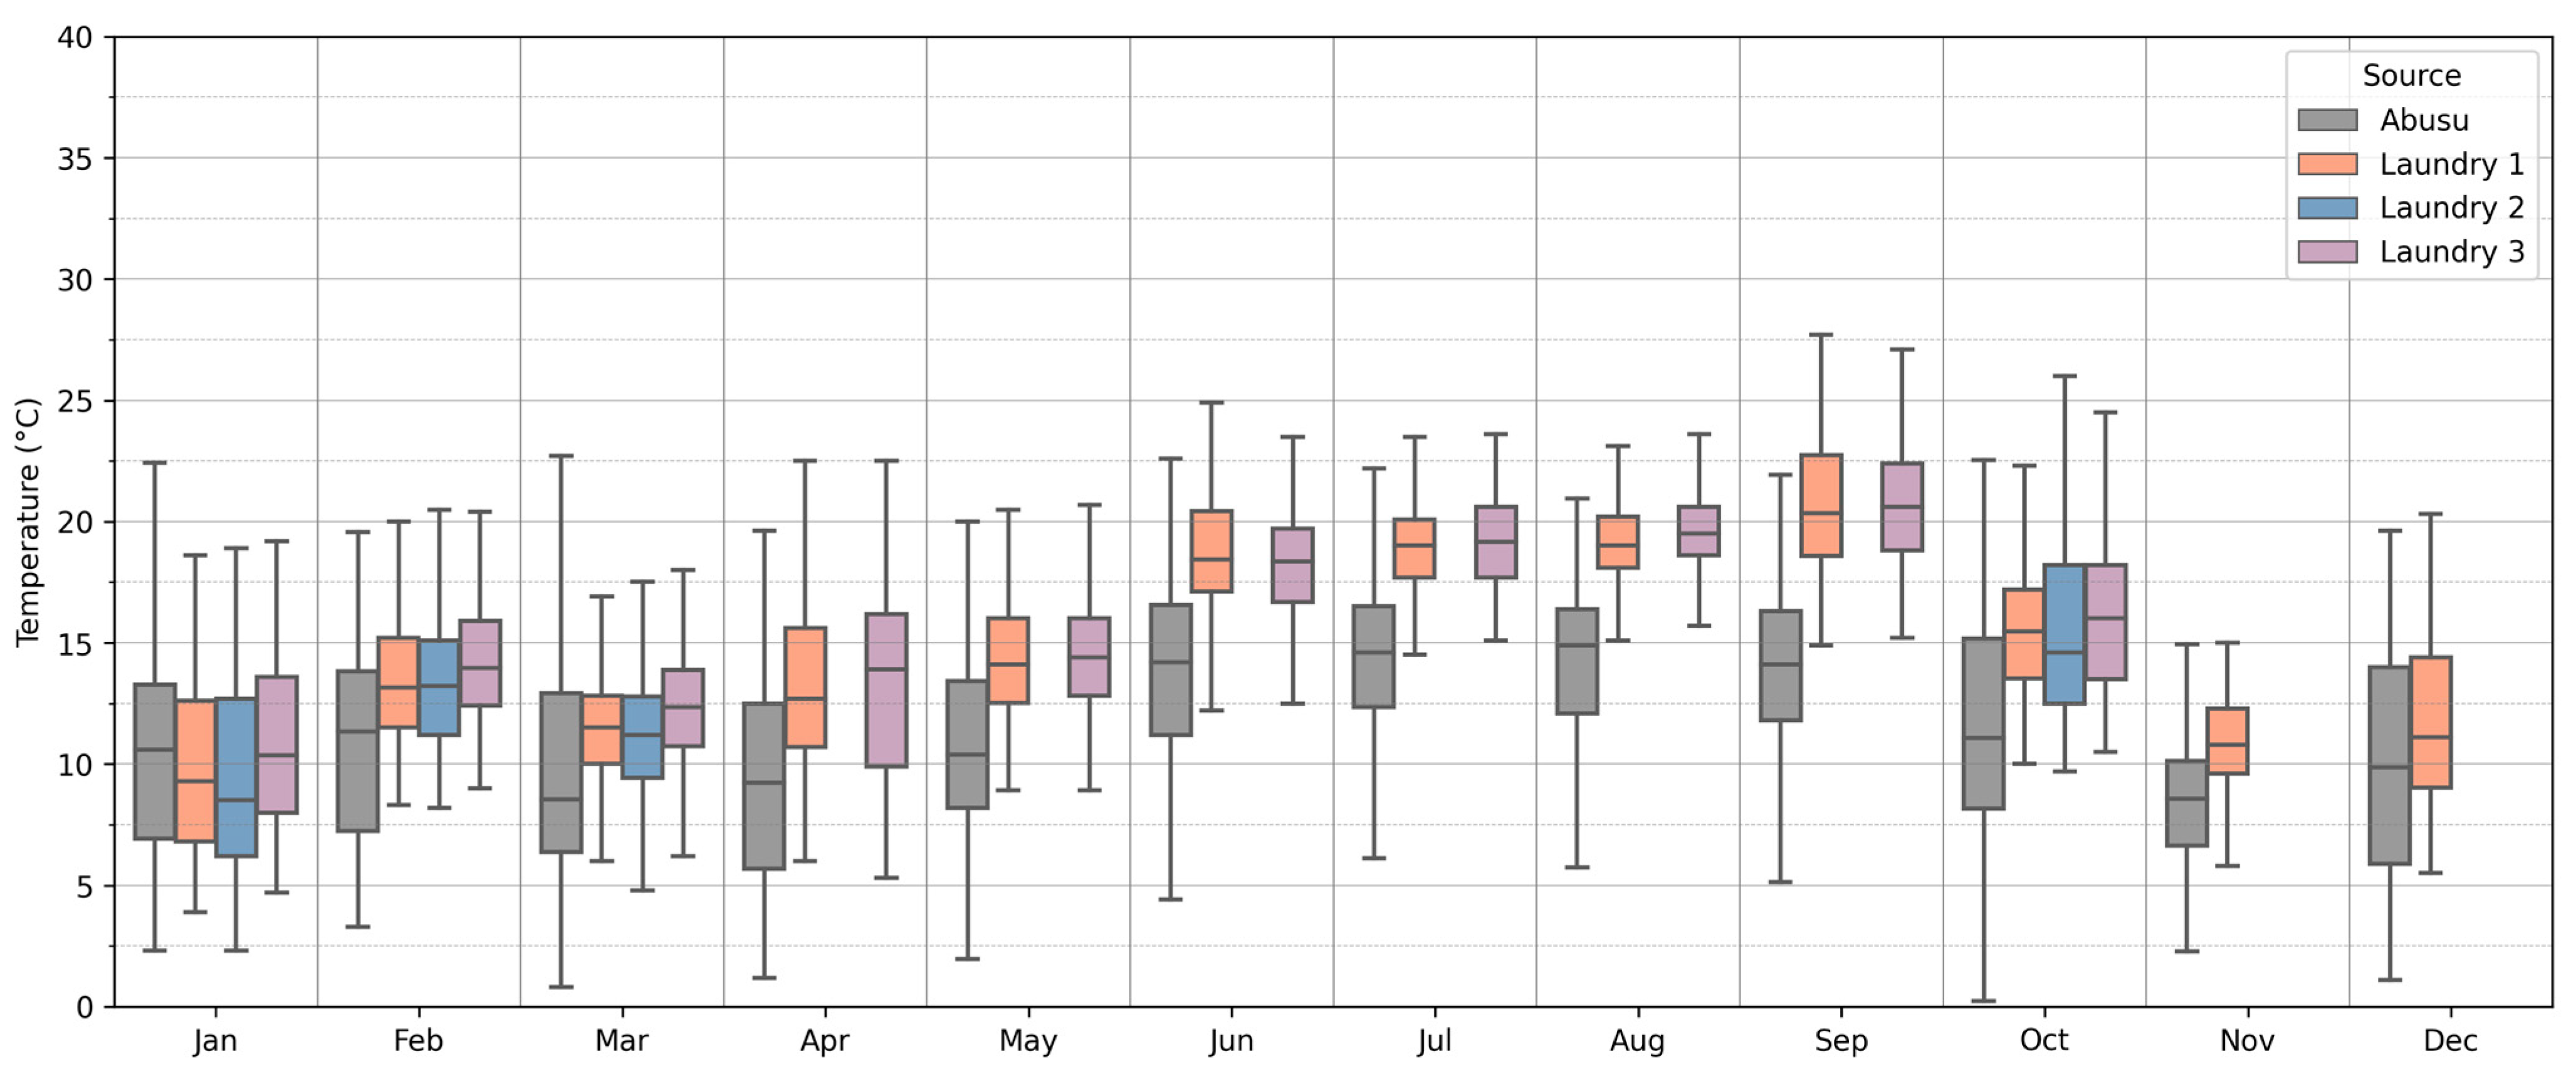
- Consistent temperature difference across seasons: The laundry spaces consistently maintain higher temperatures than the outdoor environment, irrespective of whether it is the winter or summer seasons. This trend is also observed in terms of relative humidity but in reverse, with the laundry spaces generally having lower humidity levels than the outdoors.
- Minimum vs. maximum temperature disparity: The disparity between the indoor and outdoor temperatures is more pronounced at the maximum temperatures than at the minimum.
- High laundry temperatures during the winter: On clear winter days, despite the outdoor maximum temperatures not exceeding 15 °C, the laundry spaces can reach temperatures around 30 °C. This demonstrates a substantial amplification of heat within these enclosed spaces during sunny winter days.
- Extreme conditions under hot weather: During the hottest weather conditions of the year, like the hottest week of the summer, the laundry rooms exhibit significantly higher temperatures compared to the outdoor environment.
- Nighttime temperature patterns: During the nighttime, the temperature drops but does not reach equilibrium with the outdoor conditions.
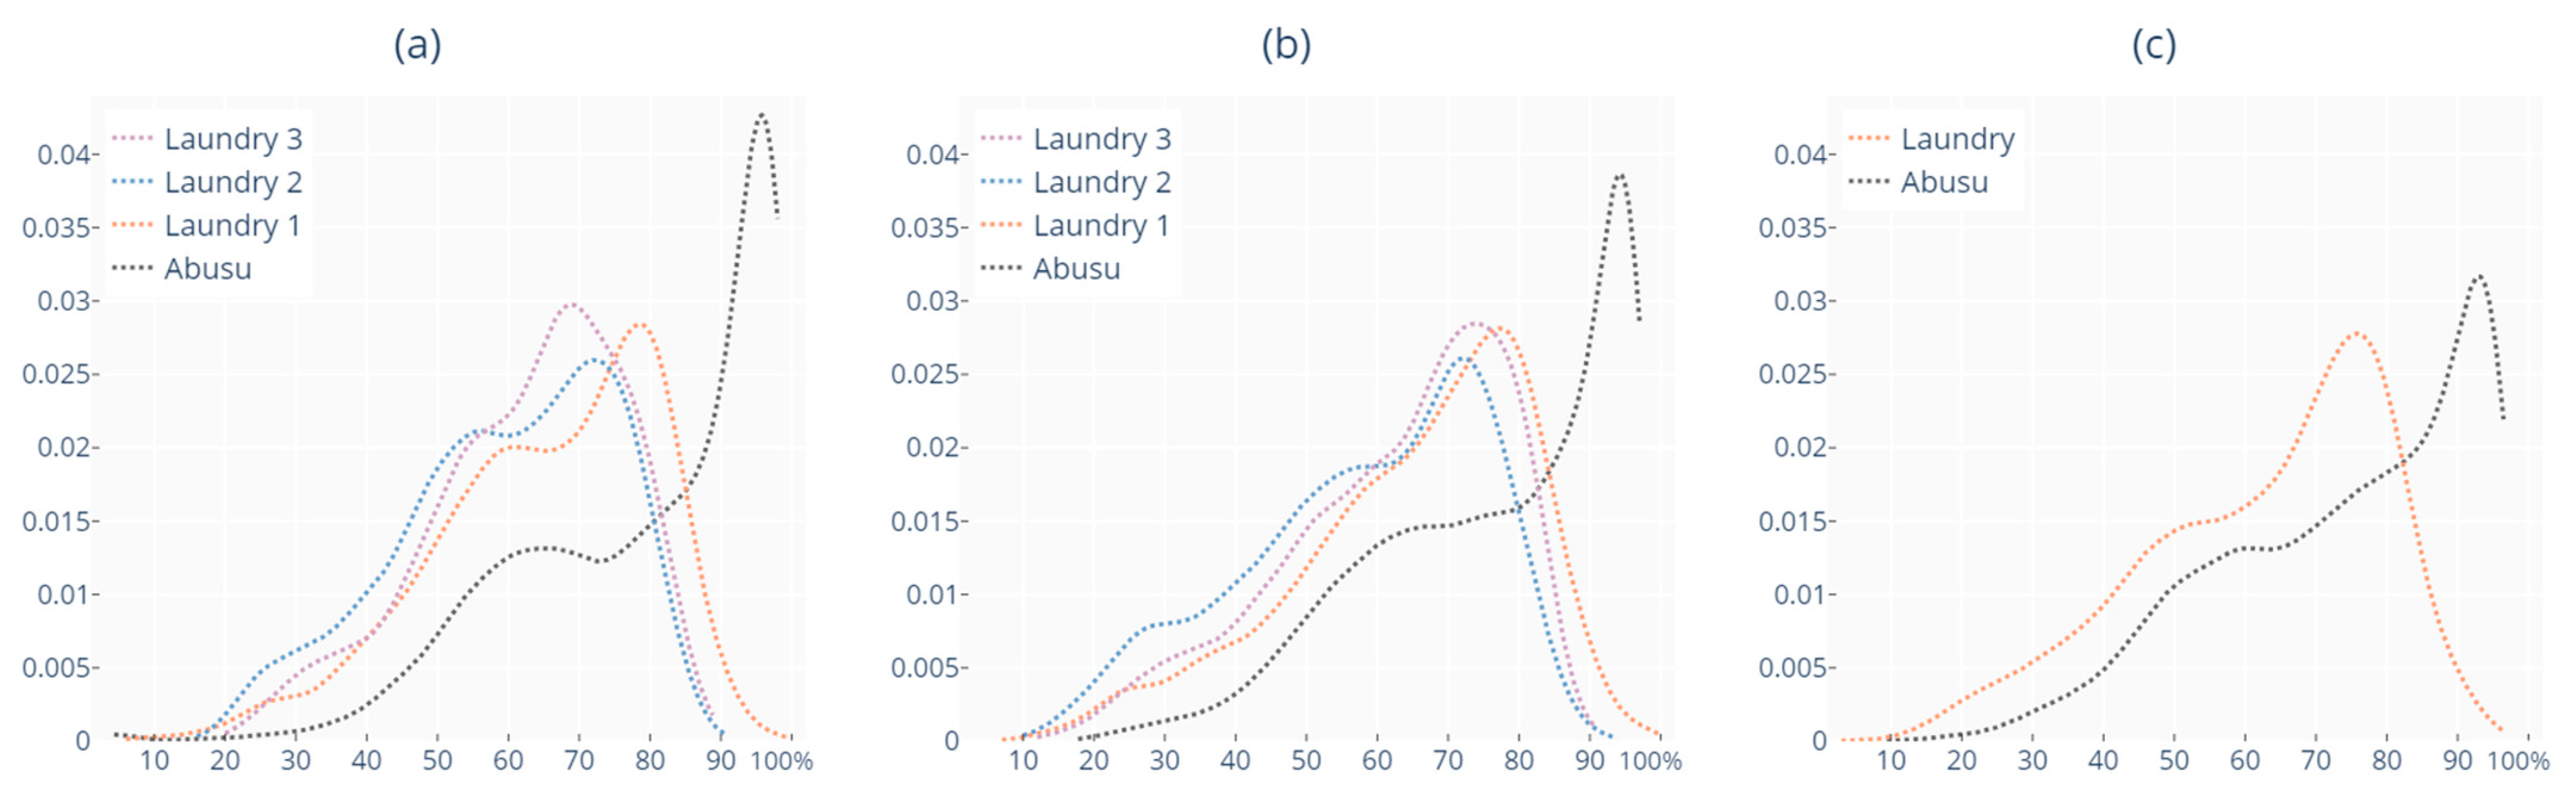
- Relative humidity trend and dryness: The relative humidity in the laundry spaces showed lower levels compared to the outdoors, with notable drops during periods of high indoor temperatures.
- The temperature recorded in the laundries exceeded the outside temperature for 87–100% of the time during the daytime, and for 97–100% during the nighttime.
- This difference was at least 2 °C for 62–88% of the time during the day and 80–93% during the night.
- During the day, the temperature difference between the laundries and the outside exceeded 12 °C for 5% of the time (daytime) for laundry 1, 7% in the case of laundry 2, and 2.5% in the case of laundry 3.
- During the night, the magnitude of the temperature difference was smaller, and heat differentials of 6 °C or more were measured for 11.2%, 4.4%, and 11.3% of the time for laundry 1, 2, and 3, respectively.
- The average temperature difference, MAD, was calculated to be ranging in monthly values from +3.80 °C to +8.62 °C. The average monthly MAD was +5.66 °C during the daytime and +4.70 °C during the nighttime.
5. Conclusions
Author Contributions
Funding
Institutional Review Board Statement
Informed Consent Statement
Data Availability Statement
Acknowledgments
Conflicts of Interest
Abbreviations
| °C | Degree Celsius |
| AEMET | Agencia Estatal de Meteorología (English: State Meteorological Agency) |
| CDHs | Cooling degree hours |
| CIBSE | Chartered Institution of Building Services Engineers (UK) |
| CO2 | Carbon dioxide |
| DHW | Domestic hot water |
| g | Solar energy transmittance coefficient |
| h | Hour |
| HDHs | Heating degree hours |
| IAQ | Indoor air quality |
| IEQ | Indoor environment quality |
| MAD | Mean absolute difference |
| MHRV | Mechanical heat recovery ventilation |
| n50 | Leakage rate at a reference pressure of 50 Pascals |
| nZEB | Net zero energy building |
| PCC | Pearson correlation coefficient |
| PH | Passivhaus |
| PHI | Passivhaus Institut |
| POE | Post-occupancy evaluation |
| RH | Relative humidity |
| RITE | Reglamento de Instalaciones Térmicas en los Edificios (English: Regulation of Thermal Installations in Buildings) |
| T | Temperature |
| T&D | T&D Corporation, company devoted to the fabrication of precision dataloggers |
| TM | Technical memorandum |
| U | Thermal transmittance, rate of transfer of heat through a building component or system |
| UTM | Universal transverse Mercator coordinate system |
| W | Watt |
| YoC | Year of construction |
Appendix A
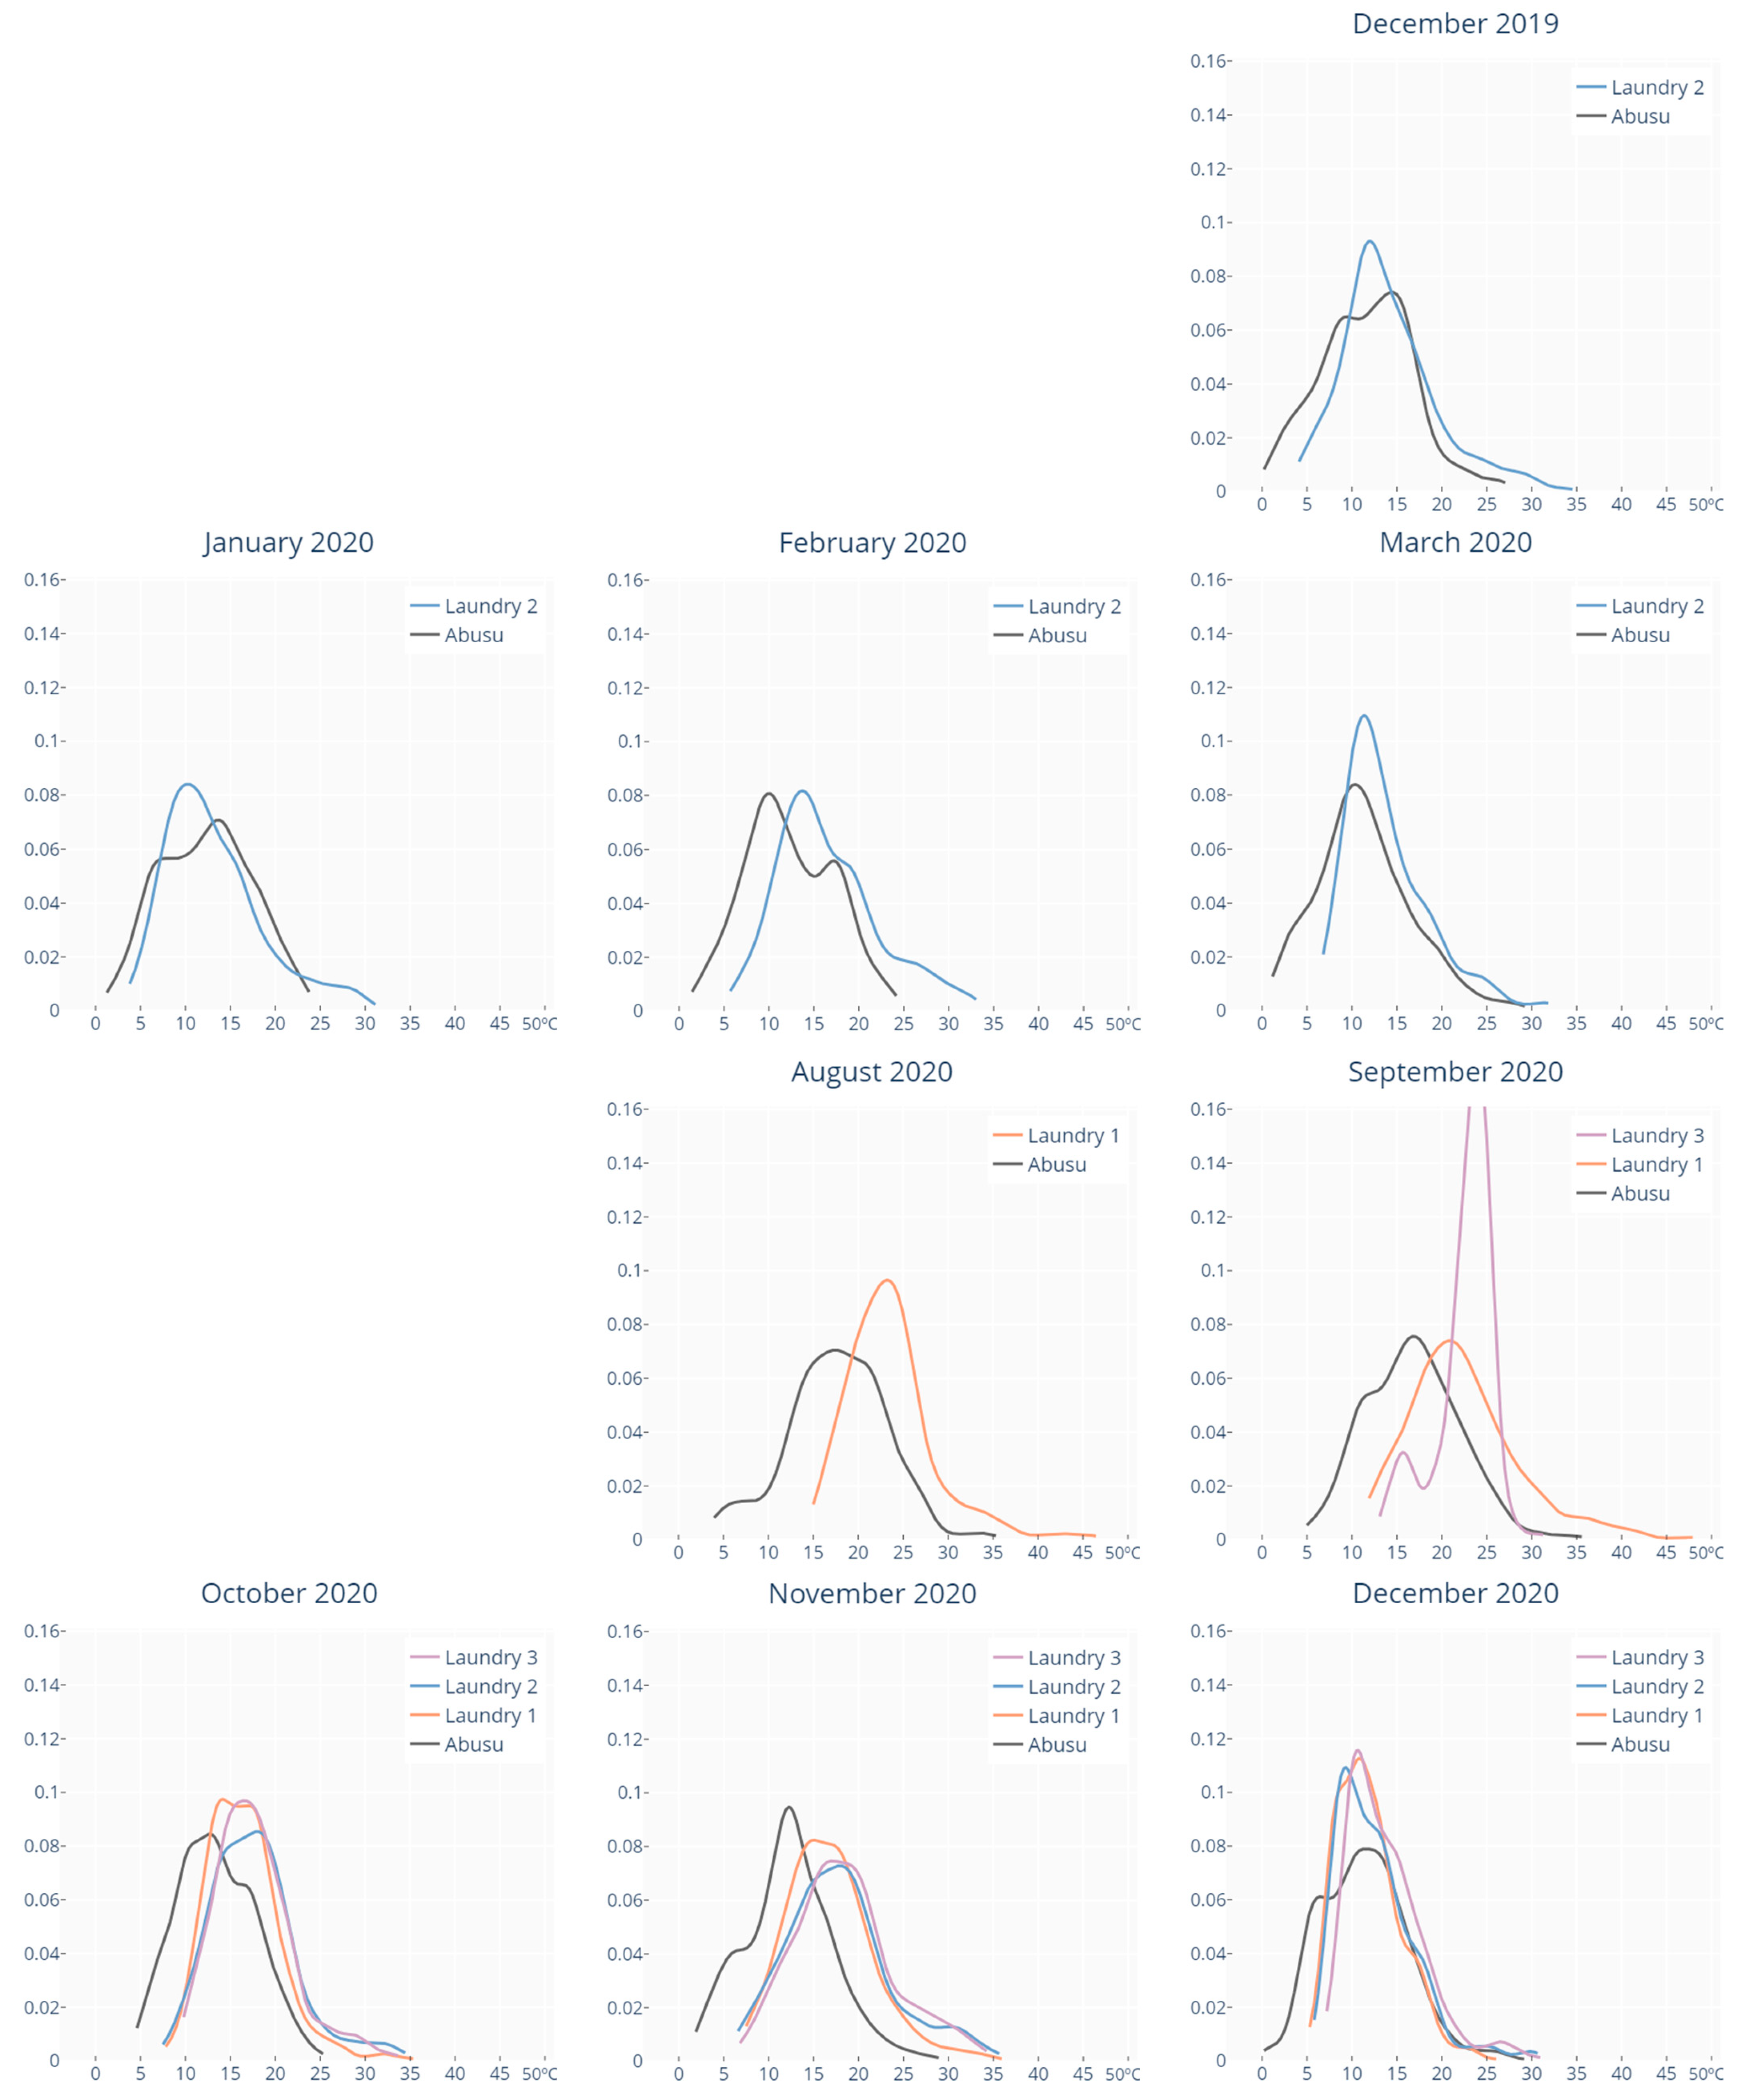
- Figure A1: Monthly temperature distributions for Abusu meteorological station and the three studied laundry spaces in December 2019 and available data for 2020.
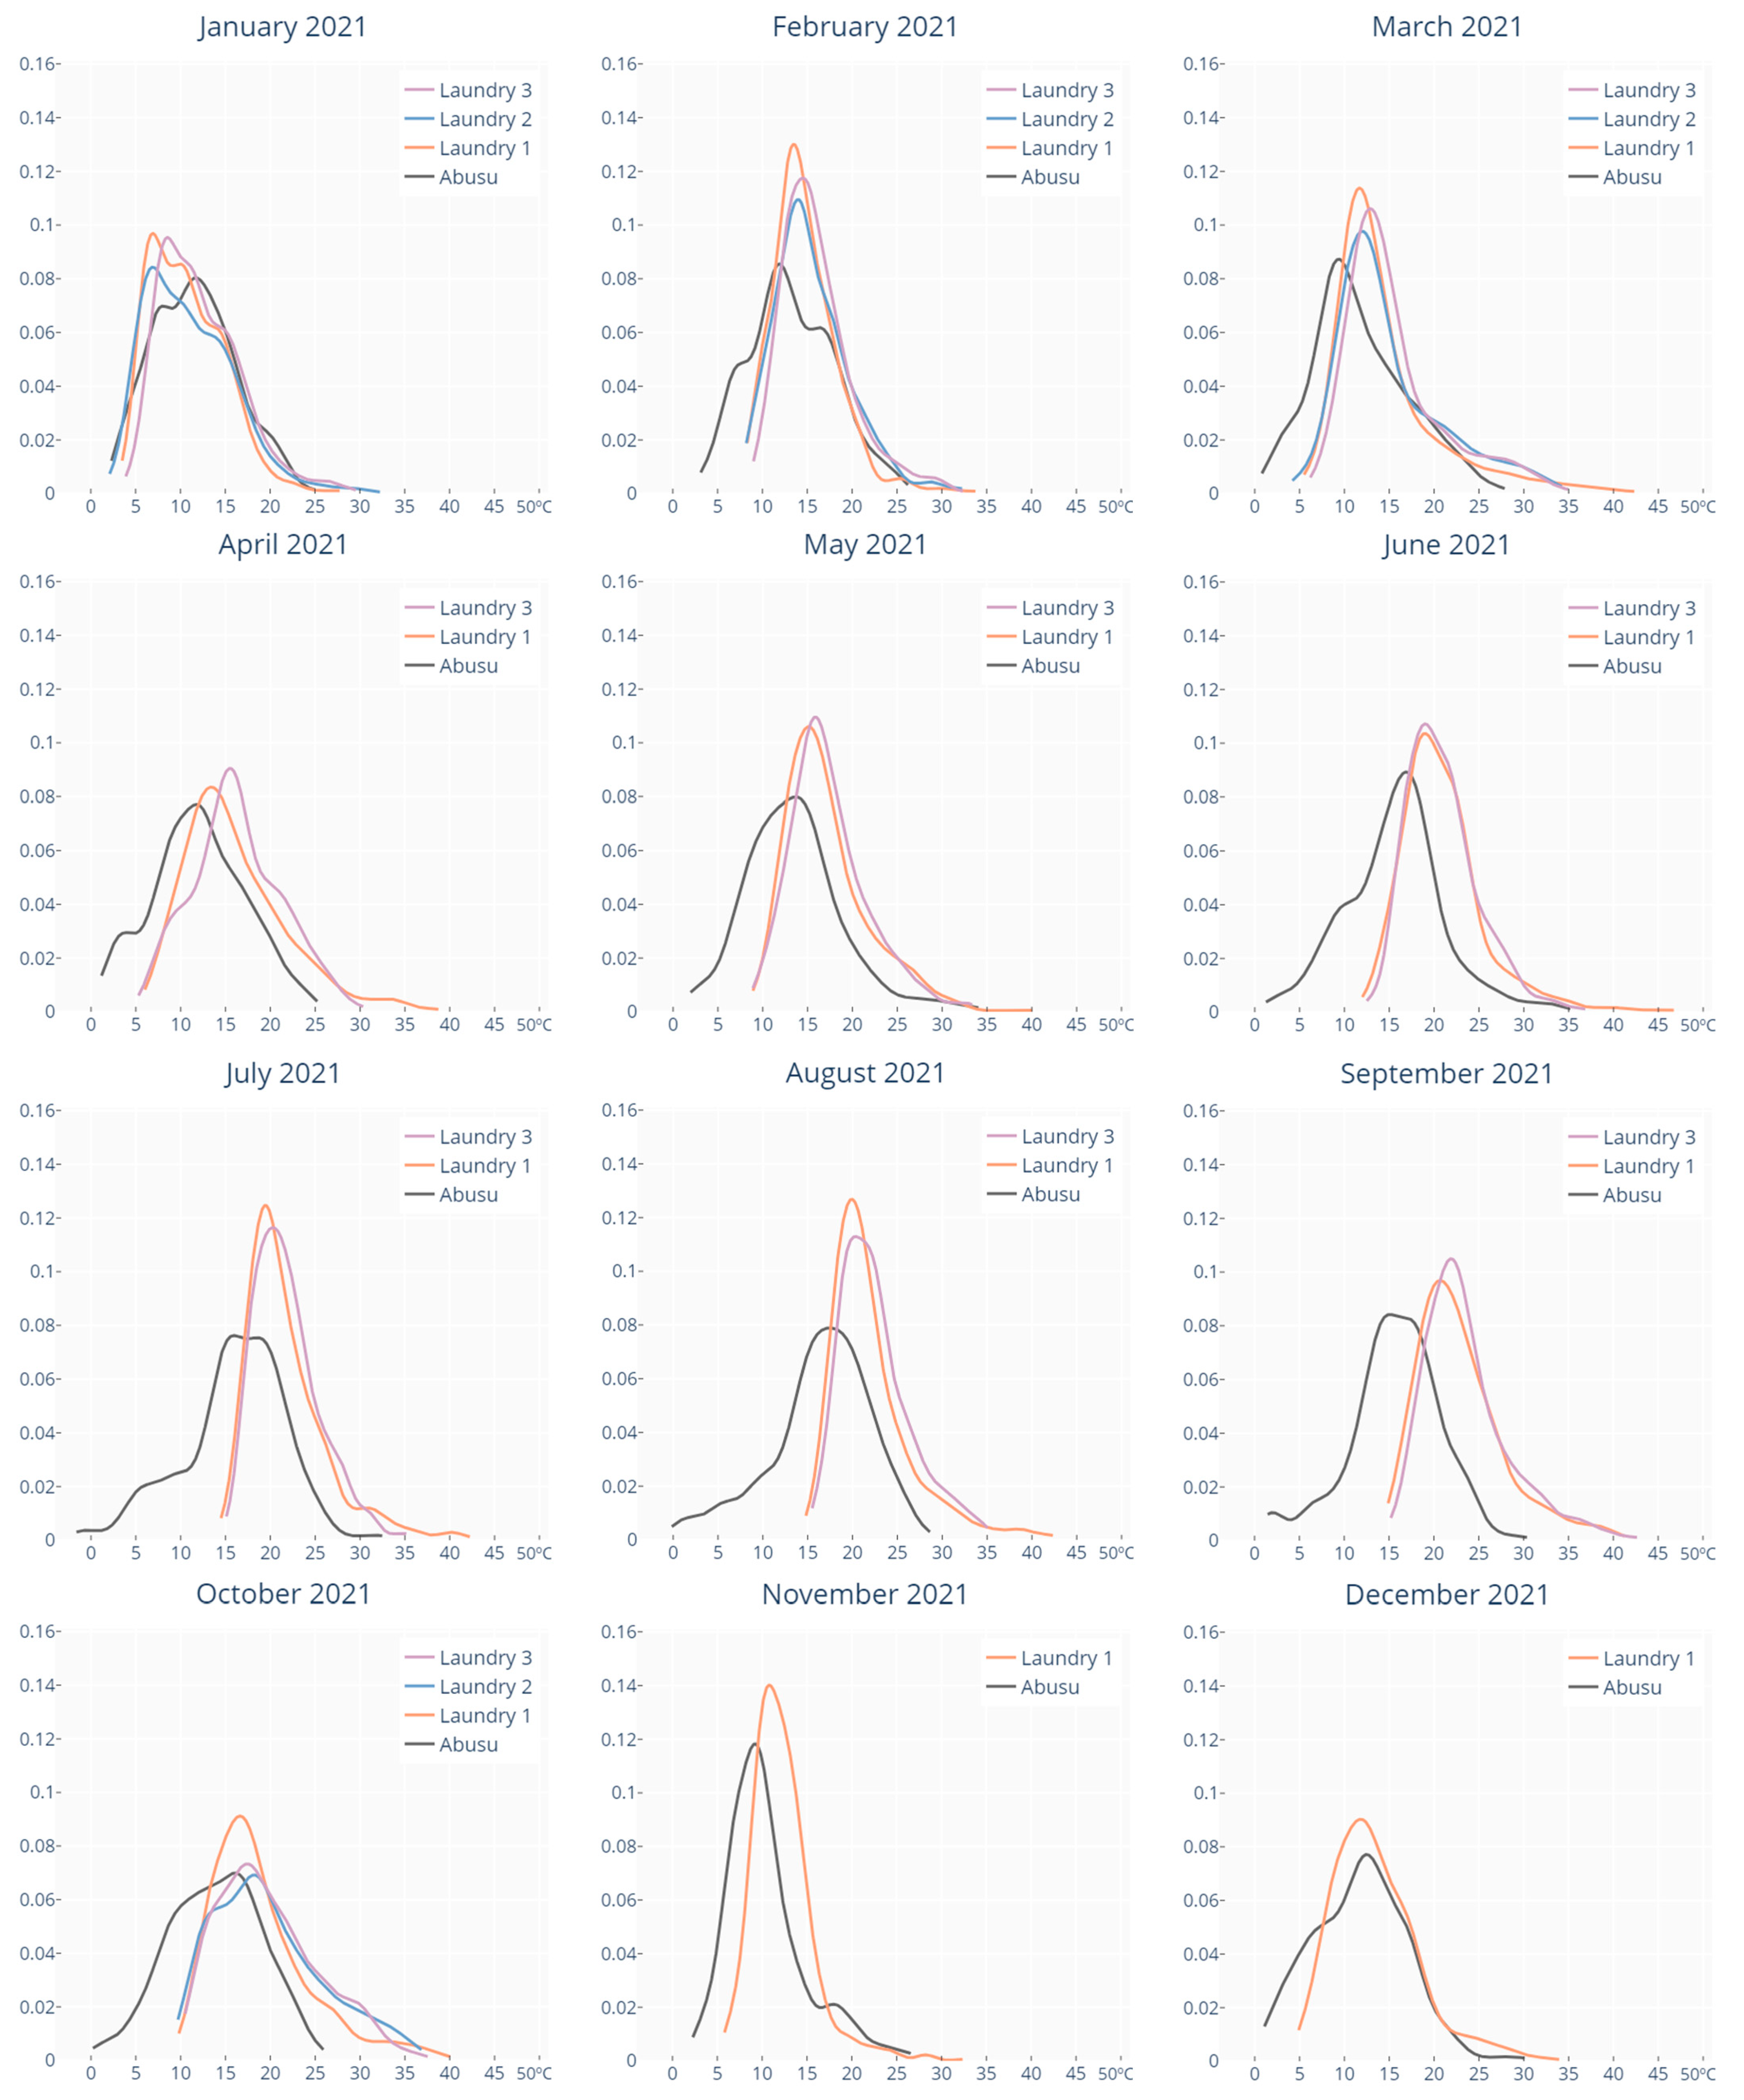
- Figure A2: Monthly temperature distributions for Abusu meteorological station and the three studied laundry spaces for 2021.
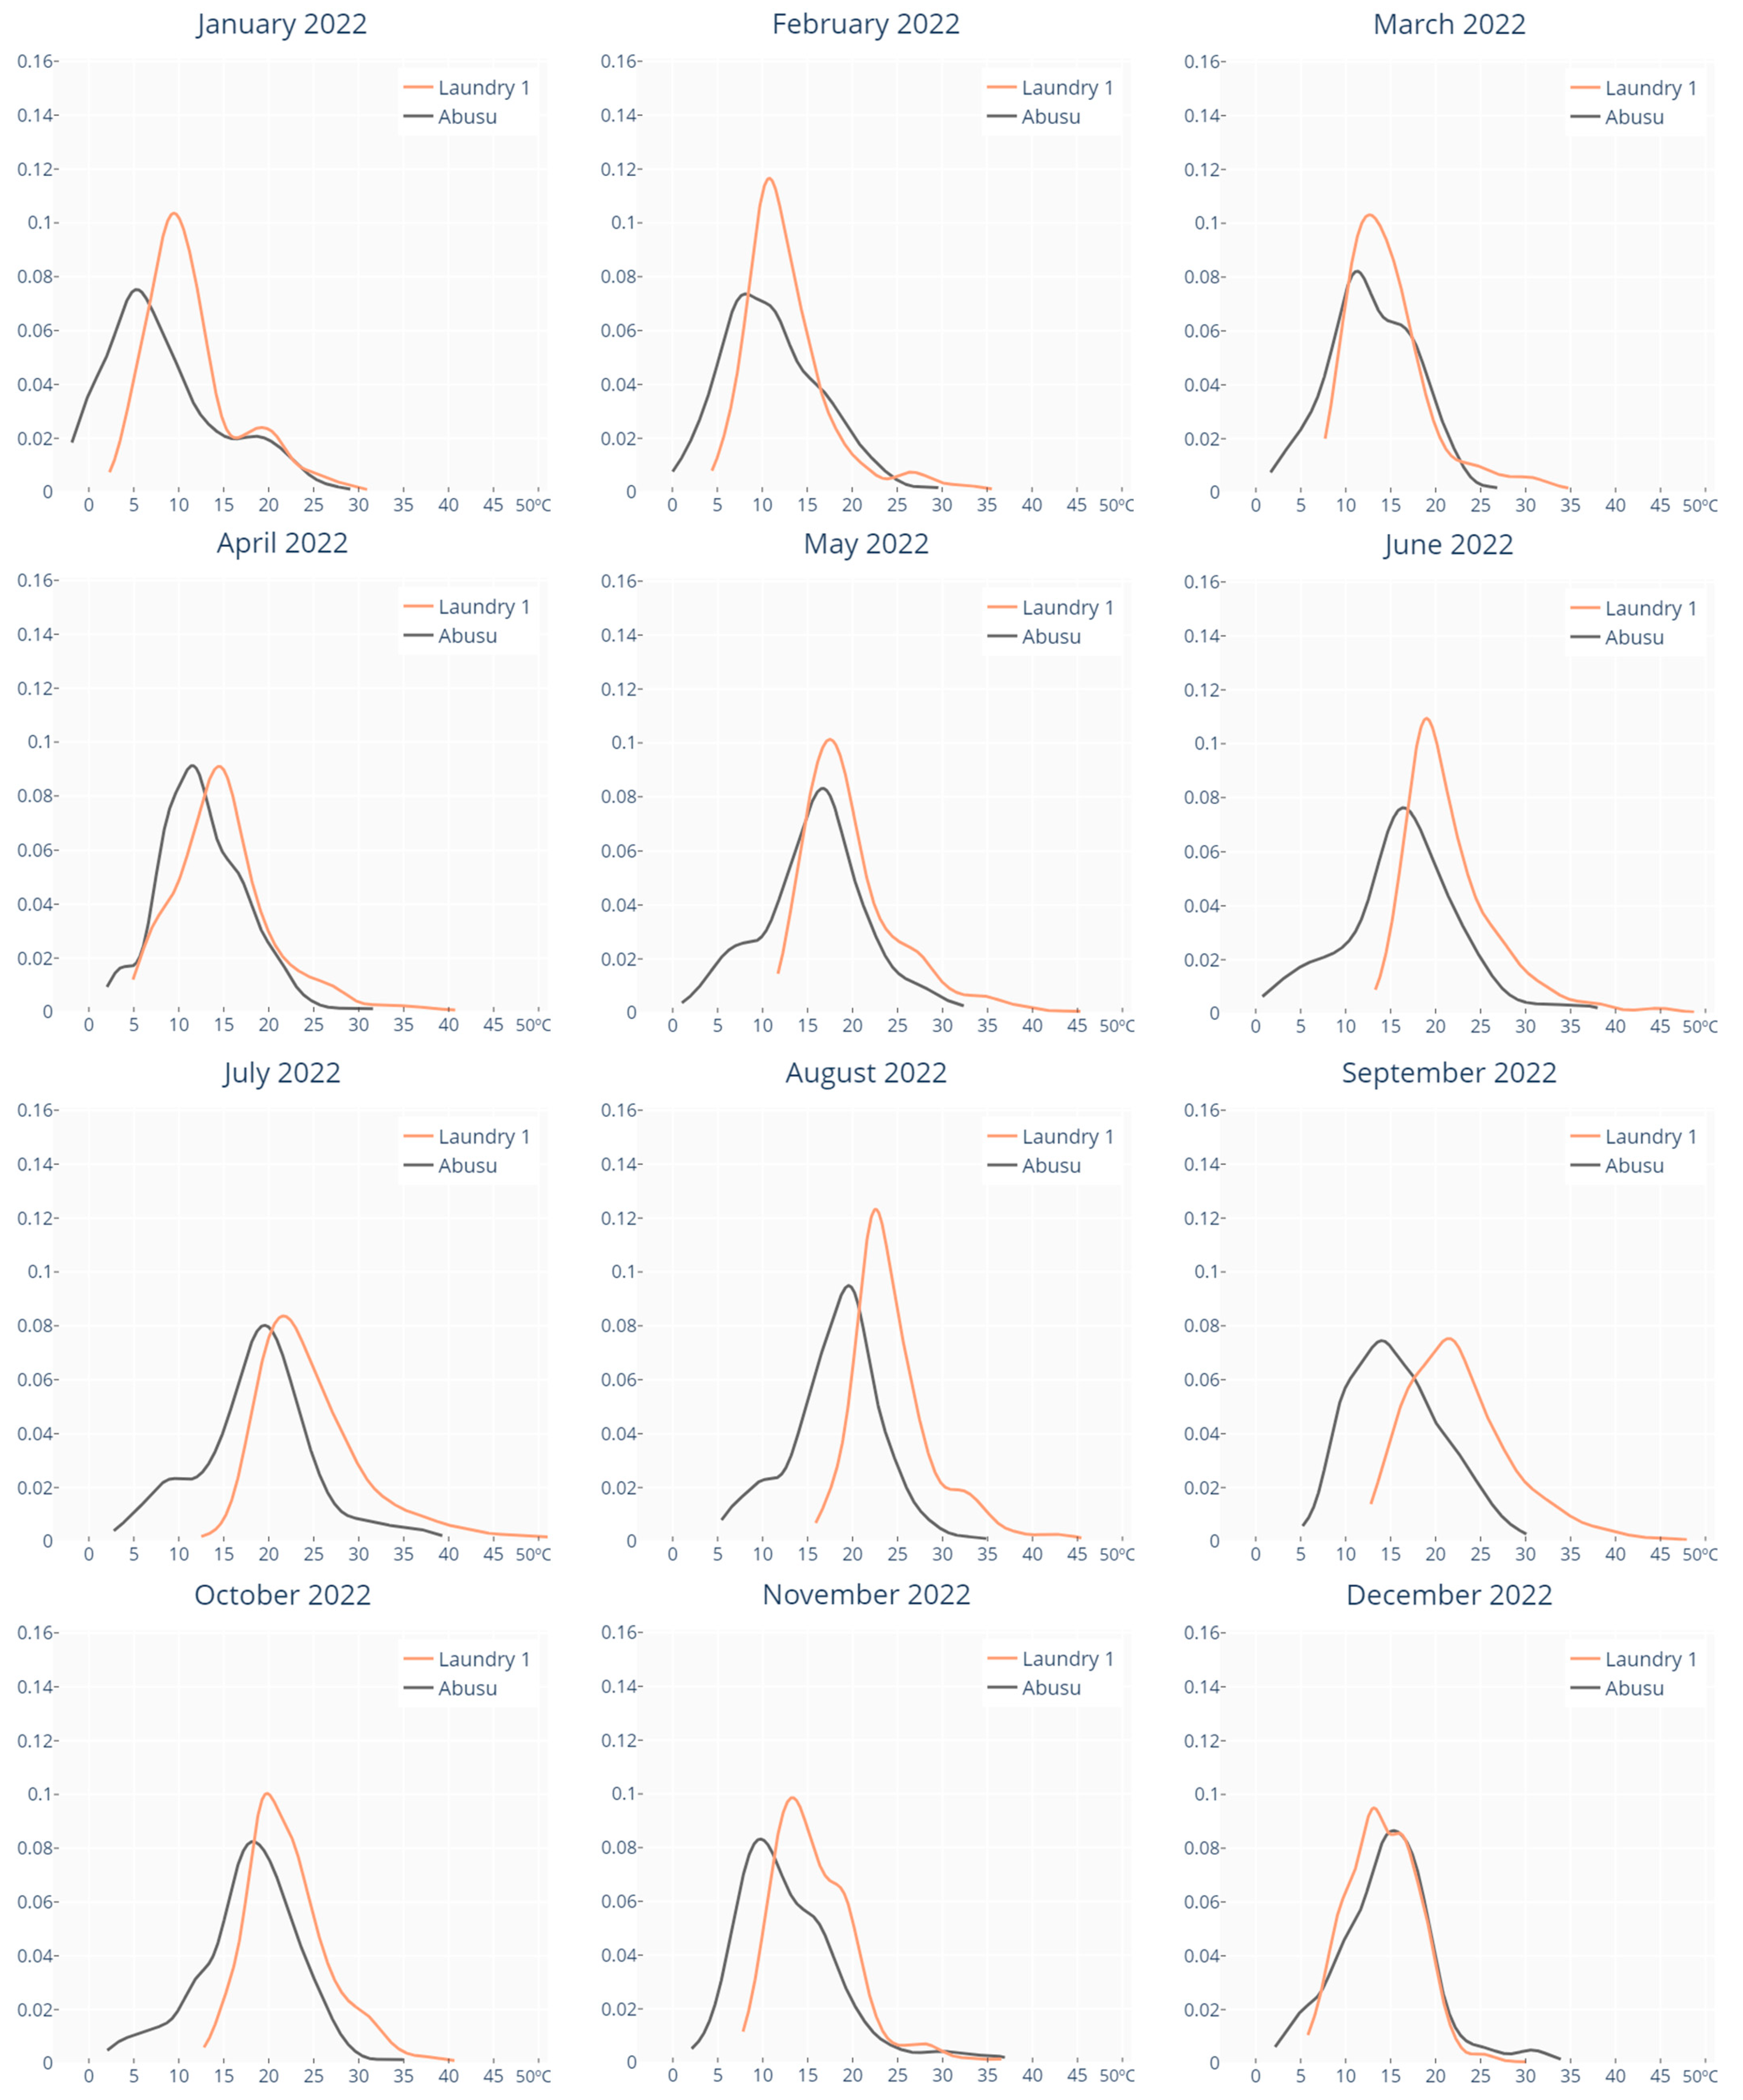
- Figure A3: Monthly temperature distributions for Abusu meteorological station and Laundry 3 for 2022.
- And tables:
- Table A1: Abusu meteorological station. Summary of monthly temperature recordings, January 2020–December 2022.
- Table A2: Abusu meteorological station. Summary of monthly relative humidity recordings, January 2020–December 2022.
- Table A3: Laundry 1. Summary of monthly temperature recordings, January 2020–December 2022.
- Table A4: Laundry 1. Summary of monthly relative humidity recordings, January 2020–December 2022.
- Table A5: Laundry 2. Summary of monthly temperature recordings, all available data.
- Table A6: Laundry 2. Summary of monthly relative humidity recordings, all available data.
- Table A7: Laundry 3. Summary of monthly temperature recordings, all available data.
- Table A8: Laundry 3. Summary of monthly relative humidity recordings, all available data.
- Table A9: Laundry 1 and Abusu station monthly temperature comparison.
- Table A10: Laundry 1 and Abusu temperature comparison, daytime hours (08:00–21:00 h).
- Table A11: Laundry 1 and Abusu temperature comparison, nighttime hours (22:00–07:00 h).
- Table A12: Laundry 2 and Abusu station monthly temperature comparison.
- Table A13: Laundry 2 and Abusu temperature comparison, daytime hours (08:00–21:00 h).
- Table A14: Laundry 2 and Abusu temperature comparison, nighttime hours (22:00–07:00 h).
- Table A15: Laundry 3 and Abusu station monthly temperature comparison.
- Table A16: Laundry 3 and Abusu temperature comparison, daytime hours (08:00–21:00 h).
- Table A17: Laundry 3 and Abusu temperature comparison, nighttime hours (22:00–07:00 h).

| 2020 | 2021 | 2022 | |||||||||||||
|---|---|---|---|---|---|---|---|---|---|---|---|---|---|---|---|
| Average | Absolute Min. | Absolute Max. | Avg. Daily Min. | Avg. Daily Max. | Average | Absolute Min. | Absolute Max. | Avg. Daily Min. | Avg. Daily Max. | Average | Absolute Min. | Absolute Max. | Avg. Daily Min. | Avg. Daily Max. | |
| Jan. | 9.13 °C | 0.04 °C | 19.99 °C | 5.30 °C | 13.32 °C | 7.47 °C | −1.73 °C | 19.22 °C | 4.58 °C | 10.90 °C | 6.91 °C | −1.97 °C | 21.45 °C | 3.24 °C | 11.82 °C |
| Feb. | 11.74 °C | 2.37 °C | 24.38 °C | 7.49 °C | 16.56 °C | 12.09 °C | 4.57 °C | 21.98 °C | 8.06 °C | 15.91 °C | 8.65 °C | −0.02 °C | 19.75 °C | 3.63 °C | 14.73 °C |
| Mar. | 10.19 °C | 1.07 °C | 23.54 °C | 5.85 °C | 15.33 °C | 10.62 °C | 0.07 °C | 28.40 °C | 5.97 °C | 15.82 °C | 11.60 °C | 4.10 °C | 21.95 °C | 7.62 °C | 15.75 °C |
| Apr. | 14.32 °C | 2.55 °C | 26.44 °C | 10.31 °C | 19.46 °C | 11.53 °C | 1.06 °C | 24.77 °C | 6.72 °C | 16.50 °C | 11.41 °C | 0.77 °C | 25.88 °C | 7.23 °C | 16.51 °C |
| May | 16.81 °C | 7.30 °C | 31.90 °C | 10.14 °C | 22.80 °C | 13.58 °C | 3.97 °C | 29.62 °C | 8.65 °C | 19.40 °C | 16.35 °C | 7.00 °C | 32.32 °C | 11.80 °C | 22.21 °C |
| Jun. | 16.86 °C | 8.58 °C | 32.47 °C | 12.79 °C | 21.64 °C | 17.31 °C | 8.52 °C | 33.50 °C | 13.25 °C | 22.13 °C | 18.42 °C | 9.17 °C | 38.60 °C | 14.24 °C | 24.30 °C |
| Jul. | 19.60 °C | 9.67 °C | 38.91 °C | 15.12 °C | 24.53 °C | 18.27 °C | 10.12 °C | 34.74 °C | 14.38 °C | 22.89 °C | 20.80 °C | 8.30 °C | 39.80 °C | 15.41 °C | 27.08 °C |
| Aug. | 20.03 °C | 9.43 °C | 38.77 °C | 15.56 °C | 26.03 °C | 18.46 °C | 10.90 °C | 28.53 °C | 14.50 °C | 23.25 °C | 20.99 °C | 12.70 °C | 37.20 °C | 16.67 °C | 26.65 °C |
| Sep. | 17.94 °C | 0.60 °C | 36.10 °C | 12.51 °C | 24.64 °C | 18.71 °C | 10.70 °C | 35.77 °C | 14.50 °C | 24.28 °C | 17.98 °C | 8.00 °C | 37.50 °C | 13.18 °C | 24.02 °C |
| Oct. | 13.29 °C | 4.52 °C | 23.34 °C | 9.44 °C | 17.69 °C | 14.15 °C | 5.29 °C | 26.24 °C | 9.61 °C | 19.96 °C | 18.19 °C | 9.25 °C | 27.58 °C | 14.16 °C | 23.21 °C |
| Nov. | 12.48 °C | 1.72 °C | 23.47 °C | 8.34 °C | 17.16 °C | 9.15 °C | 2.93 °C | 18.00 °C | 6.60 °C | 12.35 °C | 12.00 °C | 4.43 °C | 21.48 °C | 8.04 °C | 16.61 °C |
| Dec. | 9.31 °C | 1.63 °C | 20.45 °C | 6.22 °C | 12.17 °C | 10.20 °C | 0.87 °C | 21.86 °C | 6.58 °C | 14.50 °C | 11.40 °C | 1.91 °C | 21.63 °C | 7.77 °C | 14.56 °C |
| 2020 | 2021 | 2022 | |||||||||||||
|---|---|---|---|---|---|---|---|---|---|---|---|---|---|---|---|
| Average | Absolute Min. | Absolute Max. | Avg. Daily Min. | Avg. Daily Max. | Average | Absolute Min. | Absolute Max. | Avg. Daily Min. | Avg. Daily Max. | Average | Absolute Min. | Absolute Max. | Avg. Daily Min. | Avg. Daily Max. | |
| Jan. | 97.3% | 83.4% | 98.2% | 94.9% | 98.0% | 80.3% | 31.2% | 96.3% | 60.2% | 92.5% | 78.0% | 27.6% | 96.1% | 54.0% | 92.2% |
| Feb. | 92.9% | 25.2% | 98.2% | 85.4% | 97.3% | 68.2% | 21.1% | 96.1% | 49.5% | 88.9% | 78.1% | 5.3% | 96.3% | 49.6% | 94.6% |
| Mar. | 76.6% | 27.7% | 96.3% | 52.5% | 93.9% | 69.6% | 16.6% | 96.1% | 44.7% | 89.6% | 67.6% | 25.8% | 95.9% | 46.8% | 86.4% |
| Apr. | 76.0% | 23.3% | 96.3% | 52.0% | 94.5% | 68.2% | 20.9% | 96.3% | 44.9% | 90.2% | 74.7% | 24.6% | 96.2% | 49.7% | 93.0% |
| May | 75.4% | 10.9% | 96.3% | 47.9% | 95.2% | 74.5% | 27.3% | 96.2% | 47.3% | 94.9% | 73.5% | 24.5% | 96.2% | 49.4% | 92.6% |
| Jun. | 77.8% | 35.5% | 96.2% | 54.6% | 95.1% | 79.0% | 32.1% | 96.9% | 57.2% | 95.0% | 77.5% | 19.4% | 96.3% | 53.2% | 94.0% |
| Jul. | 75.3% | 21.4% | 96.3% | 53.2% | 94.5% | 78.8% | 28.6% | 96.3% | 57.3% | 94.4% | 70.2% | 12.0% | 96.0% | 45.5% | 90.9% |
| Aug. | 76.7% | 12.2% | 96.3% | 49.6% | 94.6% | 79.1% | 38.0% | 97.3% | 56.5% | 95.1% | 75.1% | 22.0% | 97.0% | 50.7% | 93.0% |
| Sep. | 72.9% | 5.8% | 96.3% | 41.1% | 92.3% | 79.9% | 27.6% | 97.4% | 52.6% | 95.3% | 71.5% | 16.0% | 97.0% | 45.2% | 90.8% |
| Oct. | 81.3% | 34.2% | 96.3% | 57.8% | 95.3% | 78.6% | 35.2% | 96.9% | 51.1% | 94.7% | 70.7% | 21.0% | 96.4% | 48.3% | 87.2% |
| Nov. | 74.6% | 40.1% | 96.2% | 53.9% | 90.4% | 86.9% | 42.0% | 97.1% | 66.6% | 96.0% | 78.2% | 30.3% | 96.2% | 51.3% | 93.7% |
| Dec. | 76.3% | 37.2% | 96.2% | 56.1% | 93.4% | 75.7% | 28.8% | 96.3% | 56.4% | 90.9% | 73.9% | 13.2% | 96.1% | 56.5% | 90.0% |
| 2020 | 2021 | 2022 | |||||||||||||
|---|---|---|---|---|---|---|---|---|---|---|---|---|---|---|---|
| Average | Absolute Min. | Absolute Max. | Avg. Daily Min. | Avg. Daily Max. | Average | Absolute Min. | Absolute Max. | Avg. Daily Min. | Avg. Daily Max. | Average | Absolute Min. | Absolute Max. | Avg. Daily Min. | Avg. Daily Max. | |
| Jan. | 10.74 °C | 3.5 °C | 27.8 °C | 8.35 °C | 15.61 °C | 11.47 °C | 2.3 °C | 31.0 °C | 7.64 °C | 21.14 °C | |||||
| Feb. | 14.78 °C | 8.3 °C | 33.8 °C | 11.59 °C | 20.74 °C | 12.89 °C | 4.4 °C | 35.6 °C | 8.66 °C | 22.26 °C | |||||
| Mar. | 14.64 °C | 5.5 °C | 42.4 °C | 10.64 °C | 23.82 °C | 14.91 °C | 7.7 °C | 34.8 °C | 11.16 °C | 22.05 °C | |||||
| Apr. | 16.07 °C | 6.0 °C | 38.8 °C | 11.43 °C | 25.51 °C | 15.08 °C | 4.9 °C | 40.8 °C | 10.78 °C | 23.73 °C | |||||
| May | 17.18 °C | 8.9 °C | 40.1 °C | 12.85 °C | 25.63 °C | 19.89 °C | 11.7 °C | 45.4 °C | 15.43 °C | 28.58 °C | |||||
| Jun. | 20.98 °C | 12.0 °C | 46.8 °C | 17.08 °C | 27.89 °C | 21.81 °C | 13.3 °C | 48.8 °C | 17.53 °C | 29.61 °C | |||||
| Jul. | 21.78 °C | 14.5 °C | 42.3 °C | 17.89 °C | 29.25 °C | 25.03 °C | 12.5 °C | 53.0 °C | 19.47 °C | 34.38 °C | |||||
| Aug. | 23.59 °C | 15.0 °C | 46.5 °C | 19.48 °C | 31.06 °C | 22.06 °C | 14.8 °C | 42.4 °C | 17.94 °C | 29.86 °C | 24.60 °C | 15.9 °C | 45.5 °C | 20.79 °C | 32.23 °C |
| Sep. | 22.37 °C | 11.9 °C | 48.0 °C | 17.18 °C | 32.28 °C | 22.98 °C | 14.9 °C | 41.3 °C | 19.10 °C | 30.52 °C | 22.70 °C | 12.8 °C | 48.0 °C | 18.34 °C | 31.21 °C |
| Oct. | 16.45 °C | 7.8 °C | 35.4 °C | 13.17 °C | 22.76 °C | 18.88 °C | 9.8 °C | 40.1 °C | 13.85 °C | 29.84 °C | 22.15 °C | 12.80 °C | 40.70 °C | 18.23 °C | 30.85 °C |
| Nov. | 16.83 °C | 7.5 °C | 36.0 °C | 12.86 °C | 25.80 °C | 12.24 °C | 5.8 °C | 32.4 °C | 9.85 °C | 17.78 °C | 15.78 °C | 7.80 °C | 36.60 °C | 12.13 °C | 22.43 °C |
| Dec. | 11.85 °C | 5.3 °C | 26.1 °C | 9.61 °C | 15.85 °C | 13.48 °C | 4.9 °C | 34.0 °C | 10.26 °C | 21.53 °C | 14.37 °C | 5.80 °C | 30.10 °C | 11.65 °C | 19.64 °C |
| 2020 | 2021 | 2022 | |||||||||||||
|---|---|---|---|---|---|---|---|---|---|---|---|---|---|---|---|
| Average | Absolute Min. | Absolute Max. | Avg. Daily Min. | Avg. Daily Max. | Average | Absolute Min. | Absolute Max. | Avg. Daily Min. | Avg. Daily Max. | Average | Absolute Min. | Absolute Max. | Avg. Daily Min. | Avg. Daily Max. | |
| Jan. | 69.2% | 27% | 95% | 52.5% | 80.3% | 63.7% | 14% | 97% | 37.3% | 78.0% | |||||
| Feb. | 61.0% | 17% | 94% | 41.3% | 76.8% | 64.7% | 3% | 92% | 38.0% | 80.2% | |||||
| Mar. | 58.4% | 7% | 96% | 34.4% | 74.2% | 58.1% | 12% | 90% | 36.9% | 73.6% | |||||
| Apr. | 55.1% | 11% | 91% | 31.9% | 72.3% | 62.7% | 14% | 91% | 37.5% | 79.4% | |||||
| May | 62.5% | 19% | 91% | 36.0% | 80.3% | 62.6% | 12% | 89% | 38.5% | 79.1% | |||||
| Jun. | 67.3% | 18% | 93% | 45.1% | 82.9% | 67.4% | 19% | 93% | 42.4% | 85.0% | |||||
| Jul. | 67.7% | 21% | 92% | 44.2% | 83.0% | 59.4% | 11% | 90% | 35.1% | 77.5% | |||||
| Aug. | 65.1% | 6% | 90% | 42.0% | 82.3% | 68.0% | 17% | 92% | 44.2% | 83.2% | 66.0% | 19% | 94% | 41.5% | 81.9% |
| Sep. | 61.4% | 13% | 96% | 34.1% | 79.8% | 65.6% | 23% | 91% | 40.7% | 81.2% | 58.2% | 10% | 94% | 34.9% | 74.8% |
| Oct. | 69.7% | 24% | 97% | 48.1% | 84.8% | 62.7% | 16% | 91% | 33.3% | 80.1% | 57.6% | 15% | 90% | 33.9% | 72.4% |
| Nov. | 60.7% | 23% | 89% | 37.3% | 75.0% | 75.3% | 19% | 100% | 54.5% | 87.4% | 64.2% | 18% | 92% | 40.6% | 80.0% |
| Dec. | 68.3% | 27% | 100% | 50.5% | 83.4% | 66.0% | 19% | 98% | 43.6% | 77.9% | 63.9% | 15% | 93% | 45.7% | 77.4% |
| 2020 | 2021 | |||||||||
|---|---|---|---|---|---|---|---|---|---|---|
| Average | Absolute Min. | Absolute Max. | Avg. Daily Min. | Avg. Daily Max. | Average | Absolute Min. | Absolute Max. | Avg. Daily Min. | Avg. Daily Max. | |
| Jan. | 11.07 °C | 2.1 °C | 32.3 °C | 7.97 °C | 17.66 °C | |||||
| Feb. | 15.52 °C | 8.2 °C | 32.3 °C | 11.63 °C | 21.70 °C | |||||
| Mar. | 15.06 °C | 4.2 °C | 34.3 °C | 10.18 °C | 22.68 °C | |||||
| Apr. | 21.99 °C | 6.8 °C | 27.9 °C | 20.84 °C | 23.35 °C | |||||
| May | ||||||||||
| Jun. | ||||||||||
| Jul. | ||||||||||
| Aug. | ||||||||||
| Sep. | ||||||||||
| Oct. | 17.55 °C | 7.5 °C | 34.5 °C | 13.28 °C | 24.17 °C | |||||
| Nov. | 17.86 °C | 6.6 °C | 35.7 °C | 12.66 °C | 27.70 °C | |||||
| Dec. | 12.62 °C | 5.8 °C | 30.7 °C | 9.59 °C | 18.72 °C | |||||
| 2020 | 2021 | |||||||||
|---|---|---|---|---|---|---|---|---|---|---|
| Average | Absolute Min. | Absolute Max. | Avg. Daily Min. | Avg. Daily Max. | Average | Absolute Min. | Absolute Max. | Avg. Daily Min. | Avg. Daily Max. | |
| Jan. | 66.1% | 17% | 94% | 46.7% | 79.4% | |||||
| Feb. | 56.0% | 16% | 84% | 37.8% | 71.9% | |||||
| Mar. | 54.5% | 10% | 84% | 33.9% | 70.2% | |||||
| Apr. | 22.4% | 15% | 76% | 18.9% | 26.5% | |||||
| May | ||||||||||
| Jun. | ||||||||||
| Jul. | ||||||||||
| Aug. | ||||||||||
| Sep. | ||||||||||
| Oct. | 63.2% | 22% | 89% | 42.7% | 78.2% | |||||
| Nov. | 54.7% | 18% | 82% | 32.1% | 70.2% | |||||
| Dec. | 62.5% | 20% | 88% | 44.0% | 77.4% | |||||
| 2020 | 2021 | |||||||||
|---|---|---|---|---|---|---|---|---|---|---|
| Average | Absolute Min. | Absolute Max. | Avg. Daily Min. | Avg. Daily Max. | Average | Absolute Min. | Absolute Max. | Avg. Daily Min. | Avg. Daily Max. | |
| Jan. | 12.20 °C | 3.9 °C | 29.6 °C | 9.24 °C | 18.10 °C | |||||
| Feb. | 16.06 °C | 9.0 °C | 32.4 °C | 12.63 °C | 22.26 °C | |||||
| Mar. | 15.56 °C | 6.2 °C | 35.0 °C | 11.11 °C | 22.69 °C | |||||
| Apr. | 16.24 °C | 5.3 °C | 30.4 °C | 11.60 °C | 22.61 °C | |||||
| May | 17.43 °C | 8.9 °C | 33.4 °C | 13.07 °C | 23.94 °C | |||||
| Jun. | 20.89 °C | 12.5 °C | 36.9 °C | 17.11 °C | 26.28 °C | |||||
| Jul. | 21.84 °C | 15.1 °C | 35.2 °C | 18.08 °C | 27.12 °C | |||||
| Aug. | 22.54 °C | 15.5 °C | 35.1 °C | 18.36 °C | 28.79 °C | |||||
| Sep. | 23.08 °C | 13.1 °C | 31.3 °C | 21.20 °C | 25.44 °C | 23.62 °C | 15.2 °C | 42.7 °C | 19.29 °C | 30.87 °C |
| Oct. | 17.65 °C | 9.8 °C | 33.7 °C | 13.79 °C | 23.80 °C | 19.82 °C | 10.5 °C | 37.6 °C | 14.28 °C | 29.05 °C |
| Nov. | 18.43 °C | 6.8 °C | 34.3 °C | 13.54 °C | 27.15 °C | |||||
| Dec. | 13.74 °C | 7.2 °C | 31.0 °C | 10.78 °C | 19.49 °C | |||||
| 2020 | 2021 | |||||||||
|---|---|---|---|---|---|---|---|---|---|---|
| Average | Absolute Min. | Absolute Max. | Avg. Daily Min. | Avg. Daily Max. | Average | Absolute Min. | Absolute Max. | Avg. Daily Min. | Avg. Daily Max. | |
| Jan. | 64.3% | 17% | 91% | 46.1% | 76.8% | |||||
| Feb. | 57.5% | 20% | 87% | 38.7% | 72.9% | |||||
| Mar. | 55.5% | 12% | 85% | 34.0% | 71.6% | |||||
| Apr. | 54.1% | 15% | 85% | 34.5% | 71.4% | |||||
| May | 62.5% | 25% | 87% | 39.8% | 80.0% | |||||
| Jun. | 68.3% | 31% | 88% | 49.5% | 82.8% | |||||
| Jul. | 68.5% | 29% | 89% | 50.0% | 82.7% | |||||
| Aug. | 67.1% | 26% | 91% | 45.5% | 82.6% | |||||
| Sep. | 62.1% | 30% | 86% | 51.8% | 71.0% | 64.3% | 22% | 85% | 41.5% | 79.5% |
| Oct. | 66.5% | 23% | 89% | 45.0% | 81.2% | 60.8% | 19% | 87% | 34.8% | 78.7% |
| Nov. | 56.7% | 22% | 84% | 35.1% | 71.8% | |||||
| Dec. | 62.1% | 20% | 84% | 43.2% | 75.9% | |||||
| Whole Period Analysis | ||||||||||
| Tlaundry < Text | Tlaundry ≈ Text | Tlaundry > Text | ΔT > 2 °C | ΔT > 4 °C | ΔT > 6 °C | ΔT > 8 °C | ΔT > 10 °C | ΔT > 12 °C | ||
| August 2020–December 2022 | 5.9% | 7.7% | 86.3% | 61.8% | 33.3% | 20.6% | 13.6% | 8.8% | 5.4% | |
| Yearly Analysis | ||||||||||
| Year | Tlaundry < Text | Tlaundry ≈ Text | Tlaundry > Text | ΔT > 2 °C | ΔT > 4 °C | ΔT > 6 °C | ΔT > 8 °C | ΔT > 10 °C | ΔT > 12 °C | |
| 2020 | 5.2% | 9.1% | 85.7% | 60.9% | 33.0% | 19.8% | 12.4% | 7.9% | 5.0% | |
| 2021 | 4.9% | 7.6% | 87.6% | 62.0% | 31.7% | 19.4% | 13.0% | 8.3% | 5.0% | |
| 2022 | 7.5% | 7.3% | 85.1% | 62.2% | 35.7% | 22.6% | 15.1% | 9.8% | 6.1% | |
| Monthly Analysis | ||||||||||
| Month | Tlaundry < Text | Tlaundry ≈ Text | Tlaundry > Text | ΔT > 2 °C | ΔT > 4 °C | ΔT > 6 °C | ΔT > 8 °C | ΔT > 10 °C | ΔT > 12 °C | |
| 2020 | Aug. 1 | 3.9% | 5.8% | 90.1% | 71.8% | 37.2% | 15.0% | 10.3% | 4.9% | 3.0% |
| Sep. | 5.7% | 6.9% | 87.4% | 74.9% | 47.6% | 24.7% | 14.2% | 8.3% | 5.4% | |
| Oct. | 3.8% | 5.4% | 90.9% | 66.1% | 29.0% | 10.8% | 5.4% | 3.0% | 1.3% | |
| Nov. | 1.9% | 5.8% | 92.2% | 74.9% | 45.0% | 23.3% | 11.8% | 7.6% | 5.0% | |
| Dec. | 1.2% | 8.1% | 90.7% | 55.4% | 20.3% | 3.6% | 1.2% | 0.5% | 0.1% | |
| 2021 | Jan. | 1.1% | 4.4% | 94.5% | 75.0% | 26.7% | 6.7% | 2.4% | 1.6% | 0.5% |
| Feb. | 3.7% | 9.8% | 86.5% | 58.8% | 21.1% | 6.0% | 3.9% | 1.5% | 1.0% | |
| Mar. | 4.8% | 4.4% | 90.7% | 69.9% | 38.8% | 20.3% | 10.9% | 6.3% | 4.7% | |
| Apr. | 3.8% | 4.2% | 92.1% | 74.6% | 43.1% | 23.8% | 14.2% | 8.3% | 5.8% | |
| May | 5.6% | 6.0% | 88.3% | 70.2% | 37.6% | 16.7% | 8.1% | 4.2% | 2.0% | |
| Jun. | 2.5% | 3.8% | 93.8% | 71.1% | 32.9% | 16.8% | 10.6% | 5.0% | 1.7% | |
| Jul. | 3.0% | 5.0% | 92.1% | 69.0% | 30.0% | 12.8% | 7.8% | 5.2% | 3.2% | |
| Aug. | 2.3% | 5.4% | 92.3% | 69.0% | 30.4% | 13.4% | 8.5% | 5.1% | 3.5% | |
| Sep. | 2.1% | 2.2% | 95.7% | 83.1% | 42.5% | 24.0% | 9.9% | 4.9% | 1.9% | |
| Oct. | 2.6% | 4.8% | 92.5% | 74.5% | 48.5% | 23.1% | 14.5% | 10.2% | 6.0% | |
| Nov. | 1.0% | 3.9% | 95.1% | 66.7% | 20.3% | 9.0% | 4.3% | 2.5% | 1.5% | |
| Dec. | 3.9% | 8.7% | 87.4% | 56.7% | 29.6% | 16.5% | 7.1% | 5.1% | 3.0% | |
| 2022 | Jan. | 2.7% | 3.1% | 94.2% | 74.6% | 46.5% | 24.1% | 12.0% | 7.5% | 4.4% |
| Feb. | 5.7% | 3.7% | 90.6% | 76.5% | 45.4% | 24.6% | 10.6% | 6.3% | 3.7% | |
| Mar. | 3.4% | 7.1% | 89.5% | 61.7% | 31.5% | 12.2% | 6.2% | 4.0% | 2.7% | |
| Apr. | 4.6% | 6.7% | 88.8% | 67.9% | 34.4% | 15.0% | 8.8% | 5.6% | 4.0% | |
| May | 6.5% | 5.4% | 88.0% | 62.2% | 32.4% | 16.4% | 9.7% | 6.5% | 3.2% | |
| Jun. | 5.0% | 4.9% | 90.1% | 69.3% | 29.2% | 12.8% | 7.6% | 4.3% | 1.8% | |
| Jul. | 6.6% | 5.8% | 87.5% | 70.8% | 41.4% | 23.8% | 12.6% | 8.1% | 5.6% | |
| Aug. | 3.4% | 5.0% | 91.4% | 70.4% | 35.5% | 16.1% | 7.0% | 3.6% | 1.6% | |
| Sep. | 3.3% | 4.0% | 92.6% | 78.6% | 51.1% | 31.0% | 17.6% | 7.6% | 5.0% | |
| Oct. | 0.8% | 5.2% | 94.0% | 76.9% | 38.0% | 17.1% | 8.3% | 5.1% | 3.8% | |
| Nov. | 0.7% | 5.1% | 94.2% | 75.3% | 37.4% | 14.0% | 6.7% | 3.8% | 2.5% | |
| Dec. | 0.7% | 7.3% | 92.1% | 62.8% | 25.4% | 5.5% | 2.8% | 1.6% | 1.2% | |
| Whole Period Analysis | ||||||||||
| Tlaundry < Text | Tlaundry ≈ Text | Tlaundry > Text | ΔT > 2 °C | ΔT > 4 °C | ΔT > 6 °C | ΔT > 8 °C | ΔT > 10 °C | ΔT > 12 °C | ||
| August 2020–December 2022 | 5.3% | 7.8% | 86.8% | 62.2% | 33.3% | 20.3% | 13.3% | 8.5% | 5.3% | |
| Yearly Analysis | ||||||||||
| Year | Tlaundry < Text | Tlaundry ≈ Text | Tlaundry > Text | ΔT > 2 °C | ΔT > 4 °C | ΔT > 6 °C | ΔT > 8 °C | ΔT > 10 °C | ΔT > 12 °C | |
| 2020 | 5.2% | 9.1% | 85.7% | 60.9% | 33.0% | 19.8% | 12.4% | 7.9% | 5.0% | |
| 2021 | 4.9% | 7.6% | 87.6% | 62.0% | 31.7% | 19.4% | 13.0% | 8.3% | 5.0% | |
| 2022 | 5.9% | 7.5% | 86.5% | 63.0% | 35.1% | 21.4% | 13.9% | 8.9% | 5.7% | |
| Monthly Analysis | ||||||||||
| Month | Tlaundry < Text | Tlaundry ≈ Text | Tlaundry > Text | ΔT > 2 °C | ΔT > 4 °C | ΔT > 6 °C | ΔT > 8 °C | ΔT > 10 °C | ΔT > 12 °C | |
| 2020 | Aug. 1 | 6.7% | 9.6% | 83.4% | 61.3% | 30.0% | 17.9% | 12.5% | 8.0% | 5.1% |
| Sep. | 9.0% | 10.5% | 80.5% | 61.4% | 41.7% | 27.9% | 19.3% | 12.9% | 9.3% | |
| Oct. | 6.0% | 7.6% | 86.4% | 57.6% | 29.5% | 16.4% | 9.2% | 5.1% | 2.3% | |
| Nov. | 3.1% | 7.9% | 89.0% | 71.0% | 44.5% | 32.1% | 19.5% | 13.1% | 8.6% | |
| Dec. | 1.6% | 9.9% | 88.5% | 53.5% | 18.9% | 4.8% | 1.8% | 0.9% | 0.2% | |
| 2021 | Jan. | 1.6% | 5.5% | 92.9% | 71.0% | 25.6% | 9.0% | 3.9% | 2.8% | 0.9% |
| Feb. | 6.1% | 11.0% | 82.9% | 54.8% | 21.9% | 9.2% | 6.6% | 2.6% | 1.8% | |
| Mar. | 8.3% | 7.6% | 84.1% | 57.6% | 32.9% | 22.1% | 17.1% | 10.8% | 8.1% | |
| Apr. | 6.2% | 6.7% | 87.1% | 67.1% | 40.0% | 24.5% | 19.5% | 14.0% | 10.0% | |
| May | 9.0% | 8.3% | 82.7% | 60.4% | 34.3% | 22.6% | 13.4% | 7.1% | 3.5% | |
| Jun. | 4.3% | 5.5% | 90.2% | 61.4% | 29.8% | 18.3% | 11.4% | 7.4% | 2.9% | |
| Jul. | 5.1% | 7.8% | 87.1% | 63.1% | 30.6% | 16.8% | 12.7% | 9.0% | 5.5% | |
| Aug. | 3.9% | 9.2% | 86.9% | 56.7% | 29.0% | 19.1% | 14.1% | 8.8% | 6.0% | |
| Sep. | 3.6% | 3.8% | 92.6% | 73.8% | 38.1% | 23.8% | 15.5% | 8.3% | 3.3% | |
| Oct. | 3.5% | 6.7% | 89.6% | 67.7% | 44.0% | 30.4% | 22.1% | 15.2% | 10.4% | |
| Nov. | 1.7% | 6.0% | 92.4% | 56.2% | 22.4% | 14.5% | 7.4% | 4.3% | 2.6% | |
| Dec. | 5.3% | 12.7% | 82.0% | 53.5% | 30.6% | 21.7% | 12.0% | 8.8% | 5.1% | |
| 2022 | Jan. | 4.6% | 3.9% | 91.5% | 67.3% | 42.9% | 28.8% | 19.8% | 12.9% | 7.6% |
| Feb. | 9.4% | 6.1% | 84.4% | 64.3% | 38.3% | 26.3% | 16.8% | 10.7% | 6.4% | |
| Mar. | 5.1% | 9.2% | 85.7% | 56.2% | 31.3% | 16.4% | 10.1% | 6.7% | 4.6% | |
| Apr. | 7.6% | 9.8% | 82.6% | 59.8% | 34.5% | 21.9% | 14.8% | 9.5% | 6.9% | |
| May | 10.4% | 7.8% | 81.6% | 55.1% | 31.1% | 21.9% | 16.1% | 11.1% | 5.5% | |
| Jun. | 8.3% | 6.4% | 85.2% | 64.3% | 32.6% | 17.9% | 12.6% | 7.4% | 3.1% | |
| Jul. | 11.3% | 8.5% | 80.0% | 61.1% | 38.5% | 25.3% | 17.5% | 12.9% | 9.7% | |
| Aug. | 5.8% | 8.1% | 85.7% | 61.3% | 30.0% | 19.8% | 12.0% | 6.2% | 2.8% | |
| Sep. | 5.5% | 5.7% | 88.8% | 70.7% | 42.1% | 25.2% | 16.7% | 11.2% | 8.6% | |
| Oct. | 0.9% | 8.5% | 90.6% | 66.8% | 39.4% | 24.4% | 14.3% | 8.8% | 6.5% | |
| Nov. | 1.0% | 6.7% | 92.4% | 71.0% | 36.2% | 20.0% | 11.4% | 6.4% | 4.3% | |
| Dec. | 0.9% | 9.2% | 89.9% | 59.2% | 24.9% | 9.0% | 4.8% | 2.8% | 2.1% | |
| Whole Period Analysis | ||||||||||
| Tlaundry < Text | Tlaundry ≈ Text | Tlaundry > Text | ΔT > 2 °C | ΔT > 4 °C | ΔT > 6 °C | ΔT > 8 °C | ΔT > 10 °C | ΔT > 12 °C | ||
| August 2020–December 2022 | 0.4% | 2.2% | 97.4% | 80.6% | 38.4% | 11.2% | 2.4% | 0.4% | 0.0% | |
| Yearly Analysis | ||||||||||
| Year | Tlaundry < Text | Tlaundry ≈ Text | Tlaundry > Text | ΔT > 2 °C | ΔT > 4 °C | ΔT > 6 °C | ΔT > 8 °C | ΔT > 10 °C | ΔT > 12 °C | |
| 2020 | 0.6% | 2.8% | 96.7% | 78.8% | 39.3% | 9.2% | 2.8% | 0.5% | 0.0% | |
| 2021 | 0.4% | 1.9% | 97.6% | 81.0% | 36.2% | 10.8% | 2.2% | 0.4% | 0.0% | |
| 2022 | 0.4% | 2.2% | 97.5% | 81.0% | 40.3% | 12.4% | 2.5% | 0.4% | 0.0% | |
| Monthly Analysis | ||||||||||
| Month | Tlaundry < Text | Tlaundry ≈ Text | Tlaundry > Text | ΔT > 2 °C | ΔT > 4 °C | ΔT > 6 °C | ΔT > 8 °C | ΔT > 10 °C | ΔT > 12 °C | |
| 2020 | Aug. 1 | 0.0% | 0.5% | 99.5% | 86.5% | 47.3% | 10.8% | 7.2% | 0.5% | 0.0% |
| Sep. | 1.0% | 2.0% | 97.0% | 93.7% | 56.0% | 20.3% | 7.0% | 2.0% | 0.0% | |
| Oct. | 0.6% | 2.3% | 97.1% | 78.1% | 28.4% | 2.9% | 0.0% | 0.0% | 0.0% | |
| Nov. | 0.3% | 3.0% | 96.7% | 80.3% | 45.7% | 11.0% | 1.0% | 0.0% | 0.0% | |
| Dec. | 0.6% | 5.5% | 93.9% | 58.1% | 22.3% | 1.9% | 0.3% | 0.0% | 0.0% | |
| 2021 | Jan. | 0.3% | 2.9% | 96.8% | 80.6% | 28.4% | 3.5% | 0.3% | 0.0% | 0.0% |
| Feb. | 0.4% | 8.2% | 91.4% | 64.3% | 20.0% | 1.4% | 0.0% | 0.0% | 0.0% | |
| Mar. | 0.0% | 0.0% | 100.0% | 87.1% | 47.1% | 17.7% | 2.3% | 0.0% | 0.0% | |
| Apr. | 0.3% | 0.7% | 99.0% | 85.0% | 47.3% | 22.7% | 6.7% | 0.3% | 0.0% | |
| May | 1.0% | 2.9% | 96.1% | 83.9% | 42.3% | 8.4% | 0.6% | 0.0% | 0.0% | |
| Jun. | 0.0% | 1.3% | 98.7% | 84.7% | 37.3% | 14.7% | 9.3% | 1.7% | 0.0% | |
| Jul. | 0.0% | 1.0% | 99.0% | 77.1% | 29.0% | 7.1% | 1.0% | 0.0% | 0.0% | |
| Aug. | 0.0% | 0.0% | 100.% | 86.1% | 32.3% | 5.5% | 0.6% | 0.0% | 0.0% | |
| Sep. | 0.0% | 0.0% | 100% | 96.0% | 48.7% | 24.3% | 2.0% | 0.0% | 0.0% | |
| Oct. | 1.3% | 2.3% | 96.5% | 83.9% | 54.8% | 12.9% | 3.9% | 3.2% | 0.0% | |
| Nov. | 0.0% | 1.0% | 99.0% | 81.3% | 17.3% | 1.3% | 0.0% | 0.0% | 0.0% | |
| Dec. | 1.9% | 3.2% | 94.8% | 61.3% | 28.1% | 9.4% | 0.3% | 0.0% | 0.0% | |
| 2022 | Jan. | 0.0% | 1.9% | 98.1% | 84.8% | 51.6% | 17.4% | 1.0% | 0.0% | 0.0% |
| Feb. | 0.4% | 0.4% | 99.3% | 93.6% | 55.4% | 22.1% | 1.8% | 0.0% | 0.0% | |
| Mar. | 1.0% | 4.2% | 94.8% | 69.4% | 31.6% | 6.5% | 0.6% | 0.3% | 0.0% | |
| Apr. | 0.3% | 2.3% | 97.3% | 79.3% | 34.3% | 5.3% | 0.3% | 0.0% | 0.0% | |
| May | 1.0% | 1.9% | 97.1% | 72.3% | 34.2% | 8.7% | 0.6% | 0.0% | 0.0% | |
| Jun. | 0.3% | 2.7% | 97.0% | 76.3% | 24.3% | 5.7% | 0.7% | 0.0% | 0.0% | |
| Jul. | 0.0% | 1.9% | 98.1% | 84.5% | 45.5% | 21.6% | 5.8% | 1.3% | 0.0% | |
| Aug. | 0.0% | 0.6% | 99.4% | 83.2% | 43.2% | 11.0% | 0.0% | 0.0% | 0.0% | |
| Sep. | 0.3% | 1.7% | 98.0% | 89.7% | 63.7% | 39.0% | 19.0% | 2.7% | 0.0% | |
| Oct. | 0.6% | 0.6% | 98.7% | 91.0% | 36.1% | 6.8% | 0.0% | 0.0% | 0.0% | |
| Nov. | 0.3% | 3.0% | 96.7% | 81.3% | 39.0% | 5.7% | 0.0% | 0.0% | 0.0% | |
| Dec. | 0.3% | 4.5% | 95.2% | 67.7% | 26.1% | 0.6% | 0.0% | 0.0% | 0.0% | |
| Whole Period Analysis | ||||||||||
| Tlaundry < Text | Tlaundry ≈ Text | Tlaundry > Text | ΔT > 2 °C | ΔT > 4 °C | ΔT > 6 °C | ΔT > 8 °C | ΔT > 10 °C | ΔT > 12 °C | ||
| Whole available period | 0.0% | 0.3% | 99.7% | 84.8% | 38.7% | 18.4% | 10.4% | 6.3% | 4.1% | |
| Yearly Analysis | ||||||||||
| Year | Tlaundry < Text | Tlaundry ≈ Text | Tlaundry > Text | ΔT > 2 °C | ΔT > 4 °C | ΔT > 6 °C | ΔT > 8 °C | ΔT > 10 °C | ΔT > 12 °C | |
| 2019 1 | 0.0% | 1.2% | 98.8% | 79.6% | 31.6% | 15.3% | 11.6% | 7.7% | 5.5% | |
| 2020 1 | 0.0% | 0.3% | 99.7% | 83.7% | 39.0% | 19.0% | 10.5% | 6.4% | 4.3% | |
| 2021 1 | 0.0% | 0.2% | 99.8% | 87.7% | 40.0% | 18.5% | 10.1% | 5.8% | 3.5% | |
| Monthly Analysis | ||||||||||
| Month | Tlaundry < Text | Tlaundry ≈ Text | Tlaundry > Text | ΔT > 2 °C | ΔT > 4 °C | ΔT > 6 °C | ΔT > 8 °C | ΔT > 10 °C | ΔT > 12 °C | |
| 2019 | Dec. | 0.0% | 1.2% | 98.8% | 79.6% | 31.6% | 15.3% | 4.8% | 7.7% | 5.5% |
| 2020 | Jan. | 0.0% | 0.7% | 99.3% | 77.3% | 30.2% | 13.8% | 10.2% | 7.7% | 6.2% |
| Feb. | 0.0% | 0.1% | 99.9% | 86.5% | 45.1% | 26.1% | 14.7% | 8.9% | 5.3% | |
| Mar. 1 | 0.0% | 0.0% | 100.0% | 78.1% | 22.3% | 9.6% | 5.8% | 3.1% | 1.9% | |
| Apr. | ||||||||||
| May | ||||||||||
| Jun. | ||||||||||
| Jul. | ||||||||||
| Aug. | ||||||||||
| Sep. 1 | 0.0% | 0.0% | 100.0% | 99.4% | 83.0% | 34.7% | 7.4% | 4.0% | 2.3% | |
| Oct. | 0.0% | 0.0% | 100.0% | 89.7% | 39.7% | 17.9% | 7.8% | 3.6% | 2.3% | |
| Nov. | 0.0% | 0.0% | 100.0% | 89.6% | 54.7% | 29.2% | 17.8% | 11.5% | 7.8% | |
| Dec. | 0.0% | 0.8% | 99.2% | 73.9% | 21.8% | 8.1% | 4.8% | 2.6% | 1.6% | |
| 2021 | Jan. | 0.0% | 0.1% | 99.9% | 83.3% | 23.4% | 9.1% | 5.8% | 2.8% | 1.9% |
| Feb. | 0.0% | 0.7% | 99.3% | 76.2% | 25.7% | 10.6% | 3.1% | 1.6% | 0.9% | |
| Mar. | 0.0% | 0.0% | 100.0% | 93.7% | 44.5% | 19.1% | 8.5% | 3.8% | 1.7% | |
| Apr. | 0.0% | 0.0% | 100.0% | 98.8% | 50.6% | 26.8% | 16.1% | 11.9% | 7.7% | |
| May | ||||||||||
| Jun. | ||||||||||
| Jul. | ||||||||||
| Aug. | ||||||||||
| Sep. 1 | 0.0% | 0.0% | 100.0% | 100.0% | 100.0% | 92.9% | 50.0% | 35.7% | 7.1% | |
| Oct. | 0.0% | 0.0% | 100.0% | 93.7% | 61.3% | 31.3% | 20.4% | 12.8% | 8.2% | |
| Whole Period Analysis | ||||||||||
| Tlaundry < Text | Tlaundry ≈ Text | Tlaundry > Text | ΔT > 2 °C | ΔT > 4 °C | ΔT > 6 °C | ΔT > 8 °C | ΔT > 10 °C | ΔT > 12 °C | ||
| Whole available period | 0.0% | 0.1% | 99.9% | 88.0% | 50.1% | 28.4% | 17.3% | 10.7% | 7.0% | |
| Yearly Analysis | ||||||||||
| Year | Tlaundry < Text | Tlaundry ≈ Text | Tlaundry > Text | ΔT > 2 °C | ΔT > 4 °C | ΔT > 6 °C | ΔT > 8 °C | ΔT > 10 °C | ΔT > 12 °C | |
| 2019 1 | 0.0% | 0.0% | 100.0% | 79.7% | 43.3% | 25.6% | 19.8% | 13.1% | 9.4% | |
| 2020 1 | 0.0% | 0.2% | 99.8% | 87.0% | 51.0% | 28.3% | 17.4% | 10.9% | 7.4% | |
| 2021 1 | 0.0% | 0.0% | 100.0% | 91.2% | 50.7% | 29.3% | 16.5% | 9.8% | 5.9% | |
| Monthly Analysis | ||||||||||
| Month | Tlaundry < Text | Tlaundry ≈ Text | Tlaundry > Text | ΔT > 2 °C | ΔT > 4 °C | ΔT > 6 °C | ΔT > 8 °C | ΔT > 10 °C | ΔT > 12 °C | |
| 2019 | Dec. | 0.0% | 0.0% | 100.0% | 23.7% | 43.3% | 25.6% | 19.8% | 13.1% | 9.4% |
| 2020 | Jan. | 0.0% | 0.7% | 99.3% | 80.9% | 44.0% | 23.0% | 17.5% | 13.1% | 10.6% |
| Feb. | 0.0% | 0.0% | 100.0% | 92.4% | 59.6% | 37.2% | 23.2% | 15.0% | 9.1% | |
| Mar. 1 | 0.0% | 0.0% | 100.0% | 86.2% | 36.8% | 16.4% | 9.9% | 5.3% | 3.3% | |
| Apr. | ||||||||||
| May | ||||||||||
| Jun. | ||||||||||
| Jul. | ||||||||||
| Aug. | ||||||||||
| Sep. 1 | 0.0% | 0.0% | 100.0% | 99.0% | 82.7% | 33.7% | 12.5% | 6.7% | 3.8% | |
| Oct. | 0.0% | 0.0% | 100.0% | 89.9% | 53.5% | 27.0% | 13.1% | 6.2% | 3.9% | |
| Nov. | 0.0% | 0.0% | 100.0% | 91.4% | 66.0% | 44.3% | 29.5% | 19.3% | 13.3% | |
| Dec. | 0.0% | 0.5% | 99.5% | 78.6% | 30.2% | 13.8% | 8.3% | 4.4% | 2.8% | |
| 2021 | Jan. | 0.0% | 0.0% | 100.0% | 84.6% | 34.1% | 15.4% | 9.7% | 4.6% | 3.2% |
| Feb. | 0.0% | 0.0% | 100.0% | 85.7% | 37.8% | 17.6% | 5.4% | 2.8% | 1.5% | |
| Mar. | 0.0% | 0.0% | 100.0% | 94.5% | 51.6% | 30.2% | 13.1% | 6.5% | 3.0% | |
| Apr. | 0.0% | 0.0% | 100.0% | 100.0% | 58.2% | 38.8% | 24.5% | 18.4% | 11.2% | |
| May | ||||||||||
| Jun. | ||||||||||
| Jul. | ||||||||||
| Aug. | ||||||||||
| Sep. 1 | 0.0% | 0.0% | 100.0% | 100.0% | 100.0% | 91.7% | 41.7% | 41.7% | 8.3% | |
| Oct. | 0.0% | 0.0% | 100.0% | 97.2% | 74.9% | 49.1% | 34.1% | 21.9% | 14.1% | |
| Whole Period Analysis | ||||||||||
| Tlaundry < Text | Tlaundry ≈ Text | Tlaundry > Text | ΔT > 2 °C | ΔT > 4 °C | ΔT > 6 °C | ΔT > 8 °C | ΔT > 10 °C | ΔT > 12 °C | ||
| Whole available period | 0.0% | 0.7% | 99.3% | 80.5% | 22.6% | 4.4% | 0.9% | 0.2% | 0.1% | |
| Yearly Analysis | ||||||||||
| Year | Tlaundry < Text | Tlaundry ≈ Text | Tlaundry > Text | ΔT > 2 °C | ΔT > 4 °C | ΔT > 6 °C | ΔT > 8 °C | ΔT > 10 °C | ΔT > 12 °C | |
| 2019 1 | 0.0% | 2.9% | 97.1% | 79.4% | 15.2% | 1.0% | 0.0% | 0.0% | 0.0% | |
| 2020 1 | 0.0% | 0.4% | 99.6% | 78.9% | 22.3% | 5.9% | 0.8% | 0.2% | 0.0% | |
| 2021 1 | 0.0% | 0.5% | 99.5% | 82.8% | 24.9% | 3.4% | 1.2% | 0.2% | 0.2% | |
| Monthly Analysis | ||||||||||
| Month | Tlaundry < Text | Tlaundry ≈ Text | Tlaundry > Text | ΔT > 2 °C | ΔT > 4 °C | ΔT > 6 °C | ΔT > 8 °C | ΔT > 10 °C | ΔT > 12 °C | |
| 2019 | Dec. | 0.0% | 2.9% | 97.1% | 79.4% | 15.2% | 1.0% | 0.0% | 0.0% | 0.0% |
| 2020 | Jan. | 0.0% | 0.6% | 99.4% | 72.3% | 11.0% | 1.0% | 0.0% | 0.0% | 0.0% |
| Feb. | 0.0% | 0.3% | 99.7% | 78.3% | 24.8% | 10.7% | 2.8% | 0.3% | 0.0% | |
| Mar. 1 | 0.0% | 0.0% | 100.0% | 66.7% | 1.9% | 0.0% | 0.0% | 0.0% | 0.0% | |
| Apr. | ||||||||||
| May | ||||||||||
| Jun. | ||||||||||
| Jul. | ||||||||||
| Aug. | ||||||||||
| Sep. 1 | 0.0% | 0.0% | 100.0% | 100.0% | 83.3% | 36.1% | 0.0% | 0.0% | 0.0% | |
| Oct. | 0.0% | 0.0% | 100.0% | 89.4% | 20.3% | 5.2% | 0.3% | 0.0% | 0.0% | |
| Nov. | 0.0% | 0.0% | 100.0% | 87.0% | 39.0% | 8.0% | 1.3% | 0.7% | 0.0% | |
| Dec. | 0.0% | 1.3% | 98.7% | 67.4% | 10.0% | 0.0% | 0.0% | 0.0% | 0.0% | |
| 2021 | Jan. | 0.0% | 0.3% | 99.7% | 81.6% | 8.4% | 0.3% | 0.3% | 0.3% | 0.0% |
| Feb. | 0.0% | 1.8% | 98.2% | 62.9% | 8.9% | 0.7% | 0.0% | 0.0% | 0.0% | |
| Mar. | 0.0% | 0.0% | 100.0% | 92.6% | 34.5% | 3.5% | 1.9% | 0.0% | 0.0% | |
| Apr. | 0.0% | 0.0% | 100.0% | 97.1% | 40.0% | 10.0% | 4.3% | 2.9% | 2.9% | |
| May | ||||||||||
| Jun. | ||||||||||
| Jul. | ||||||||||
| Aug. | ||||||||||
| Sep. 1 | 0.0% | 0.0% | 100.0% | 100.0% | 100.0% | 100.0% | 100.0% | 0.0% | 0.0% | |
| Oct. | 0.0% | 0.0% | 100.0% | 88.7% | 42.3% | 6.5% | 1.3% | 0.0% | 0.0% | |
| Whole Period Analysis | ||||||||||
| Tlaundry < Text | Tlaundry ≈ Text | Tlaundry > Text | ΔT > 2 °C | ΔT > 4 °C | ΔT > 6 °C | ΔT > 8 °C | ΔT > 10 °C | ΔT > 12 °C | ||
| Whole available period | 1.0% | 1.4% | 97.5% | 89.4% | 55.3% | 19.7% | 8.2% | 4.0% | 1.5% | |
| Yearly Analysis | ||||||||||
| Year | Tlaundry < Text | Tlaundry ≈ Text | Tlaundry > Text | ΔT > 2 °C | ΔT > 4 °C | ΔT > 6 °C | ΔT > 8 °C | ΔT > 10 °C | ΔT > 12 °C | |
| 2020 1 | 2.4% | 1.3% | 96.3% | 87.4% | 58.6% | 26.4% | 13.8% | 7.2% | 2.9% | |
| 2021 1 | 0.5% | 1.5% | 98.0% | 90.2% | 54.1% | 17.1% | 6.1% | 2.7% | 0.9% | |
| Monthly Analysis | ||||||||||
| Month | Tlaundry < Text | Tlaundry ≈ Text | Tlaundry > Text | ΔT > 2 °C | ΔT > 4 °C | ΔT > 6 °C | ΔT > 8 °C | ΔT > 10 °C | ΔT > 12 °C | |
| 2020 | Sep. 1 | 10.1% | 3.0% | 86.8% | 80.0% | 60.8% | 36.6% | 18.0% | 5.4% | 0.6% |
| Oct. | 0.1% | 1.6% | 98.3% | 87.5% | 50.1% | 18.4% | 8.9% | 4.8% | 0.3% | |
| Nov. | 0.0% | 0.4% | 99.6% | 92.4% | 71.3% | 37.1% | 21.5% | 14.4% | 8.6% | |
| Dec. | 0.0% | 0.3% | 99.7% | 89.0% | 52.7% | 15.1% | 7.4% | 4.3% | 2.2% | |
| 2021 | Jan. | 0.1% | 0.3% | 99.6% | 91.9% | 59.7% | 18.4% | 7.4% | 4.6% | 2.3% |
| Feb. | 0.4% | 2.5% | 97.0% | 83.2% | 43.0% | 13.2% | 6.4% | 2.4% | 0.9% | |
| Mar. | 0.7% | 0.8% | 98.5% | 93.5% | 63.6% | 28.6% | 8.7% | 3.1% | 0.4% | |
| Apr. | 0.0% | 1.3% | 98.8% | 92.6% | 66.0% | 21.0% | 4.7% | 0.7% | 0.0% | |
| May | 1.7% | 2.3% | 96.0% | 87.5% | 47.0% | 8.6% | 1.2% | 0.3% | 0.1% | |
| Jun. | 0.4% | 2.2% | 97.4% | 86.8% | 35.3% | 4.6% | 1.1% | 0.0% | 0.0% | |
| Jul. | 0.4% | 1.5% | 98.1% | 90.1% | 35.6% | 3.6% | 0.1% | 0.0% | 0.0% | |
| Aug. | 0.3% | 1.7% | 98.0% | 91.4% | 50.0% | 11.6% | 1.1% | 0.0% | 0.0% | |
| Sep. | 0.8% | 1.0% | 98.2% | 95.1% | 69.2% | 23.9% | 6.7% | 1.3% | 0.4% | |
| Oct. | 0.3% | 1.7% | 98.0% | 89.2% | 69.4% | 36.3% | 21.6% | 12.9% | 4.6% | |
| Whole Period Analysis | ||||||||||
| Tlaundry < Text | Tlaundry ≈ Text | Tlaundry > Text | ΔT > 2 °C | ΔT > 4 °C | ΔT > 6 °C | ΔT > 8 °C | ΔT > 10 °C | ΔT > 12 °C | ||
| Whole available period | 1.7% | 2.0% | 96.2% | 86.8% | 56.7% | 25.7% | 12.2% | 6.2% | 2.5% | |
| Yearly Analysis | ||||||||||
| Year | Tlaundry < Text | Tlaundry ≈ Text | Tlaundry > Text | ΔT > 2 °C | ΔT > 4 °C | ΔT > 6 °C | ΔT > 8 °C | ΔT > 10 °C | ΔT > 12 °C | |
| 2020 1 | 4.1% | 2.0% | 94.0% | 83.7% | 56.7% | 31.2% | 17.8% | 10.5% | 4.8% | |
| 2021 1 | 0.8% | 2.1% | 97.1% | 88.0% | 56.7% | 23.6% | 9.9% | 4.5% | 1.6% | |
| Monthly Analysis | ||||||||||
| Month | Tlaundry < Text | Tlaundry ≈ Text | Tlaundry > Text | ΔT > 2 °C | ΔT > 4 °C | ΔT > 6 °C | ΔT > 8 °C | ΔT > 10 °C | ΔT > 12 °C | |
| 2020 | Sep. 1 | 17.2% | 4.9% | 77.9% | 67.6% | 43.7% | 22.1% | 6.4% | 1.5% | 0.0% |
| Oct. | 0.2% | 2.3% | 97.5% | 84.3% | 53.2% | 28.3% | 15.0% | 8.1% | 0.5% | |
| Nov. | 0.0% | 0.7% | 99.3% | 93.1% | 75.0% | 51.9% | 36.7% | 24.5% | 14.8% | |
| Dec. | 0.0% | 0.2% | 99.8% | 88.2% | 54.1% | 22.1% | 12.7% | 7.4% | 3.7% | |
| 2021 | Jan. | 0.0% | 0.5% | 99.5% | 91.5% | 59.2% | 23.3% | 12.2% | 7.8% | 3.9% |
| Feb. | 0.8% | 3.3% | 95.9% | 83.2% | 45.9% | 21.2% | 11.0% | 4.1% | 1.5% | |
| Mar. | 1.2% | 1.4% | 97.5% | 88.9% | 59.7% | 33.9% | 13.6% | 5.1% | 0.7% | |
| Apr. | 0.0% | 2.1% | 97.9% | 90.0% | 67.9% | 28.1% | 7.9% | 1.2% | 0.0% | |
| May | 2.8% | 2.5% | 94.7% | 86.2% | 49.5% | 11.3% | 1.6% | 0.5% | 0.2% | |
| Jun. | 0.7% | 3.1% | 96.2% | 85.0% | 42.1% | 6.7% | 1.2% | 0.0% | 0.0% | |
| Jul. | 0.7% | 2.1% | 97.2% | 87.1% | 41.9% | 4.8% | 0.2% | 0.0% | 0.0% | |
| Aug. | 0.5% | 3.0% | 96.5% | 88.0% | 54.4% | 18.2% | 1.8% | 0.0% | 0.0% | |
| Sep. | 1.4% | 1.2% | 97.4% | 92.6% | 72.1% | 33.8% | 11.4% | 2.1% | 0.7% | |
| Oct. | 0.5% | 1.8% | 97.7% | 87.8% | 71.7% | 52.1% | 35.5% | 22.1% | 7.8% | |
| Whole Period Analysis | ||||||||||
| Tlaundry < Text | Tlaundry ≈ Text | Tlaundry > Text | ΔT > 2 °C | ΔT > 4 °C | ΔT > 6 °C | ΔT > 8 °C | ΔT > 10 °C | ΔT > 12 °C | ||
| Whole available period | 0.0% | 0.6% | 99.3% | 93.1% | 53.4% | 11.3% | 2.7% | 0.8% | 0.1% | |
| Yearly Analysis | ||||||||||
| Year | Tlaundry < Text | Tlaundry ≈ Text | Tlaundry > Text | ΔT > 2 °C | ΔT > 4 °C | ΔT > 6 °C | ΔT > 8 °C | ΔT > 10 °C | ΔT > 12 °C | |
| 2020 1 | 0.0% | 0.3% | 99.7% | 92.6% | 61.2% | 19.7% | 8.1% | 2.7% | 0.3% | |
| 2021 1 | 0.1% | 0.7% | 99.2% | 93.3% | 50.4% | 8.1% | 0.7% | 0.0% | 0.0% | |
| Monthly Analysis | ||||||||||
| Month | Tlaundry < Text | Tlaundry ≈ Text | Tlaundry > Text | ΔT > 2 °C | ΔT > 4 °C | ΔT > 6 °C | ΔT > 8 °C | ΔT > 10 °C | ΔT > 12 °C | |
| 2020 | Sep. 1 | 0.0% | 0.4% | 99.6% | 97.8% | 85.3% | 57.4% | 34.6% | 11.0% | 1.5% |
| Oct. | 0.0% | 0.6% | 99.4% | 91.9% | 45.8% | 4.5% | 0.3% | 0.3% | 0.0% | |
| Nov. | 0.0% | 0.0% | 100.0% | 91.3% | 66.0% | 16.3% | 0.3% | 0.3% | 0.0% | |
| Dec. | 0.0% | 0.3% | 99.7% | 90.0% | 50.6% | 5.2% | 0.0% | 0.0% | 0.0% | |
| 2021 | Jan. | 0.3% | 0.0% | 99.7% | 92.6% | 60.3% | 11.6% | 0.6% | 0.0% | 0.0% |
| Feb. | 0.0% | 1.4% | 98.6% | 83.2% | 38.9% | 2.1% | 0.0% | 0.0% | 0.0% | |
| Mar. | 0.0% | 0.0% | 100.0% | 100.0% | 69.0% | 21.3% | 1.9% | 0.3% | 0.0% | |
| Apr. | 0.0% | 0.0% | 100.0% | 96.3% | 63.3% | 11.0% | 0.3% | 0.0% | 0.0% | |
| May | 0.3% | 1.9% | 97.7% | 89.4% | 43.5% | 4.8% | 0.6% | 0.0% | 0.0% | |
| Jun. | 0.0% | 1.0% | 99.0% | 89.3% | 25.7% | 1.7% | 1.0% | 0.0% | 0.0% | |
| Jul. | 0.0% | 0.6% | 99.4% | 94.2% | 26.8% | 1.9% | 0.0% | 0.0% | 0.0% | |
| Aug. | 0.0% | 0.0% | 100.0% | 96.1% | 43.9% | 2.3% | 0.0% | 0.0% | 0.0% | |
| Sep. | 0.0% | 0.7% | 99.3% | 98.7% | 65.0% | 10.0% | 0.0% | 0.0% | 0.0% | |
| Oct. | 0.0% | 1.6% | 98.4% | 91.3% | 66.1% | 14.2% | 2.3% | 0.0% | 0.0% | |
References
- Kumar, S.; Fisk, W.J. IEQ and the Impact on Building Occupants. ASHRAE J. 2002, 44, 50–52. Available online: https://www.osti.gov/biblio/803790 (accessed on 20 November 2022).
- Heat Stress Related Illness|NIOSH|CDC. Available online: https://www.cdc.gov/niosh/topics/heatstress/heatrelillness.html (accessed on 21 November 2022).
- Excess Mortality during Heat-Periods-Office for National Statistics. Available online: https://www.ons.gov.uk/peoplepopulationandcommunity/birthsdeathsandmarriages/deaths/articles/excessmortalityduringheatperiods/englandandwales1juneto31august2022#excess-mortality-during-heat-periods-data (accessed on 21 November 2022).
- Lawrance, E.; Thompson, R.; Fontana, G.; Jennings, N. The Impact of Climate Change on Mental Health and Emotional Wellbeing: Current Evidence and Implications for Policy and Practice, London. 2021. Available online: https://spiral.imperial.ac.uk/bitstream/10044/1/88568/9/3343%20Climate%20change%20and%20mental%20health%20BP36_v6.pdf (accessed on 21 November 2022).
- Heat Mortality Monitoring Report: 2020-GOV.UK. Available online: https://www.gov.uk/government/publications/heat-mortality-monitoring-reports/heat-mortality-monitoring-report-2020#heatwave-and-covid-19 (accessed on 21 November 2023).
- Lin, Z.; Deng, S. A questionnaire survey on sleeping thermal environment and bedroom air conditioning in high-rise residences in Hong Kong. Energy Build. 2006, 38, 1302–1307. [Google Scholar] [CrossRef]
- Zheng, G.; Li, K.; Wang, Y. The Effects of High-Temperature Weather on Human Sleep Quality and Appetite. Int. J. Environ. Res. Public Health 2019, 16, 270. [Google Scholar] [CrossRef] [PubMed]
- Mullington, J.M.; Haack, M.; Toth, M.; Serrador, J.M.; Meier-Ewert, H.K. Cardiovascular, Inflammatory, and Metabolic Consequences of Sleep Deprivation. Prog. Cardiovasc. Dis. 2009, 51, 294–302. [Google Scholar] [CrossRef] [PubMed]
- Okamoto-Mizuno, K.; Mizuno, K. Effects of thermal environment on sleep and circadian rhythm. J. Physiol. Anthropol. 2012, 31, 14. [Google Scholar] [CrossRef] [PubMed]
- Mayrhofer, L.; Müller, A.; Bügelmayer-Blaschek, M.; Malla, A.; Kranzl, L. Modelling the effect of passive cooling measures on future energy needs for the Austrian building stock. Energy Build. 2023, 296, 113333. [Google Scholar] [CrossRef]
- Miranda, N.D.; Lizana, J.; Sparrow, S.N.; Zachau-Walker, M.; Watson, P.A.G.; Wallom, D.C.H.; Khosla, R.; McCulloch, M. Change in cooling degree days with global mean temperature rise increasing from 1.5 °C to 2.0 °C. Nat. Sustain. 2023, 6, 1326–1330. [Google Scholar] [CrossRef]
- Kapeller, R.; Bügelmayer-Blaschek, M.; Herndler, B.; Kranzl, L.; Müller, A.; Moser, S.; Natiesta, T.; Reichl, J.; Schwalbe, R. The effects of climate change-induced cooling demand on power grids. Energy Rep. 2024, 11, 674–691. [Google Scholar] [CrossRef]
- Hao, L.; Herrera-Avellanosa, D.; Del Pero, C.; Troi, A. Overheating Risks and Adaptation Strategies of Energy Retrofitted Historic Buildings under the Impact of Climate Change: Case Studies in Alpine Region. Appl. Sci. 2022, 12, 7162. [Google Scholar] [CrossRef]
- Borghero, L.; Clèries, E.; Péan, T.; Ortiz, J.; Salom, J. Comparing cooling strategies to assess thermal comfort resilience of residential buildings in Barcelona for present and future heatwaves. Build. Environ. 2023, 231, 110043. [Google Scholar] [CrossRef]
- Jaysawal, R.K.; Chakraborty, S.; Elangovan, D. Padmanaban, Concept of net zero energy buildings (NZEB)—A literature review. Clean Eng. Technol. 2022, 11, 100582. [Google Scholar] [CrossRef]
- Taylor, J.; McLeod, R.; Petrou, G.; Hopfe, C.; Mavrogianni, A.; Castaño-Rosa, R.; Pelsmakers, S.; Lomas, K. Ten questions concerning residential overheating in Central and Northern Europe. Build. Environ. 2023, 234, 110154. [Google Scholar] [CrossRef]
- Moreno-Rangel, A. Passivhaus. Encyclopedia 2021, 1, 20–29. [Google Scholar] [CrossRef]
- Observatoire BCC. Etude sur les Solutions Techniques et les Coûts Associés aux Labels Effinergie. 2022. Available online: https://www.effinergie.org/web/images/attach/base_doc/3112/20220419_Rapport%20LC.pdf (accessed on 29 November 2023).
- Attia, S.; Benzidane, C.; Rahif, R.; Amaripadath, D.; Hamdy, M.; Holzer, P.; Koch, A.; Maas, A.; Moosberger, S.; Petersen, S.; et al. Overheating calculation methods, criteria, and indicators in European regulation for residential buildings. Energy Build. 2023, 292, 113170. [Google Scholar] [CrossRef]
- Rodríguez-Vidal, I.; Otaegi, J.; Oregi, X. Thermal Comfort in NZEB Collective Housing in Northern Spain. Sustainability 2020, 12, 9630. [Google Scholar] [CrossRef]
- Otaegi, J.; Hernández, R.J.; Oregi, X.; Martín-Garín, A.; Rodríguez-Vidal, I. Comparative Analysis of the Effect of the Evolution of Energy Saving Regulations on the Indoor Summer Comfort of Five Homes on the Coast of the Basque Country. Buildings 2022, 12, 1047. [Google Scholar] [CrossRef]
- Coop, K.S. Annex IV. Urban Renewal Areas. Documento de Aprobación Inicial del PTP del Área Funcional de Bilbao Metropolitano. 2023. Available online: https://www.bizkaia.eus/hirigintza/lurraldekozatiegitasmoa/ptp_bilbao_aprobacion_provisional/ESCRITA/CAST/Anexos_normas/ANEXO%20IV_Reg_Ren_Rehab.pdf (accessed on 29 November 2023).
- VISESA. Bolueta Tower 1 in the VISESA Database. Available online: https://apps.visesa.eus/app/promociones-detalle.asp?id=7363&idioma=1 (accessed on 29 November 2023).
- VISESA. Bolueta Tower 2 in the VISESA Database. Available online: https://apps.visesa.eus/app/promociones-detalle.asp?id=8099&idioma=1 (accessed on 29 November 2023).
- Passive House Database, Passive House Database. 2018. Available online: https://passivehouse-database.org/index.php?lang=en#d_5233 (accessed on 26 November 2023).
- VISESA. Bolueta Urban Renewal Project Feature Page at the VISESA Website. Available online: https://www.visesa.euskadi.eus/bolueta/ (accessed on 29 November 2023).
- Celada Ortiz de Apodaka, L.A.; Tina Galdós, F.J.; La Peña Irigoyen, H. Passivhaus en altura en Bolueta-Bilbao. Proyecto de 361 VPO, Sociales y Tasadas en dos Bloques (28 y 21 Alturas Sobrer Rasante) Cumple estándares Passivhaus. In CONTART 2018: VII Convención de La Edificación; Martos Pérez, V., Colegio Oficial de Aparejadores y Arquitectos Técnicos de Zaragoza, Eds.; Escuela Universitaria Politécnica de La Almunia: Zaragoza, Spain, 2018; pp. 331–339. Available online: https://2018.contart.es/wp-content/uploads/CONTART_LIBRO_2018_1_Junio-opt.pdf (accessed on 27 November 2022).
- Ministerio de Transporte Movilidad y Agenda Urbana, Documento de Apoyo al Documento Básico DB-HE Ahorro de Energía, Madrid. 2020. Available online: https://www.codigotecnico.org/pdf/Documentos/HE/DA_DB-HE-1_Calculo_de_parametros_caracteristicos_de_la_envolvente.pdf (accessed on 29 November 2023).
- Euskalmet Agencia Vasca de Meteorología|Open Data. Available online: https://www.euskalmet.euskadi.eus/servicios/open-data/ (accessed on 29 November 2023).
- Rodríguez-Vidal, I.; Martín-Garín, A.; González-Quintial, F.; Rico-Martínez, J.M.; Hernández-Minguillón, R.J.; Otaegi, J. Response to the COVID-19 Pandemic in Classrooms at the University of the Basque Country through a User-Informed Natural Ventilation Demonstrator. Int. J. Environ. Res. Public Health 2022, 19, 14560. [Google Scholar] [CrossRef] [PubMed]
- AEMET. Resumen Estacional Climatológico-Verano 2019. 2019. Available online: https://www.aemet.es/documentos/es/serviciosclimaticos/vigilancia_clima/resumenes_climat/estacionales/2019/Est_verano_2019.pdf (accessed on 29 November 2023).
- AEMET. Resumen Estacional Climatológico-Invierno 2020–2021. 2020. Available online: https://www.aemet.es/documentos/es/serviciosclimaticos/vigilancia_clima/resumenes_climat/estacionales/2021/Est_invierno_21_22.pdf (accessed on 29 November 2023).
- AEMET. Resumen Estacional Climatológico-Verano 2021. 2021. Available online: https://www.aemet.es/documentos/es/serviciosclimaticos/vigilancia_clima/resumenes_climat/estacionales/2021/Est_verano_21.pdf (accessed on 29 November 2023).
- AEMET. Resumen Estacional Climatológico-Verano 2022. 2022. Available online: https://www.aemet.es/documentos/es/serviciosclimaticos/vigilancia_clima/resumenes_climat/estacionales/2022/Est_verano_22.pdf (accessed on 29 November 2023).
- AEMET. Resumen Estacional Climatológico-Invierno 2022–2023. 2023. Available online: https://www.aemet.es/documentos/es/serviciosclimaticos/vigilancia_clima/resumenes_climat/estacionales/2022/Est_invierno_22_23.pdf (accessed on 29 November 2023).


| No. of Floors | YoC 1 | Walls | Windows | Airtightness n50 | Partitions | |||
|---|---|---|---|---|---|---|---|---|
| Ufacade | Uroof | Uframe | Uglass | g | ||||
| 27 | 2018 | 0.22 W/m2K | 0.21 W/m2K | 1.10 W/m2K | 0.55 W/m2K | 0.57 | 0.3 h−1 | Lightweight |
| Laundry sp. Type | No. of Units | No. of Dwellings | Total | ||
|---|---|---|---|---|---|
| Tower 1 | Open | 99 | (57.9%) | 171 dwellings | 361 dwellings |
| Closed | 72 | (42.1%) | |||
| Tower 2 | Open | 112 | (58.9%) | 190 dwellings | |
| Closed | 78 | (41.1%) | |||
| Week | Start–End | Description |
|---|---|---|
| W1 | 4 January 2021–10 January 2022 | Week with the third lowest minimum temperature in the considered winter periods (−1.6 °C), the coldest average temperature of the considered winters, and the highest sum of HDH. |
| W2 | 16 November 2020–22 November 2020 | Week with an average temperature close to the average of the weekly mean temperatures of the winter period (±0.5 °C), although with a minimum temperature slightly lower than the mean of the weekly minimums (±1.1 °C). Similar to the weekly average HDH (±10%). |
| W3 | 11 July 2022–17 July 2022 | Week with the hottest maximum temperature of the studied summers, at 39.8 °C, and hottest week of the analyzed period by average temperature (24.91 °C). It was also the week with the highest accumulated CDH. It was also the week with the highest recorded radiation. |
| W4 | 28 June 2021–4 July 2021 | Fourth week closest to the average of the mean weekly temperatures (±0.2 °C), and very close to the mean CDH (±5%). Although it presented a higher max temperature than the weekly average max (+5 °C), it was chosen because there were data available for two laundry spaces. |
| W5 | 12 September 2022–18 September 2022 | Week with the highest number of tropical nights (2) in the studied summers. |
| Laundry 1 | ||||||||||||||
| Jan. | Feb. | Mar. | Apr. | May | Jun. | Jul. | Aug. | Sep. | Oct. | Nov. | Dec. | Overall | ||
| 2020 | Avg. T (°C) | 23.59 | 22.37 | 16.45 | 16.83 | 11.85 | 17.88 1 | |||||||
| Min. T (°C) | 15.0 | 11.9 | 7.8 | 7.5 | 5.3 | 5.3 1 | ||||||||
| Max. T (°C) | 46.5 | 48.0 | 35.4 | 36.0 | 26.1 | 48.0 1 | ||||||||
| 2021 | Avg. T (°C) | 10.74 | 14.78 | 14.64 | 16.07 | 17.18 | 20.98 | 21.78 | 22.06 | 22.98 | 18.88 | 12.24 | 13.48 | 17.16 |
| Min. T (°C) | 3.5 | 8.3 | 5.5 | 6.0 | 8.9 | 12.0 | 14.5 | 14.8 | 14.9 | 9.8 | 5.8 | 4.9 | 3.5 | |
| Max. T (°C) | 27.8 | 33.8 | 42.4 | 38.8 | 40.1 | 46.8 | 42.3 | 42.4 | 41.3 | 40.1 | 32.4 | 34 | 46.8 | |
| 2022 | Avg. T (°C) | 11.47 | 12.89 | 14.91 | 15.08 | 19.89 | 21.81 | 25.03 | 24.60 | 22.70 | 22.15 | 15.78 | 14.37 | 18.43 |
| Min. T (°C) | 2.3 | 4.4 | 7.7 | 4.9 | 11.7 | 13.3 | 12.5 | 15.9 | 12.8 | 12.8 | 7.8 | 5.8 | 2.3 | |
| Max. T (°C) | 31.0 | 35.6 | 34.8 | 40.8 | 45.4 | 48.8 | 53.0 | 45.5 | 48.0 | 40.7 | 36.6 | 30.1 | 53.0 | |
| Laundry 2 | ||||||||||||||
| Jan. | Feb. | Mar. | Apr. | May | Jun. | Jul. | Aug. | Sep. | Oct. | Nov. | Dec. | Total | ||
| 2019 | Avg. T (°C) | 14.12 | 14.12 1 | |||||||||||
| Min. T (°C) | 4.1 | 4.1 1 | ||||||||||||
| Max. T (°C) | 34.6 | 34.6 1 | ||||||||||||
| 2020 | Avg. T (°C) | 13.19 | 16.56 | 17.55 | 17.86 | 12.62 | 16.60 1 | |||||||
| Min. T (°C) | 3.8 | 5.7 | 7.5 | 6.6 | 5.8 | 3.8 1 | ||||||||
| Max. T (°C) | 31.2 | 33.1 | 34.5 | 35.7 | 30.7 | 35.7 1 | ||||||||
| 2021 | Avg. T (°C) | 11.07 | 15.52 | 15.06 | 21.99 | 19.83 | 15.45 1 | |||||||
| Min. T (°C) | 2.1 | 8.2 | 4.2 | 6.8 | 9.7 | 2.1 1 | ||||||||
| Max. T (°C) | 32.3 | 32.3 | 34.3 | 27.9 | 36.9 | 36.9 1 | ||||||||
| Laundry 3 | ||||||||||||||
| Jan. | Feb. | Mar. | Apr. | May | Jun. | Jul. | Aug. | Sep. | Oct. | Nov. | Dec. | Total | ||
| 2020 | Avg. T (°C) | 23.08 | 17.65 | 18.43 | 13.74 | 19.95 1 | ||||||||
| Min. T (°C) | 13.1 | 9.8 | 6.8 | 7.2 | 6.8 1 | |||||||||
| Max. T (°C) | 31.3 | 33.7 | 34.3 | 31 | 34.3 1 | |||||||||
| 2021 | Avg. T (°C) | 12.20 | 16.06 | 15.56 | 16.24 | 17.43 | 20.89 | 21.84 | 22.54 | 23.62 | 19.82 | 18.62 1 | ||
| Min. T (°C) | 3.9 | 9.0 | 6.2 | 5.3 | 8.9 | 12.5 | 15.1 | 15.5 | 15.2 | 10.5 | 3.9 1 | |||
| Max. T (°C) | 29.6 | 32.4 | 35.0 | 30.4 | 33.4 | 36.9 | 35.2 | 35.1 | 42.7 | 37.6 | 42.7 1 | |||
| Laundry 1 | ||||||||||||||
| Jan. | Feb. | Mar. | Apr. | May | Jun. | Jul. | Aug. | Sep. | Oct. | Nov. | Dec. | Overall | ||
| 2020 | Avg. RH (%) | 65.07 | 61.41 | 69.74 | 60.73 | 68.28 | 65.1 1 | |||||||
| Min. RH (%) | 6 | 13 | 24 | 23 | 27 | 6 1 | ||||||||
| Max. RH (%) | 90 | 96 | 97 | 89 | 100 | 100 1 | ||||||||
| 2021 | Avg. RH (%) | 69.20 | 61.03 | 58.38 | 55.07 | 62.50 | 67.25 | 67.72 | 68.04 | 65.56 | 62.66 | 75.32 | 65.98 | 64.91 |
| Min. RH (%) | 27 | 17 | 7 | 11 | 19 | 18 | 21 | 17 | 23 | 16 | 19 | 19 | 7 | |
| Max. RH (%) | 95 | 94 | 96 | 91 | 91 | 93 | 92 | 92 | 91 | 91 | 100 | 98 | 100 | |
| 2022 | Avg. RH (%) | 64.67 | 58.10 | 62.75 | 62.60 | 67.40 | 59.40 | 66.01 | 58.19 | 57.63 | 64.23 | 63.94 | 64.67 | 62.36 |
| Min. RH (%) | 3 | 12 | 14 | 12 | 19 | 11 | 19 | 10 | 15 | 18 | 15 | 3 | 3 | |
| Max. RH (%) | 92 | 90 | 91 | 89 | 93 | 90 | 94 | 94 | 90 | 92 | 93 | 92 | 94 | |
| Laundry 2 | ||||||||||||||
| Jan. | Feb. | Mar. | Apr. | May | Jun. | Jul. | Aug. | Sep. | Oct. | Nov. | Dec. | Total | ||
| 2019 | Avg. RH (%) | 61.16 | 61.16 1 | |||||||||||
| Min. RH (%) | 15 | 15 1 | ||||||||||||
| Max. RH (%) | 91 | 91 1 | ||||||||||||
| 2020 | Avg. RH (%) | 59.01 | 56.54 | 63.17 | 54.68 | 62.51 | 59.53 1 | |||||||
| Min. RH (%) | 16 | 20 | 22 | 18 | 20 | 16 1 | ||||||||
| Max. RH (%) | 91 | 84 | 89 | 82 | 88 | 82 1 | ||||||||
| 2021 | Avg. RH (%) | 66.09 | 56 | 54.47 | 22.41 | 57.14 | 57.95 1 | |||||||
| Min. RH (%) | 17 | 16 | 10 | 15 | 17 | 10 1 | ||||||||
| Max. RH (%) | 94 | 84 | 84 | 76 | 83 | 76 1 | ||||||||
| Laundry 3 | ||||||||||||||
| Jan. | Feb. | Mar. | Apr. | May | Jun. | Jul. | Aug. | Sep. | Oct. | Nov. | Dec. | Total | ||
| 2020 | Avg. RH (%) | 62.06 | 66.49 | 56.68 | 62.13 | 62.31 1 | ||||||||
| Min. RH (%) | 30 | 23 | 22 | 20 | 20 1 | |||||||||
| Max. RH (%) | 86 | 89 | 84 | 84 | 89 1 | |||||||||
| 2021 | Avg. RH (%) | 64.27 | 57.55 | 55.53 | 54.07 | 62.50 | 68.34 | 68.47 | 67.08 | 64.33 | 60.79 | 59.65 1 | ||
| Min. RH (%) | 17 | 20 | 12 | 15 | 25 | 31 | 29 | 26 | 22 | 19 | 12 1 | |||
| Max. RH (%) | 91 | 87 | 85 | 85 | 87 | 88 | 89 | 91 | 85 | 87 | 91 1 | |||
| 2020 | 2021 | 2022 | |||||||||||||
|---|---|---|---|---|---|---|---|---|---|---|---|---|---|---|---|
| Average | Absolute Min. | Absolute Max. | Avg. Daily Min. | Avg. Daily Max. | Average | Absolute Min. | Absolute Max. | Avg. Daily Min. | Avg. Daily Max. | Average | Absolute Min. | Absolute Max. | Avg. Daily Min. | Avg. Daily Max. | |
| Jan. | +3.26 °C | +5.23 °C | +8.58 °C | +3.78 °C | +4.71 °C | +4.56 °C | +4.27 °C | +9.55 °C | +4.40 °C | +9.32 °C | |||||
| Feb. | +2.69 °C | +3.73 °C | +11.82 °C | +3.53 °C | +4.83 °C | +4.24 °C | +4.42 °C | +15.85 °C | +5.03 °C | +7.53 °C | |||||
| Mar. | +4.02 °C | +5.43 °C | +14.00 °C | +4.67 °C | +7.99 °C | +3.31 °C | +3.60 °C | +12.85 °C | +3.54 °C | +6.30 °C | |||||
| Apr. | +4.54 °C | +4.94 °C | +14.03 °C | +4.70 °C | +9.01 °C | +3.67 °C | +4.13 °C | +14.92 °C | +3.54 °C | +7.23 °C | |||||
| May | +3.60 °C | +4.93 °C | +10.48 °C | +4.19 °C | +6.23 °C | +3.54 °C | +4.70 °C | +13.08 °C | +3.63 °C | +6.38 °C | |||||
| Jun. | +3.66 °C | +3.48 °C | +13.30 °C | +3.83 °C | +5.76 °C | +3.39 °C | +4.13 °C | +10.20 °C | +3.29 °C | +5.31 °C | |||||
| Jul. | +3.51 °C | +4.38 °C | +7.56 °C | +3.51 °C | +6.36 °C | +4.23 °C | +4.20 °C | +13.20 °C | +4.06 °C | +7.30 °C | |||||
| Aug. | +3.56 °C | +5.57 °C | +7.73 °C | +3.92 °C | +5.03 °C | +3.59 °C | +3.90 °C | +13.87 °C | +3.43 °C | +6.61 °C | +3.61 °C | +3.20 °C | +8.30 °C | +4.12 °C | +5.58 °C |
| Sep. | +4.43 °C | +11.30 °C | +11.90 °C | +4.67 °C | +7.64 °C | +4.27 °C | +4.20 °C | +5.53 °C | +4.60 °C | +6.24 °C | +4.72 °C | +4.80 °C | +10.50 °C | +5.16 °C | +7.19 °C |
| Oct. | +3.17 °C | +3.28 °C | +12.06 °C | +3.73 °C | +5.07 °C | +4.74 °C | +4.51 °C | +13.86 °C | +4.23 °C | +9.88 °C | +3.96 °C | +3.55 °C | +13.12 °C | +4.07 °C | +7.64 °C |
| Nov. | +4.35 °C | +5.78 °C | +12.53 °C | +4.52 °C | +8.64 °C | +3.09 °C | +2.87 °C | +14.40 °C | +3.25 °C | +5.43 °C | +3.78 °C | +3.37 °C | +15.12 °C | +4.09 °C | +5.82 °C |
| Dec. | +2.54 °C | +3.67 °C | +5.65 °C | +3.39 °C | +3.68 °C | +3.28 °C | +4.03 °C | +12.14 °C | +3.69 °C | +7.02 °C | +2.97 °C | +3.89 °C | +8.47 °C | +3.87 °C | +5.08 °C |
| 2020 | 2021 | 2022 | |||||||||||||
|---|---|---|---|---|---|---|---|---|---|---|---|---|---|---|---|
| Average | Absolute Min. | Absolute Max. | Avg. Daily Min. | Avg. Daily Max. | Average | Absolute Min. | Absolute Max. | Avg. Daily Min. | Avg. Daily Max. | Average | Absolute Min. | Absolute Max. | Avg. Daily Min. | Avg. Daily Max. | |
| Jan. | −11.1% | −4.2% | −1.3% | −7.7% | −12.2% | −14.3% | −13.6% | 0.9% | −16.7% | −14.2% | |||||
| Feb. | −7.1% | −4.1% | −2.1% | −8.2% | −12.1% | −13.5% | −2.3% | −4.3% | −11.6% | −14.5% | |||||
| Mar. | −11.2% | −9.6% | −0.1% | −10.3% | −15.5% | −9.5% | −13.8% | −5.9% | −9.9% | −12.8% | |||||
| Apr. | −13.1% | −9.9% | −5.3% | −13.0% | −17.9% | −12.0% | −10.6% | −5.2% | −12.2% | −13.6% | |||||
| May | −12.0% | −8.3% | −5.2% | −11.3% | −14.6% | −10.9% | −12.5% | −7.2% | −10.9% | −13.5% | |||||
| Jun. | −11.8% | −14.1% | −3.9% | −12.1% | −12.1% | −10.1% | −0.4% | −3.3% | −10.8% | −9.0% | |||||
| Jul. | −11.0% | −7.6% | −4.3% | −13.1% | −11.4% | −10.8% | −1.0% | −6.0% | −10.4% | −13.4% | |||||
| Aug. | −11.6% | −6.2% | −6.3% | −7.6% | −12.4% | −11.1% | −21.0% | −5.3% | −12.3% | −12.0% | −9.1% | −3.0% | −3.0% | −9.3% | −11.1% |
| Sep. | −11.5% | 7.2% | −0.3% | −7.0% | −12.5% | −14.3% | −4.6% | −6.4% | −11.9% | −14.1% | −13.4% | −6.0% | −3.0% | −10.3% | −16.0% |
| Oct. | −11.6% | −10.2% | 0.7% | −9.6% | −10.6% | −16.0% | −19.2% | −5.9% | −17.8% | −14.5% | −13.0% | −6.0% | −6.4% | −14.4% | −14.8% |
| Nov. | −13.9% | −17.1% | −7.2% | −16.6% | −15.4% | −11.6% | −23.0% | 2.9% | −12.1% | −8.6% | −14.0% | −12.3% | −4.2% | −10.7% | −13.7% |
| Dec. | −8.0% | −10.2% | 3.8% | −5.6% | −10.0% | −9.8% | −9.8% | 1.7% | −12.8% | −13.0% | −9.9% | 1.9% | −3.1% | −10.8% | −12.7% |
| 2020 | 2021 | |||||||||
|---|---|---|---|---|---|---|---|---|---|---|
| Average | Absolute Min. | Absolute Max. | Avg. Daily Min. | Avg. Daily Max. | Average | Absolute Min. | Absolute Max. | Avg. Daily Min. | Avg. Daily Max. | |
| Jan. | +3.60 °C | +3.83 °C | +13.08 °C | +3.39 °C | +6.76 °C | |||||
| Feb. | +3.43 °C | +3.63 °C | +10.32 °C | +3.57 °C | +5.79 °C | |||||
| Mar. | +4.44 °C | +4.13 °C | +5.90 °C | +4.21 °C | +6.86 °C | |||||
| Apr. | ||||||||||
| May | ||||||||||
| Jun. | ||||||||||
| Jul. | ||||||||||
| Aug. | ||||||||||
| Sep. | ||||||||||
| Oct. | +4.26 °C | +2.98 °C | +11.16 °C | +3.84 °C | +6.48 °C | |||||
| Nov. | +5.38 °C | +4.88 °C | +12.23 °C | +4.32 °C | +10.54 °C | |||||
| Dec. | +3.31 °C | +4.17 °C | +10.25 °C | +3.37 °C | +6.55 °C | |||||
| 2020 | 2021 | |||||||||
|---|---|---|---|---|---|---|---|---|---|---|
| Average | Absolute Min. | Absolute Max. | Avg. Daily Min. | Avg. Daily Max. | Average | Absolute Min. | Absolute Max. | Avg. Daily Min. | Avg. Daily Max. | |
| Jan. | −14.2% | −14.2% | −2.3% | −13.5% | −13.1% | |||||
| Feb. | −12.2% | −5.1% | −12.1% | −11.7% | −17.0% | |||||
| Mar. | −15.1% | −6.6% | −12.1% | −10.8% | −19.5% | |||||
| Apr. | ||||||||||
| May | ||||||||||
| Jun. | ||||||||||
| Jul. | ||||||||||
| Aug. | ||||||||||
| Sep. | ||||||||||
| Oct. | −18.2% | −12.2% | −7.3% | −15.1% | −17.2% | |||||
| Nov. | −19.9% | −22.1% | −14.2% | −21.8% | −20.2% | |||||
| Dec. | −13.8% | −17.2% | −8.2% | −12.1% | −16.0% | |||||
| 2020 | 2021 | |||||||||
|---|---|---|---|---|---|---|---|---|---|---|
| Average | Absolute Min. | Absolute Max. | Avg. Daily Min. | Avg. Daily Max. | Average | Absolute Min. | Absolute Max. | Avg. Daily Min. | Avg. Daily Max. | |
| Jan. | +4.73 °C | +5.63 °C | +10.38 °C | +4.66 °C | +7.20 °C | |||||
| Feb. | +3.97 °C | +4.43 °C | +10.42 °C | +4.57 °C | +6.35 °C | |||||
| Mar. | +4.94 °C | +6.13 °C | +6.60 °C | +5.14 °C | +6.86 °C | |||||
| Apr. | +4.71 °C | +4.24 °C | +5.63 °C | +4.88 °C | +6.11 °C | |||||
| May | +3.85 °C | +4.93 °C | +3.78 °C | +4.42 °C | +4.54 °C | |||||
| Jun. | +3.57 °C | +3.98 °C | +3.40 °C | +3.86 °C | +4.14 °C | |||||
| Jul. | +3.56 °C | +4.98 °C | +0.46 °C | +3.70 °C | +4.23 °C | |||||
| Aug. | +4.08 °C | +4.60 °C | +6.57 °C | +3.86 °C | +5.54 °C | |||||
| Sep. | +5.14 °C | +12.50 °C | −4.80 °C | +8.69 °C | +0.80 °C | +4.91 °C | +4.50 °C | +6.93 °C | +4.79 °C | +6.59 °C |
| Oct. | +4.36 °C | +5.28 °C | +10.36 °C | +4.35 °C | +6.11 °C | +5.67 °C | +5.21 °C | +11.36 °C | +4.67 °C | +9.10 °C |
| Nov. | +5.95 °C | +5.08 °C | +10.83 °C | +5.20 °C | +10.00 °C | |||||
| Dec. | +4.43 °C | +5.57 °C | +10.55 °C | +4.56 °C | +7.32 °C | |||||
| 2020 | 2021 | |||||||||
|---|---|---|---|---|---|---|---|---|---|---|
| Average | Absolute Min. | Absolute Max. | Avg. Daily Min. | Avg. Daily Max. | Average | Absolute Min. | Absolute Max. | Avg. Daily Min. | Avg. Daily Max. | |
| Jan. | −16.0% | −14.2% | −5.3% | −14.1% | −15.7% | |||||
| Feb. | −10.6% | −1.1% | −9.1% | −10.8% | −16.0% | |||||
| Mar. | −14.0% | −4.6% | −11.1% | −10.7% | −18.0% | |||||
| Apr. | −14.1% | −5.9% | −11.3% | −10.4% | −18.8% | |||||
| May | −12.0% | −2.3% | −9.2% | −7.5% | −14.9% | |||||
| Jun. | −10.7% | −1.1% | −8.9% | −7.7% | −12.2% | |||||
| Jul. | −10.3% | 0.4% | −7.3% | −7.3% | −11.7% | |||||
| Aug. | −12.0% | −12.0% | −6.3% | −11.0% | −12.6% | |||||
| Sep. | −10.8% | +24.2% | −10.3% | 10.7% | −21.3% | −15.6% | −5.6% | −12.4% | −11.1% | −15.8% |
| Oct. | −14.8% | −11.2% | −7.3% | −12.8% | −14.1% | −17.8% | −16.2% | −9.9% | −16.2% | −15.9% |
| Nov. | −17.9% | −18.1% | −12.2% | −18.8% | −18.6% | |||||
| Dec. | −14.2% | −17.2% | −12.2% | −13.0% | −17.5% | |||||
| Laundry 1 | |||||||||
| Tlaundry < Text | Tlaundry ≈ Text | Tlaundry > Text | ΔT > 2 °C | ΔT > 4 °C | ΔT > 6 °C | ΔT > 8 °C | ΔT > 10 °C | ΔT > 12 °C | |
| Whole available period | 3.3% | 5.4% | 91.2% | 69.9% | 35.4% | 16.5% | 8.8% | 5.1% | 3.1% |
| Yearly analysis | |||||||||
| Year | Tlaundry < Text | Tlaundry ≈ Text | Tlaundry > Text | ΔT > 2 °C | ΔT > 4 °C | ΔT > 6 °C | ΔT > 8 °C | ΔT > 10 °C | ΔT > 12 °C |
| 2020 1 | 3.3% | 6.4% | 90.3% | 68.3% | 35.6% | 15.4% | 8.4% | 4.8% | 2.9% |
| 2021 | 3.0% | 5.2% | 91.8% | 69.9% | 33.6% | 15.8% | 8.5% | 5.0% | 2.9% |
| 2022 | 3.6% | 5.3% | 91.1% | 70.5% | 37.3% | 17.6% | 9.1% | 5.3% | 3.3% |
| Laundry 2 | |||||||||
| Tlaundry < Text | Tlaundry ≈ Text | Tlaundry > Text | ΔT > 2 °C | ΔT > 4 °C | ΔT > 6 °C | ΔT > 8 °C | ΔT > 10 °C | ΔT > 12 °C | |
| Whole available period | 0.0% | 0.3% | 99.7% | 84.8% | 38.7% | 18.4% | 10.4% | 6.3% | 4.1% |
| Yearly analysis | |||||||||
| Year | Tlaundry < Text | Tlaundry ≈ Text | Tlaundry > Text | ΔT > 2 °C | ΔT > 4 °C | ΔT > 6 °C | ΔT > 8 °C | ΔT > 10 °C | ΔT > 12 °C |
| 2020 1 | 0.0% | 0.3% | 99.7% | 83.7% | 39.0% | 19.0% | 10.5% | 6.4% | 4.3% |
| 2021 1 | 0.0% | 0.2% | 99.8% | 87.7% | 40.0% | 18.5% | 10.1% | 5.8% | 3.5% |
| Laundry 3 | |||||||||
| Tlaundry < Text | Tlaundry ≈ Text | Tlaundry > Text | ΔT > 2 °C | ΔT > 4 °C | ΔT > 6 °C | ΔT > 8 °C | ΔT > 10 °C | ΔT > 12 °C | |
| Whole available period | 1.0% | 1.4% | 97.5% | 89.4% | 55.3% | 19.7% | 8.2% | 4.0% | 1.5% |
| Yearly analysis | |||||||||
| Year | Tlaundry < Text | Tlaundry ≈ Text | Tlaundry > Text | ΔT > 2 °C | ΔT > 4 °C | ΔT > 6 °C | ΔT > 8 °C | ΔT > 10 °C | ΔT > 12 °C |
| 2020 1 | 2.4% | 1.3% | 96.3% | 87.4% | 58.6% | 26.4% | 13.8% | 7.2% | 2.9% |
| 2021 1 | 0.5% | 1.5% | 98.0% | 90.2% | 54.1% | 17.1% | 6.1% | 2.7% | 0.9% |
| Year | Month | Median | Mean Absolute Difference | ||||||||||||
|---|---|---|---|---|---|---|---|---|---|---|---|---|---|---|---|
| Abusu | Laundry 1 | Laundry 2 | Laundry 3 | Laundry 1 | Laundry 2 | Laundry 3 | |||||||||
| Day | Night | Day | Night | Day | Night | Day | Night | Day | Night | Day | Night | Day | Night | ||
| 2019 | Dec. | 13.43 | 9.56 | 15.25 | 11.20 | +5.26 | +3.31 | ||||||||
| 2020 | Jan. | 13.47 | 10.87 | 14.15 | 9.60 | +4.23 | +3.79 | ||||||||
| Feb. | 12.41 | 9.79 | 17.80 | 12.90 | +6.33 | +4.47 | |||||||||
| Mar. | 12.65 | 9.05 | 14.60 | 10.90 | +7.36 | +4.41 | |||||||||
| Apr. | 15.45 | 12.48 | |||||||||||||
| May | 17.88 | 12.67 | |||||||||||||
| Jun. | 18.26 | 14.03 | |||||||||||||
| Jul. | 20.98 | 16.04 | |||||||||||||
| Aug. | 20.09 | 15.10 | 24.60 | 21.00 | +5.01 | +5.10 | |||||||||
| Sep. | 18.34 | 13.99 | 23.95 | 19.40 | 20.50 | 17.40 | 23.50 | 23.30 | +6.43 | +5.19 | +5.78 | +5.38 | +4.93 | +7.10 | |
| Oct. | 14.55 | 11.29 | 17.35 | 14.30 | 18.85 | 14.75 | 18.70 | 15.20 | +3.80 | +3.45 | +5.00 | +3.60 | +4.88 | +4.03 | |
| Nov. | 13.04 | 11.13 | 17.90 | 14.60 | 19.30 | 14.70 | 20.20 | 15.80 | +5.72 | +4.47 | +6.97 | +4.48 | +7.44 | +5.08 | |
| Dec. | 12.05 | 10.06 | 11.60 | 10.85 | 12.95 | 10.40 | 13.80 | 11.80 | +3.88 | +3.25 | +4.77 | +3.24 | +5.15 | +3.85 | |
| 2021 | Jan. | 12.16 | 10.59 | 10.90 | 9.30 | 11.40 | 8.50 | 12.05 | 10.35 | +4.98 | +4.35 | +5.64 | +4.39 | +5.58 | +4.55 |
| Feb. | 14.60 | 11.35 | 15.00 | 13.15 | 16.30 | 13.20 | 16.20 | 13.95 | +4.34 | +3.60 | +4.99 | +3.55 | +5.15 | +4.18 | |
| Mar. | 12.25 | 8.54 | 14.00 | 11.50 | 15.45 | 11.20 | 15.60 | 12.35 | +5.36 | +4.62 | +6.04 | +4.33 | +5.91 | +5.06 | |
| Apr. | 13.39 | 9.24 | 17.20 | 12.70 | 17.55 | 13.90 | +5.43 | +4.87 | +5.12 | +4.86 | |||||
| May | 14.83 | 10.38 | 18.25 | 14.10 | 18.80 | 14.40 | +4.89 | +3.91 | +4.90 | +3.91 | |||||
| Jun. | 17.54 | 14.19 | 21.60 | 18.45 | 22.10 | 18.35 | +6.03 | +5.16 | +6.09 | +4.88 | |||||
| Jul. | 18.96 | 14.59 | 22.75 | 19.00 | 23.20 | 19.15 | +6.52 | +5.87 | +6.34 | +6.01 | |||||
| Aug. | 19.31 | 14.89 | 22.80 | 19.00 | 23.70 | 19.50 | +5.99 | +5.53 | +6.38 | +5.94 | |||||
| Sep. | 17.82 | 14.11 | 23.50 | 20.35 | 24.40 | 20.60 | +7.62 | +7.11 | +8.62 | +7.25 | |||||
| Oct. | 15.96 | 11.08 | 19.45 | 15.45 | 21.90 | 14.60 | 21.85 | 16.00 | +6.17 | +4.86 | +7.57 | +4.75 | +7.18 | +5.17 | |
| Nov. | 10.51 | 8.57 | 12.55 | 10.80 | +3.65 | +3.26 | |||||||||
| Dec. | 12.66 | 9.86 | 13.60 | 11.10 | +4.98 | +4.20 | |||||||||
| 2022 | Jan. | 8.38 | 4.58 | 11.50 | 8.60 | +6.07 | +5.18 | ||||||||
| Feb. | 12.08 | 7.75 | 13.20 | 10.40 | +4.78 | +4.19 | |||||||||
| Mar. | 14.28 | 10.94 | 14.95 | 12.60 | +4.61 | +4.04 | |||||||||
| Apr. | 13.93 | 10.88 | 16.10 | 12.90 | +4.89 | +4.06 | |||||||||
| May | 18.07 | 13.74 | 20.80 | 16.75 | +5.23 | +4.17 | |||||||||
| Jun. | 18.33 | 15.29 | 22.50 | 18.50 | +6.07 | +5.36 | |||||||||
| Jul. | 21.24 | 16.58 | 26.00 | 20.90 | +6.80 | +6.08 | |||||||||
| Aug. | 20.48 | 16.49 | 25.55 | 22.00 | +6.74 | +6.16 | |||||||||
| Sep. | 17.20 | 12.70 | 23.70 | 20.45 | +7.14 | +6.90 | |||||||||
| Oct. | 20.02 | 15.94 | 23.05 | 19.35 | +5.46 | +4.63 | |||||||||
| Nov. | 12.26 | 9.92 | 15.90 | 13.50 | +5.29 | +3.74 | |||||||||
| Dec. | 15.73 | 13.43 | 15.30 | 13.30 | +4.24 | +3.59 | |||||||||
| Laundry 1—Daytime | |||||||||
| Tlaundry < Text | Tlaundry ≈ Text | Tlaundry > Text | ΔT > 2 °C | ΔT > 4 °C | ΔT > 6 °C | ΔT > 8 °C | ΔT > 10 °C | ΔT > 12 °C | |
| Whole available period | 5.3% | 7.8% | 86.8% | 62.2% | 33.3% | 20.3% | 13.3% | 8.5% | 5.3% |
| Yearly analysis | |||||||||
| Year | Tlaundry < Text | Tlaundry ≈ Text | Tlaundry > Text | ΔT > 2 °C | ΔT > 4 °C | ΔT > 6 °C | ΔT > 8 °C | ΔT > 10 °C | ΔT > 12 °C |
| 2020 1 | 5.2% | 9.1% | 85.7% | 60.9% | 33.0% | 19.8% | 12.4% | 7.9% | 5.0% |
| 2021 | 4.9% | 7.6% | 87.6% | 62.0% | 31.7% | 19.4% | 13.0% | 8.3% | 5.0% |
| 2022 | 5.9% | 7.5% | 86.5% | 63.0% | 35.1% | 21.4% | 13.9% | 8.9% | 5.7% |
| Laundry 2—Daytime | |||||||||
| Tlaundry < Text | Tlaundry ≈ Text | Tlaundry > Text | ΔT > 2 °C | ΔT > 4 °C | ΔT > 6 °C | ΔT > 8 °C | ΔT > 10 °C | ΔT > 12 °C | |
| Whole available period | 0.0% | 0.1% | 99.9% | 88.0% | 50.1% | 28.4% | 17.3% | 10.7% | 7.0% |
| Yearly analysis | |||||||||
| Year | Tlaundry < Text | Tlaundry ≈ Text | Tlaundry > Text | ΔT > 2 °C | ΔT > 4 °C | ΔT > 6 °C | ΔT > 8 °C | ΔT > 10 °C | ΔT > 12 °C |
| 2020 1 | 0.0% | 0.2% | 99.8% | 87.0% | 51.0% | 28.3% | 17.4% | 10.9% | 7.4% |
| 2021 1 | 0.0% | 0.0% | 100.0% | 91.2% | 50.7% | 29.3% | 16.5% | 9.8% | 5.9% |
| Laundry 3—Daytime | |||||||||
| Tlaundry < Text | Tlaundry ≈ Text | Tlaundry > Text | ΔT > 2 °C | ΔT > 4 °C | ΔT > 6 °C | ΔT > 8 °C | ΔT > 10 °C | ΔT > 12 °C | |
| Whole available period | 1.7% | 2.0% | 96.2% | 86.8% | 56.7% | 25.7% | 12.2% | 6.2% | 2.5% |
| Yearly analysis | |||||||||
| Year | Tlaundry < Text | Tlaundry ≈ Text | Tlaundry > Text | ΔT > 2 °C | ΔT > 4 °C | ΔT > 6 °C | ΔT > 8 °C | ΔT > 10 °C | ΔT > 12 °C |
| 2020 1 | 4.1% | 2.0% | 94.0% | 83.7% | 56.7% | 31.2% | 17.8% | 10.5% | 4.8% |
| 2021 1 | 0.8% | 2.1% | 97.1% | 88.0% | 56.7% | 23.6% | 9.9% | 4.5% | 1.6% |
| Laundry 1—Nighttime | |||||||||
| Tlaundry < Text | Tlaundry ≈ Text | Tlaundry > Text | ΔT > 2 °C | ΔT > 4 °C | ΔT > 6 °C | ΔT > 8 °C | ΔT > 10 °C | ΔT > 12 °C | |
| Whole available period | 0.4% | 2.2% | 97.4% | 80.6% | 38.4% | 11.2% | 2.4% | 0.4% | 0.0% |
| Yearly analysis | |||||||||
| Year | Tlaundry < Text | Tlaundry ≈ Text | Tlaundry > Text | ΔT > 2 °C | ΔT > 4 °C | ΔT > 6 °C | ΔT > 8 °C | ΔT > 10 °C | ΔT > 12 °C |
| 2020 1 | 0.6% | 2.8% | 96.7% | 78.8% | 39.3% | 9.2% | 2.8% | 0.5% | 0.0% |
| 2021 | 0.4% | 1.9% | 97.6% | 81.0% | 36.2% | 10.8% | 2.2% | 0.4% | 0.0% |
| 2022 | 0.4% | 2.2% | 97.5% | 81.0% | 40.3% | 12.4% | 2.5% | 0.4% | 0.0% |
| Laundry 2—Nighttime | |||||||||
| Tlaundry < Text | Tlaundry ≈ Text | Tlaundry > Text | ΔT > 2 °C | ΔT > 4 °C | ΔT > 6 °C | ΔT > 8 °C | ΔT > 10 °C | ΔT > 12 °C | |
| Whole available period | 0.0% | 0.7% | 99.3% | 80.5% | 22.6% | 4.4% | 0.9% | 0.2% | 0.1% |
| Yearly analysis | |||||||||
| Year | Tlaundry < Text | Tlaundry ≈ Text | Tlaundry > Text | ΔT > 2 °C | ΔT > 4 °C | ΔT > 6 °C | ΔT > 8 °C | ΔT > 10 °C | ΔT > 12 °C |
| 2020 1 | 0.0% | 0.4% | 99.6% | 78.9% | 22.3% | 5.9% | 0.8% | 0.2% | 0.0% |
| 2021 1 | 0.0% | 0.5% | 99.5% | 82.8% | 24.9% | 3.4% | 1.2% | 0.2% | 0.2% |
| Laundry 3—Nighttime | |||||||||
| Tlaundry < Text | Tlaundry ≈ Text | Tlaundry > Text | ΔT > 2 °C | ΔT > 4 °C | ΔT > 6 °C | ΔT > 8 °C | ΔT > 10 °C | ΔT > 12 °C | |
| Whole available period | 0.0% | 0.6% | 99.3% | 93.1% | 53.4% | 11.3% | 2.7% | 0.8% | 0.1% |
| Yearly analysis | |||||||||
| Year | Tlaundry < Text | Tlaundry ≈ Text | Tlaundry > Text | ΔT > 2 °C | ΔT > 4 °C | ΔT > 6 °C | ΔT > 8 °C | ΔT > 10 °C | ΔT > 12 °C |
| 2020 1 | 0.0% | 0.3% | 99.7% | 92.6% | 61.2% | 19.7% | 8.1% | 2.7% | 0.3% |
| 2021 1 | 0.1% | 0.7% | 99.2% | 93.3% | 50.4% | 8.1% | 0.7% | 0.0% | 0.0% |
Disclaimer/Publisher’s Note: The statements, opinions and data contained in all publications are solely those of the individual author(s) and contributor(s) and not of MDPI and/or the editor(s). MDPI and/or the editor(s) disclaim responsibility for any injury to people or property resulting from any ideas, methods, instructions or products referred to in the content. |
© 2024 by the authors. Licensee MDPI, Basel, Switzerland. This article is an open access article distributed under the terms and conditions of the Creative Commons Attribution (CC BY) license (https://creativecommons.org/licenses/by/4.0/).
Share and Cite
Otaegi, J.; Hernández-Minguillón, R.J.; Rodríguez-Vidal, I. Characterization of the Thermal Behavior of Semi-Exterior Laundry Spaces in an Overheating Passivhaus Residential Building in Bilbao, Spain. Sustainability 2024, 16, 470. https://doi.org/10.3390/su16020470
Otaegi J, Hernández-Minguillón RJ, Rodríguez-Vidal I. Characterization of the Thermal Behavior of Semi-Exterior Laundry Spaces in an Overheating Passivhaus Residential Building in Bilbao, Spain. Sustainability. 2024; 16(2):470. https://doi.org/10.3390/su16020470
Chicago/Turabian StyleOtaegi, Jorge, Rufino J. Hernández-Minguillón, and Iñigo Rodríguez-Vidal. 2024. "Characterization of the Thermal Behavior of Semi-Exterior Laundry Spaces in an Overheating Passivhaus Residential Building in Bilbao, Spain" Sustainability 16, no. 2: 470. https://doi.org/10.3390/su16020470
APA StyleOtaegi, J., Hernández-Minguillón, R. J., & Rodríguez-Vidal, I. (2024). Characterization of the Thermal Behavior of Semi-Exterior Laundry Spaces in an Overheating Passivhaus Residential Building in Bilbao, Spain. Sustainability, 16(2), 470. https://doi.org/10.3390/su16020470