Article

An Evaluation and Difference Analysis of the High-Quality Development of China’s Marine Economy

School of Management, Ocean University of China, No. 238, Songling Road, Laoshan District, Qingdao 266100, China
*
Author to whom correspondence should be addressed.
Sustainability 2024, 16(1), 469; https://doi.org/10.3390/su16010469
Submission received: 5 December 2023 / Revised: 29 December 2023 / Accepted: 3 January 2024 / Published: 4 January 2024
(This article belongs to the Section Economic and Business Aspects of Sustainability)

Abstract

:
The marine economy is a vital component of boosting the high-quality development of the Chinese economy. According to the concept of high-quality development, we construct the evaluation indicator system to measure the level of high-quality development of the marine economy by means of the combined empowerment method. We explore the coupling coordination relationship and evolution trend with the coupling coordination degree model, and finally, we analyze the regional differences using the Dagum Gini coefficient. The results show that, (1) from the perspective of time, China’s marine economic high-quality development index has been steadily improving, but there is still great potential for progress. From the perspective of spatial characteristics, the eastern marine economic circle has the best level of high-quality economic development. (2) From 2012 to 2022, the coupling coordination degree of high-quality development of the marine economy experienced five stages, from the verge of disorder to finally stepping into the good coupling coordination stage. (3) The overall difference in the marine economy is gradually narrowing. Among the three major marine economic circles, the southern marine economic circle has the largest internal discrepancy, which has become an important factor affecting the high-quality development of the marine economy. The above research results helped relevant decision-making departments to deeply understand the status quo and outstanding contradictions of the high-quality development of the marine economy in China.

1. Introduction

The 21st century is the era of human comprehensive development and utilization of marine resources, and coastal countries around the globe have taken the utilization of marine resources as a crucial strategy. With the development of the world’s technological revolution and the increasing tension of resources, and under the pressure of a growing population, the utilization of ocean resources and the development of the marine economy are effective ways of solving the problems of scarcity of resources, spatial tension, and environmental degradation [1,2]. In this context, the Chinese government has increasingly emphasized the development of the marine and proposed the strategy of becoming a maritime power. In 2022, China’s gross marine product was USD 1.33 trillion, an increase of 1.9% over the previous year, and the growth of the marine economy showed strong resilience. The added value of emerging marine industries increased by 7.9% over the previous year, and the industrial structure was continuously optimized. The high-quality development of the marine economy is a crucial material basis for constructing a strong maritime country [3]. The experience of internationally developed countries in the marine economy has shown that only by further promoting innovation drives and adjusting the reasonable allocation of market resources can China’s marine economy maintain healthy and sustainable development [4,5].
Promoting high-quality economic development is a crucial role of the Chinese government in the new era and a fundamental guideline for future economic construction. China’s sea area is vast, and the marine economy is a vital part of the national economy. Pursuing the development of the marine economy is also the basis for realizing the strategy of strengthening the country. However, while the ocean economy continues to grow, the traditional extensive development model also leads to many problems, such as coastal ecological imbalance, marine environmental pollution, and insufficient innovation drive, which have become important factors restricting the efficient growth of the marine economy [6,7,8]. China’s marine economy is in a critical stage of transformation; achieving high-quality development of the marine economy is a practical problem that needs to be solved urgently in marine construction. In this situation, the scientific evaluation of the high-quality development level of the marine economy in coastal regional units of different spatial scales and the exploration of marine economic development paths suitable for different regions are of great practical significance for accelerating the high-quality development of the regional marine economy and realizing the strategic goal of China’s maritime power.
The establishment of a high-quality development indicator system is fundamental for assessing the high-quality development of the economy, which helps to comprehensively grasp the trends and problems of China’s marine economic development and gives a solid basis for the government’s scientific decision-making. However, the evaluation of the high-quality development of the marine economy has not yet formed a fixed evaluation system to analyze it in depth. Therefore, this paper defines the connotation of high-quality development in the marine economy, analyzes its related characteristics, and tries to construct an indicator system for the marine economy. We adopt the combination weighting method to estimate the weights of evaluation indices, carry out an empirical assessment of China’s marine economic development, and analyze the inter-provincial differences and spatial patterns. In addition, we use the coupling coordination model and the Gini coefficient to identify the type of coupling coordination necessary for the high-quality development of the marine economy and explore regional differences.

2. Literature Review

The discussion about the marine economy is roughly manifested in the following aspects: First, research on the connotations of high-quality development. Digging deep into the potential connotations is a requirement of relevant theoretical exploration as well as the premise of measuring sustainable development. High-quality development of the marine economy is not only reflected at the economic level but is also closely related to production activities, system coordination, and marine environmental governance [9,10]. At the macro-level, the high-quality development of the ocean economy refers to the sustained and stable improvement in the economy driven by innovation [11]. Interpreting the connotation of high-quality development from the speed and quality of economic development mainly shows that the economy is continuously developing, the system is gradually balanced, and that people’s lives are gradually improved. At the meso-level, the high-quality development of the marine economy refers to optimizing the industrial layout, coordinating the relationship between the three types of marine industries, realizing the transformation from low-technology industries to high-technology industries, constructing modern marine industrial criteria, and significantly improving the efficiency of industrial development [12]. The marine industries are the basis for the high-quality development of the marine economy, which is mainly manifested in the growing scale, the structure tending to be advanced, and the benefits being gradually improved [13]. From the micro-level, high-quality development of the ocean economy is about improving the productivity of sea-related enterprises [14]. Enterprises are mainly characterized as having first-class competitiveness, maintaining product quality reliability and continuous innovation, having brand influence, and possessing advanced quality management methods and a technological basis [15].
Second is the construction of an indicator system. Most scholars measure the degree of high-quality development of the marine economy by constructing an index system [16,17]. Gou et al. (2021) [18] established an indicator system from the two levels of carrying capacity and adaptability to explore the stress-resistant capacity of China’s marine economy. Gao et al. (2022) [19] evaluated the level of marine economic development from three aspects: the total marine output value, the marine industry composition, and the promotion potential. Sun et al. (2023) [20] further incorporate environmental factors into the indicator framework on the basis and explored the level of marine economic development in four aspects, namely, the marine economy, the industrial structure, the economic efficiency, and the ecological environment. Maria et al. (2018) [21] developed a framework to evaluate the performance of marine spatial planning in Portugal, using 15 indicators of economic, social, and environmental aspects of marine spatial planning. Putten et al. (2016) [22] used the input-output data of Australia at the national level to quantify the industrial correlation of the marine sector and believed that marine fisheries and aquaculture depend on upstream and downstream overlapping industries, and there is a certain synergistic effect with marine tourism. Charles (2013) [23] selected data from six marine economic sectors to discuss the scale of marine economic development in the United States. Martinez et al. (2007) [24] made a comprehensive evaluation of marine ecology, the economy, and society in many countries. Hoagland et al. (2008) [25] clarified the relationship between marine activities and the national economy by analyzing the intensity of marine ecological activities in coastal areas. There is also a proportion of scholars who believe that economic development is a comprehensive concept and that total factor productivity (TFP) fully considers cost in the production process, which is more reflective of the characteristics of high-quality development, and therefore, marine TFP is needed to assess the quality of economic development [26,27].
Third, the measurement method. The representative research methods mainly include the fuzzy comprehensive evaluation method [28], system dynamics [29], and other subjective empowerment methods, and the BP neural network model [30], the DEA model [31], the TOPSIS method [32], and other objective empowerment methods. Subjective weighting is greatly influenced by human beings, and objective weighting has strict requirements on index data. Existing studies usually use subjective and objective weighting methods to evaluate the comprehensive weight of research objects. Yang et al. (2022) [33] analyzed the combination of subjective and objective weights and their rationality and found that the two types of combination of weights have a certain degree of rationality. Zhai et al. (2012) [34] built an indicator system based on the combinatorial weighting method to scientifically evaluate China’s comprehensive marine strength. Yadav et al. (2016) [35] used the AHP-Entropy model to verify the scientific nature of combining subjective and objective methods. Wang (2022) [36] evaluated the sustainability of marine economic development based on the combined weight model, which provided experience for marine economic development evaluation. There are many evaluation methods for high-quality development, and there are differences in the evaluation results. The focus of future research on the marine economy should be placed on the selection of the evaluation methods.
Generally, scholars have made fruitful achievements in exploring the marine economy from theory and empirical evidence, but there are still the following shortcomings: The selection of indicators lacks systematicity and comprehensiveness; the marine economy is a comprehensive and complex machinery, and the correlation of various systems needs to be taken into account when selecting the indicator system; the high-quality development of the marine economy has more methods of calculating the weights; and the subjective assignment method is easily affected by personal subjectivity, while the objective assignment method is more objective. In addition, the objective weighting method is more objective, the weights obtained may be biased from the reality, and it is difficult to take into account the value and information of the indicators themselves when calculating the weights of a single weighting method. At present, there is a lack of research on the coupled and coordinated development of systems within the marine economy, which will be elaborated on in this paper. Therefore, based on the five key dimensions of high-quality economic development, namely innovation, coordination, green, opening, and sharing, this paper supplements the existing research and constructs a comprehensive evaluation index system for the high-quality development of the regional marine economy from 15 levels, enriching the index system. Compared with a single evaluation method, this paper adopts the combination assignment method to comprehensively evaluate the marine economy, which makes the results more scientific and precise. Then, the coupling coordination degree model and Gini coefficient are used to explore the system fit degree and regional differences and provide precise directions for the future development to accurately grasp the movement of development and lay a solid foundation for building a maritime power.

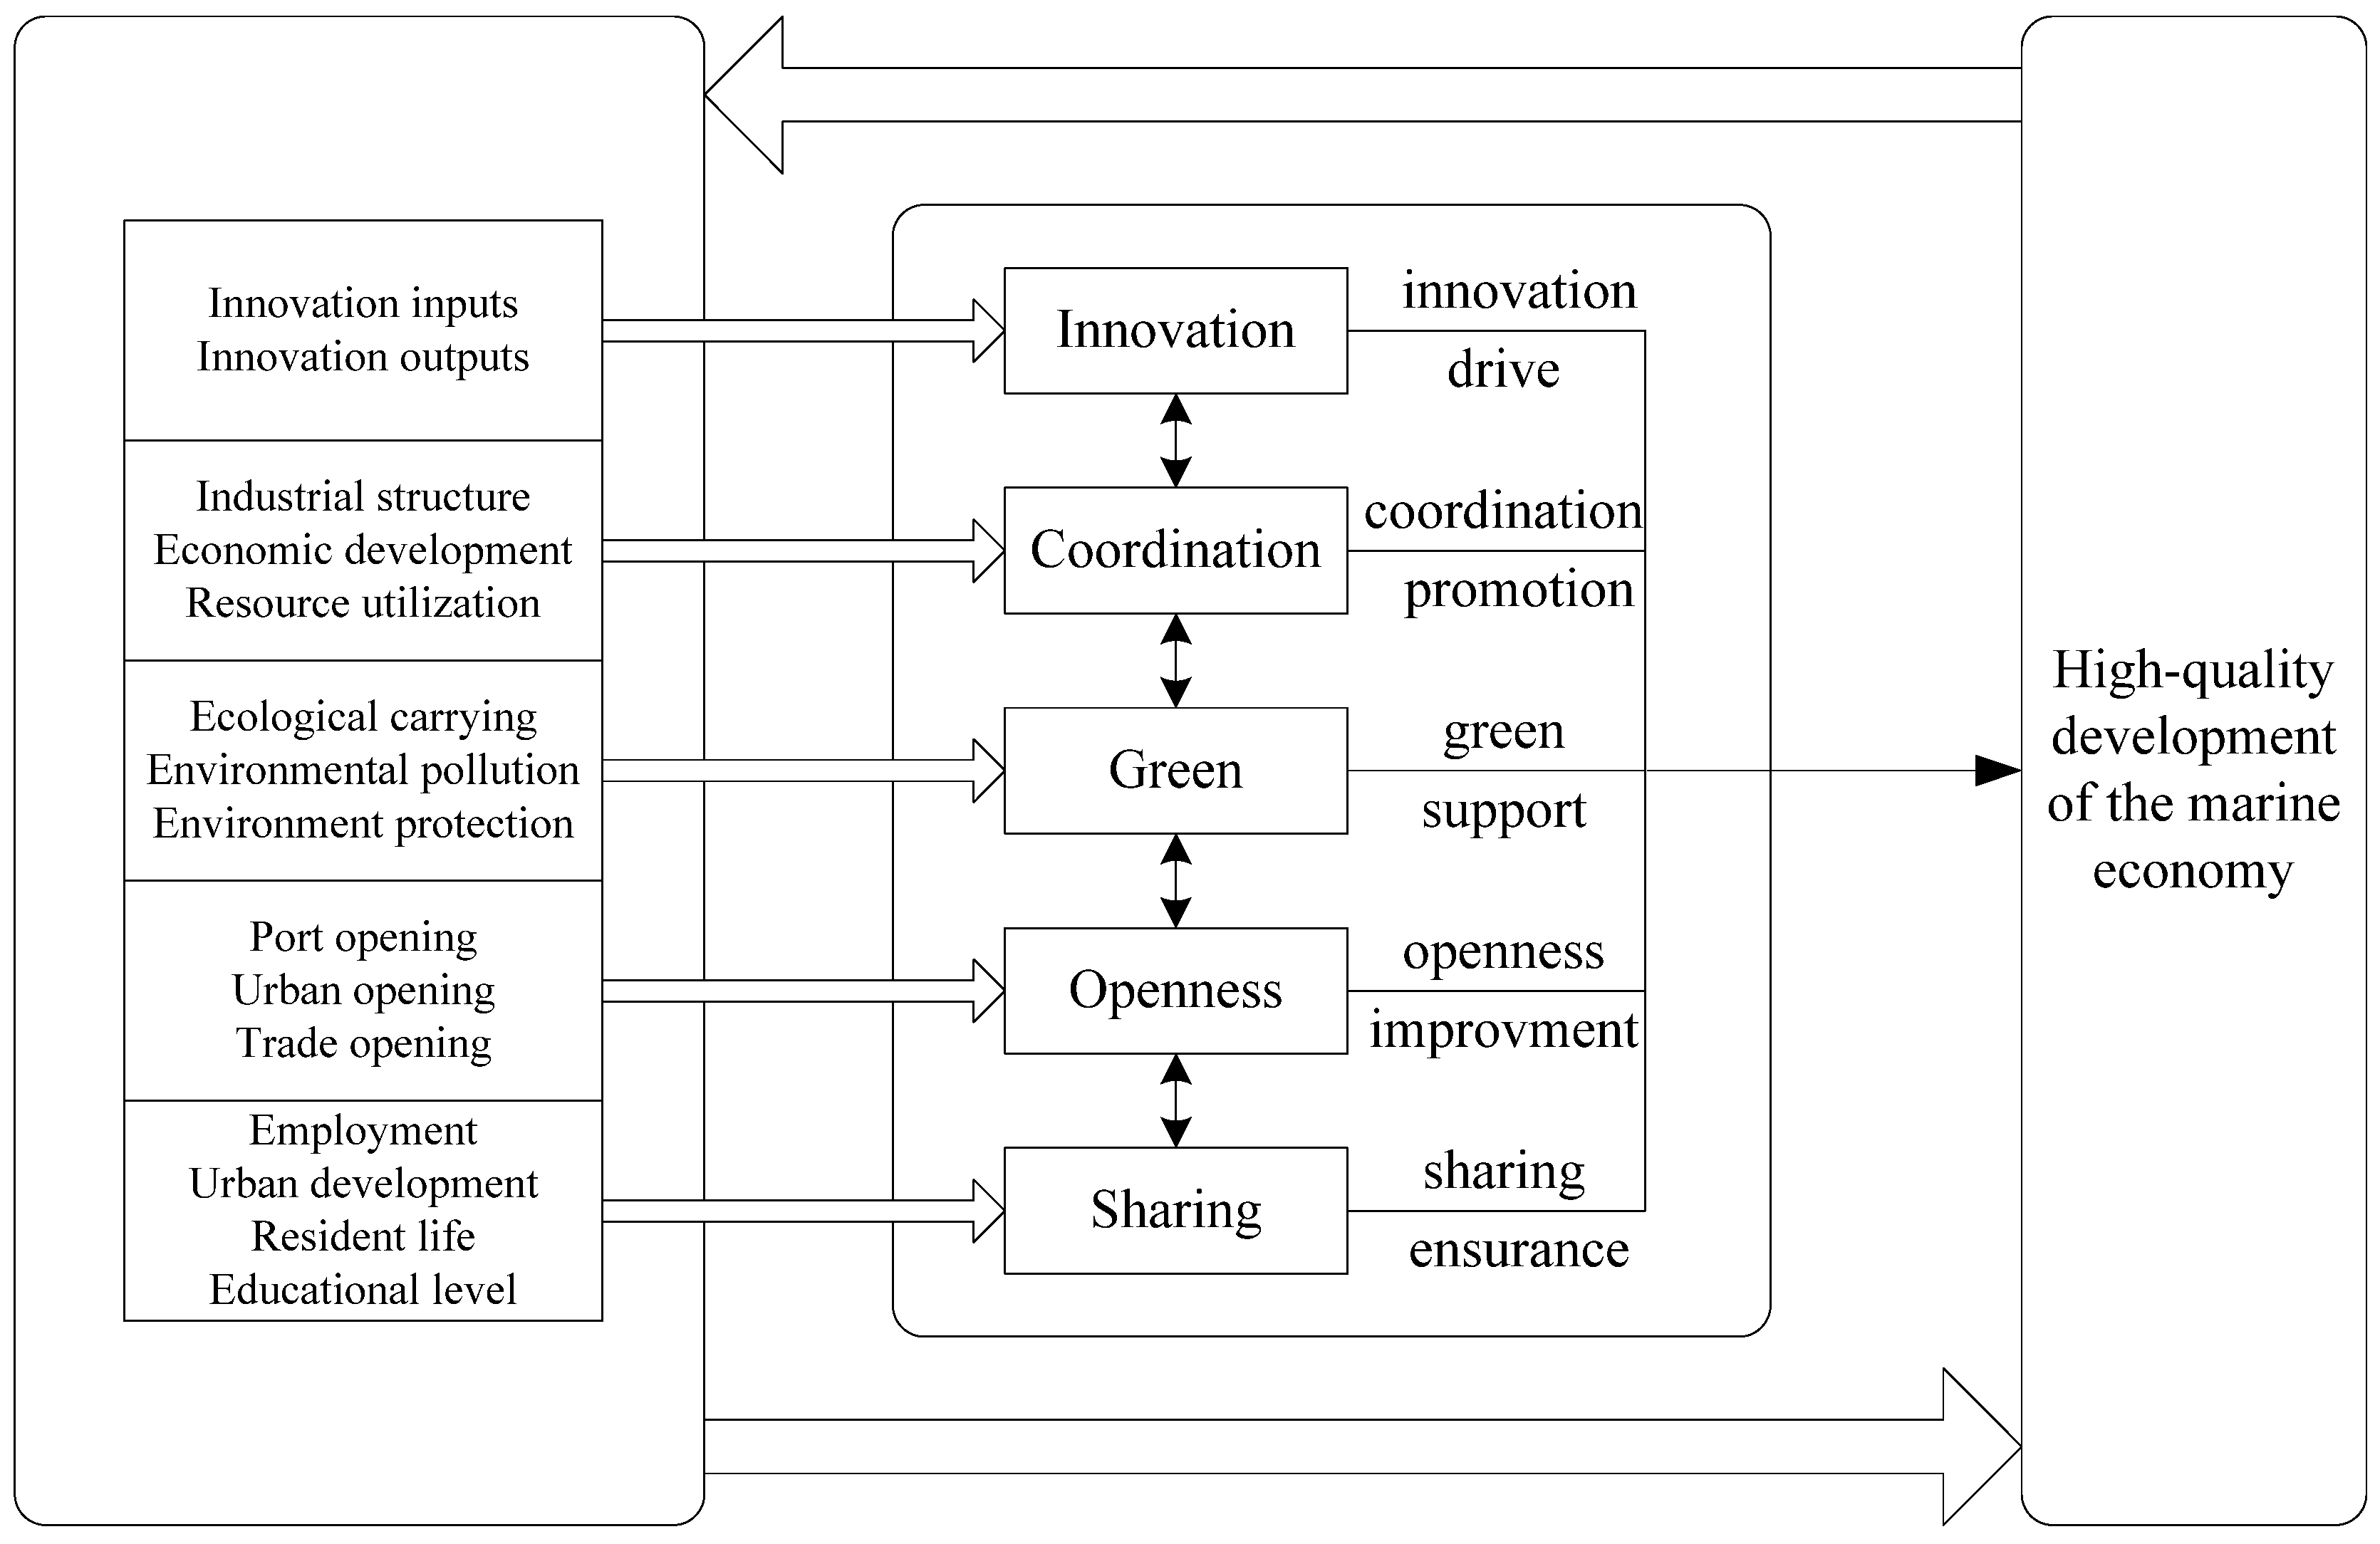
3. Mechanism Analysis

The marine economy is a giant system with complex interactions. At present, scholars have not clearly defined the connotations of the high-quality development of the marine economy. Clarifying the connotations of the ocean economy conduces to pointing out the direction of high-quality development. Combined with the existing research, we summarized the following connotation: the high-quality development of the marine economy refers to the process of ocean development and production with innovation as the power source, adhering to green development, developing marine resources rationally, expanding the scale of opening up continuously, and the results being shared by the people. This is the deep integration of the five development concepts into marine economic development.
The high-quality development of the marine economy is a fundamental guarantee for the realization of establishing a strong marine country. While adhering to the five development concepts and leading high-quality development, the enhancement of the ocean economy promotes the synergy of various systems [37]. High-quality development can promote the cultivation of marine talents and raise the level of sea-related innovation; improve the layout of marine industries and coordinate the development of industries; increase investment in pollution control and seek a green development approach; stimulate the vitality of sea-related enterprises and improve the quality of opening up; and enhance the capacity of people’s services and advance the sharing of development results. The mechanism is shown in Figure 1.

3.1. Innovation Drives the High-Quality Development of the Marine Economy

Innovation is the driving force for the high-quality development of the marine economy, which is mainly reflected in the innovation achievements, innovation talents, and innovation environment and empowers economic sustainability [38]. The world is in a period of great scientific and technological change. Labor and resource factor prices continue to rise, traditional marine economic development is overly dependent on resource inputs, and industrial expansion and other development modes have been difficult to meet the needs of modern marine development. Upgrading the level of innovation and accelerating the implementation of innovation-driven strategies have become the keys to improving the efficiency of the marine economy [39]. In order to take the lead in the fierce international marine competition, it is not only necessary to increase the investment in sea-related scientific research and pursue the quantity of innovation, but also to raise the efficiency of results transformation, promote balanced regional development, reduce the additional cost of the environment, and enhance the innovation quality so as to promote the development.

3.2. Coordination Promotes the High-Quality Development of the Marine Economy

Coordination is both a means and a goal, and coordinated development is mainly manifested in various aspects such as the economy, industry, and resources [40]. The marine economy consists of multiple systems, and coordination emphasizes the correlation and balance among the systems. The marine economy has gradually transitioned from a single industry to multiple industries and from its dominance of the ocean to the integration of land and ocean [41]. The complementarity of sea and land resources enhances the close linkage between the ocean economy and the land-based economy, promotes synergistic linkages between the economies of coastal regions, and contributes to a more rational allocation of the layout of marine industries and resource elements.

3.3. Green Supports the High-Quality Development of the Marine Economy

Green is a support for the harmonious coexistence of humans and the ocean, and it is also an important embodiment of sustainability. The rapid growth of the ocean economy has damaged the marine ecosystem far beyond the ecosystem’s ability to repair itself, and the resource and environmental costs brought about have reduced the efficiency of economic development [42]. The ocean economy plays an important role in national economic growth, and sustainable development is the future development trend of the marine economy. Production activities must incorporate green concepts throughout, strengthen the restoration of the carrying capacity of marine ecology, reduce environmental pollution, increase environmental protection efforts, and push the green development of the marine economy.

3.4. Opening Up Improves the High-Quality Development of the Marine Economy

Openness is a solid foundation for the high-quality development of the marine economy [43]. The marine economy belongs to the export-oriented development model, which requires a domestic base to promote the double cycle of international and domestic. It makes full use of external resources, and it exerts internal and external linkages to improve the strength of the marine economy. Relying on the “Reform and Opening-up” strategy, we will jointly build a platform for ocean development and cooperation, create the “Blue Silicon Valley” in the East, and enhance the influence of marine opening up. The coastal provinces are at the frontiers of opening up, and the opening up of ports, cities, and trade has injected vitality into economic development.

3.5. Sharing Ensures the High-Quality Development of the Marine Economy

The fundamental purpose of economic development is to benefit the people. Adherence to the concept of shared development will help figure out the problem of imbalanced development and bring more social benefits. The prosperity of the ocean economy provides a lot of jobs for the people, promotes the urbanization process, and improves people’s living standards [44]. At present, ocean development should be people-oriented, improve the sea-related public service system, promote the construction of infrastructure in coastal cities, and provide more convenience for people’s lives and social development.

4. Indicator System and Model Construction

4.1. Study Areas

In this study, 11 coastal regions in China were selected as the study areas (Figure 2). Due to missing data, Hong Kong, Macau, and Taiwan were excluded. Further, with reference to the State Council’s division standards, China’s coastal areas were divided into three major regions, namely the northern (Liaoning, Tianjin, Hebei, and Shandong), eastern (Jiangsu, Zhejiang, and Shanghai), and southern (Fujian, Guangdong, Guangxi, and Hainan) marine economic circles.

4.2. Construction of the Indicator System

We fully consider the particularity of the marine economy and select relevant indicators. The innovation ability directly reflects the quality of marine economic development. Coordinated development should focus on promoting the coordination of the marine economy, industrial structure, and resources. Green is the basic criterion for high-quality development goals and a crucial basis for measuring ecological civilization. Opening up is a necessary path to achieve sustainable development, and deepening the opening up of coastal areas will be conducive to increasing the level of the marine economy. The ultimate goal of economic development is to raise public services. Referring to relevant research results [45], we selected 5 indicators to measure the innovation index, 8 indicators to measure the coordination index, 11 indicators to measure the green index, 5 indicators to measure the open index, 8 indicators to measure the sharing index, and a total of 40 indicators to construct a high-quality marine economy development indicator system, as shown in Table 1.

4.3. Calculation and Classification of Evaluation Values

A judgment matrix is constructed for each index value in the indicator system:
X = x i j m × n i = 1 , 2 , , m ; j = 1 , 2 , n
where i is the element of the object involved in the evaluation; j is the element of the indicator; m is the number of objects; and n is the number of indicators per object.
We are going to perform a dimensionless process on the raw data; the formula is as follows:
μ i j = x i j min x j max x j min x j
μ i j = max x j x i j max x j min x j
where u i j is the normalized value, x i j is the original value of indicator j in year i, max x j is the maximum value of indicator j, and min x j is the minimum value of indicator j.
The high-quality development of the regional marine economy is a comprehensive concept, and a single subjective and objective evaluation method cannot include all the data. The evaluation methods of the comprehensive index system are various, and one of the key differences lies in how to determine the weight of each specific index. The entropy weighting method can objectively reflect the size of the information in the data by calculating the weight of indicators, effectively avoiding the errors brought by subjective factors in the weight calculation. But there is a possibility of detaching from the essence of the significance and value of the indicators. The analytic hierarchy process relies on experience to judge the indicators, which is more subjective and will lead to a large bias in the calculation results. The combination of two methods can effectively avoid the drawbacks of both and take into account the value of the indicator and the amount of information.
Entropy weighting method:
p i j = u i j / i = 1 m u i j
where pij is the weight of the j standardized data in i year, μij is the standardized value of each element after the standardization process.
Calculate the information entropy:
e j = K i = 1 m p i j ln p i j
where ej is the entropy value of indicator j, K is a constant, K = 1 / ln m .
Calculate the weights ωj:
ω j = 1 e j / j = 1 n 1 e j
Analytic hierarchy process:
Construct the matrix, solve the eigenvectors, and normalize it to obtain the weight vector Wj. The consistency test is performed by the ratio (CR) of the consistency index CI and the random consistency index RI, and the test is passed if CR < 0.1. Finalize the weights Wj.
a j = α ω i + β W j j = 1 n α ω j + β W j
where a j is the combined weight, α and β are constants, and α = β = 1/2.
W R C C = j = 1 n a j × μ i j i = 1 , 2 , , m ; j = 1 , 2 , , n

4.4. Coupling Coordination Degree Model

The coupling coordination degree model embodies the matching and coordination relationship between the research objects, and it has obvious advantages and applicability prospects in exploring the system fit degree. It can fully reflect the overall coupling and synergistic effects of multiple subsystems. In recent years, it has become an effective evaluation and research tool, and it has been widely used in empirical research on the coupling and coordinated development level of many systems at different scales and in different regions. Referring to the three-system coupling [46], the five-dimensional system coupling coordination degree model for the high-quality development of the ocean economy is constructed:
C = P 1 × P 2 × P 3 × P 4 × P 5 P 1 + P 2 + P 3 + P 4 + P 5 / 5 5 1 / 5
T = β 1 P 1 + β 2 P 2 + β 3 P 3 + β 4 P 4 + β 5 P 5
D = C × T
where C denotes the degree of coupling, T denotes the degree of coordination, and D denotes the degree of coupling coordination. P 1 , P 2 , P 3 , P 4 , and P 5 represent the composite indices of the five subsystems. β 1 , β 2 , β 3 , β 4 , and β 5 denote the corresponding system weights, that is, β 1 = β 2 = β 3 = β 4 = β 5 = 1/5 [47].
We classify the coupling coordination degree into four levels and ten types [48]; the specific classification is shown in Table 2.

4.5. Gini Coefficient

To study the heterogeneity of regional development, Dagum proposed Gini coefficient and its decomposition method, which is used in economics to explore spatial disequilibrium problems [49]. This paper explores the regional differences in the high-quality development of the marine economy using the Gini coefficient, and the specific formula is as follows:
G = j = 1 k h = 1 k i = 1 n j r = 1 n h y j i y h r 2 n 2 μ
where yji and yhr denote the level of high-quality development of the marine economy of the i and r province in the j and h regions, respectively, k is the number of regions, n is the number of samples, and μ denotes the mean value.
The Gini coefficient for region j is expressed as follows:
G j j = 1 2 μ j i = 1 n j r = 1 n h y j i y h r n j 2
The Gini coefficient between regions j and h is expressed as follows:
G j h = i = 1 n j r = 1 n h y j i y h r n j n h μ j + μ h
The Gini coefficient can be decomposed as follows:
G = G w + G n b + G t = j = 1 k G j j P j S j + j = 2 k h = 1 j 1 G j j P j S h + P h S j D j h + j = 2 k h = 1 j 1 G j j P j S h + P h S j 1 D j h
D j h = d j h p j h d j h + p j h
where Gw denotes the contribution of the within-cluster variation, Gnb denotes the contribution of the between-cluster variation, Gt denotes the contribution of hypervariable density, and Djh is a measure of the relative impact of the between-region variation, p j = n j / n , s j = n j μ j / n μ .
d j h = 0 d F j y 0 y y x d F h y
p j h = 0 d F h y 0 y y x d F j y
where F is the cumulative distribution function for each region, djh is the mathematical expectation for all y j i y h r > 0 in regions j and h, and pjh is the mathematical expectation for all y j h y h r < 0 in regions j and h.

4.6. Data Sources

We selected the relevant data from 2012 to 2022 to evaluate the level of the high-quality development of the marine economy. The data are mainly from the China Marine Statistical Yearbook, the China Marine Economy Statistical Yearbook, the China Statistical Yearbook, the China Marine Environmental Quality Bulletin, and the China Fishery Yearbook, and some indicator data are supplemented by linear simulation.

5. Results

5.1. Assessment of the High-Quality Development of the Marine Economy

5.1.1. Temporal Evolution Trends

The high-quality development index of China’s marine economy is shown in Figure 3. The index of the ocean economy from 2012 to 2022 increased from 0.310 to 0.711, indicating that the quality of the marine economy experienced a significant progressive evolution, but the overall index is low. Specifically, the high-quality development of China’s marine economy can be divided into two stages. From 2012 to 2017, the index showed a wavy growth trend. The total development of the ocean economy was faster in this period, but the various systems of the marine did not achieve balanced development, and the innovation capacity was weaker. Therefore, the high-quality development index of the ocean economy grew slowly in the fluctuation. The index recorded steady growth from 2017 to 2022. During this period, the marine industry developed rapidly, the government strengthened its support for marine development, investments in innovation continued to increase, the infrastructure gradually improved, and the pursuit of the economic growth rate increased the strength of environmental protection, so the marine economy realized stable development.
From the perspective of the five development dimensions, the innovation index expressed a rising trend, showing that the level of marine economic innovation realized leapfrog growth. In recent years, China’s innovation investment has risen, the number of sea-related scientific research institutions has gradually increased, and lots of marine, scientific, and technological talents have been trained for the country. The degree of marine innovation has promoted the transformation of scientific research results into economic benefits, and the innovation index has improved significantly. The coordination index grew the fastest from 0.114 to 0.753, indicating that the coordination ability of the ocean’s economic, industrial structure, and resource utilization was further enhanced. The ocean industry has developed vigorously, the development and utilization of resources have been gradually rationalized, and the correlation between land and sea economies has steadily increased. The green index of the marine economy has a flat N-type structure, and the time evolution trend is mainly divided into three stages. The green development index grew rapidly from 2012 to 2017, and during this period, marine ecological carrying capacity and environmental protection gradually improved, and the effect of environmental governance was remarkable. The green index declined slightly from 2017 to 2019, mainly due to excessive growth of the ocean economy and untimely industrial upgrading. The amount of industrial wastewater generated and the amount of water entering the sea increased sharply, bringing greater pressure on the coastal ecological environment. From 2019 to 2022, the green development index rose steadily, and the green development of the marine economy gradually stepped onto the right track. The opening-up index steadily improved. In recent years, China has deepened its reform and opening up, and the level of port opening up, city opening up, and foreign trade has entered a new stage, with the total amount of imports and exports continuing to increase and the degree of opening up constantly improving. The sharing index of the marine economy demonstrated a slow-rising trend. The sharing index involves multiple factors, such as social development, resident life, and education level, with a high degree of comprehensiveness. It shows a significant growth trend in general, but the growth is relatively slow, indicating that the sharing index still has great potential for improvement.

5.1.2. Spatial Distribution Characteristics

The temporal evolution trend analysis only reflects the overall level of marine economic development. We estimated the high-quality development index of the marine economy in different regions to further discuss the regional differences, as shown in Table 3. The level of high-quality development of the marine economy in the eastern marine economic circle is better than that in the north and south. There are significant differences in the level of high-quality development of the marine economy in different provinces. Among the 11 coastal provinces and municipalities, only 5 provinces and municipalities, namely Tianjin, Shandong, Jiangsu, Shanghai, and Guangdong, have a high-quality development index of the marine economy higher than 0.8. These regions have relatively developed economies, a large number of sea-related scientific research institutions, and the level of marine innovation is constantly improving. The government has stepped up efforts to repair and protect the marine environment, and the effect of marine ecological restoration has been remarkable. With the continuous advancement of the opening level, these provinces and cities have also become important windows for China’s foreign exchanges. Guangxi and Hainan have relatively low indices, and there is a large gap with other regions, which has become a crucial area limiting the development of China’s overall ocean economy. Guangxi and Hainan have a relatively small base of the total marine output value; sea-related scientific research institutions lag far behind other provinces; industrial development is relatively sloppy; and ecological protection has been neglected in the process of marine development, which has brought certain pressure to the marine environment. Meanwhile, the relatively backward level of urbanization and residents’ living standards have also become important reasons for hindering the development of the marine economy.

5.2. Assessment of the Coupling Coordination Degree

This paper built a coupling coordination degree model, and the calculation results are shown in Table 4. In the results of the coupling degree, the coupling degree rises from 0.878 to 0.991; the whole is at a higher level of coupling, manifesting that the interaction effect of each system is stronger, and it also implies that in the process of development, the coupling relationship of the system tends to be mature and the internal changes tend to be more and more stabilized. In the results of the coupling coordination degree, the index increases from 0.472 to 0.816. China’s marine economic development has experienced the verge of disorder, barely coupling coordination, primary coupling coordination, intermediate coupling coordination, and finally, it has stepped into the stage of good coupling coordination. The development of the marine economy was manifested as a verge of disorder from 2012 to 2013. The growth pattern of the ocean economy in the period was relatively basic, and the capacity for marine innovation, the coordination levels of the economy, society, resources, and green development were all at a relatively low level. The marine economy from 2014 to 2015 showed barely coupling coordination. Along with the high-speed development of the ocean economy, lots of sea-related research institutions gradually increased, and the capacity for marine innovation was further enhanced. The level of openness and sharing capacity steadily increased, government environmental regulation promoted good results in marine pollution control, and the systems basically realized coordinated development. From 2016 to 2017, this was known as the primary coupling coordination stage. The level of development of the coordination index, green index, and openness index is relatively high, and innovation and sharing have become the main factors limiting the sustainable development of the marine economy. The stage is the period of ocean capital accumulation, and the government tends to emphasize both the speed and quality of economic growth. As the development of China’s marine industry was relatively late, marine innovation has been in a state of catching up, and sea-related scientific research is an important driving factor for promoting the high-quality development of the ocean, both at present and in the future. The marine economy moves towards the intermediate coupling coordination stage in 2018–2021, during which the marine economy basically realizes high-quality development, the ocean industrial structure is rapidly transformed, and the development of the marine economy gradually removes its over-reliance on energy inputs. At this stage, the urbanization level of coastal areas increased significantly, the living standard of residents improved greatly, and urban public infrastructure gradually improved. In 2022, China’s marine economic development showed good coupling coordination. The sub-system index reached new highs with the government actively carrying out ecological restoration and environmental protection, and the marine environment was improved.

5.3. Difference Analysis of High-Quality Development in the Regional Marine Economy

In order to clarify the sources of internal and external differences in the high-quality development of China’s marine economy, we used the Gini coefficient to analyze the differences, and the results are shown in Table 5.
From the overall difference results, the Gini coefficient showed a decreasing trend from 2012 to 2022, suggesting that the difference in the marine economy gradually narrowed. In recent years, China has improved its utilization efficiency of marine resources and increased its efforts to repair and protect the marine’s ecological environment. Significant breakthroughs have been made regarding the distribution of the marine industry and technological innovation, laying a good foundation for ocean economic development. The results of the contribution rate show that intra-regional and inter-regional differences have comparable contributions to the overall differences in ocean economic development, with a joint contribution rate of more than 50% for both, and that the development of the marine economy ought to pay attention to narrowing regional development differences. The average contribution rate of hyper-variable density is 44.234, suggesting that the problem of sample cross-overs between regions has the greatest impact on the overall differences in the high-quality development of the marine economy.
From the results of intra-regional differences, the Gini coefficients of the three major marine economic circles all show a descending trend, and the mean values of the Gini coefficients in the north, east, and south are 0.190, 0.205, and 0.276, respectively, indicating that the internal gap of each marine economic circle gradually narrows and that the development of the northern and eastern marine economic circles is relatively balanced among the provinces and municipalities. The development of the ocean economy in Guangxi and Hainan has been relatively slow, limited by the local economic base, the failure to realize the rational utilization of marine resources, the low level of marine innovation capacity and openness to the outside world, and the high-quality developmental level of internal variability. Subsequently, the southern marine economic circle should be listed as a vital development area.
From the results of inter-regional differences, the Gini coefficient of the north–east and north–south marine economic circles gradually decreases, with mean values of 0.185 and 0.203, respectively. The inter-regional coefficient of the east–south marine economic circle shows the characteristic of decreasing and then increasing, with a mean value of 0.319. It shows that the spatial differences between the regions of the north–east and north–south marine economy circles have gradually narrowed, while the east–south marine economic circle has maintained large differences over a long period of time, which has become an important factor affecting the overall differences in the high-quality development of the marine economy. Overall, the development gap between the marine economic circles is slowly narrowing. The quality of the regional marine economy tends to be coordinated.
From the results of the index difference, as shown in Table 6, the coordination index has the largest total difference, the green index is large, the innovation index and the opening-up index are equal, and the sharing index is the smallest. The above results show that reducing the gap in the ocean economy should use coordinated development as a breakthrough, accelerating the rise of industrial structures, promoting the rational use of marine resources, and upgrading the correlation between the land and sea economies so as to reduce the difference in the coordination of ocean economic development. The intra-regional Gini coefficients show that the opening index of the northern marine economic circle has the largest difference, the green index has the largest difference in the eastern marine economic circle, and the innovation, coordination, and sharing index has the largest difference in the southern marine economic circle. Therefore, improving the level of economic development of the southern marine economic circle and decreasing the difference between the indexes have become the focus of narrowing the gap in the marine economy in the future. The inter-regional Gini coefficient shows that the north–south marine economic circle has the largest difference in innovation, coordination, openness, and sharing, and the north–south marine economy circle has a large difference in the green index, so the development difference between the northern and the southern marine economic circles is obvious. There are differences between the marine industries in the north and the south, and the growth modes of the marine economy are different. There are fewer ocean research institutions in Guangxi and Hainan, and the marine industry transformation is not timely, resulting in a large difference in regional development.

6. Conclusions and Recommendations

6.1. Conclusions

We constructed a comprehensive index system and used the combined empowerment method to measure the level of high-quality development in the marine economy. And we used the coupling coordination degree model to analyze the internal evolution of the system. Finally, we used the Gini coefficient to calculate the differences among different regions and identify important breakthroughs in marine economic development. The main conclusions are as follows:
(1)
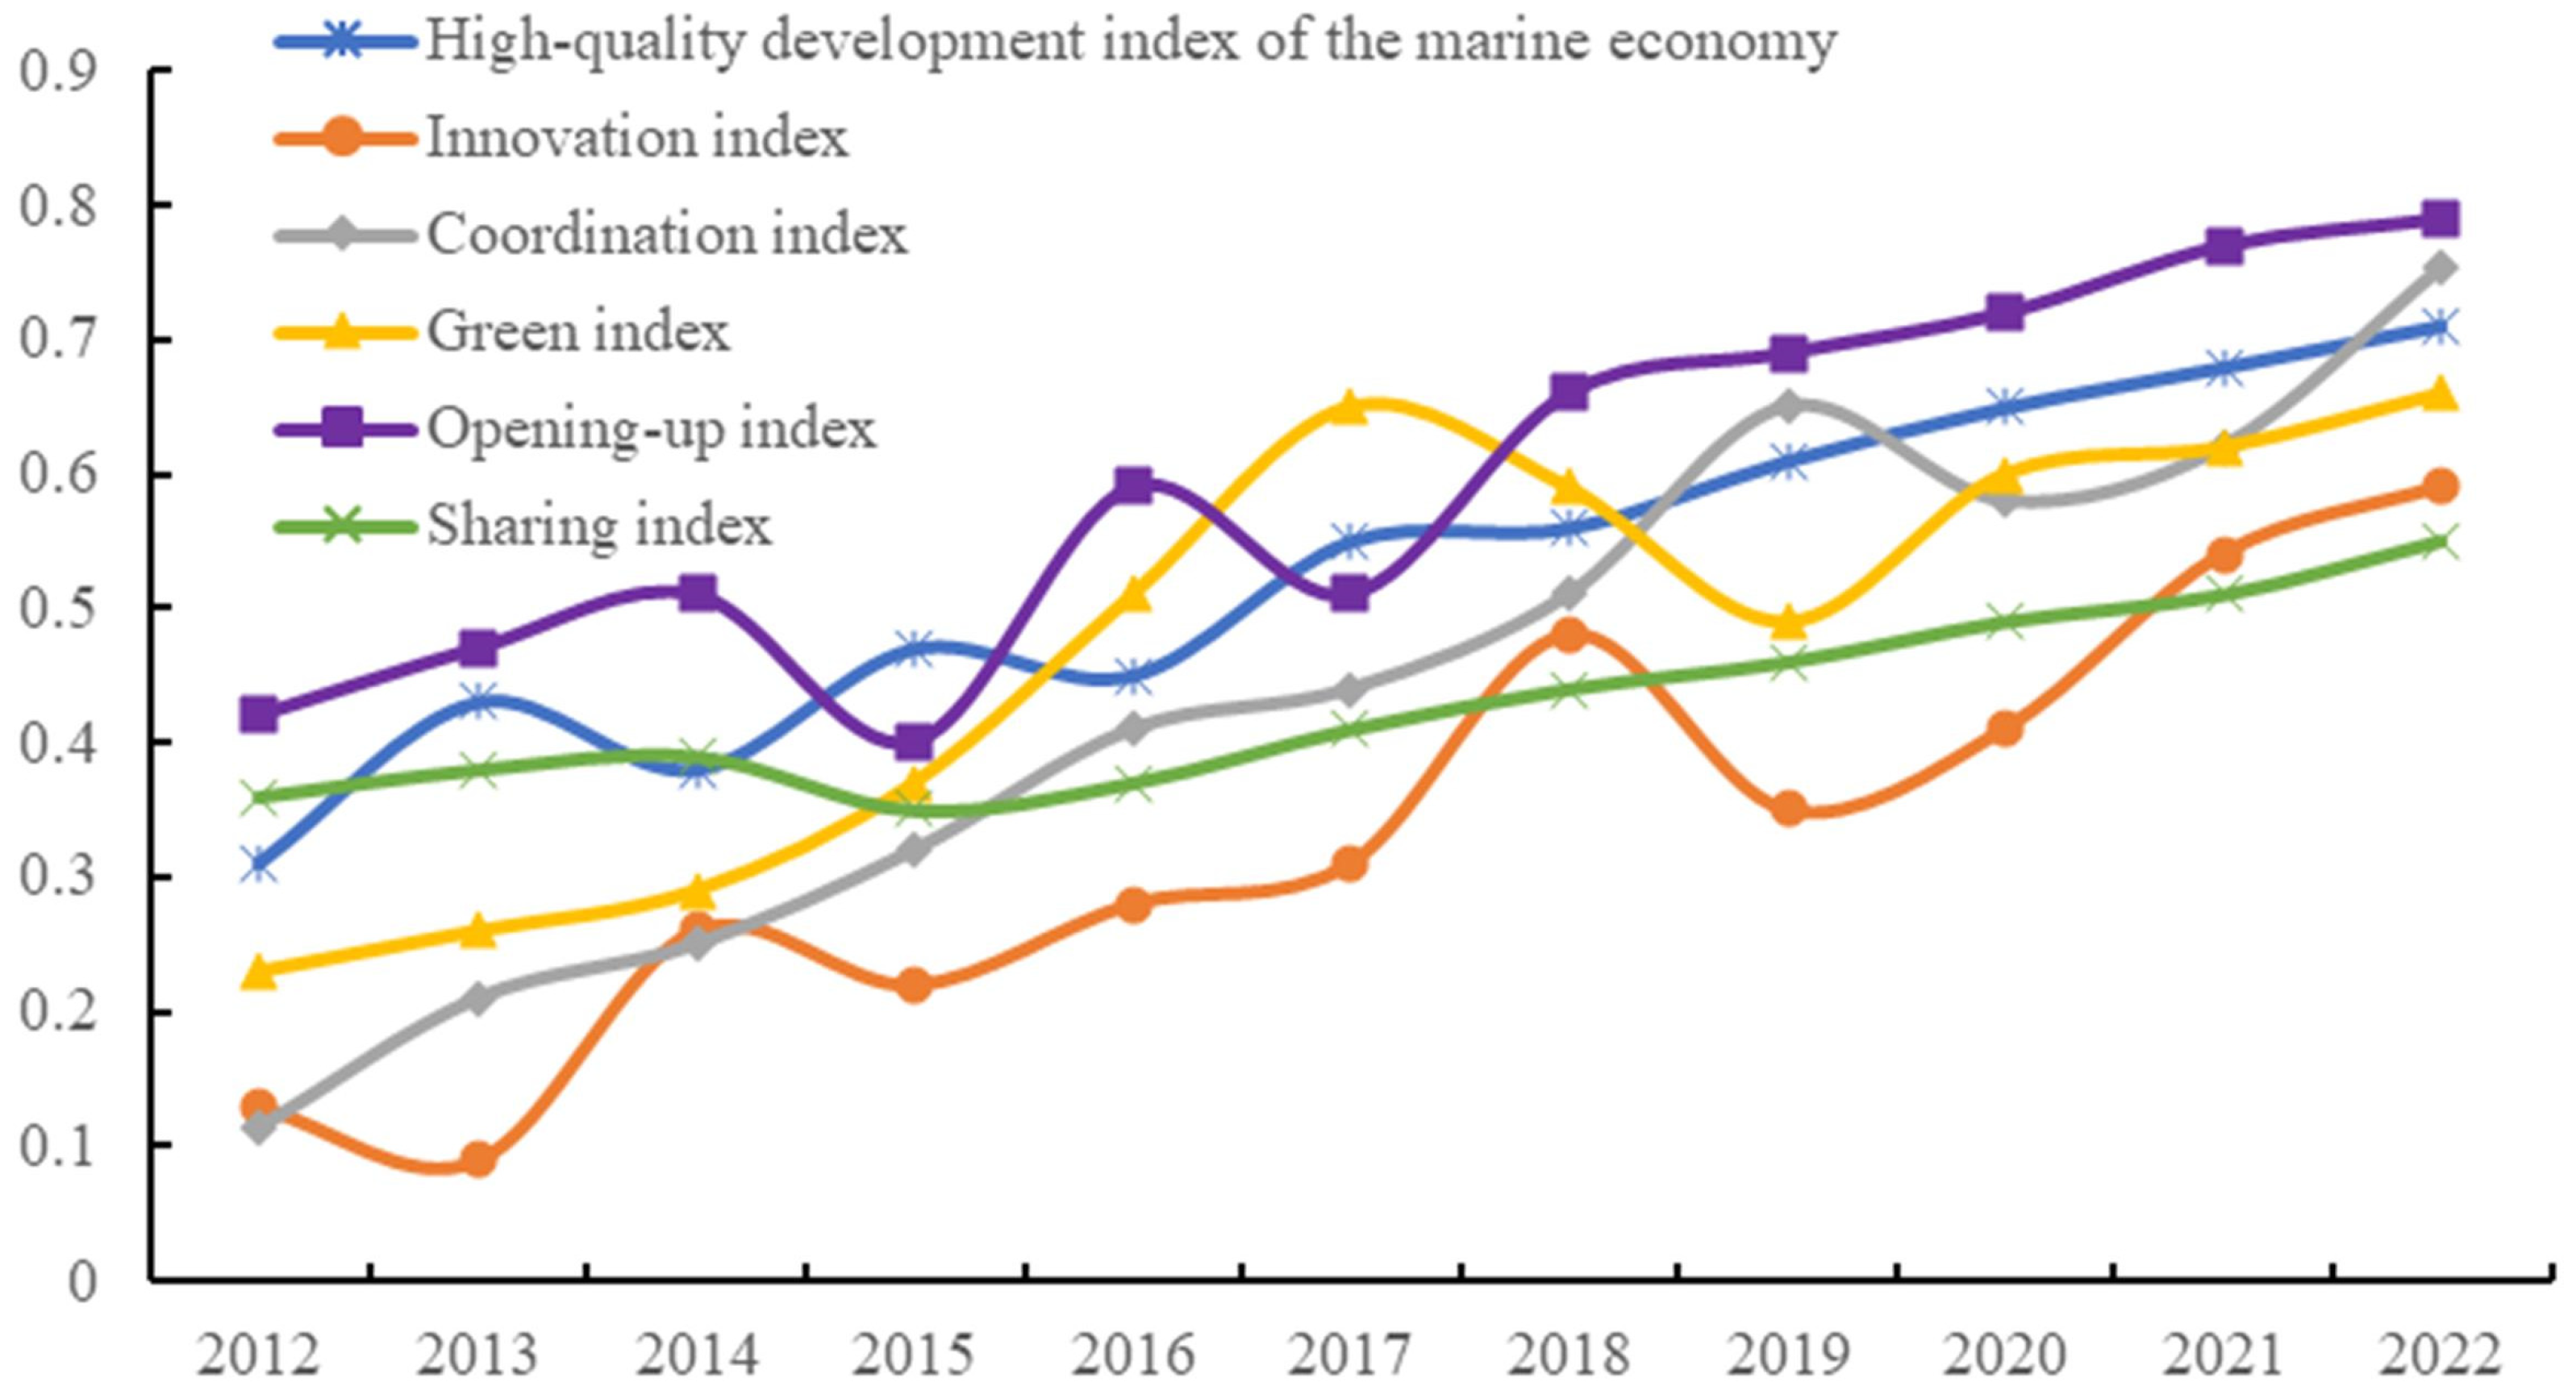
From the perspective of time, the level of high-quality development of China’s marine economy is characterized by significant progressive evolution, and there is still a great potential for improvement. This conclusion is supported by Xu et al. (2023) [1] and Zhang (2020) [2], who believed that the quality of China’s marine economy was gradually improving. The innovation index, coordination index, green index, opening-up index, and sharing index are rising to different degrees, with the coordination index growing the fastest and the sharing index growing more slowly. From the perspective of spatial characteristics, the level of high-quality development of the marine economy in the eastern marine economic circle is better than that in the north and south. Tianjin, Shandong, Jiangsu, Shanghai, and Guangdong have become the front-runners in leading the high-quality development. Guangxi and Hainan have become the key areas restricting the development of the overall ocean economy. The finding indicates an overall increase in the level of high-quality development of China’s marine economy and identifies areas of constraint in the development of the marine economy, which will help to take targeted measures to improve the level of marine economy development.
(2)
During the study period, the coupling degree of the marine economy maintained a high level with strong interactions, and the coupling coordination degree mainly experienced five stages. The coupling coordination degree experienced the development stage of the verge of disorder, barely coupling coordination, primary coupling coordination, intermediate coupling coordination, and then jumped into good coupling coordination. The conclusion proves that the internal system of high-quality development in China’s marine economy tends to be coupled and coordinated, and the interrelationships among innovation, coordination, greening, opening up, and sharing are gradually balanced. It shows that the current development model of China’s marine economy is relatively scientific and reasonable.
(3)
The differences in ocean economic development in China are gradually decreasing, and the five dimensions are becoming more balanced. Hyper-variable density is a key factor impacting the difference in the high-quality development of the marine economy. The results of the intra-region show that the differences within the southern marine economic circle are the largest, followed by the east, and the north is the smallest, and that the differences in the marine economy are mainly constrained by the southern marine economic circle. The results of inter-regional show that the differences between the north–east and the north–south marine economic circle gradually decrease, and the east–south marine economic circle has maintained a large difference for a long time, which has become a vital factor impacting the overall difference in the high-quality development of the marine economy. Liu et al. (2021) [3] believed that regional differences in marine economic development in China’s coastal areas first expand and then decrease. Due to the difference in the time selection of data, we suggest that regional differences in the level of marine economic development have gradually narrowed, indicating that the Chinese government has made greater efforts in marine economic development in recent years. The results of the index differences show that the coordination index is the most differentiated, and the future marine economy should focus on coordinated development. The conclusion illustrates the differences in the development of different ocean economic zones, analyzes the reasons for them, and points out the direction of future efforts for the government of China.

6.2. Recommendations

(1)
Guided by the concept of high-quality development, the government should play an innovation-driven role, increase innovation investment, and enhance capacity for sea-related innovation. Transforming the mode of marine economic development, promoting the common development of ocean economic growth, resource utilization and ecological protection, and establishing a regionally coordinated and cooperative economic system. Improve mechanisms for marine ecological restoration and ecological protection, and raise the opening of ports. Strengthen the infrastructure of coastal cities, increase employment opportunities related to the sea, and emphasize marine educational institutions.
(2)
The government should focus on the problem of unbalanced regional development; the development of the marine economy fluctuates greatly, and the future needs to emphasize the development of resilience. Play the role of Shandong, Jiangsu, Guangdong, and other front-runners to propel the transformation of marine industries in neighboring provinces and cities. Evaluating the obstacles of ocean economic development in Guangxi and Hainan, relying on the advantages of Hainan’s Free Trade Zone, and increasing the degree of opening up. Establish a broad platform to introduce sea-related scientific research projects to realize the quality of marine economic development and catch up.
(3)
The level of high-quality development of China’s marine economy has not yet reached a state of ideal coupling coordination, and there are large differences within and outside the region. The southern marine economic circle is an important breakthrough to eliminate the differences in regional development. We should boost the balanced development of various systems in the southern marine economic circle to prevent the risk of extreme differentiation in the marine economy.
(4)
From the social level, sea-related enterprises strive to become the main body of innovation decision-making, R&D investment, scientific research organization and achievement transformation. Scientific layout and development of mariculture according to local conditions, the construction of intensive ecological aquaculture, and aquaculture bases. Encourage marine enterprises to complement each other and help each other, and promote the extension and interconnected development of the industrial chain of marine and land industries.

Author Contributions

Conceptualization, D.H.; Methodology, D.H.; Software, Z.C.; Formal analysis, Z.C.; Writing—original draft, D.H.; Writing—review & editing, Z.C. All authors have read and agreed to the published version of the manuscript.

Funding

This research received no external funding.

Institutional Review Board Statement

Not applicable.

Informed Consent Statement

Not applicable.

Data Availability Statement

The data presented in this study are available on request from the corresponding author.

Conflicts of Interest

The authors declare no conflict of interest.

References

  1. Xu, T.; Dong, J.; Qiao, D. China’s marine economic efficiency: A meta-analysis. Ocean. Coast. Manag. 2023, 239, 106633. [Google Scholar] [CrossRef]
  2. Zhang, Q. Regional Marine economic development and gray prediction based on comprehensive evaluation system. J. Coast. Res. 2020, 112, 191–194. [Google Scholar] [CrossRef]
  3. Liu, P.D.; Zhu, B.Y.; Yang, M.Y. Has marine technology innovation promoted the high-quality development of the marine economy?—Evidence from coastal regions in China. Ocean. Coast. Manag. 2021, 209, 105695. [Google Scholar] [CrossRef]
  4. Sun, C.Z.; Wang, L.J.; Zou, W.; Zhai, X.Q. The high-quality development level assessment of marine economy in China based on a “2+6+4” framework. Ocean. Coast. Manag. 2023, 244, 106822. [Google Scholar] [CrossRef]
  5. Emily, S.; Eleni, P.; Tara, H.; Melanie, C.A.; Yan, X.Y. The marine economy of the United Kingdom. Mar. Policy 2020, 116, 103905. [Google Scholar] [CrossRef]
  6. Liu, Y.; Jiang, Y.; Pei, Z.; Xia, N.; Wang, A. Evolution of the coupling coordination between the marine economy and digital economy. Sustainability 2023, 15, 5600. [Google Scholar] [CrossRef]
  7. Wang, Q.; Xu, J.R.; Zhang, Y. Research on the dynamic co-evolution of the complex system of economy-innovation-environment of the marine industry in China. Front. Mar. Sci. 2023, 10, 1197176. [Google Scholar] [CrossRef]
  8. Ren, W.; Chen, Y. Realizing the improvement of green total factor productivity of the marine economy—New evidence from China’s coastal areas. Int. J. Environ. Res. Public Health 2022, 19, 8619. [Google Scholar] [CrossRef]
  9. Yu, H.J.; Xing, L.L. Analysis of the spatiotemporal differences in the quality of marine economic growth in China. J. Coast. Res. 2021, 37, 589–600. [Google Scholar] [CrossRef]
  10. Chen, P.; Chen, H.R.; Chen, K.; Ke, H.W.; Cai, M.G. Quantitative assessment of the response of seawater environmental quality to marine protection policies under regional economic development—A case study of Xiamen Bay, China. Mar. Environ. Res. 2023, 186, 105934. [Google Scholar] [CrossRef]
  11. Huang, Z. Sustainable configuration paths of marine eco-efficiency: Based on fuzzy-set qualitative comparative analysis of 11 coastal areas in China. Soft Comput. 2022, 26, 11017–11032. [Google Scholar] [CrossRef]
  12. Ding, L.; Zhao, Z.; Wang, L. Exploring the role of technical and financial support in upgrading the marine industrial structure in the Bohai Rim region: Evidence from coastal cities. Ocean. Coast. Manag. 2023, 243, 106659. [Google Scholar] [CrossRef]
  13. Jattak, Z.U.; Wu, W.; Gao, J.; Zhang, K.; Murtaza, S.H.; Jan, M.; Ahmed, A. Advancing the initiatives of sustainable coastal and marine areas development in Pakistan through marine spatial planning. Sci. Prog. 2023, 106, 368504231218601. [Google Scholar] [CrossRef] [PubMed]
  14. Ma, H.D.; Li, L.X. Could environmental regulation promote the technological innovation of China’s emerging marine enterprises? Based on the moderating effect of government grants. Environ. Res. 2021, 202, 111682. [Google Scholar] [CrossRef] [PubMed]
  15. Wang, X.H. A Study of the Key Influencing Factors in Management Innovation of SMEs of Ocean Technology in China. J. Coast. Res. 2020, 111, 336–339. [Google Scholar] [CrossRef]
  16. Wang, S.H.; Lu, B.B.; Yin, K.D. Financial development, productivity, and high-quality development of the marine economy. Mar. Policy 2021, 130, 104553. [Google Scholar] [CrossRef]
  17. Zhou, Y.; Li, G.; Zhou, S.R.; Hu, D.X.; Zhang, S.Y.; Kong, L.Y. Spatio-temporal differences and convergence analysis of green development efficiency of marine economy in China. Ocean. Coast. Manag. 2023, 238, 106560. [Google Scholar] [CrossRef]
  18. Gou, L.F.; Yang, S.W.; Ren, L.L. Coupling analysis of the quality and quantity of marine economic growth from the perspective of high-quality development. J. Coast. Res. 2021, 38, 218–228. [Google Scholar] [CrossRef]
  19. Gao, S.; Sun, H.; Wang, J.; Liu, W. Evaluation and countermeasures of high-quality development of China’s marine economy based on PSO-SVM. Sustainability 2022, 14, 10749. [Google Scholar] [CrossRef]
  20. Sun, Z.; Guan, H.; Zhao, A. Research on the synergistic effect of the composite system for high-quality development of the marine economy in China. Systems 2023, 11, 282. [Google Scholar] [CrossRef]
  21. Maria, A.F.; David, J.; Carlos, P.S.; Tomás, B.R. Developing a performance evaluation mechanism for Portuguese marine spatial planning using a participatory approach. J. Clean. Prod. 2018, 180, 913–923. [Google Scholar] [CrossRef]
  22. Putten, I.; Cvitanovic, C.; Fulton, E.A. A changing marine sector in Australian coastal communities: An analysis of inter and intra sectoral industry connections and employment. Ocean. Coast. Manag. 2016, 131, 1–12. [Google Scholar] [CrossRef]
  23. Charles, S.C. The ocean economy of the United States: Measurement, distribution, & trends. Ocean. Coast. Manag. 2013, 71, 334–343. [Google Scholar] [CrossRef]
  24. Martínez, M.L.; Intralawan, A.; Vázquez, G.; Pérez-Maqueo, O.; Sutton, P.; Landgrave, R. The coasts of our world: Ecological, economic and social importance. Ecol. Econ. 2007, 63, 254–272. [Google Scholar] [CrossRef]
  25. Hoagland, P.; Jin, D. Accounting for marine economic activities in large marine ecosystems. Ocean. Coast. Manag. 2008, 51, 246–258. [Google Scholar] [CrossRef]
  26. Li, J.K.; Zhang, J.; Gong, L.T.; Miao, P. Research on the total factor productivity and decomposition of Chinese coastal marine economy: Based on DEA-Malmquist index. J. Coast. Res. 2015, 73, 283–289. [Google Scholar] [CrossRef]
  27. Zhang, Y. Dynamic research on total factor productivity of China’s ocean economy. J. Coast. Res. 2019, 98, 227–230. [Google Scholar] [CrossRef]
  28. Wu, H.Y.; Chen, K.L.; Chen, Z.H.; Chen, Q.H.; Qiu, Y.P.; Wu, J.C.; Zhang, J.F. Evaluation for the ecological quality status of coastal waters in East China Sea using fuzzy integrated assessment method. Mar. Pollut. Bull. 2012, 64, 546–555. [Google Scholar] [CrossRef]
  29. Liu, G.L.; Xu, Y.; Ge, W.F.; Yang, X.D.; Su, X.F.; Shen, B.; Ran, Q.Y. How can marine fishery enable low carbon development in China? Based on system dynamics simulation analysis. Ocean. Coast. Manag. 2023, 231, 106382. [Google Scholar] [CrossRef]
  30. Shi, H.L. Application of back propagation (BP) neural network in marine regional economic forecast. J. Coast. Res. 2019, 98, 67–70. [Google Scholar] [CrossRef]
  31. Yu, J.P.; Yu, W.Y. The economic benefit of marine based on DEA model. Int. J. Low-Carbon Technol. 2018, 13, 364–368. [Google Scholar] [CrossRef]
  32. Yan, X.D.; Shi, X.R.; Fang, X. The internal dynamics and regional differences of China’s marine economic evolution based on comprehensive evaluation. Alex. Eng. J. 2022, 61, 7571–7583. [Google Scholar] [CrossRef]
  33. Yang, Y.B.; Sun, H.W.; Dai, Z.; Wu, M.; Fu, S.M. Comprehensive evaluation of majors offered by universities based on combination weighting. Eval. Program Plan. 2023, 97, 102202. [Google Scholar] [CrossRef] [PubMed]
  34. Zhai, X.Q.; Sun, C.Z.; Zou, W.; Hao, S. Spatiotemporal characteristic and evolution of China’s marine economic resilience. Ocean. Coast. Manag. 2023, 238, 106562. [Google Scholar] [CrossRef]
  35. Yadav, F.; Roozbahani, A.; Hashemy, S.S.M. Performance evaluation of agricultural surface water distribution systems based on water-food-energy nexus and using AHP-Entropy-WASPAS technique. Water Resour. Manag. 2022, 36, 4697–4720. [Google Scholar] [CrossRef]
  36. Wang, C. Correlation modeling between ocean spatial distribution and economic sustainability. Math. Probl. Eng. 2022, 2022, 5969074. [Google Scholar] [CrossRef]
  37. Liu, S.; Wang, J. Coupling coordination between marine S&T innovation and the high-quality development of the marine economy: A case study of China’s coastal provinces. Sustainability 2022, 14, 7373. [Google Scholar] [CrossRef]
  38. Yu, D.J.; Zou, Z.W. Empirical research on the interaction between marine scientific and technological innovation and marine economic development. J. Coast. Res. 2020, 108, 7–11. [Google Scholar] [CrossRef]
  39. Li, M. The innovation of management policy and system of marine economy. J. Coast. Res. 2020, 110, 64–66. [Google Scholar] [CrossRef]
  40. Cai, L.; Liang, J.J.; Guo, Z.H.; Ouyang, Y.R.; Yang, M.; Dai, J.J. Evaluation of the coordination between marine ecological environment protection and marine economic development in China. Environ. Sci. Pollut. Res. 2023, 30, 31524–31532. [Google Scholar] [CrossRef]
  41. Qian, X.L. Research on the coordinated development model of marine ecological environment protection and economic sustainable development. J. Sea Res. 2023, 193, 102377. [Google Scholar] [CrossRef]
  42. Ji, J.; Zhou, J.; Yin, X. Has Technological progress contributed to the bias of green output in China’s marine economy? Water 2022, 14, 443. [Google Scholar] [CrossRef]
  43. Zou, W.; Yang, Y.; Yang, M.; Zhang, X.; Lai, S.; Chen, H. Analyzing efficiency measurement and influencing factors of China’s marine green economy: Based on a two-stage network DEA model. Front. Mar. Sci. 2023, 10, 1020373. [Google Scholar] [CrossRef]
  44. Ni, X.; Quan, Y. Measuring the sustainable development of marine economy based on the entropy value method: A Case study in the Yangtze River Delta, China. Sustainability 2023, 15, 6719. [Google Scholar] [CrossRef]
  45. Ren, W.H.; Ji, J.Y.; Chen, L.; Zhang, Y. Evaluation of China’s marine economic efficiency under environmental constraints—An empirical analysis of China’s eleven coastal regions. J. Clean. Prod. 2018, 184, 806–814. [Google Scholar] [CrossRef]
  46. Guo, Q.; Gong, X. Spatial differentiation and driving mechanism of the marine economic resilience in China. Reg. Stud. Mar. Sci. 2023, 68, 103244. [Google Scholar] [CrossRef]
  47. Qi, Y.; Farnoosh, A.; Lin, L.; Liu, H. Coupling coordination analysis of China’s provincial water-energy-food nexus. Environ. Sci. Pollut. Res. 2022, 29, 23303–23313. [Google Scholar] [CrossRef]
  48. Zhang, L.; Zhao, Y. Research on the coupling coordination of green finance, digital economy, and ecological environment in China. Sustainability 2023, 15, 7551. [Google Scholar] [CrossRef]
  49. Dagum, C. A new approach to the decomposition of the Gini income inequality ratio. Empir. Econ. 1997, 22, 515–531. [Google Scholar] [CrossRef]
Figure 1. Mechanism analysis.
Sustainability 16 00469 g001
Figure 2. Study areas.
Sustainability 16 00469 g002
Figure 3. High-quality development index of China’s marine economy.
Sustainability 16 00469 g003
Table 1. Indicator system.
Target LevelEvaluation DimensionIndicators LevelBasic IndicatorsWeights
High-quality development of the marine economyInnovationInnovation inputsMarine science and technology R&D staff0.0242
Investments in marine scientific research0.0306
Innovation outputsNumber of marine science and technology patents granted0.0321
Number of marine science and technology papers0.0128
Income from marine scientific research0.0299
CoordinationIndustrial structureProportion of marine tertiary industry0.0218
Economic developmentGross marine product per capita0.0426
Total output value of marine fisheries0.0123
Investment in fixed assets0.0217
Resource utilizationPer capita sea area0.0035
Length of coastline per capita0.0012
Mariculture area0.0255
Economic density of coastline0.0328
GreenEcological carryingPer capita area of marine wetland reserve0.0126
Per capita water resources0.0107
Environmental pollutionCoastal industrial solid waste generation0.0129
Coastal industrial wastewater discharges0.0136
Wastewater discharge to the sea0.0177
Coastal industrial SO2 emissions0.0284
Environmental protectionComprehensive utilization rate of coastal industrial solid waste0.0097
Coastal industrial wastewater treatment rate0.0172
Coastal industrial SO2 removal rate0.0729
Coastal pollution control completion project0.0133
Number of marine type nature reserves0.0165
Opening upPort openingCargo throughput of coastal ports0.0487
Passenger throughput of coastal ports0.0482
Urban openingNumber of overseas visitors received0.0513
Trade openingTotal import and export value0.0668
Actual utilization of foreign investment0.0291
SharingEmploymentSea-related employment0.0393
Proportion of marine employed population0.0525
Urban developmentUrbanization level0.0368
Resident lifePer capita disposable income0.0284
Per capita consumption expenditure0.0237
Educational levelNumber of marine professional institutions of higher learning0.0243
Number of students enrolled in marine majors in higher education0.0176
Number of students enrolled in marine majors in secondary education0.0168
Table 2. Evaluation criteria for classification of coupling coordination degree.
Degree of CoordinationDType of Coupling Coordination
Coordinated development
(Acceptable interval)
High coordination0.90~1.00High-quality coupling coordination
0.80~0.89Good coupling coordination
General coordination0.70~0.79Intermediate coupling coordination
0.60~0.69Primary coupling coordination
Transitional development
(Transition interval)
0.50~0.59Barely coupling coordination
0.40~0.49Verge of disorder
Dysfunctional recession
(Unacceptable interval)
Imminent coordination0.30~0.39Mild disorder
0.20~0.29Moderate disorder
Dislocation and recession0.10~0.19Severe disorder
0~0.09Extreme disorder
Table 3. High-quality development index of marine economy in coastal provinces and cities.
Provinces20122013201420152016201720182019202020212022
Liaoning0.4130.4250.4480.4890.5130.5420.5710.5940.6260.6650.712
Tianjin0.5040.5360.5690.6120.6460.6580.7320.7640.7730.8040.825
Hebei0.3860.4130.4680.5060.5250.5490.5910.6370.6580.6690.673
Shandong0.5180.5430.5690.5970.6270.6480.6880.7470.7690.7930.836
Jiangsu0.5350.5680.5870.6310.6570.6730.7180.7420.7820.8120.836
Shanghai0.6510.6890.6970.7360.7610.7780.7940.8260.8330.8420.857
Zhejiang0.5240.5630.5750.5790.5920.6440.6710.6820.7250.7470.789
Fujian0.4260.4640.4720.4910.5370.5640.5820.6260.6530.6670.695
Guangdong0.5350.5640.5770.5890.6240.6540.6820.7350.7560.7850.821
Guangxi0.3420.3570.3660.3980.4670.4830.4920.5050.5180.5460.576
Hainan0.2460.2960.3250.3460.3830.4120.4320.4730.5040.5360.567
Northern0.4680.4920.5370.5680.5820.5930.6380.6730.7270.7620.785
Eastern0.5660.6170.6260.6430.6680.6920.7320.7460.7870.8210.847
Southern0.4150.4370.4560.4710.5160.5380.5520.5870.6130.6360.669
Table 4. The results of coupling coordination degree.
YearsInnovation IndexCoordination IndexGreen IndexOpening-Up IndexSharing IndexCTDType of Coupling Coordination
20120.1330.1140.2360.4210.3640.8780.2540.472Verge of disorder
20130.0910.2150.2610.4720.3810.8700.2840.497
20140.2620.2530.2910.5140.3960.9620.3430.575Barely coupling coordination
20150.2230.3240.3720.4010.3540.9810.3350.573
20160.2810.4130.5110.5920.3760.9680.4350.649Primary coupling coordination
20170.3140.4440.6530.5130.4120.9710.4670.674
20180.4830.5150.5920.6640.4410.9890.5390.730Intermediate coupling coordination
20190.3570.6560.4950.6920.4640.9720.5330.720
20200.4130.5820.6010.7230.4920.9820.5620.743
20210.5420.6240.6220.7710.5130.9900.6140.780
20220.5960.7530.6620.7940.5530.9910.6720.816Good coupling coordination
Table 5. Gini coefficient and decomposition results.
YearsTotalIntra-Regional Gini CoefficientInter-Regional Gini CoefficientContribution Rate
NorthEastSouthNorth–EastNorth–SouthEast–SouthIntra-RegionalInter-RegionalHyper-Variable Density
20120.2430.2390.2480.3140.2240.2540.36228.91630.99440.090
20130.2490.2120.2430.3060.2110.2430.35129.43729.63840.925
20140.2350.2070.2390.2960.2130.2310.34627.41628.58344.001
20150.2240.1990.2360.2890.2020.2260.33426.85625.74247.402
20160.2170.1950.2280.2810.1910.2180.32528.72324.84546.432
20170.2050.1890.2160.2720.1820.1910.31630.43228.53841.030
20180.1870.1830.1920.2640.1790.1860.29828.73727.82643.437
20190.1840.1710.1830.2590.1780.1810.28226.72127.73545.544
20200.1810.1680.1760.2550.1650.1750.29127.37628.26444.360
20210.1770.1640.1520.2530.1520.1680.29825.43626.74947.815
20220.1710.1590.1430.2510.1430.1550.30726.92227.53645.542
Mean0.2070.1900.2050.2760.1850.2030.31927.90727.85944.234
Table 6. Means and decomposition results of the Gini coefficient for each index.
IndexesTotalIntra-Regional Gini CoefficientInter-Regional Gini CoefficientContribution Rate
NorthEastSouthNorth–EastNorth–SouthEast–SouthIntra-RegionalInter-RegionalHyper-Variable Density
Innovation0.2350.2030.1970.2680.2660.3320.23725.62921.27453.097
Coordination0.3120.2350.3170.3560.2840.4110.32626.63837.83635.526
Green0.2740.2460.3280.3060.3150.1850.23520.85227.35151.797
Opening0.2310.2590.1280.2310.2180.2960.16823.53625.66250.802
Sharing0.1680.1060.0870.1940.1130.1680.12721.25229.64349.105
Disclaimer/Publisher’s Note: The statements, opinions and data contained in all publications are solely those of the individual author(s) and contributor(s) and not of MDPI and/or the editor(s). MDPI and/or the editor(s) disclaim responsibility for any injury to people or property resulting from any ideas, methods, instructions or products referred to in the content.

