Article

Spatial Web-Interactive Impact Assessment Tool: Affordable Smart City Real Estate

by
Sara Torabi Moghadam
*,
Dana Al Mamlouk
and
Patrizia Lombardi
Inter-University Department of Regional & Urban Studies and Planning (DIST), Politecnico di Torino, 10125 Torino, Italy
*
Author to whom correspondence should be addressed.
Sustainability 2024, 16(19), 8592; https://doi.org/10.3390/su16198592
Submission received: 18 May 2024 / Revised: 10 September 2024 / Accepted: 22 September 2024 / Published: 3 October 2024

Abstract

:
The evaluation of smart affordable cities considering sustainable subsystems improves urban quality of life through efficient resource usage, reduced environmental impacts, and improved living conditions for residents. This study aims to develop an interactive and dynamic Web Geographic Information System (GIS) framework to facilitate decision-making processes during the design phase while including third parties and stakeholders using a spatial interactive impact assessment approach. The methodology follows a quantitative research method based on delivering a tool that could be replicated in other contexts. This tool assesses the impact of smart scenarios to support affordable city planning through selecting Key Performance Indicators (KPIs). This tool was applied to Brazilian large-scale affordable housing within a smart city project. Based on this study, the conclusion reports some research limitations and the possibility of creating a beta version of the tool for future development. The findings show that this Web-GIS framework enhances stakeholder engagement and the effectiveness of decision making in developing sustainable urban planning.

1. Introduction

More than half of the world’s population lives in cities, and another 2.5 billion new residents are predicted by 2050 [1]. While urban cities occupy less than 10% of Earth’s surfaces, they are the main cause of greenhouse gas emissions, energy and resource consumption, and waste production. As cities grow, they become hotspots of innovation and economic progress, but they have also increased the negative environmental impacts of human activity, with the demand for water and electricity expected to increase by 40% by 2050 [2]. In addition, services will not be available to everyone because of greater poverty, air pollution will increase because of concentrated energy usage, health hazards could be created because of uncollected wastes, environmental hazards could also be established because of these huge urban developments, and all of these toxic substances will undoubtedly also have a huge effect on animal populations. Thus, while developing new cities, all of these threats should be taken into consideration, and companies should be able to provide solutions for a healthier environment [3].
Aside from all cities coping with this massive population increase, developing countries face additional issues and challenges that must be addressed. Most developing countries have low statistical capabilities, which prevents them from meeting the expanding demand of the Sustainable Development Goals (SDGs) for data. These developing countries also face numerous constraints that harm residents’ quality of life and result in underdeveloped communities with limited access to energy services [4]. To utilize and control material and immaterial resources, governments are trying to implement “smart” concepts within cities as a solution for various economic and environmental challenges. For example, to regulate temperature and lighting, smart building management systems are being developed to enhance energy usage, which will create sustainable urban environments and improve the quality of living. Intelligent processing and network connectivity have led to innovations within all sectors in cities such as healthcare diagnostics, education, and industrial sectors [5].
A smart city should provide the optimal solutions for a city’s functional requirements to improve the economy and quality of life for residents. Traditional networks and services are more efficient in smart cities as a result of digital solutions. These digital transitions take place through digital tools and platforms, digital data analytics, and changes in organizational culture through different practices of digitalization. Moreover, they will affect the economic development of a city and improve its infrastructure through transportation, communication, and energy systems. This digitalization will also improve public services, promote environmental sustainability, and increase citizen engagement [6]. Developing countries are facing significant challenges in achieving the SDGs due to their limited financial resources. Thus, investments from foreign projects in smart cities within the developing country context are helping these countries to overcome their struggles in achieving the SDGs [7].
The SDGs have been working on making developing communities smarter, such that they can face challenges including poverty, hunger, and inequality within environmental sustainability. This will give communities access to basic needs and help them to overcome their struggles. Creating economic opportunities, promoting social inclusion, and accessing essential services are made possible through integrating technologies in developing communities [8]. Thus, to improve urban services, promote sustainability, and increase quality of life, researchers are using advanced techniques such as machine learning and other optimization techniques. These techniques involve renewable energy sources, energy-efficient technologies, and real-time monitoring systems in smart cities that will optimize the usage of energy sources and reduce carbon emissions [9].
These techniques and innovative technologies will help to achieve SDG 11, which concerns sustainable cities and communities. This goal aims to make cities and human settlements inclusive, safe, resilient, and sustainable. The development of sustainable tools has the capacity to solve struggles within this context, especially in developing countries [10].
In this context, smart solutions can significantly help cities to tackle the above-mentioned challenges in developing countries. Modern city planning projects try to realize affordable smart city ambitions, which leads to greater livability and responsivity. Evaluating the planning impacts of smart city interventions has become increasingly important and, consequently, the need for quantitative measurement is crucial [11].
Initially, only the public administration was privileged by these developed tools, such as the “Smart Cities EU” created by the University of Vienna (2007) or the “Global Power City Index” introduced by the Japanese Institute for Urban Strategies (2008). At present, however, private entities (e.g., real estate) also need to illustrate and prove to third parties the reliability of their proposed smart interventions. This is shown through the development of the impact assessment tools of the Green Building Council such as the Leadership in Energy and Environmental Design (LEED) for Green Building Design and Construction, and for Green Neighbourhood Development [12].
Among the various sectors of real estate, affordable housing is expected to be the most widespread area in 2025. McKinsey Global Institute (2018) projects foresee giving access to affordable housing, offering low-cost prices to around 440 million families or 1.6 billion people [13]. As real estate developers in these contexts can play a significant role, in collaboration with city administrations and non-profit members, it would be extremely useful for them to use appropriate impact assessment tools, such as a ‘visual index’ map, which facilitate discussions with the public sector. Moreover, this will lead to an increase in trust in decision-making processes among the stakeholders and decision-makers [13].
At present, there are limited available systems that can support decisions in an interactive dynamic way and visualize smart scenarios resulting from taking into consideration trade-offs between the economic, social, and environmental aspects of a specific spatial urban development. Planning systems and tools must consider an integrated and interactive approach. Considering that smart urban planning is complex and multi-disciplinary, the main challenge for the future is to integrate the different existing tools and methodologies into a unified structure to visualize the planning results and consequently enhance their quality and robustness. Moreover, it is important to reinforce collaboration between different sectors (e.g., social, economic, and environmental) with a focus on spatial issues [14].
This struggle due to rapid population growth in urban cities is greatly increasing the amount of data needed. Thus, the massive amounts of data required will be gathered by combining traditional tools in urban planning, such as 2D and 3D tools, with dynamic virtual models of cities in real time. This will result in digital twins having a direct impact on the multi-criteria spatial decision support system (MC-SDSS), which will also affect the process of making decisions in smart cities [15].
According to Refs. [16,17], smart city innovations can also be seen in smart poles which offer lighting, wireless connectivity, and environmental monitoring through a variety of sensors and cameras that can collect and transmit data in real time through high-speed internet access. This will improve how city administrators make decisions based on real data. Moreover, digitalization will also have a huge impact on the transportation field due to the development of smart infrastructure and autonomous vehicles; this will require the use of advanced sensors and other smart city devices to create an interconnected framework, such that the vehicles can perceive their environment accurately [17,18].
The innovations presented in this paper are introduced from three aspects. First, a method for assessing the impacts of KPIs is applied. Second, a Web-GIS spatial interactive tool is developed to visualize spatial data for smart cities and decision-making. Finally, these innovations are applied to developing countries, providing solutions for their needs and challenges in developing affordable and sustainable smart cities. The main goal is to create a Web-GIS tool able to dynamically calculate the environmental, economic, and social impacts of smart real estate projects.
The result is a Web-GIS tool that intends to (i) include the information previously collected; (ii) visualize the “baseline” scenario mapping the pre-intervention project; (iii) allow for “dynamic” implementation of solutions; (iv) visualize the future scenarios mapping the post-intervention projects; (v) assess the impact of different scenarios through relevant indicators in real time; and (vi) visualize the impact values for each indicator through presentation exchange instruments.
This tool relies on powerful visualization, where maps become a ‘visual index’ that offers calculated solutions to planners for the optimization of conditions. The stakeholders can express and exert their preferences concerning the indicators and/or scenarios and consequently obtain feedback, increasing the decision/policy-makers’ trust in the results.
The developed interactive tool was applied to the 330-hectare Smart City Laguna, which is 55 km from Fortaleza, the capital city of the Brazilian state of Ceara. The project supports a high quality of life and has 58 smart solutions serving the residents. However, due to its flexibility, the methodology used for delivering the tool could be replicated in other contexts.
The structure of this paper consists of the following sections: Section 1 provides the details of the proposed framework. Thereafter, the methodological approach is illustrated in Section 2.1. Then, Section 2.2 discusses the concept of a smart city and presents the case study. This section also illustrates the application environment. Section 3 presents the results of the application used for evaluating the effectiveness of the proposed framework. Finally, conclusive remarks are discussed in Section 5, and we then identify future developments.

2. Materials and Methods

This section illustrates the methodology for the creation of the Web-GIS interactive tool. It should be specified that the tool has been created to facilitate the workflow set by Planet Smart City which, over time, has developed its own approach to meet the challenges of the construction of smart districts with affordable housing. The Planet Smart City approach is divided into four principal macro-areas (built environment, ecosystem resources, technological systems, and society). Each of these macro-areas consists of a list of pre-defined smart solutions, which are products and/or services. These solutions are selected for different projects based on their specific goals and particulars to respond to the needs of the residents.
This study was conducted in collaboration with the Planet Smart City company. This company is an innovative prop-tech real estate company founded in 2015 to both tackle the global housing crisis in countries with large housing deficits and revitalize existing communities through smart technologies (www.planetsmartcity.com, accessed on 24 July 2023). It has carried out successful projects in North America, South America, Europe, and Asia. Furthermore, Planet Smart City creates future-proof housing units that are sustainable by using innovative smart solutions including digital services and social innovation programs based on the needs of the residents and the community. The company creates projects in developing countries through implementing sustainable urban planning practices and using technological solutions that provide residents with a higher quality of life, creating sustainable places for everyone [19]. Although the tools have not yet been developed to cover and carry out all decision processes, it is important to push future research and development to consider the process as integrative, participative, and interactive.

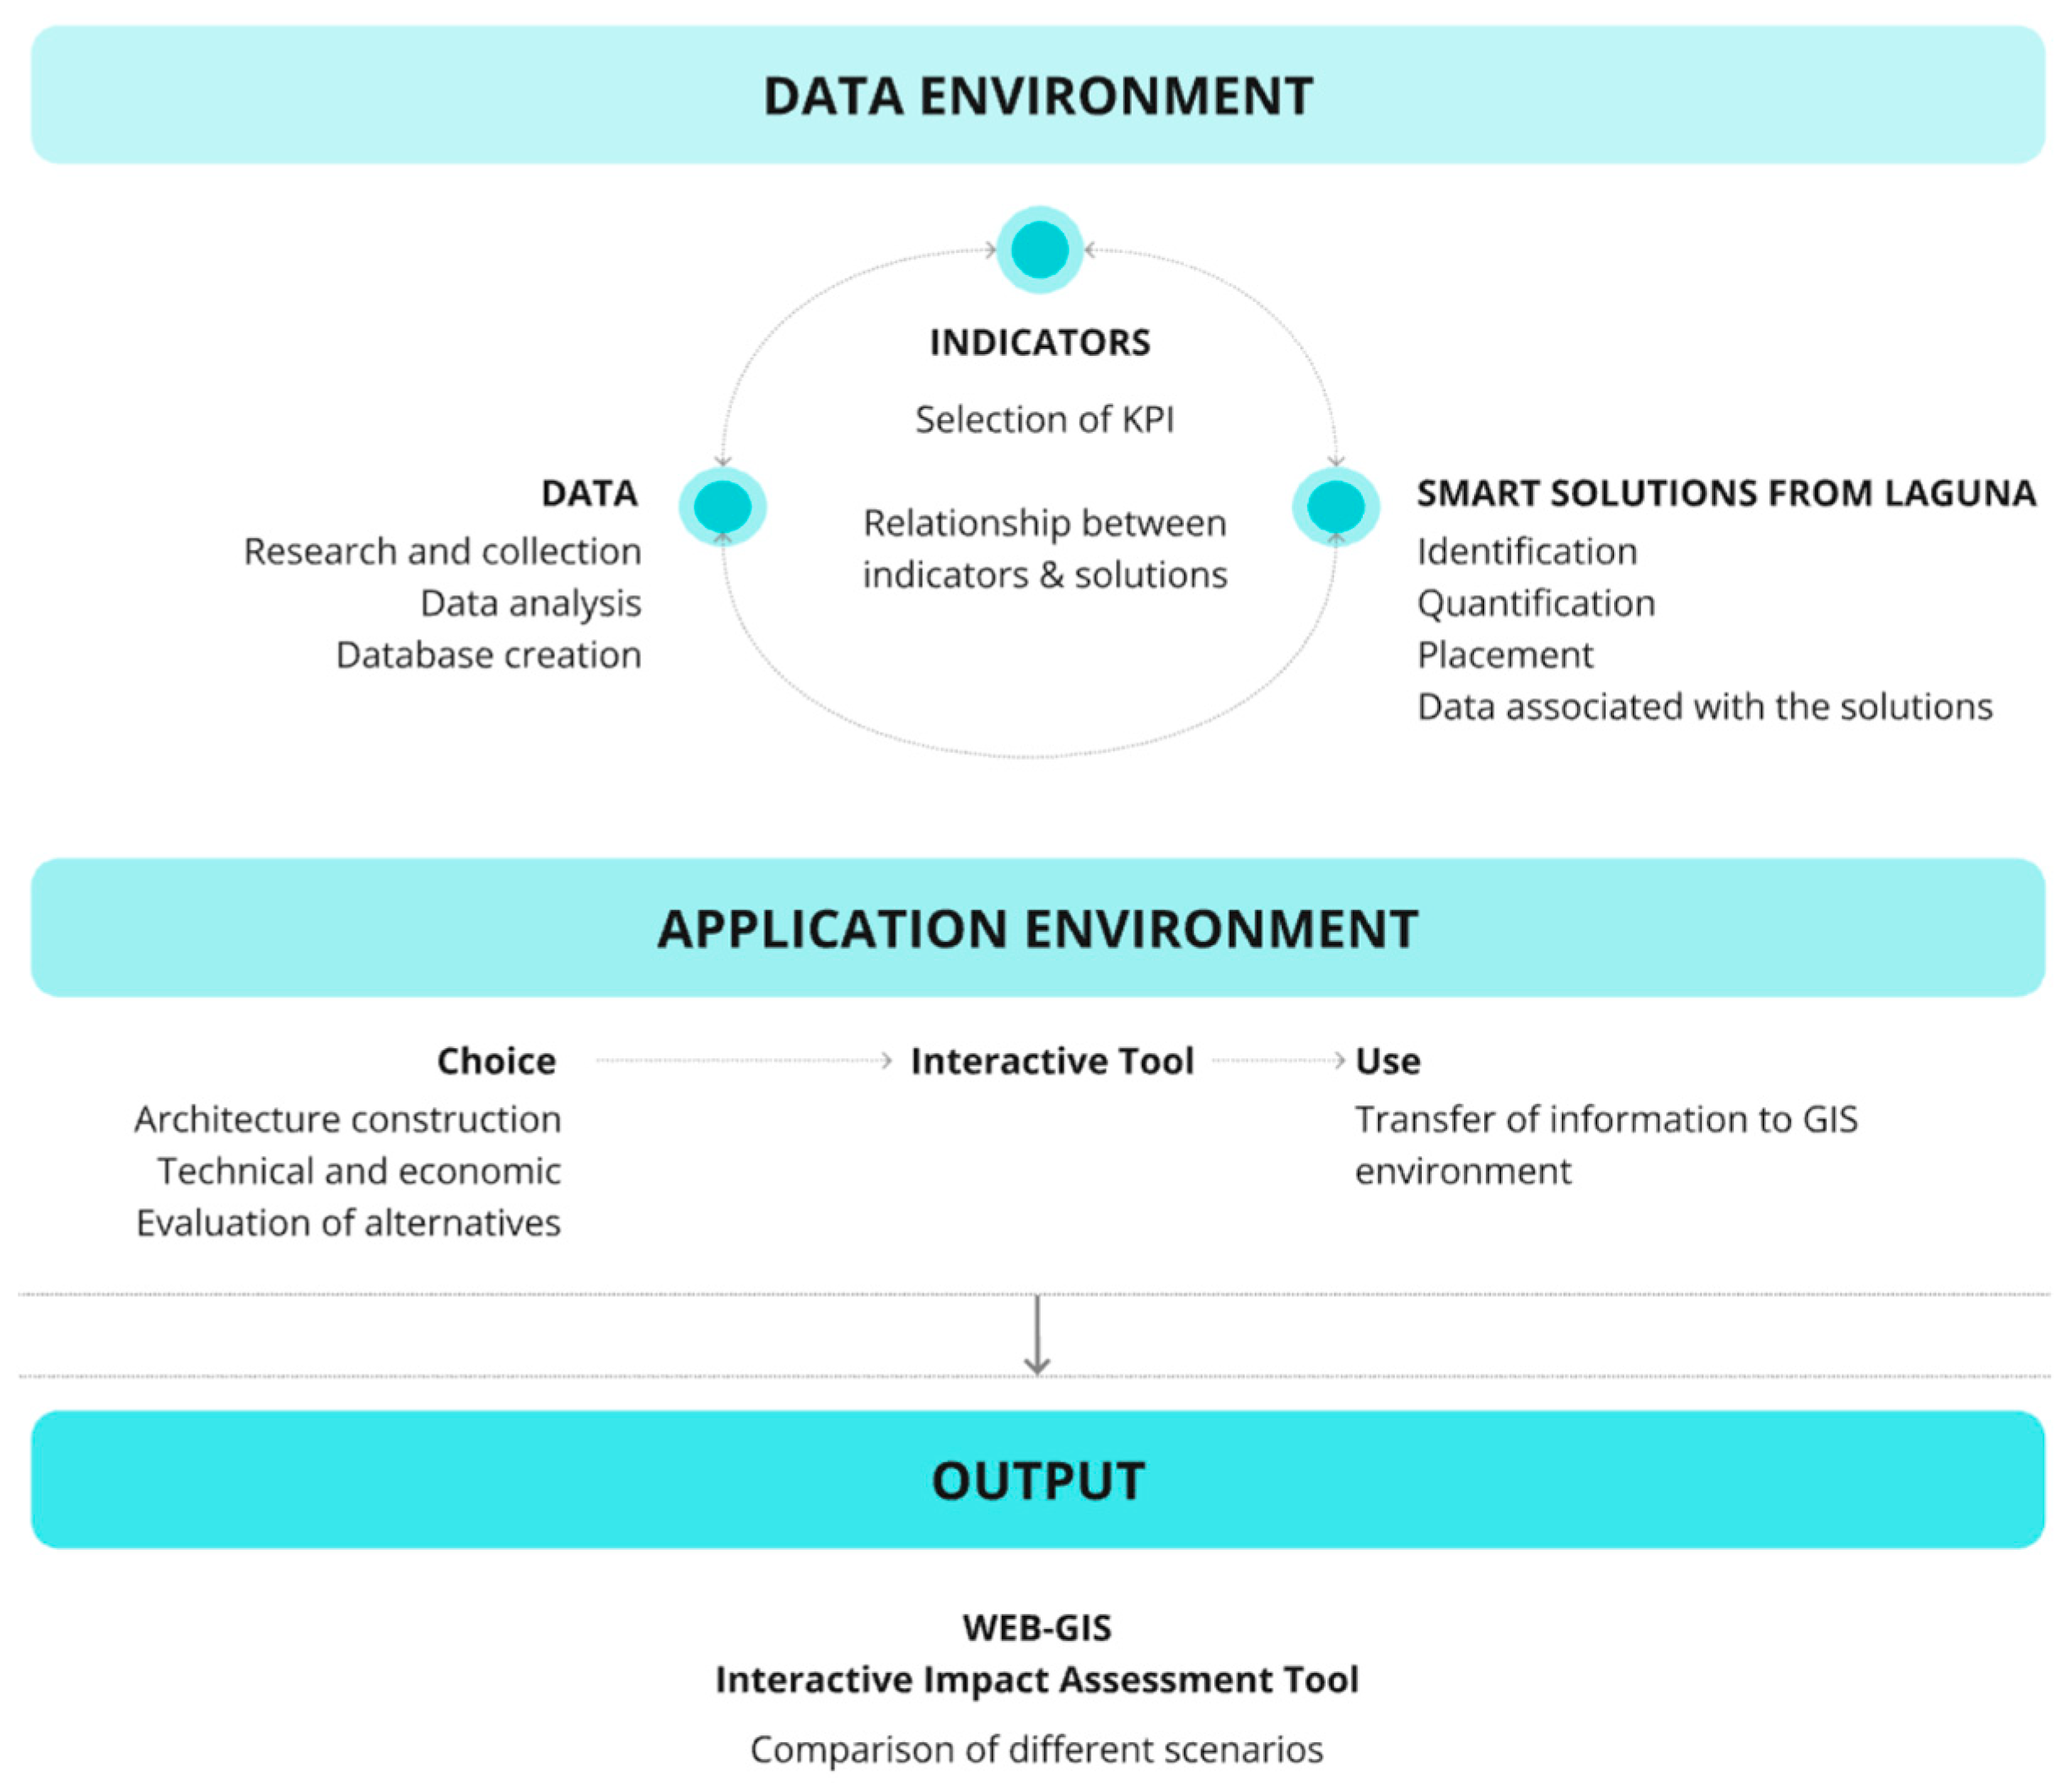
2.1. Methodological Flowchart

The methodological approach encompasses two main environments: (i) the data environment, which prepares data through research and collection, and (ii) the application environment, which creates interactive scenarios combining solutions. Figure 1 shows the methodological flowchart for the preparation of the interactive tool.

2.1.1. Data Environment

The data environment facilitates the creation of a spatial database that includes key information and data relevant to the project’s specific characteristics. The database consists of three main types of data: (i) data—information about the spatial and non-spatial aspects of the area and its population; (ii) smart solutions—data related to the smart solutions that will be implemented, including their characteristics and locations; and (iii) KPIs—data pertaining to the project’s performance indicators.
As shown in Figure 1, the relationship between the data, the KPIs, and the solution is an iterative process.
In this environment, the available data are first collected and then analyzed. All of the collected data are overlapped and integrated within the GIS tool. Moreover, each lot polygon is associated with the relevant information about the future housing (e.g., number of residents, geometric characteristics, energy consumption) and other data. The goal is to create a city GIS database framework including the factors influencing building energy consumption. Although the data collection procedure can be generalized, data and information availability depend strongly on each specific context.
Data: The first step in this process is gathering and analyzing the data on the lots and territory that are already available [20]. The data collection process is organized according to the following three phases:
  • Data collection: This involves the selection and collection of both georeferenced and non-georeferenced information. The spatial (georeferenced) data consist of all territory information including green areas, lots, service locations, and so on. Moreover, they include the geometrical information of the built and future building stock. This information is derived from the digital cartographic of the master plan, technical map, and technical catalogs of Planet Smart City (e.g., perimeter, number of floors, heated volume, and area). On the other hand, the non-georeferenced data such as the necessary energy consumption of buildings, the number of residents, and all of the necessary information to calculate the indicators are to be collected in this step [20].
  • Data analysis: This involves the processing and analysis of the gathered data to produce an initial thematic depiction of the fundamental data. The data should be analyzed and pre-processed for the upcoming communication procedures and indicators after they have been collected.
  • Database creation: This comprises data integration and database creation using QGIS version 3.16. Finally, to create a supportive and strong GIS database, it is necessary to integrate all of the data collected at two levels: (a) the individual lots and (b) the territory information [20]. This GIS database consists of all data and information describing each territory and building as a basis for estimating the related indicators, such as energy consumption, accessibility to public services, and water consumption. This stage is fundamental since it is the foundation of the entire calculation process and other substantial actions [20]. In this phase, the stakeholders’ involvement should also be integrated to obtain the existing data and determine the relevant sustainable objectives for future planning.
The available data are collected and analyzed, and consequently, they are overlapped through different layers in one unique and integrated GIS environment. As previously mentioned, the gathered data are composed of georeferenced data; that is, the geometric information about the building stock (e.g., the perimeter of the lots and the number of plans). Moreover, the necessary non-georeferenced data are collected and associated with the area (e.g., socio-economic information) [20].
Smart Solutions: The present smart solutions have been identified by Planet Smart City to respond to the needs of the residents. Then, the solutions that can be implemented are decided based on the available data that were collected in the previous step. Different indicators can be associated with the same solution.
The smart solutions are categorized into four main macro-areas: (i) ecosystem resources, which develop renewable energy sources, recycling systems, and green spaces to reduce carbon emissions; (ii) built environment, which works on infrastructure within the smart city to enhance safety and comfort for the residents; (iii) technological systems, which work on implementing IoT devices and AI within devices on site, in addition to enhancing the connectivity so that traffic, public safety, and public services are more efficient; and (iv) society, which focuses on having a user-centric design where it works on developing applications that provide feedback from users to enhance the whole experience. This will increase the citizens’ engagement with having a healthier community that satisfies the needs of the residents. Several calculations are performed for each smart solution for the application phase.
Based on the calculations, the values of consumption are implemented within the Tableau software, and then these data are presented spatially, which will help in the decision-making process. All of these smart solutions are developed within the Planet Idea company within distinct phases to enhance the quality of living for the residents. Each macro-area plays an essential role in creating a sustainable smart city ecosystem [20].
Indicators: The indicator selection procedure is organized into two main phases: (i) indicator selection and (ii) mapping of the relationship between KPIs and smart solutions. After the collection and elaboration of all of the required information and data, a list of KPIs needs to be carefully created to measure the impact of the different smart solutions on the territory [21]. Although different indicators do exist for the assessment and evaluation of smart scenario performance, it is preferable to select a limited number rather than considering too many.
The KPIs are selected through a specific and comprehensive procedure based on three main criteria: (i) Relevance to the target group of residents, (ii) distribution balance across the four macro-areas of Planet Smart City, and (iii) measurability. The selection process is organized according to these criteria to ensure thorough evaluation and effective implementation (Table 1).
In the “Preliminary” step of the work, a literature and initiative overview is conducted regarding the most recent topic of “smart cities”. In this step, the first list of the relevant KPIs is created, including 225 from 5 different assessment methods: [22] Sustainable Cities and Communities [23], Indicators for Smart Cities, Better Life Index, LEED for City, and Indicators of Sustainable Assessment in Brazil [24]. The goal of the preliminary step is to pre-select the KPIs and reduce them to obtain a practical but still considerable number that is sufficient for conducting a smart solution scenario assessment. To decrease the number of potential indicators, it is necessary to pre-select the most suitable ones from the selected set.
The second step is the “Exploratory” step, which aims to reduce the number of KPIs. In this step, qualitative (or “soft”) methodologies are applied, such as work meetings and focus groups [25]. Five work meetings and focus groups were organized involving stakeholders from academia and he Planet Smart City (i.e., real estate agents, data scientists, urban planners, water, environmental, and energy experts, economists, architects, and high-tech experts). The focus groups aimed to gather stakeholder feedback to determine which of the selected KPIs best align with the project’s objectives. Specifically, the goal is to identify which KPIs most effectively measure the impact of smart solutions in Laguna Smart City. As a result, 30 KPIs were identified as the most relevant for this purpose.
Through the third step of the procedure, called the “Hierarchy” step, the importance of the 30 selected KPIs is defined to produce the first selection of KPIs. This step is fundamental and useful for understanding and quantifying the value of the pre-selected KPIs. A specific online questionnaire was prepared to achieve this goal [26]. The questionnaire is divided into four sections corresponding to the main areas identified by the Planet Smart City macro-areas; the questions are organized in a way that allows us to attribute a value that quantifies the importance of each KPI in this specific context.
The stakeholders were asked to rate their answers using a numerical scale from 0 to 4, with 0 denoting not at all important, 1 not important, 2 on average important, 3 important, and 4 particularly important [26]. The questionnaire was sent to the main actors belonging to the different departments of Planet Smart City actively involved in the case study project, such as the offices of the research unit, IT unit, and design unit.
The results of the questions were aggregated, and the final list of KPIs was selected based on the stakeholders’ preferences.
Finally, to ensure the correct selection of the KPIs and to better understand their relationship with the smart solutions, the last step, “Validation”, is performed. In this step, based on a focus group involving stakeholders, the final list of the KPIs is validated.
In this focus group, the authors played the role of an analyst who aided decision-makers without expressing any personal preferences. The output was an unweighted ranking of indicators considering the following:
  • The relevance of the indicator with respect to the analysis scale.
  • The availability of data.
  • The possibility of calculating and measuring the indicators.
Finally, based on the analysis conducted during the focus groups, the final set of KPIs was selected, as shown in Table 1. To determine the KPIs to be used in the operational phase, a focus group was organized to engage stakeholders directly and discuss the relevance of each KPI. The validated set of KPIs included 6 indicators. Then, each indicator (detailed in Section 3.1.2) was studied separately through the following steps:
  • Intent: explains the goal of studying this indicator.
  • Assessment methodology:
    • Description: the descriptive text of the indicator.
    • Data requirements: the smart solutions that can be applied, the unit that is being used, the data source, and the references.
    • Assessment method: how to characterize the indicator’s value.

2.1.2. Application Environment

The tool that has been developed focuses on the integration of solutions related to technology, architecture, social innovation, and environmental sustainability to improve people’s lives and foster socially inclusive communities, since Planet Smart City’s vision is to integrate services into neighborhoods and provide opportunities that enable communities to thrive, inside and outside of the home [27]. More specifically, several innovative solutions have been considered which cover four macro-areas as follows:
  • Planning and architecture: this combines architectural solutions to produce high-quality, affordable dwellings surrounded by public areas that develop communities, foster relationships, and provide long-term value for inhabitants [27].
  • Technological systems: residents’ quality of life will be improved through technological solutions related to networks, home automation, air quality control, security, and more [27].
  • Environment: from drought-resistant plants to solar bricks and intelligent irrigation, innovations in sustainable solutions are implemented to create long-lasting value for future generations.
  • Social innovation: This aims to create communities that are smart, sustainable, and socially inclusive and empower citizens to be effective in their local community. There are six key qualities for a real estate project to be defined as smart: attractive, healthy, inclusive, efficient, informative, and digital [27].
Initially, within this phase of the work, different existing interactive Web-GIS tools were studied and analyzed so we could choose the most suitable one to be used in this specific project. The appropriate choice of a tool allows us to achieve the results in a user-friendly way. Tableau version 2021.4 was chosen as an interactive data visualization tool that queries relational databases, online analytical processing, cloud databases, and spreadsheets to generate graphical data views. This tool can also extract, archive, and recover data from a database (DB) in memory, thanks to a data storage mode “in server”. Moreover, Tableau is selected since it is compatible with spatial databases, and it helps to analyze the relationships in data [28]. As an interactive tool, it creates an interactive dashboard, and it facilitates a better understanding of complex problems by comparing different smart solution scenarios based on the set of indicators. It is possible to ask “what if” questions and visualize “if–then” scenarios in real time, discussing them very effectively and quickly. Tableau will be able to show the results and calculations of each solution that might be implemented in the city project.
The information of all of the solutions was then divided into different layers because it was necessary to collate the data of the related solutions for each indicator. These layers, as geospatial data, are associated with each indicator. These files were uploaded to Tableau at the dashboard assigned to each indicator using specific codes and formats (e.g., Python version 3.9.7, GeoJSON version 1.0.0) and visualized by the maps of the location solutions of the Smart City Laguna project.
Figure 2 illustrates the architecture design flowchart of the data preparation process for the new tool. The aim of this step was to create different smart scenarios and visualize the relative impact assessment in real time.
First, for each indicator, a package of related data and solutions which have an impact on the indicator was built. Thereafter, in the GIS, a spatial database was assigned for each solution.

2.2. Case Study

Smart City Laguna is under construction by Planet Smart City in the São Gonçalo do Amarante municipality, 55 km from Fortaleza, in Ceara, Brazil. The project was started in 2015, and it is scheduled to be completed by 2030. The area is almost 330 hectares, consisting of over 7000 lots and expecting around 25,000 inhabitants. This social smart city is designed for a particular target group of medium–low income. This has led to the adoption of smart solutions suitable for the affordable housing target and able to meet the economic restriction parameters that set the real estate market value of the Brazilian program named “Minha Casa Minha Vida” [29].
This project has integrated smart solutions that support the community-building efforts toward having an elevated experience delivered for all residents. These smart solutions will satisfy the needs of the residents, providing them with a high quality of life within the community even though the project is placed in a developing country with all of these struggles and difficulties [29].
There are communal spaces, outdoor fitness areas, libraries, and innovation hubs as part of the approach to sustainability and community building. In addition, Planet Smart City has developed an application, “Planet App”, to interconnect all of these amenities within one platform, connecting all appliances and shared spaces controlled by this application [29].

3. Results

This section describes both (i) the results from the creation of the database and how the data have been transferred into the Tableau tool from GIS and (ii) the results from the application of the Web-GIS tool to the case study of the Laguna Smart City project.

3.1. Database Environment

Each indicator corresponds to a specific dashboard within the Web-GIS tool (presentation panel) into which the relevant information is imported; in relation to the indicator and the project map, all dashboards consist of data and forms of solutions. First, the original data were elaborated through the GIS and then exported to Tableau.

3.1.1. Smart Solutions

The Laguna project foresees the implementation of 53 smart solutions, which are identified by the Planet Smart City envisioning team. These solutions are the ad hoc selected products and/or services enabling this project to meet the residents’ needs. Initially, 21 solutions were chosen for which data were available, and they were also considered suitable to contribute to the calculation of the chosen indicators. Table 2 shows the correlations of these 21 solutions with the selected indicators. Notably, the same solution can be associated with different indicators. For instance, the “Economy saving” indicator is related to all other indicators and receives the contributions of existing solutions, except for two solutions.

3.1.2. Indicators

Quantitative and qualitative information is provided by the evaluation process based on a variety of algorithms that can assess the impact of the smart solution and provide numeric support for each action. The approach is based on four macro-areas (ecosystem resources, built environment, technological systems, and society), and each has a list of pre-defined solutions that can be adapted according to the project, as shown in Table 3. The equations for the calculation stage for each smart solution are shown in Table 4, Table 5, Table 6 and Table 7; they are used to calculate the usages of the smart solutions, the reductions in consumption, and the percentages of reduction.

Ecosystem Resources

The ecosystem resources indicators presented in this study consist of a group of algorithms that were developed for the implementation of the Web-GIS tool. Different levels of consumption for the smart solution scenarios are estimated by these indicators [34].
Energy Usage: This indicator aims to determine the reduction in electricity usage due to the installation of various energy-efficient smart solutions. (The indicator is based on [35] Sustainable Cities and Communities.) It intends to minimize the total electric energy consumption in the use stage [34]. The assessment method includes the following:
  • The baseline values were determined (e.g., residential electricity usage was found from the national energy provider, while smart lighting values were taken from real measurements).
Baseline residential electricity use per home: residential energy consumption (kWh/yr)/population (number) × people/home = baseline residential electricity use per home (kWh/home/yr).
Baseline public lighting electricity use: estimated baseline capacity (kW)/lighting area of phase 1 (m2) × hours per day of operation (hrs/day) × days per year of operation (days/yr) = baseline public lighting electricity use (kWh/m2/yr).
  • The impact of the smart solutions was measured using the following:
    • Data derived from the literature (e.g., smart appliances and smart electricity metering);
    • Real measured data (e.g., smart lighting).
  • The data were verified, when possible, by comparing values with different sources.
  • The impact of the smart solutions was determined by comparing the calculated values with a baseline to measure the percent reduction in electrical energy usage.
Table 4. Calculations for energy reduction based on smart solution application.
IndicatorsSmart SolutionCalculation
Energy UsageEnergy reduction due to smart appliances1—Value: residential energy considered (%) × energy reduction possible (%) × baseline residential electricity use per home (kWh/home/yr) = energy reduction due to upgraded appliances (kWh/home/yr)
2—Percentage: energy reduction due to upgraded appliances (kWh/home/yr)/baseline residential electricity use per home (kWh/home/yr) = energy reduction due to upgraded appliances (%)
Percentage of energy reduction due to smart electricity metering1—Value: energy reduction by smart metering (%) × baseline residential electricity use per home (kWh/home/yr) = energy reduction due to smart metering (kWh/home/yr)
2—Percentage: 5% = energy reduction due to smart electricity metering based on European Environmental Service [36]
Percentage of energy reduction due to smart lighting (LED lighting)1—Installed capacity (kW)/lighting area of phase 1 (m2) × hours per day of operation (hrs/day) × days per year of operation (days/yr) = estimated public lighting electricity use (kWh/m2/yr)
2—Percentage: 1— (actual public lighting electricity use/baseline public lighting electricity use) = percent reduction in energy usage due to smart lighting
Water Usage: This indicator aims to determine the reduction in water usage due to the installation of various water-efficient smart solutions. (The indicator is based on [35] Sustainable Cities and Communities, CESBA.) This indicator intends to minimize the consumption of water resources in the distribution and use stage. The assessment method includes the following:
  • The impact of the smart solutions was measured using the following:
    • Data derived from the literature (e.g., innovative materials for potable water distribution networks, smart irrigation, and smart water metering);
    • A baseline value (e.g., domestic water usage per capita was found from the national water provider).
  • The data were verified, when possible, by comparing values with various sources.
Baseline for domestic water usage per capita: water consumed not considering losses in distribution (m3/yr)/population served by water supply (number)/days per year (days/yr) × liters in a cubic meter (L/m3) = average water usage per capita (L/cap/day).
Domestic water usage per capita including losses in distribution: total water produced in Brazil including losses in distribution (m3/yr)/population served by water supply (number)/days per year (days/yr) × liters per m3 (L/m3) = water usage per capita including losses in distribution (L/cap/day).
Table 5. Calculations for water usage reduction based on smart solution application.
IndicatorsSmart SolutionCalculation
Water UsageWater usage reduction due to innovative materials for potable water distribution networks (IMPWDNs)1—Value: (baseline for domestic water usage per capita (L/cap/day)/(1—losses in distribution in Ceara (%))) × (losses in distribution in Ceara (%)—estimated losses that will remain in distribution (%)) × occupants per home (people/home) × conversion (L to m3) × days per year (days/yr) = domestic water usage reduction (m3/home/yr)
2—Percentage: losses in distribution in Ceara (%)—estimated losses that will remain in distribution (%) = water usage reduction due to IMPWDNs (%)
Water usage reduction due to smart irrigationValue 1 (L/garden/unit/yr): average water demand per harvest (L/m2/yr) × size of one garden unit (m2) × water reduction due to smart irrigation (%) × conversion (L to m3) = water usage reduction due to smart irrigation (m3/garden unit/yr)
Value 2 (L/cap/day): size of one garden unit (m2) × gardens (number) × average water demand for harvest (L/m2/harvest) × smart irrigation water reduction (%)/population of Laguna (number)/days in a year (days/yr) = water reduction averaged over entire year per capita (L/cap/day)
Water reduction due to smart water metering1—Value: energy reduction by smart metering (%) × baseline residential electricity (L/cap/day) × occupants per home (people/home) × conversion (L to m3) × days per year (days/yr) = water reduction due to smart water metering (m3/home/yr)
2—Percentage: water usage reduction % due to smart water metering = 5% based on European Environmental Service [36]

Built Environment

Public and Green Spaces: This indicator aims to determine the area (m2) of public and green spaces available in Laguna for its residents. It considers only public and outdoor spaces such as parks, squares, and green spaces which can be used for congregating, social activities, and recreation. (This indicator is based on CITY keys.) It leads to ensuring that residents have adequate access to public and green spaces. The assessment method includes the following:
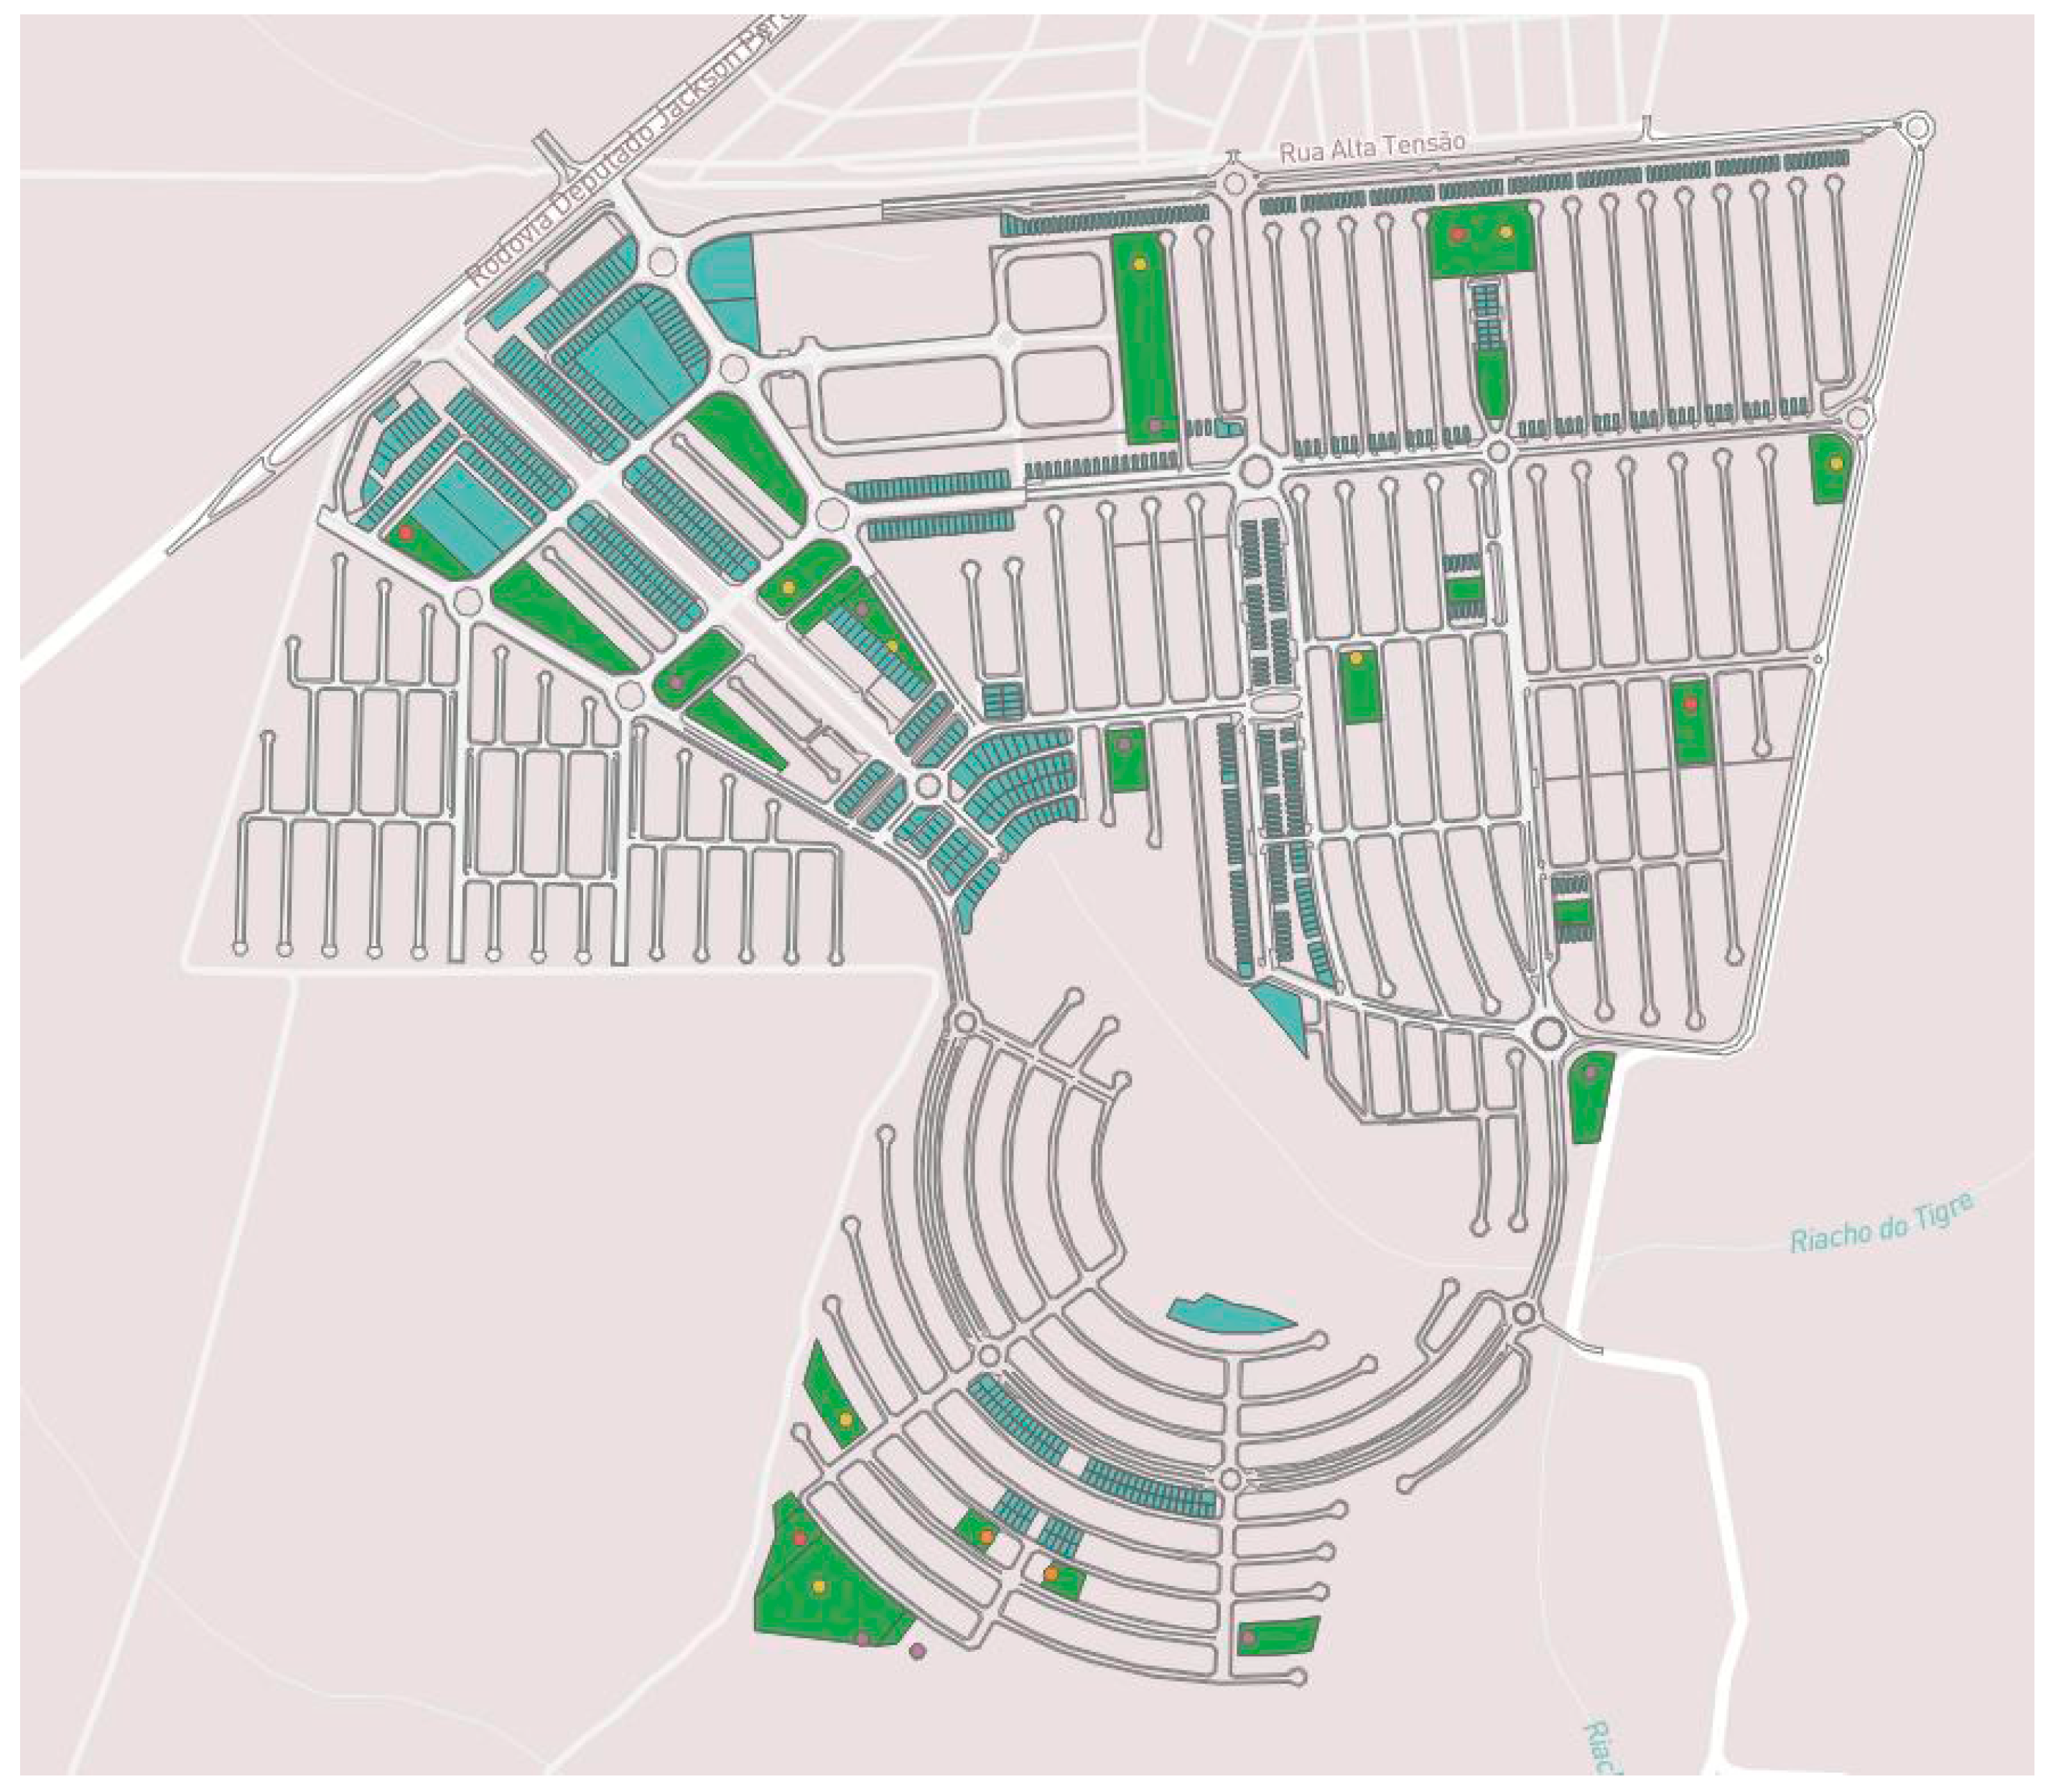
  • The master plan of the development was transferred to QGIS.
  • QGIS was used to measure the area in meters squared (m2) of all outdoor public spaces (e.g., urban forestation, urban gardens, urban ecological network, parks and squares, shopping streets, youth cinemas, fitness areas, and smart gyms).
  • The areas were divided by the population of the development (i.e., 17,792 residents in Laguna) to determine the extension of public and green outdoor spaces per capita.

Technological Systems

Internet Connections: The aim of this indicator is to measure the accessibility of fixed broadband internet for residents in each development. (The indicator is based on [35] Sustainable Cities and Communities.) This indicator ensures that residents have access to a fixed broadband internet connection. The assessment method includes the following:
  • The impact of the smart solution is measured using data derived from the literature (e.g., structured cabling infrastructure). The number of fixed broadband internet connections per one hundred people is calculated as the percentage of residents with internet connections in the city multiplied by one hundred. The result is expressed as the number of internet connections per one hundred people.
  • The data should be verified, when possible, by comparing values with various sources.
Table 6. Calculations for internet connections—structured cabling infrastructure.
IndicatorsSmart SolutionCalculation
Internet ConnectionsStructured cabling infrastructureBrazilian homes with internet connection (%) × 100 = number of residents with internet connection per 100 people

Society

Availability and Proximity of Key Public Services: This indicator aims to evaluate the accessibility of key services to residents. Specifically, it determines if eight types of key services (1. education, 2. health, 3. transport, 4. sports facilities, 5. cultural, 6. parks and gardens, 7. commercial services, 8. supporting services) for citizens are within at most a 10 min walk (i.e., 800 m) from the residents’ homes (this indicator is based on CITY keys and the SSCM INDEX: mixed-use design). This indicator ensures that residents have access to key public services. The assessment method includes the following steps:
  • The locations of key services offered by Planet Smart City in the local area using the eight service types as a guide (e.g., healthy corner, fitness area, smart gym, outdoor cinema, bookcrossing, urban forestation, urban gardens, urban ecological network, control center for local administration, and innovation hub) are identified.
  • The locations of key services offered by the public administration in the local area using the eight service types as a guide (e.g., schools, health clinics, theatre/churches/cultural spaces, squares and public spaces, commercial lots, fire/police stations) are identified.
  • The percentage of inhabitants that are within an 800m walking distance from each service individually is calculated.
Economic Savings: The aim of this indicator is to determine the economic savings that would benefit citizens each year due to the introduction of various smart solutions. This indicator ensures that residents benefit economically from the smart solutions present in the development. The assessment method includes the following:
  • A baseline value was determined (e.g., net adjusted disposable income).
Baseline net adjusted disposable income: salary of formal workers in Caucaia (BRL) × people earning a wage (number) × months of salary (months) × exchange rate (BRL to USD) = annual family income at Laguna (USD/family/yr).
  • The impact of the smart solutions was measured using the following:
    • Data derived from the literature (e.g., all solutions);
    • Real measured data (e.g., smart lighting).
  • The data were verified, when possible, by comparing values with several sources.
  • Solutions were only considered if they have the potential to generate economic savings for residents.
  • Some solutions resulted in economic savings for residents (e.g., smart appliances), while other solutions could benefit the public administration (e.g., smart lighting) and, therefore, a distinction was made between the two categories.
Table 7. Economic savings calculations for residents and public administration.
IndicatorsSmart SolutionCalculation
Economic savings for residentsEconomic savings due to the use of smart appliancesenergy reduction due to smart appliances (kWh/home/yr) × cost of electricity (USD/kWh/yr) = economic savings due to smart appliances (USD/home/yr)
Economic savings due to the use of a fitness areafrequency of equipment usage (users/hr) × peak hours of usage (hr/day) × days per month of usage (days/month)/frequency of repeated use by users (number/month) = unique regular users/yr/fitness area
unique regular users/yr/fitness area × cost of fitness club membership (BRL/yr/user) × exchange (USD/BRL) = economic savings (USD/yr/fitness area)
Economic savings due to the use of carpoolingaverage expenses for commuting with car per month (BRL/month) − [average expenses for commuting with car per month (BRL/month)/people in carpool (number)] = cost savings for commuters (BRL/month)
cost savings for commuters (BRL/month) × commuters in each family (number) × months in a year (month/yr) × conversion (USD/BRL) = economic savings due to carpooling (USD/family/yr)
economic savings due to carpooling (USD/family/yr) × homes in Laguna (number) × homes carpooling (%) = economic savings due to carpooling (USD/Laguna/yr)
Economic savings due to a healthy corneraverage per capita out-of-pocket health spending (USD/capita/yr) × occupants per home (people/home) × reduction in fees (%) = economic savings due to healthy corner (USD/home/yr)
Economic savings due to free WiFiavg cost of fixed-line high-speed internet (BRL/month/home) × months in a year (months/yr) × exchange rate (BRL to USD) × population that gains access to the internet (%) = economic savings due to free WiFi (USD/home/yr)
Economic savings due to smart energy meteringenergy reduction due to use of energy meter (kWh/home/yr) × cost of electricity (USD/kWh) = economic savings due to smart energy meter (USD/home/yr)
Economic savings due to smart water meteringvolume of water reduced (L/home/day) × days in a year (days/yr) × conversion (m3 to 1000 L) × cost of water (USD/m3) = economic savings due to smart water meter (USD/home/yr)
Economic savings due to smart irrigationcost of water (USD/m3) × water reduction due to smart irrigation (L/garden unit/yr)/unit conversion (m3 to L) = economic savings due to smart irrigation (USD/garden unit/yr)
Economic savings due to urban gardenstotal value produced by 20 m2 urban garden ($BRL) × conversion rate (BRL to USD) = total value produced by 20 m2 urban garden (USD)
total value produced by 20 m2 urban garden (USD) × [size of garden unit (m2)/size of example garden (m2)] = economic savings for a 48 m2 garden (USD/garden unit/yr)
Economic savings for public administrationsEconomic savings due to IMPWDNsdomestic water usage reduction (m3/home/yr) × cost of water (USD/m3) = economic savings due to IMPWDNs (USD/home/yr)
Economic savings due to smart public lighting(baseline public lighting electricity use (kWh/m2/yr)—installed public lighting capacity (kWh/m2/yr)) × total area of roads lit in Laguna (m2) × cost of electricity for public lighting (USD/kWh)/homes in Laguna (number) = economic savings due to smart lighting (USD/home/yr)
All of these calculations that were performed for the indicators’ smart solutions were then inserted into Tableau software, which is explained in Section 3.2.

3.2. Application Environment

This section describes how the Web-GIS tool’s basis was modeled and adapted for the Laguna Smart City project’s case study. Each dashboard includes three main parts:
  • Maps: The maps of the smart solution intervention make it possible to visualize the location of the solutions on the territory and the number of them. Moreover, the maps help identify the most critical hotspot zones to avoid unnecessary investments.
  • Sliders for each smart solution: this allows the decision-makers to choose the number of smart solutions that must be inserted into the project.
  • Indicators: Formula-driven analysis results are updated automatically while the analysis is performed. The indicators can show the outcome of one or several dynamic attributes.
As previously mentioned, the aim of the project was to create interactive scenarios and not specific pre-defined ones. The innovative point is the tool’s ability to facilitate working on future scenario definitions, together with stakeholders and citizens. The first step in establishing future scenarios was to create a “baseline” scenario where the master plan plays a key role. A baseline analysis should be set up since it is significant in determining the future opportunities that exist and the location of the smart solutions. Obviously, this scenario represents the baseline conditions in which no new smart solutions, modifications, or investments are planned. These current conditions can be compared to different future scenarios, from scenario 1 to scenario n.
Figure 3 shows the baseline map of the Laguna project imported to Tableau with all of the necessary data needed for further analysis.
Figure 4 explains the developed Web-GIS tool in Tableau and how it works. The dashboard features (i) interactive tabs for switching between different indicators, (ii) sliders for adjusting the parameters of the smart solutions, (iii) a map for visualizing the spatial results based on the adjustments of the sliders, giving geographical context to the data, and (iv) graphs that illustrate the results of the smart solutions’ impact on the calculations of usage and reduction over time or across categories. This integrated dynamic design shows how comprehensive data exploration and analysis support decision-making.
Figure 5 shows an example of the dashboard regarding the indicators “Energy Usage”, “Economic Savings”, and “Access to Key Services”. Using the “sliders” on the right, it is possible to add or remove smart solutions from the project. All changes are visible on the maps indicating the number of solutions. At the same time, it is possible to visualize the results of the impact of the choices made; the value is displayed within the indicator box (e.g., m2/capita). Finally, there is a box that displays the investment cost resulting from the number of implemented solutions, both total costs and the costs divided for each individual solution.
The first step in establishing future scenarios was to create a “baseline” scenario 0. Setting up a baseline analysis is a significant aspect of determining the future opportunities that exist and the location of the hotspots. Obviously, this scenario represents the baseline conditions in which no new smart solutions are planned. The tool allows for the evaluation of different scenarios by altering the number of solutions included in the project and then comparing the consequent impacts. Figure 4 shows the changes from scenario 0 “baseline” to scenario 1, called “test”, for different indicators.
The development of this tool will help in showing the impact of smart solutions’ applications on smart cities, thus aiding the decision-making process. When the number of smart solutions that are applied is changed, the map spatially changes to show us the impact of this decision, and the consumption for these applied smart solutions is also shown within the graphs. This feature allows for the projection of the different possible smart solutions that can be applied to a smart city while showing the decision-makers the consequences of these decisions [37].

4. Discussion

This study presented the work developed jointly by the authors and a researcher from Planet Smart City. The tool developed in this study comprises a strong visualization platform that simultaneously provides maps and diagrams creating different scenarios in real time and facilitates the simple imputing of project assumptions (smart solutions). This tool’s application has shown the benefit of developing an interactive spatial tool that can assess and measure the impact of future smart scenarios by mapping the location of smart installations.
The main advantages of the developed tool for assessing the impacts of smart, sustainable, and socially inclusive communities are as follows: facilitating participative processes and citizen engagement; facilitating visualization opportunities for the decision process in specific areas; considering multiple indicators related to social, technical, environmental, and economic aspects; managing and storing a considerable amount of spatial and non-spatial data; demonstrating the results requested by users in different spatial forms and exchanging presentations such as maps and graphs; encouraging people to move to and/or invest in smart city projects by illustrating all of the listed advantages based on quantitative analysis and measurements.
Through this Web-GIS framework, it is possible to display maps and diagrams and to create scenarios based on real-time data into which project assumptions can input, resulting in smart solutions. Meanwhile, the beta version of this tool is being tested on several projects in Planet Smart City within different contexts.
The development of this work in the future is expected to be of two types. The first one focuses on the analysis of the content, and the second one tackles the technical limitations of the current version. These limitations are related to assumptions being input in different dashboards, data sources being modified directly in the platform, and solutions being selected directly from a map rather than using a filter. The second type of activity focuses on increasing the indicator sets. At present, there are 39 indicators, and they are based on four sectors: energy and climate change, habitat and biodiversity, resources, and water. They can be expanded both by reference macro-area and by target.
This Web-GIS tool can improve the decision-making process for urban decision-makers by offering access to spatial data and can visualize the KPIs related to applied smart solutions. It will also help in visualizing the spatial relationships between different urban indicators, improving our understanding of the impact of each decision. Thus, scenario planning by showing different potentials in each solution will be enhanced within the engagement of different stakeholders who can also be included in the decision-making process.
A form of AI known as machine learning is a sophisticated method that can analyze vast volumes of data and learn a specific task [16]. AI in a smart city includes systems that are used to mine massive amounts of data such as smart grids, smart sensors, and the Internet of Things (IoT) [17]. The process of data management will be improved through the use of AI. Certain innovations are already affecting the way we live, such as AI and IoT. The quality of life of residents will be enhanced in cities through to the incorporation of dynamic and responsive entities. IoT sensors can be employed in smart energy meters to enable continual monitoring and analysis, which will provide optimized energy consumption and will lead to reduced costs [17].
Thus, artificial intelligence (AI) can be further used within this Web-GIS tool; this will enable access to real-time data management which can detect anomalies, emerging trends, and potential risks that might occur later. This will also help decision-makers to analyze historical data by identifying their patterns and trends and then predict future data based on these, increasing the accuracy of the outcomes. To optimize KPIs, AI can be used to create detailed scenarios that will have environmental, economic, and social impacts. However, this application of AI requires access to comprehensive data, necessitating the expansion of datasets within real-time data analytics.
In conclusion, the Web-GIS framework has many benefits, especially for real estate developers and stakeholders. It allows for periodic impact assessments and ensures the quality of life of the residents and consequently the market value of investment assets. This work will be advanced as a layer in the development of a digital twin tool within smart city projects. Thus, these tools will be able to improve the quality of life of residents economically, environmentally, and socially within diverse urban settings.

5. Conclusions

This Web-GIS tool will provide decision-makers with real-time access to spatial data of smart cities, thus addressing several complex challenges. This tool will provide better scenario planning and resource management and help in achieving the SDGs efficiently. The phases and objectives of this study were as follows:
  • Data Environment: This section included the data, indicators, and smart solutions. First, different types of data were collected, including spatial data for the territory and residents, data for the smart solutions that are implemented in the project, and data for the indicators. This was accomplished through data collection, data analysis, and database creation. Then, through the indicators, the selection of KPIs and how they are connected to the smart solutions were detailed.
  • Application Environment: Within this section, the interactive tool was modeled based on four macro-areas connected to planning and architecture, technological systems, the environment, and social innovation. This was accomplished through the usage of the Tableau software, which helps in spatially visualizing the data and shows the relationship between different data types.
With the usage of the Web-GIS tool, there are some limitations linked to data quality and availability that might be faced. Being in a developing country could be a huge limitation, due to a lack of historical data. This could be due to projects being newly constructed, which might affect the whole decision-making process. There are other limitations concerning privacy and security due to the collection of sensitive information regarding residents. Thus, cybersecurity measures must be taken into consideration for this tool’s usage.
This Web-GIS tool can be enhanced through the use of AI and made autonomous, increasing its capabilities. With the integration of AI, this tool can optimize resource usage and customize services based on residents’ needs. There is an extension that builds upon this study by the authors; it shows how AI is applied to the indicators by predicting future energy consumption. This study reveals the potential of AI tool usage in the Web-GIS tool. An AI-driven digital twin with real-time data sensors can also be useful in making this tool more sophisticated and accurate, which will enhance the decision-making results.

Author Contributions

S.T.M.: formal analysis, investigation, methodology, modeling, visualization, writing—original draft, supervision; D.A.M.: theoretical AI framework, modeling, visualization, writing—original draft; P.L.: revision. All authors have read and agreed to the published version of the manuscript.

Funding

This study was funded by Planet Smart City. The results are collaborative work developed by authors in conjunction with Planet Smart city.

Institutional Review Board Statement

Ethical review and approval were waived for this study because it utilized data that did not involve direct or sensitive personal information.

Informed Consent Statement

Informed consent was obtained from all subjects involved in this study.

Data Availability Statement

No new data were created or analyzed in this study.

Acknowledgments

This work was conducted as part of a collaboration between Politecnico di Torino and PLANET IDEA under the main scientific supervision of Sara Torabi Moghadam (POLITO) and Barbara Melis (Planet Smart City). This study represents the result of collaborative work developed by the authors in conjunction with PLANET IDEA S.R.L, the company that funded the research. The authors would like to thank Matthew De Luca, Soroosh Nazem, Graziella Roccella, Elena Rudiero, Marco Savio, and Giovanni Savio for their invaluable contributions.

Conflicts of Interest

The authors declare no conflicts of interest. The funding sponsors had no role in the writing of the manuscript.

References

  1. Mahtta, R.; Fragkias, M.; Güneralp, B.; Mahendra, A.; Reba, M.; Wentz, E.A.; Seto, K.C. Urban Land Expansion: The Role of Population and Economic Growth for 300+ Cities. npj Urban Sustain. 2022, 2, 5. [Google Scholar] [CrossRef]
  2. Elbalki, M.; Shaaban, M.; Osman, A.; Pietrasanta, A.; Kamil, M.; Ali, A. Optimizing Integrated Water and Electrical Networks through a Holistic Water–Energy Nexus Approach. Sustainability 2024, 16, 3783. [Google Scholar] [CrossRef]
  3. Urbanization Causes and Impacts|National Geographic. Available online: https://www.nationalgeographic.com/environment/article/urban-threats (accessed on 29 October 2023).
  4. Rahangmetan, R. Sustainable Development in Developing Countries—Circle of Sustainable Europe. Available online: https://cose-eu.org/2021/10/11/sustainable-development-in-developing-countries/ (accessed on 29 October 2023).
  5. Moumen, N.; Radoine, H.; Nahiduzzaman, K.M.; Jarar Oulidi, H. Contextualizing the Smart City in Africa: Balancing Human-Centered and Techno-Centric Perspectives for Smart Urban Performance. Smart Cities 2024, 7, 712–734. [Google Scholar] [CrossRef]
  6. Xiao, M.; Zhou, Y.; Li, B.; Song, M.; Xiao, Y.; Zhou, Y. How Does the Smart City Policy Influence Digital Infrastructure? Spatial Evidence from China. Land 2023, 12, 1381. [Google Scholar] [CrossRef]
  7. Zhang, A.; Nankpan, M.N.; Zhou, B.; Forson, J.A.; Nkrumah, E.N.K.; Adjavon, S.E. A COP28 Perspective: Does Chinese Investment and Fintech Help to Achieve the SDGs of African Economies? Sustainability 2024, 16, 3084. [Google Scholar] [CrossRef]
  8. Calzada, I. Smart Rural Communities: Action Research in Colombia and Mozambique. Sustainability 2023, 15, 9521. [Google Scholar] [CrossRef]
  9. Liu, X.; Zhang, X.; Baziar, A. Hybrid Machine Learning and Modified Teaching Learning-Based English Optimization Algorithm for Smart City Communication. Sustainability 2023, 15, 11535. [Google Scholar] [CrossRef]
  10. Ren, S.; Li, Y.; Peng, Z.; Yin, M.; Liu, X. Developing an Urban Environment Examination System by Incorporating Construction, Economic, Environmental, Cultural and Development Dimensions. Sustainability 2024, 16, 3065. [Google Scholar] [CrossRef]
  11. Albino, V.; Berardi, U.; Dangelico, R.M. Smart Cities: Definitions, Dimensions, Performance, and Initiatives. J. Urban Technol. 2015, 22, 3–21. [Google Scholar] [CrossRef]
  12. Komeily, A.; Srinivasan, R.S. A Need for Balanced Approach to Neighborhood Sustainability Assessments: A Critical Review and Analysis. Sustain. Cities Soc. 2015, 18, 32–43. [Google Scholar] [CrossRef]
  13. WEF. Making Affordable Housing a Reality in Cities. Available online: https://www.weforum.org/publications/making-affordable-housing-a-reality-in-cities (accessed on 29 October 2023).
  14. Pignatelli, M.; Torabi Moghadam, S.; Genta, C.; Lombardi, P. Spatial Decision Support System for Low-Carbon Sustainable Cities Development: An Interactive Storytelling Dashboard for the City of Turin. Sustain. Cities Soc. 2023, 89, 104310. [Google Scholar] [CrossRef]
  15. Yi, W. Planning Urban Cities Smartly With Digital Twins. 2022. Available online: https://www.govtech.com/sponsored/planning-urban-cities-smartly-with-digital-twins/ (accessed on 12 June 2023).
  16. Laskowski, N. What is Artificial Intelligence and How Does AI Work? Available online: https://www.techtarget.com/searchenterpriseai/definition/AI-Artificial-Intelligence (accessed on 29 August 2023).
  17. Ly, D. On The Horizon For Smart Cities: How AI and IoT Are Transforming Urban Living. Available online: https://www.forbes.com/sites/forbestechcouncil/2023/04/07/on-the-horizon-for-smart-cities-how-ai-and-iot-are-transforming-urban-living/ (accessed on 11 July 2024).
  18. Popelka, S. A Guide to Urban Artificial Intelligence; Urban AI: Worcester, UK, 2023. [Google Scholar]
  19. Planet Smart City. Planet Smart City—An Innovative Proptech Company. Available online: https://planetsmartcity.com/ (accessed on 29 October 2023).
  20. Lombardi, P.; Abastante, F.; Torabi Moghadam, S.; Toniolo, J. Multicriteria Spatial Decision Support Systems for Future Urban Energy Retrofitting Scenarios. Sustainability 2017, 9, 1252. [Google Scholar] [CrossRef]
  21. Angelakoglou, K.; Nikolopoulos, N.; Giourka, P.; Svensson, I.-L.; Tsarchopoulos, P.; Tryferidis, A.; Tzovaras, D. A Methodological Framework for the Selection of Key Performance Indicators to Assess Smart City Solutions. Smart Cities 2019, 2, 269–306. [Google Scholar] [CrossRef]
  22. International Organization for Standardization. ISO 37124; Sustainable Cities and Communities—Guidance on Resilience and Smartness. ISO: Geneva, Switzerland, 2022.
  23. International Organization for Standardization. ISO 37122; Sustainable Cities and Communities—Indicators for Smart Cities. ISO: Geneva, Switzerland, 2019.
  24. Dezidério Souto, R. Indicadores de Desenvolvimento Sustentável—Brasil: Análise e Contribuições. Estatística Soc. 2013, 56–70. Available online: https://www.researchgate.net/publication/275524508_Indicadores_de_Desenvolvimento_Sustentavel_-_Brasil_analise_e_contribuicoes (accessed on 20 June 2023).
  25. Casula, M.; Rangarajan, N.; Shields, P. The Potential of Working Hypotheses for Deductive Exploratory Research. Qual. Quant. 2021, 55, 1703–1725. [Google Scholar] [CrossRef] [PubMed]
  26. Yuan, J.; Wang, C.; Skibniewski, M.J.; Li, Q. Developing Key Performance Indicators for Public-Private Partnership Projects: Questionnaire Survey and Analysis. J. Manag. Eng. 2012, 28, 252–264. [Google Scholar] [CrossRef]
  27. Planet Smart City. Experience Smarter Living with Our Solutions. Available online: https://planetsmartcity.in/smart-solutions/ (accessed on 12 July 2024).
  28. Batt, S.; Grealis, T.; Harmon, O.; Tomolonis, P. Learning Tableau: A Data Visualization Tool. J. Econ. Educ. 2020, 51, 317–328. [Google Scholar] [CrossRef]
  29. Planet IDEA. Available online: https://planetsmartcity.com/projects/smart-city-laguna-the-worlds-first-affordable-smart-city/ (accessed on 17 May 2024).
  30. European Environment Agency. Achieving Energy Efficiency through Behaviour Change: What Does It Take? Publications Office of the European Union: Luxembourg, 2013; Available online: https://www.eea.europa.eu/publications/achieving-energy-efficiency-through-behaviour (accessed on 24 June 2023).
  31. Teston, A.; Geraldi, M.S.; Colasio, B.M.; Ghisi, E. “Rainwater Harvesting in Buildings in Brazil: A Literature Review”. ResearchGate (April 2018). Available online: https://www.researchgate.net/publication/324482772_Rainwater_Harvesting_in_Buildings_in_Brazil_A_Literature_Review (accessed on 24 June 2021).
  32. Statista. “Internet Usage in Brazil: Statistics & Facts”. Last Modified September 2023. Available online: https://www.statista.com/topics/2045/internet-usage-in-brazil/ (accessed on 20 June 2023).
  33. Enel Brasil. “Enel Distribuição Brasil”. Available online: https://www.enel.com.br/ (accessed on 20 June 2023).
  34. Savio, G.; De Luca, S.; Quaranta, G.; Roccella, G.; Russolillo, D.; Savio, M.; Schiavello, B. Planet Makes It Smarter. Available online: https://www.planetidea.it/wp-content/uploads/2017/11/Flyer.pdf (accessed on 24 June 2023).
  35. ISO 37120; Sustainable Cities and Communities—Indicators for City Services and Quality of Life. ISO: Geneva, Switzerland, 2018.
  36. Anca-Diana, B.; Nigel, G.; Gareth, M. Achieving Energy Efficiency through Behaviour Change: What Does It Take? Publications Office of the European Union: Luxembourg, 2013. [Google Scholar]
  37. Singh, K. All You Need to Know about the Implementation of AI. Available online: https://www.talentica.com/blogs/implementation-of-ai/ (accessed on 11 July 2023).
Figure 1. Methodological flowchart.
Sustainability 16 08592 g001
Figure 2. Data preparation diagram for Tableau (authors’ elaboration).
Sustainability 16 08592 g002
Figure 3. Baseline map.
Sustainability 16 08592 g003
Figure 4. Developed Web-GIS tool dashboard explanation.
Sustainability 16 08592 g004
Figure 5. Scenarios for different indicators in developed Web-GIS tool.
Sustainability 16 08592 g005
Table 1. Indicator selection procedure.
#StepMethodOutput
1PreliminaryLiterature/standards/assessment toolsPre-selection
2ExploratoryWork meetings/focus groupsFeedback
3HierarchyQuestionnairesFirst selection
4ValidationFocus groupsFinal selection
Table 2. List of solutions grouped by indicators.
Planet Smart City Macro-AreaSolution
Ecosystem
Resources
○ Smart appliances
○ Smart electricity metering
○ Smart lighting
○ Innovative material for potable water distribution network
○ Smart irrigation systems
○ Smart water metering
Built Environment○ Urban forestation
○ Urban gardens
○ Urban ecological network
○ Parks and squares
○ Shopping street
○ Youth cinema
○ Fitness area
○ Smart gym
Technological Systems○ Structured cabling infrastructure
Society○ Control center for local administration
○ Innovation hub
○ Bookcrossing
○ Healthy corner
○ Urban forestation
○ Urban gardens
○ Urban ecological network
○ Youth cinema
○ Fitness area
○ Smart gym
○ Carpooling
○ Free WiFi
○ Home automation
○ Smart electricity metering
○ Smart lighting
○ Innovative material for potable water distribution network
○ Smart irrigation systems
○ Smart water metering
○ Urban gardens
○ Fitness area
○ Healthy corner
Table 3. The selected indicators for assessing the impact of smart solutions for the Laguna case study.
IndicatorsPlanet Smart City Macro-AreaDescriptionUnitAssessment
Method
Data SourceLevel of
Difficulty
Energy UsageEcosystem
Resources
Total electrical energy reductionkWh/house/yr
kWh/m2/yr
Measured;
Estimated from the
literature
[30]Medium
Water UsageTotal domestic water consumption reductionM3/house/day
M3/garden/yr
Measured;
Estimated from the
literature
[31]Medium
Public and Green
Spaces
Built
Environment
Square meters of public and green spaces (outdoor spaces only per capita)M2/capitaDerived from
the GIS
Digital cartographyLow
Internet
Connections
Technological
Systems
The number of internet connections per 100,000 population# of
connection
s/100 (%)
Estimated from
the literature
[32]Medium
Key Public Service
Availability
SocietyThe % of residential buildings located within 800 m of key public services% of residential
buildings
Derived from
the GIS
Digital cartographyLow
Economic
Savings
The solution generated cost savingsEUR/home/yrEstimated from
the literature
[33]High
Disclaimer/Publisher’s Note: The statements, opinions and data contained in all publications are solely those of the individual author(s) and contributor(s) and not of MDPI and/or the editor(s). MDPI and/or the editor(s) disclaim responsibility for any injury to people or property resulting from any ideas, methods, instructions or products referred to in the content.

