Article

Research on Impact of Design Innovation Factors on Pure Technical Efficiency of Manufacturing Innovation

School of Design and Architecture, Zhejiang University of Technology, Hangzhou 310023, China
*
Author to whom correspondence should be addressed.
Sustainability 2024, 16(16), 7230; https://doi.org/10.3390/su16167230
Submission received: 3 March 2024 / Revised: 1 August 2024 / Accepted: 20 August 2024 / Published: 22 August 2024

Abstract

:
Context: Improving the pure technical efficiency in manufacturing innovation is crucial to achieving sustainable development in the manufacturing industry. Objective: We aimed to explore the impact of design innovation factors on the pure technical efficiency of manufacturing innovation from 2011 to 2021, with industrial enterprises above the designated size in Zhejiang Province, China, taken as the research object. Method: The super-efficiency DEA model was used to calculate the pure technical efficiency of manufacturing innovation. Literature research, combined with the Pearson correlation coefficient, was employed to obtain five design innovation factors, including the number of policy regulations, growth rate of designers, number of design enterprises, number of patents granted, and number of design awards at the provincial level or above. Results: Based on the Tobit model, the influence of design innovation factors on the pure technical efficiency in manufacturing innovation was analyzed and demonstrated. Except for the number of policy regulations and growth rate of designers, the other three factors had a significant positive impact on the pure technical efficiency of manufacturing innovation. In general, design innovation exerts positive effects on the growth of pure technical efficiency. Conclusions: The results of this study provide helpful insights into the promotion of sustainable development in the manufacturing industry through design innovation.

1. Introduction

China stands as the largest consumer market and largest producer globally. It is also the only country in the world that possesses all industrial categories, and its manufacturing, as a cornerstone of industry, has been ranked first globally for 14 consecutive years [1]. Technological advancement drives the global manufacturing industry to step into digitization, intelligence, and sustainability and improve its productivity and product quality. Against this background, sustainable development is the top priority for aligning the manufacturing industry with nature and society. However, the manufacturing sector in China faces issues such as unreasonable structures, low value-added exports, weak innovation capabilities, severe resource wastage, and environmental pollution [2]. Considering these challenges, it is urgent to adjust the industrial structure through manufacturing innovation to cater to the environment and economic development, and enhance the sustainability in the manufacturing industry. This raises a pertinent question: innovative output is produced by investing innovation resources into manufacturing, but how do we evaluate the input–output ratio of innovation resources and innovative output in manufacturing innovation? According to the existing literature, technical efficiency is mainly employed in the academic community to assess the ratio between innovation resources and innovative output, and the technical efficiency of manufacturing innovation has been discussed extensively. This study, based on the axiomatic model proposed by R.D. BANKER et al. in 1984, further decomposes technical efficiency into scale efficiency and pure technical efficiency, aiming to investigate the relationship between design innovation and the pure technical efficiency of manufacturing’s technical efficiency [3].
Studies on the pure technical efficiency in manufacturing innovation mainly focus on efficiency measurements [4,5,6] and influencing factors [7,8]. Industrial design is a creative activity that can affect various aspects of enterprise products through design innovation, which will accelerate enterprise development to facilitate the sustainable development of the entire manufacturing industry, and also protect resources and the ecological environment [9]. Consequently, industrial-design-based design innovation not only directly promotes technology, design, and brand added value [10], but also serves as a core force in enhancing the sustainability of the manufacturing industry. The factors influencing pure technical efficiency have been analyzed in numerous studies, but less attention has been paid to design innovation factors, overlooking the close relationship between design innovation and manufacturing innovation. In 2014, the Chinese government unequivocally advocated for integrating cultural creativity and design services into the manufacturing industry, aiming to reshape its structure and enhance industrial competitiveness [11]. The academic community has also analyzed the interaction between design innovation and manufacturing innovation, the mechanisms of influence, and the pathways to realization. Considering this research, a consensus has been reached regarding the role of design innovation in driving the sustainability of the manufacturing industry. From a research perspective, more studies are only investigating design innovation, but fail to establish an in-depth cross-over analysis of design innovation factors and manufacturing innovation. Therefore, it is difficult to explain the specific factors of design innovation that affect the pure technical efficiency of manufacturing innovation. From the perspective of research methodology, most studies just provide theoretical analysis and argumentation, and fail to properly measure and analyze relevant data, with less emphasis on specific quantification analysis. This causes difficulties in objectively assessing the impact of design innovation factors on enhancing the pure technical efficiency of manufacturing innovation. At the same time, design innovation is not effectively managed in manufacturing enterprises, and government regulatory authorities cannot develop targeted industry promotion policies.
Manufacturing and design innovations interact and are closely correlated, so this study analyzes data samples from Zhejiang Province with both developed manufacturing and design innovation in China. Zhejiang is a major province in China for manufacturing and industrial design, with 98% of enterprises in the manufacturing sector. The added value of this manufacturing industry contributes around 46% of the GDP. In addition, manufacturing creates 95.4% of the total output value of enterprises and provides about 93% of provincial exports. At the same time, the design industry in this province is representative, because it is characterized by a relatively even distribution, large scale, strong innovative capabilities, and significant driving effects. Accordingly, Zhejiang Province is researched because it boasts integrated and interacting manufacturing and design innovation. This study investigates the pure technical efficiency of manufacturing innovation in industrial enterprises above the designated size according to data from 16 provincial-level characteristic design parks in Zhejiang Province. This aims to explain the influence of design innovation factors on pure technical efficiency and highlight the specific role of design innovation factors in promoting pure technical efficiency. Meanwhile, it is expected to provide theoretical support for enterprises to manage their design innovation activities and government departments to formulate relevant policies. In the long run, this study is hoped to make contributions to the proposal that design innovation will drive high-quality development and enhance the sustainability of the manufacturing industry.
This study consists of five parts. Part 1 is the introduction. The research status is presented in Part 2. Part 3 explains the data and mathematical models used for this research. In Part 4, our computational results are listed and analyzed. Part 5 reviews the research results and draws conclusions.

2. Research Status

This study involves three fields, such as the pure technical efficiency of manufacturing innovation, the factors affecting the pure technical efficiency of manufacturing innovation, and the relationship between design innovation and manufacturing innovation.
Technical efficiency is an important component [12] of empirical analysis in economics. It was first proposed by Farrell in 1957, who, from the perspective of inputs, defined it as the ratio [13] of the ideal minimum possible inputs to the actual inputs for a production unit under the same output. In 1966, Leibenstein, from the perspective of output, explained it as the ratio [14] of the actual output to the ideal maximum possible output for a production unit under the same input. Hence, technical efficiency is an economic concept for assessing the ratio between input and output. When input and output data are derived from relevant indicators of manufacturing innovation, they can evaluate its technical efficiency. Specifically, in 1984, Banker R.D. et al. decomposed technical efficiency into scale efficiency and pure technical efficiency from an axiomatic perspective [3]. The former measures the difference between the actual scale and the optimal production scale, while the latter indicates the production efficiency influenced by factors such as management and technology. It is able to calculate the pure technical efficiency of manufacturing innovation by decomposing the technical efficiency of manufacturing innovation.
Currently, the technical efficiency of manufacturing innovation is researched by frontier analysis. Research methods can be classified into parametric methods and non-parametric methods, depending on whether the specific form of production function is known, with parametric methods represented by SFA (Stochastic Frontier Analysis, SFA) and non-parametric methods indicated by DEA (Data Envelopment Analysis, DEA). Pure technical efficiency is usually decomposed by DEA series models, so non-parametric data envelopment analysis is used to explore pure technical efficiency. DEA was proposed by Charnes and Cooper et al. in 1978, and it is used to assess the technical efficiency of decision-making units with multiple inputs and outputs [15]. The linear programming technique helps to determine the frontier of a production system, obtaining information on the relative efficiency of each decision-making unit and the scale efficiency [16]. Yuan X. and Zhang B. et al. [17] analyzed panel data from listed companies in the communication equipment industry. They employed the DEA–Malmquist index to measure indicators such as industry technological progress, pure technical efficiency, and scale efficiency. Through data analysis, they concluded that the enhancement of pure technical efficiency is weak in boosting the productivity of the communication industry. The bootstrap DEA method and Tobit model were applied by Dou C. and Guan Z. et al. to analyze public data from 32 small- and medium-sized chemical manufacturing enterprises. At the data level, the pure technical efficiency of most sample companies was relatively low, indicating significant potential for improving the allocation of innovative resources. At the time level, pure technical efficiency was gradually boosted during their start-up, growth, and stable periods, reaching the peak during stable periods [18]. Moreover, Liu Z. and Song D. et al. discussed the data of 28 manufacturing sub-industries in China from 2003 to 2024, hoping to reveal the threshold effect of environmental regulations on the green technological innovation capability of manufacturing. They showed that, when environmental regulations were relatively lax, they could significantly stimulate the technical efficiency of green innovation, thereby enhancing the capacity of enterprises to innovate in green technologies through boosting their pure technical efficiency [19].
Compared to the focus on the pure technical efficiency of manufacturing innovation, research on the factors influencing pure technical efficiency emphasizes external factors more, such as policy incentives [20] and mergers and acquisitions [21]. This aims to clarify their interrelationships in order to identify the direction for improving the pure technical efficiency of manufacturing innovation. Xu L. and Song Z. calculated the innovation efficiency of 31 regions in China and 29 manufacturing sectors in Hebei Province by applying a three-stage DEA model. They discovered that pure technical efficiency was lower than the national average in the stages of technology output and benefit output, while it was among the top in the country in the product output stage. In the end, tailored recommendations were provided based on the characteristics of different manufacturing industries [22]. Furthermore, Chen A. and Zhong G. [23] applied the DEA–Malmquist index to measure the technological progress and technical efficiency growth in six equipment manufacturing industries in China. Based on data analysis, it was found that, after 2000, both the equipment manufacturing industry and industrial sector experienced negative technical efficiency growth, which can primarily be attributed to a decrease in pure technical efficiency. Empirical evidence confirms the limited contribution of technical efficiency growth to the total factor growth rate in the equipment manufacturing industry. Meanwhile, Ren Ye measured related data from 15 listed companies in the Chinese auto manufacturing industry from 2011 to 2015, identifying that the main reasons restricting the innovation and technical efficiency of listed companies were the relatively low level of pure technical efficiency, insufficient management competence, and inadequate institutional design [24].
There are diverse studies that have profoundly analyzed the factors influencing the pure technical efficiency of the manufacturing industry. However, limited scholarly attention has been paid to the cross-correlation between design innovation and pure technical efficiency in manufacturing. Instead, most researchers view design innovation as a specific mechanism or pathway for promoting technological progress in their studies, exploring how to achieve sustainability in the manufacturing industry through industrial upgrading. Hu Hong and Gao Nan [25] argued that design innovation creates demand, and the industrial structure affects demand. Both factors drive the technological innovation of manufacturing through demand, thus leading to industrial transformation and upgrading. With the aid of literature research, Zhuo H. [26] constructed a set of relevant indicators for industrial design, the implementation of design innovation, and the manufacturing industry to achieve structural upgrading. The T-test and Granger causality analysis were used to verify the reliability of data and the causal relationship between them. Subsequently, she conducted an empirical analysis using relevant data from Shanghai, finally elucidating that design innovation promotes manufacturing transformation and upgrading by enhancing the specialization of manufacturing and improving ways of knowledge innovation. Furthermore, Du C. and Guo M. [27] presented an analysis from the perspective of innovative mechanisms, asserting that the spillover of knowledge within the creative industry (which serves as a vehicle for design innovation) is able to enhance the technological innovation of manufacturing and reduce the costs associated with technological updates and R&D. Additionally, this process strengthens production and the capabilities for independent innovation in manufacturing, ultimately promoting its advancement. Under the circumstance of utility model patents representing the design innovation output of the design industry, Yue L. [28] performed a regression analysis of the relationship between the design industry and manufacturing’s added value and technology intensification level. Through the research, it was demonstrated that the design industry facilitates manufacturing upgrading through technological innovation represented by utility model patents. Bo, M.Z. and Zhang, M. [29] proposed that innovative design thinking advances technologies that meet innovation demands. Additionally, it is hoped to boost product innovation, precision, and proficiency in technology by design methods based on technological theories and logical reasoning.
In summary, the pure technical efficiency of manufacturing innovation and its influencing factors have been explored thoroughly and completely, but they are rarely explored from the perspective of design innovation. At the same time, research on the integration of design innovation and manufacturing innovation merely points out the role of design innovation in manufacturing transformation and upgrading. Conclusions are limited to the notion that design innovation can propel manufacturing upgrading and sustainability through promoting technological development, but fail to address the specific impact and extent of design innovation factors on raising technological and managerial levels in manufacturing innovation. Based on research on the pure technical efficiency of manufacturing and design innovation, this study adopted technical efficiency to assess the allocation of innovation inputs in manufacturing, and then further decomposed it into pure technical efficiency. In addition, it discussed the research achievements and identified the relevant indicators of design innovation. With the aid of regression calculation, this study clearly delineated how design innovation factors affect the pure technical efficiency of manufacturing, which is expected to provide theoretical references and a decision-making basis for enterprises to manage their design innovation activities, as well as for government departments to formulate relevant policies. Furthermore, it is hoped to offer robust research support for collaborative innovation between manufacturing and design and make contributions to the sustainability of the manufacturing industry through design innovation.

3. Methods and Data Processing

3.1. Methods

3.1.1. Z-Score Standardization

This study decomposed design innovation into elemental indicators with multiple dimensions and great variations in magnitude. Calculation based on original data would highlight influence of higher numerical indicators and diminish that of lower ones. Therefore, it was necessary to normalize the original indicators. Z-Score standardization is a normalization method for data processing based on the mean and standard deviation of original data. It standardizes data of different magnitudes into a common scale, enabling comparability among them, as illustrated in the following Equation (1):
G ~ i j = G i j G i ¯ σ i , i , j = 1,2 , , n
In the equation, G ~ i j is the standardized value of the j -th indicator in the sample data of the i th design innovation component indicator; G i j is the value of the j -th indicator in sample data of i -th design innovation factor; G i ¯ represents the mean of sample data of the i -th design innovation component indicator; and σ i means the standard deviation of the sample data of the i -th design innovation component factor.

3.1.2. Pearson Correlation Coefficient

The design innovation factor can be divided into element indicators with multiple dimensions. To reduce the outcome basis caused by the correlation between indicators, indicators with a high correlation can be de-duplicated. The Pearson correlation coefficient (PCC) is used to measure the degree of correlation between two sets of samples, with a larger coefficient indicating a stronger relationship, and vice versa [30]. Given two sets of samples, X = x 1 , x 2 , , x n ,   Y = y 1 , y 2 , , y n , the correlation coefficient r X , Y is calculated in Equation (2):
r X , Y = i = 1 n ( x i x ¯ ) ( y i y ¯ ) i = 1 n ( x i x ¯ ) 2 i = 1 n ( y i y ¯ ) 2 , i = 1,2 , , n
In the equation, the value rage of the correlation coefficient r X , Y is [−1,1]. The positive and negative values of r X , Y correspond to that of the correlation, and the larger the absolute value, the stronger the correlation; X represents sample 1 set, Y is sample 2 set; and x i ¯ and y ¯ are averages of X and Y , respectively.

3.1.3. Super Efficiency BCC Model

SFA and DEA are frequently used to measure technical efficiency. Specifically, SFA decomposes uncontrollable factors into random error terms and technical inefficiency terms, thereby reducing the interference of irrelevant factors in calculations and providing more precise results. DEA determines the production system frontier through linear programming, obtaining the status of each decision-making unit. This approach is applicable to production systems with multiple inputs and outputs. On the one hand, technical efficiency is decomposed into pure technical efficiency predominantly based on the DEA model. On the other hand, from the perspective of input–output analysis, the innovation system of manufacturing maintains synergistic development between multiple inputs and outputs. Two issues will arise once the SFA model is employed: (1) the correlation between multiple innovation input indicators can impact the reliability of the SFA methodology in handling results; and (2) the output results of SFA are comprehensive and should be further decomposed, potentially introducing errors. Hence, the DEA model is employed, since it helps to obtain pure technical efficiency through decomposition and handles multiple inputs and outputs with greater advantages.
The DEA model includes the CCR (Charnes–Cooper–Rhodes Model, CCR) model and BCC (Banker–Charnes–Cooper Model, BCC) model. To be specific, comprehensive technical efficiency is calculated by the CCR model. The BCC model decomposes comprehensive technical efficiency into pure technical efficiency and scale efficiency; the former refers to the production efficiency influenced by factors such as management and technology, whereas the latter pertains to the efficiency influenced by enterprise size. In this study, the pure technical efficiency of manufacturing innovation is the focus, but it cannot be obtained via the traditional CCR mode. As a result, the BCC model is selected to specifically analyze the impact of design innovation factors.
Due to the limitations of the traditional BCC model, where an effective decision-making unit of technical efficiency is uniformly assigned as 1, the technical efficiency of these decision-making units cannot be compared. In this context, this study employs the super-efficiency BCC model developed by Andersen and Petersen [31], which assigns specific values greater than 1 to the technical efficiency of decision-making units, allowing for comparability among these units. From the view of orientation, the super-efficiency BCC model can be further categorized into input-oriented, output-oriented, and non-oriented approaches. Among them, the input-oriented approach, as defined by Farrell [13], aims to minimize inputs while maintaining the given outputs. The output-oriented approach, as defined by Leibenstein [14], means the ratio of the actual output to the maximum potential output of a production unit under the same level of input. However, the non-oriented approach involves measurement from both aspects simultaneously. From an external perspective of manufacturing, design innovation is an independent production service industry that struggles to directly impact the innovation input of manufacturing, but rather focuses on enhancing the overall output based on fixed inputs. Internally, the costs of design innovation, associated with R&D activities, are included in the R&D budget and do not directly influence the innovation investment in manufacturing, so design innovation will be not separately discussed at the enterprise level. In summary, the relationship between design innovation and manufacturing innovation depends more on fixed input. This aligns more closely with the definition of technical efficiency proposed by Leibenstein [14] from the perspective of output. This is the reason why the output-oriented super-efficiency BCC model is adopted for analysis. The production possibility set can be defined as P 0 S C R S = ( X , Y ) X j = 1 j 0 n λ j X j , Y j = 1 j 0 n λ j Y j , λ j 0 , j 0 , calculated in Equation (3):
m a x θ 0 s s . t . x i 0 j = 1 j 0 n λ j x i j , i = 1,2 , , m , θ 0 s y r 0 j = 1 j 0 n λ j y r j , r = 1,2 , , s , j = 1 j 0 n λ j = 1 , λ j 0 , j 0 .
In the equation, n represents the number of decision-making units, and there are m types of inputs and s types of outputs for each unit. For the j th decision-making unit, x j and y j explain the input and output column vectors, while X and Y represent possibility sets of inputs and outputs, respectively. θ signifies the efficiency index of a decision-making unit, with θ 0 , and the decision-making unit DEA is effective only when it is θ 1 . j = 1,2 , , n .

3.1.4. Tobit Regression

The Tobit model is a common linear regression model used to handle metrics demonstrating both partially continuous and partially discrete distributions of the dependent variable [32]. In other words, the values of the dependent variable are constrained to a specific interval. In such scenarios, regression via the least squares method will result in biases and inconsistency [33], whereas the Tobit model based on the maximum likelihood method avoids such issues. The computation of the super-efficiency BCC model is within a specific range, with all values being greater than 0. Consequently, Tobit is commonly employed in regressing the values of the DEA model [34].
When value of the dependent variable Y i is greater than zero, and dependent variable Y i is related to the independent variable X i , then the Tobit regression model is represented by the following Equation (4):
Y i = α + β X i + μ i , i = 1,2 , , m
In this study, Y i indicates the pure technical efficiency value of manufacturing innovation; α is constant, X i represents the variable value of design innovation factors; β is the coefficient of design innovation factors X i ; and μ i means a random error term, with μ i ~ N ( 0 , σ 2 ) .

3.2. Research Object and Data Sources

The design innovation process is an intermediary stage in product development in manufacturing, and associated data cannot be independently collected for statistical analysis and monitoring. This study explores design enterprises, design innovation activity carriers separate from manufacturing as representatives of innovation. Meanwhile, design parks with numerous design enterprises are characterized by a high density and high quality, so research on them is able to reflect and represent the realities of design innovation activities. Therefore, 16 characteristic design parks in Zhejiang Province (“provincial characteristic design parks”, hereinafter referred to as “design parks”) are researched as a representative of design innovation aggregation. Considering the typicality and impact of data, this study mainly discusses the manufacturing innovation of industrial enterprises above the designated size in Zhejiang Province.
The data on design innovation came from the monthly statement summaries of the 16 design parks in Zhejiang Province from 2015 to 2022. The manufacturing innovation data were sourced from some data on Zhejiang Province in the China Statistical Yearbook from 2015 to 2022. Given the insufficient number of decision-making units that failed to meet the requirements of the super-efficiency BCC model, the time period was extended forward. In 2011, the criterion for defining industrial enterprises above the designated size was adjusted from “annual main business revenue not less than 5 million” to “annual main business revenue not less than 20 million” [35], so the pure technical efficiency of manufacturing innovation was calculated based on the relevant data of industrial enterprises above the designated size in Zhejiang Province from 2011 to 2022. In order to ensure the comparability of economic data across different years, this study adjusted various economic indicators to constant prices from the base year of 1990. In addition, the manufacturing innovation data were amended again by following guidance from the approaches of ZHU Youwei and XU Kangning [36]. Specifically, there is Rd_pi = 0.75 p + 0.25 w, wherein Rd_pi represents the R&D price index, p denotes the output reduction index in the commercial sector, and w signifies the average wage index in the commercial sector.

4. Variable Construction and Proposed Hypotheses

4.1. Selection of Design Innovation Components

Most studies analyze design innovation components in design industry evaluation. On the one hand, the design industry gathers design enterprises that serve as a specific organizational form for design innovation activities. To some extent, the evaluation of the design industry is equivalent to the appraisal of its innovative design activities. On the other hand, an evaluation indicator system is decomposed by components of the object to be evaluated, and based on this, it evaluates respective elements individually. To summarize, the evaluation indicator system is also a component indicator system. Specifically, WANG Jun [37] proposed evaluating the core capabilities of the art and design industry from the perspectives of human resources, market demand, industrial development, government support, and innovation atmosphere, and a relevant indicator system was established. When assessing the current states of the industrial design industry, ZHOU Chao [38] evaluated the innovation activities in industrial design based on three perspectives: industrial design scale, development level, and profitability. Furthermore, Xiang Y. [39] established a design industry evaluation system that unfolds from three dimensions, such as the industrial development environment, industrial benefits, and innovative achievements. An overview of existing research indicates that design innovation components are mainly divided into the internal dimension (innovation capacity, organizational structure, human resources, etc.) and external dimension (policy support, market resources, competitive environment, etc.).
Based on the characteristics of design innovation activities and findings of predecessors, this study also divided design innovation into the internal and external dimensions. The latter included the development environment (GA) (primary indicator), while the former had three primary indicators: human resources (GB), scale (GC), and output (GD). Under the 4 primary indicators, 20 secondary indicators were further subdivided, including support funds, the number of full-time professionals, design service income, and the number of design output transactions. Please see Table 1 for the specific distribution and definitions.
Given that support funds are typically a byproduct of relevant policies, the support funds (G1) indicator was excluded. The percentage of personnel holding certificates (G6) indicator was excluded, because industrial design professional qualifications with a short establishment time were not classified as employment qualifications and were not strongly correlated with the professional ability of employees. Moreover, not all certificate holders were engaged in their industry, so it was inappropriate to measure talent capability with this certificate. The design activities held (G19) indicator was removed because related events held were not key content of innovative activities. International exchanges of design innovation were held in the form of projects, so the secondary indicators of number of design output transactions (G13) and number of foreign exchanges and cooperation (G20) overlapped. Meanwhile, the algebra of design output transactions was more representative, so the G20 indicator was eliminated. Considering the disparity between patent applications and granted patents, this study excluded the number of patent applications (G15) indicator, because it was unreasonable to measure unlicensed patents as part of the output results. Due to the significant time lag between patents granted and applications, and the fact that design innovation patents mainly consisted of design patents and utility model patents, the number of patents granted (G16) lagged one year behind. Design competitions were primarily funded and organized by governmental and corporate entities, which reflected the strong support and emphasis placed on design innovation activities. Therefore, design competitions held (G18) was classified into the development environment. The revised evaluation indicators and their definitions are presented in Table 2.
There may be interconnection among the secondary indicators, and excessive correlation will result in multicollinearity, leading to ineffective and unreasonable outcomes in the model estimation. Consequently, it is necessary to perform a correlation analysis for the secondary indicators and eliminate those with high correlations, so as to achieve reliable model results. Based on the indicator system, this study extracted the relevant data on design innovation in 16 design parks in Zhejiang Province. Initially, the data were classified according to the primary indicators, and correlation tests were conducted on the secondary indicators within four primary indicators, removing any highly correlated indicators. Subsequently, the de-duplicated secondary indicators were aggregated for the correlation tests, with highly correlated indicators being excluded. Due to disparate dimensions among the indicators, Equation (1) was employed to standardize the indicator data. The secondary indicators of economic environment (G2), design service income (G8), and the conversion of industrial achievements into output value (G12) are economic indicators spanning years. In order to reduce differences between the years, this study standardized them after applying a constant price in 1990.
First, Equation (2) was applied to test the Pearson correlation coefficient of the standardized data of four secondary indicators under the development environment (GA), as shown in Table 3.
According to the definition of the Pearson correlation coefficient, when the absolute value of the coefficient between indicators is greater, the correlation between indicators will be higher. Therefore, indicators with a high correlation were removed. It can be observed from Table 3 that the Pearson correlation coefficients between the three secondary indicators of economic environment (G2), innovation atmosphere (G3), and design competitions held (G4) were all greater than 0.8, indicating a high correlation. As a result, two of them had to be eliminated. Economic environment (G2) and innovation atmosphere (G3) reflect the overall macro social environment, and design competitions held (G4) refers to societal attention and support towards design. In terms of relevance, design competitions held (G4) shared a closer correlation with design innovation. Consequently, the two secondary indicators of economic environment (G2) and innovation atmosphere (G3) were removed, while the two secondary indicators of number of policy regulations (G1) and design competitions held (G4) were maintained.
Next, Equation (2) was applied to test the Pearson correlation coefficient of the standardized data of the three secondary indicators under human resources (GB), as shown in Table 4.
According to Table 4, the Pearson correlation coefficient between the number of full-time professionals (G5) and the percentage of personnel with intermediate and senior professional titles (G6) was 0.9, indicating a strong positive correlation. The greater the number of full-time professionals, the higher the percentage of personnel with intermediate and senior professional titles. Design innovation is a knowledge-intensive activity, and it requires a higher level of practitioners’ knowledge literacy and educational qualifications. Given the relatively high percentage of personnel with intermediate and senior professional titles in the industry, the scale of the industry can be better reflected by the number of practitioners rather than the percentage of personnel with intermediate and senior professional titles, so this study excluded the percentage of personnel with intermediate and senior professional titles (G6), and retained two secondary indicators, including the number of full-time professionals (G5) and the growth rate of designers (G7).
Equation (2) was applied to test the Pearson correlation coefficient of the standardized data of the three secondary indicators under scale (GC), as shown in Table 5.
Based on Table 5, the Pearson correlation coefficients among the three secondary indicators such of design service income (G8), number of design enterprises (G9), and number of service enterprises (G10) were all above 0.8, indicating a strong positive correlation. Accordingly, two indicators had to be removed. Considering that the number of design enterprises (G9) is the core and fundamental indicator of the other two, and it better reflects the industry scale, this study eliminated two secondary indicators—design service income (G8) and number of service enterprises (G10)—and retained the secondary indicator pf number of design enterprises (G9).
Equation (2) was applied to test the Pearson correlation coefficient of the standardized data of the four secondary indicators under output (GD), as shown in Table 6.
According to Table 6, the Pearson correlation coefficients between the four secondary indicators, including number of design output transactions (G11), conversion of industrial achievements into output value (G12), number of patents granted (G13), and number of design awards at the provincial level or above (G14), were all below 0.8. Therefore, they were temporarily retained.
In conclusion, following a round of correlation analysis and the removal of highly correlated indicators, the adjusted evaluation indicators and their interpretations are presented in Table 7 as follows.
Equation (2) was applied to test the Pearson correlation coefficient of the standardized data in Table 7, as shown in Table 8.
According to Table 8, the absolute values of the correlation coefficients between the design competitions held (G4) and the four secondary indicators of number of full-time professionals (G5), number of design enterprises (G9), number of design output transactions (G11), and conversion of industrial achievements into output value (G12) were all greater than 0.8, indicating that the five indicators were highly correlated. The other four secondary indicators all serve as the primary carriers or outputs of design innovation activities, and are more representative, so the design competitions held (G4) was omitted. The absolute values of the correlation coefficients of number of full-time professionals (G5) and the three secondary indicators of number of design enterprises (G9), number of design output transactions (G11), and conversion of industrial achievements into output value (G12) were all greater than 0.8, indicating that the four indicators were highly correlated. Generally, since design enterprises have a small scale and limited workforce, the number of full-time professionals greatly overlaps with the number of design enterprises. Additionally, the growth rate of designers under human resources reflects the growth status. Hence, it was advisable to exclude the number of full-time professionals (G5). The absolute values of the correlation coefficients between number of design enterprises (G9) and the two secondary indicators of number of design output transactions (G11) and conversion of industrial achievements into output value (G12) were all greater than 0.8, indicating that the three indicators were highly correlated. When design enterprises provide services to manufacturing enterprises, there may be a certain proportion of bad debt, external customer breaches of contract, project suspensions, and other situations. The number of design output transactions (G11) is somewhat limited in reflecting design activities compared to the number of design enterprises (G9), so the number of design output transactions (G11) was eliminated. The conversion of industrial achievements into output value is greatly influenced by factors such as the branding of service providers, distribution channels, and supply chain management. In contrast, the number of design enterprises (G9) is precise in measuring design innovation activities, so the conversion of industrial achievements into output value (G12) was excluded. After the highly correlated indicators were removed, the correlation coefficients of the secondary indicators are shown in Table 9.
As indicated from Table 9, with the highly correlated indicators eliminated, the absolute values of the correlation coefficients among the remaining five secondary indicators were all less than 0.8, implying that the indicators were not highly correlated and there was moderate collinearity among the indicators. In the context, this study reordered the adjusted indicators, producing a design innovation component indicator system that includes four primary indicators and five secondary indicators, as illustrated in Table 10 below.

4.2. Construction of Pure Technical Efficiency Indicator for Manufacturing Innovation

In this study, the super-efficiency BCC model was employed to calculate the pure technical efficiency of manufacturing innovation. This model constructs the production possibility set with the input–output data of decision-making units, thus forming the production efficient frontier to determine the pure technical efficiency of corresponding years. Therefore, it is needed to establish the relevant indicators for inputs and outputs.
Among existing research, no consensus has been reached on the input–output indicators for manufacturing innovation, generally including three types. First, fixed assets, capital investment, and labor input are taken as input indicators, and industry output or value added as the output indicators [40,41,42]. However, this approach fails to take into account the utilization efficiency of intermediate inputs. Consequently, some researchers have incorporated intermediate input indicators based on the former, and established input indicators from the dimensions of capital, labor, and intermediate inputs, as well as output indicators from the perspective of industry output or value added [43,44,45]. Second, based on R&D funds investment and R&D personnel, certain indicators can be added or removed to serve as input indicators, while output indicators are selected from certain indicators that are added or removed based on patent quantity and new product output value [46,47,48]. Third, input–output indicators are relatively fragmented. In general, expenditures for absorption and digestion [49] and technical expenditure [50] are added on the basis of second type to serve as input indicators. Moreover, scientific paper publications [50] and new product growth rates [51] are added to act as output indicators. However, due to the significant disparities between additional indicators and indicators of the second type, they are listed in a separate class.
From the perspectives of indicators of selection and establishment, indicators of the second type are set by focusing on manufacturing innovation. Naturally, the setting method for indicators of the second type is adopted in this study, with R&D expenditure and R&D personnel serving as input indicators. For manufacturing, new product development directly promotes innovation, and it is a vital element of independent innovation in manufacturing [52]. In this study, R&D expenditure on new product development was selected as an input indicator. Patents for invention are a preferable indicator to assess innovation output level, given their high technological content and relatively low application rate. These patents, constrained by the examination capacity of patent-granting bodies, better reflect the original innovative capability and overall technological strength of enterprises [53]. The commercial value for technological innovation is reflected by income from sales of new products, which is able to objectively measure manufacturing innovation. In this study, output indicators consist of the number of patents granted and new product sales revenue. It takes time for new products to generate sales income after research and development, so new product sales revenue was calculated with a one-year time lag. Table 11 lists the evaluation indicators for manufacturing innovation.

4.3. Hypotheses

Based on the five identified design innovation factors and insights discovered by other researchers in this respect [26,27,28,29], this study proposed the following five hypotheses:
Hypothesis 1 (H1).
G1 (Number of policy regulations) is significantly positively correlated with the pure technological efficiency of manufacturing innovation.
Hypothesis 2 (H2).
G2 (Growth rate of designers) is significantly positively correlated with the pure technological efficiency of manufacturing innovation.
Hypothesis 3 (H3).
G3 (Number of design enterprises) is significantly positively correlated with the pure technological efficiency of manufacturing innovation.
Hypothesis 4 (H4).
G4 (Number of patents granted) is significantly positively correlated with the pure technological efficiency of manufacturing innovation.
Hypothesis 5 (H5).
G5 (Number of design awards at the provincial level or above) is significantly positively correlated with the pure technological efficiency of manufacturing innovation.

5. Results and Proposal

5.1. Data Calculation

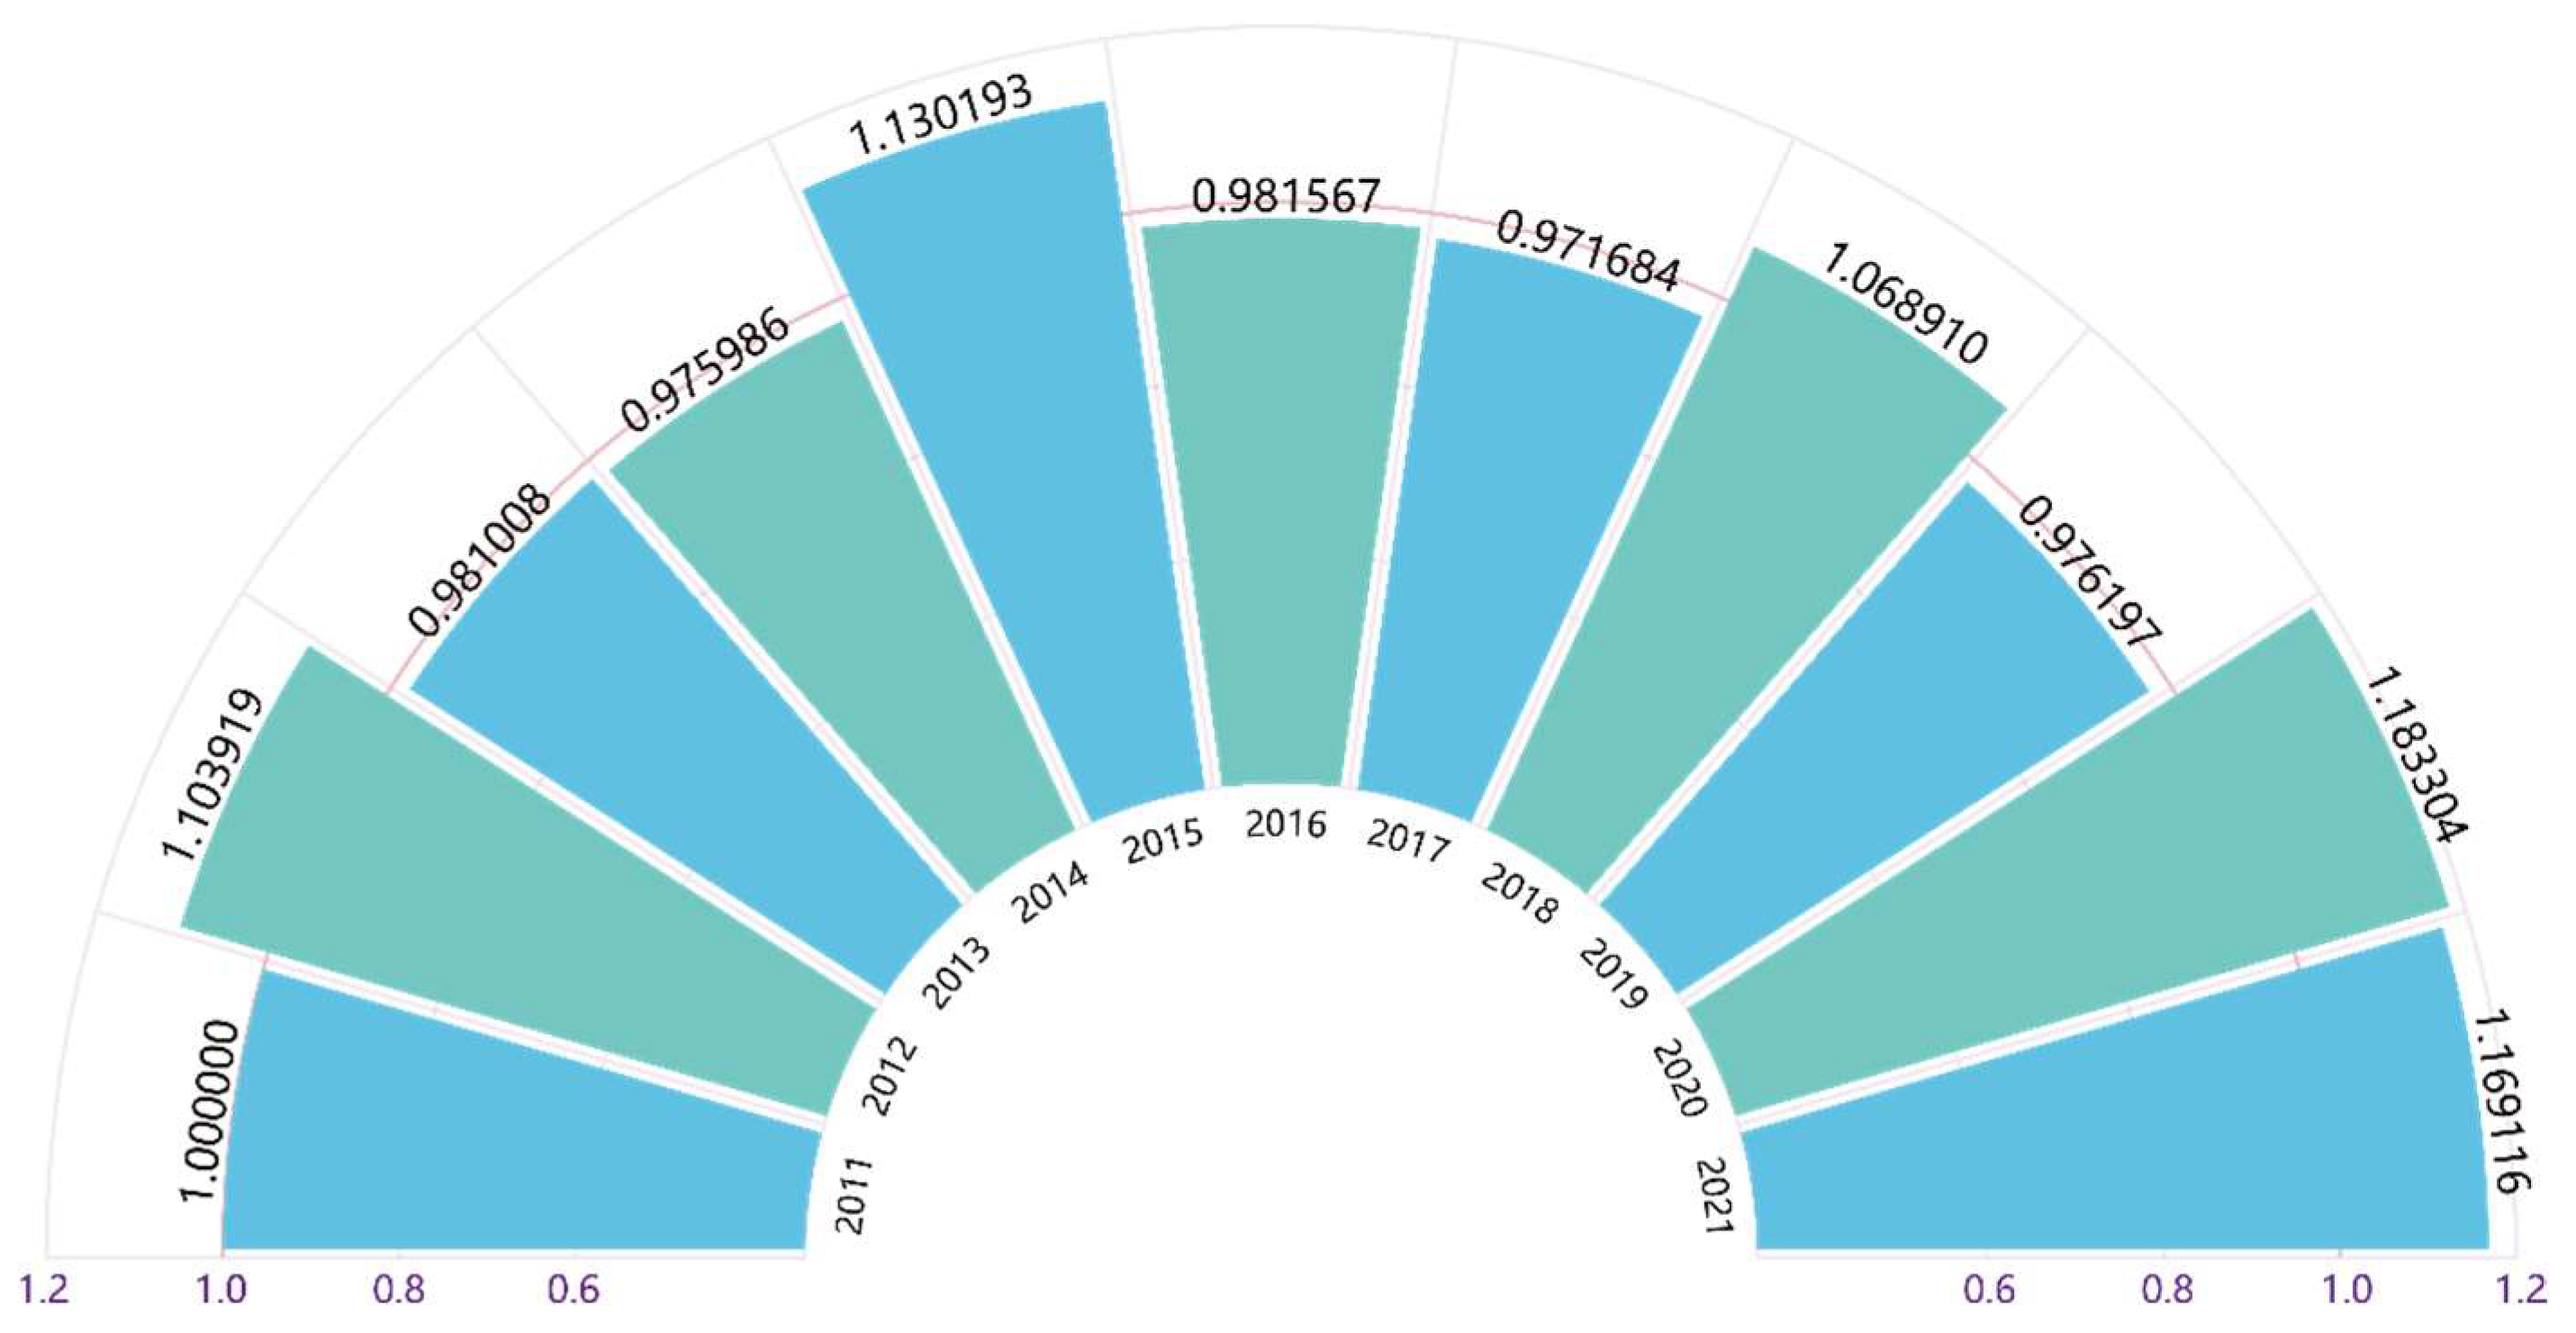
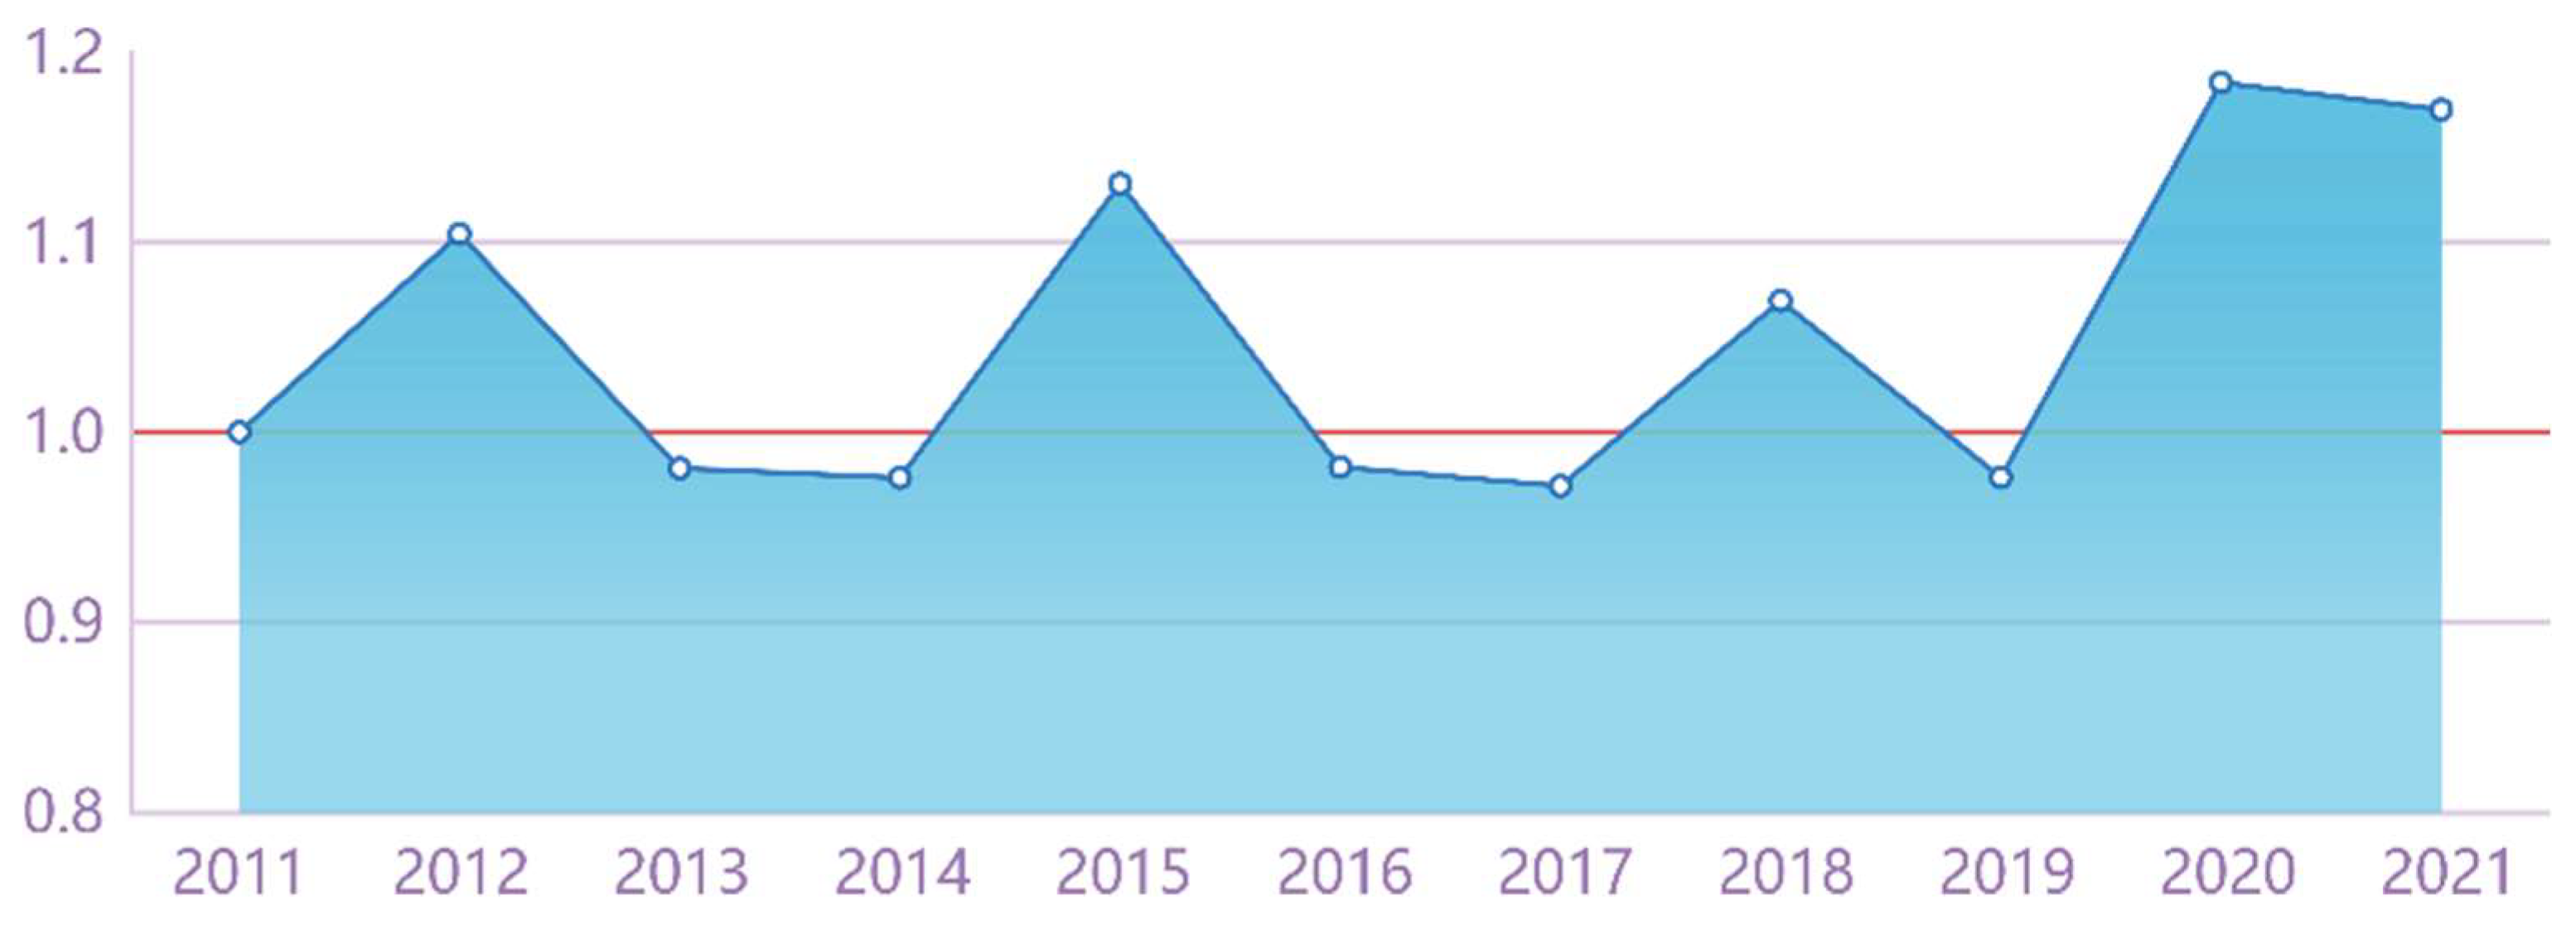
5.1.1. Calculation of Pure Technical Efficiency of Manufacturing Innovation in Zhejiang Province

The data of industrial enterprises above the designated size in Zhejiang Province in the China Statistical Yearbook during 2011–2022 were processed as per 1990 constant prices and the R&D price index [36], as shown in Table 12.
The manufacturing innovation evaluation indicator system includes three innovation input indicators and two innovation output indicators. Let us denote the number of secondary indicators for innovation input as a , for innovation output as b , and the number of periods covered by the sample data from industrial enterprises above the designated size in Zhejiang province as t . Thus, a = 3 ,   b = 2 , and t = 11 . Therefore, the condition a + b 2 < t is satisfied, indicating that the sample size supports using the super-efficiency BCC model [54].
Equation (3) was adopted to calculate the pure technical efficiency of manufacturing innovation in Zhejiang Province from 2011 to 2021, as shown in Figure 1.
It can be observed from Table 12 and Figure 1 that innovation input and output in the manufacturing industry of Zhejiang Province are steadily increasing. However, pure technical efficiency experiences fluctuation within a relatively high range, indicating the optimization opportunities in the allocation and utilization of innovation input. Line Chart 2 is generated based on the data provided in Figure 1, in order to further analyze changes in the pure technical efficiency of the manufacturing industry in Zhejiang Province from 2011 to 2021.
As shown in Figure 2, globally, the integration and utilization of innovation input in the manufacturing industry spiral up in a process of “effective–ineffective–effective”, which implies continuous progress in the technological and managerial capabilities of the manufacturing industry to match the gradually increasing investment in innovative resources when the rising innovation inputs are considered. In this process, provincial manufacturing innovation grows in both scale and quality. From the perspective of local change, the pure technical efficiency of manufacturing innovation maintained a declining trend from 2012 to 2014, and it rapidly fell again after a brief rebound in 2015. It experienced gradual decrease in two years, returned to being technically effective in 2018, became technically ineffective again in 2019, and quickly rebounded in 2020, achieving the highest level in the past 10 years. It then decreased slightly in 2021. There are significant differences between these years, indicating that the technological and managerial capabilities of innovation in the manufacturing industry are unable to adapt to the growth of innovation input in some years. The overall development is not sufficiently stable, with excessive fluctuations. After 2015, half of the years are characterized by effective technology, while the other half by ineffective technology, with the efficiency values of the years with effective technology fluctuating significantly. This signifies that manufacturing enterprises fail to prepare to answer rising innovation input resources during certain periods, leading to the inefficient resource utilization of rising innovation input resources. In conclusion, manufacturing innovation in Zhejiang Province is progressing steadily, with improvements in accompanying management and technological levels, etc. However, this growth is far from stable over a long time and there is still room for enhancing preparations for the innovation input growth of technology and management.

5.1.2. Analysis of Design Innovation Factors Influencing Pure Technological Efficiency of Manufacturing

The Tobit model was employed to conduct a regression analysis on the design innovation factors and the pure technical efficiency of manufacturing innovation in order to elucidate their relationship. This study mainly discussed the pure technical efficiency of manufacturing innovation and the innovation data of 16 design parks during 2015–2021 in Zhejiang Province. In particular, the pure technical efficiency of manufacturing innovation was a dependent variable, and independent variables included the number of policy regulations, growth rate of designers, number of design enterprises, number of patents granted, and number of design awards at the provincial level or above related to innovation activities in corresponding years. Equation (4) was used for the regression analysis, as presented in Table 13.
The model likelihood ratio test was applied in Equation (4), with p value of =0.037 < 0.05. This shows prominence [55] and proves that the model construction was effective. In other words, pure technical efficiency can effectively be explained by five independent variables of design innovation. AIC [56] and BIC [57] are valued at −14.237 and −14.561, respectively, at lower levels, indicating the high quality of the model and effective model construction. Consequently, the explanation of the independent variables’ impact on the dependent variable, as well as the model construction, are both deemed effective, and the analysis results are also validated.
Four conclusions can be drawn based on the calculations in Table 13.
Firstly, the regression coefficient value of the effect of the number of policy regulations (G1) (variable reflecting the development environment) on the pure technical efficiency of manufacturing innovation was 0.038, with p = 0.117 > 0.05, indicating insignificance. This means that pure technical efficiency is generally free from the influence of political attention and policies on design innovation, which fails to support H1. This is probably because industrial policies cut down the operating burdens of enterprises through tax cuts, financial subsidies, and other auxiliary means to support enterprise development. However, for design enterprises, it takes a longer time from policy support to obtain better and more professional external services to facilitate internal management and technological advancements in manufacturing innovation. Meanwhile, the design industry is supported by limited policy funding due to its small scale, so it is difficult for pure technical efficiency to be affected directly by policy regulations for design innovation caused by a long chain of transmission and limited financial support.
Secondly, the regression coefficient value of the effect of the growth rate of designers (G2) (variable reflecting the human resources of design innovation) on the pure technical efficiency of manufacturing innovation was −0.126, with p = 0.005 < 0.05, indicating a significant negative impact. In other words, when the growth rate of designers in the design innovation industry is higher, the weakening of the pure technical efficiency in manufacturing innovation becomes more evident, which fails to support H2. This is probably because design innovation is a high-pressure industry, and design enterprises experience a high turnover rate. In this case, most practitioners are fresh graduates who are less experienced in design, industry understanding, and project implementation, with a poor service capability. When more people are engaged in this field, enterprises are not equipped with enough experienced designers to guide and manage these practitioners. This leads to unstable project delivery quality and prolonged delivery cycles, thereby hindering the technological development and pure technical efficiency improvement of manufacturing. However, it should also be noted that the number of design enterprises (G3) (variable reflecting the existing scale of design innovation activities) is more significantly positively correlated with pure technical efficiency. As a result, the negative impact of personnel growth is an inevitable program for the scale expansion of design innovation activities.
Thirdly, the regression coefficient value of the effect of the number of design enterprises (G3) (variable reflecting the design innovation scale) on the pure technical efficiency of manufacturing innovation was 0.216, with p = 0.001 < 0.05, showing a significantly positive impact. In other words, with more design enterprises, there will be more design outputs traded, and their role will be more evident with a promotion effect on manufacturing innovation, which supports H3. This caters to a conclusion that design innovation enhances the innovation capability of the manufacturing industry [58,59]. The regression coefficient for the number of design enterprises was 0.216, which is the highest among the design innovation factors, proving that design innovation is able to boost pure technical efficiency through increasing design enterprises directly. However, this imposes higher requirements on a social atmosphere that values design and the establishment of a reasonable and scalable talent cultivation system.
Fourthly, the regression coefficient values of the effects of the number of patents granted (G4) and design awards at the provincial level or above (G5) (variables reflecting design innovation output) on the pure technical efficiency of manufacturing innovation were p < 0.05, indicating a very significant positive impact. In other words, the more patents and awards there are in the design industry, the more apparent the improvement in the pure technical efficiency of manufacturing innovation, and such results support H4 and H5. According to the regression coefficients, the coefficient for the number of patent granted (G4) was 0.157, while that of design awards at the provincial level or above (G5) was 0.195, which shows that the latter is superior to the former in improving the pure technical efficiency of manufacturing innovation. This can be explained from two perspectives. On the one hand, most patents of design innovation focus on aesthetics and play a minor role in driving manufacturing innovation. On the other hand, design awards at the provincial level or above are selected based on the criteria of insights into user pain points and forward-looking perspectives. Design innovation guides manufacturing enterprises to explore markets and conduct technological research and breakthroughs in specific directions through developing products reflecting user difficulties and highly forward-thinking ideas, thereby promoting the technological progress of enterprises. To some extent, this explains why design awards at the provincial level or above are strongly correlated with the pure technical efficiency of manufacturing industry.

5.2. Conclusions

5.2.1. Results Discussion

This study examined the changes in the pure technical efficiency and the impact of design innovation factors on it in manufacturing innovation in Zhejiang Province through empirical research. Compared to previous studies on the relationship between design innovation and manufacturing innovation, this study contributes in two key aspects. On the one hand, the research focus shifts from the industrial level to design innovation factors, and from manufacturing innovation to pure technical efficiency. It clarifies the role of design innovation factors in promoting manufacturing technological innovation through indicator construction, formula calculation, and linear regression analysis. On the other hand, the economic concept of “pure technical efficiency” is introduced into the study with an impact on the relationship between design innovation and manufacturing innovation; the DEA model was employed to quantify manufacturing innovation, and the Tobit regression model to clarify the impact of design innovation factors on the pure technical efficiency of manufacturing innovation, by explaining the relationship between the two with specific data. This avoided the insufficient data research normally seen in qualitative research, enhancing the reliability of the research and enriching the research methods in this field.
The research findings can be concluded by following three points:
First, in general, design innovation facilitates pure technical efficiency. More precisely, design innovation development can significantly improve the level of pure technical efficiency, propel technological upgrading and the development of manufacturing, and enhance manufacturing sustainability.
Second, from perspectives of the development environment, human resources, scale, and output, a favorable development environment for design innovation will not significantly raise pure technical efficiency, while rapid growth in human resources may inhibit it. However, with the expansion of the design innovation scale, there will be more design outputs, and this will impose a significant positive impact on manufacturing innovation.
Third, meanwhile, design innovation factors affect manufacturing innovation differently. Apart from the fact that the number of policy regulations (G1) is not correlated with the pure technical efficiency of manufacturing innovation and the growth rate of design personnel (G2) is negatively related to pure technical efficiency, the other three factors share a significant positive impact with pure technical efficiency. The correlation is ranked in descending order as follows: number of design enterprises (G3), design awards at the provincial level or above (G5), and number of patents granted (G4).
To summarize, the development of innovative design is closely correlated with manufacturing innovation. However, focus should be placed on highlighting the factors with significant positive impacts during the development process, in order to better allocate limited resources and promote better innovation, faster upgrading, and the robust sustainability of manufacturing.

5.2.2. Conclusions

The above research findings are expected to propose reasonable recommendations for enterprises to manage their design innovation activities and for government departments to formulate relevant policies.
First of all, design innovation will be provided with more resources and policies that act as “visible hand” to promote design innovation. Design innovation activities facilitate pure technical efficiency in manufacturing, while the role of policy regulations in innovation is insignificant. However, industrial policies are an effective means for the government to support specific industries, and they will bring about more resource input and policy guidance for industrial development, thus enhancing the pure technical efficiency of manufacturing innovation to some extent. Design innovation is a knowledge-intensive activity, but design enterprises predominantly consist of small- and medium-sized enterprises [60]. On the one hand, this has limited the financing channels for related enterprises, resulting in poor risk resistance. On the other hand, small enterprises with limited revenues do not have the advantage of attracting professionals. These are the factors constraining design innovation. If design innovation enterprises are expected to solve these problems independently, it will be time-consuming, and problems may not be overcome. However, with the introduction of government resources and policy support, these issues can be avoided promptly, which is beneficial for raising the sustainability of design innovation. Moreover, this creates sound development conditions for manufacturing innovation and sustainability.
Second, measures should be adopted to develop a modern design education system, dedicated to help design innovation education cater to the demands of industrial development. The number of design enterprises (G3) (variable reflecting the scale of design innovation activities) raises the pure technical efficiency of manufacturing innovation, but the growth rate of designers (G2) plays a negative role. One reason for this is that it takes time for fresh graduates to develop, and at the same time, this indicates a gap between the direction of modern design education and the actual needs of the industry. At a university level, they should strengthen their connections with the industry and a modern design education system should be developed that enables design students to establish modern design concepts, technical perspectives, and capability models. After graduation, students can quickly translate their professional knowledge into practice, meeting the needs of actual commercial scenarios. This enhances the sustainability of design innovation activities by increasing talent, indirectly promoting the sustainability of the manufacturing industry.
Third, small- and medium-sized manufacturing enterprises should consider outsourcing design services, while large-scale manufacturing enterprises can establish independent design centers. According to the empirical results, design innovation significantly promotes the pure technical efficiency of manufacturing innovation, and, to some extent, will elevate the sustainability of manufacturing enterprises. However, for some manufacturing enterprises with a small scale and limited product varieties, costs will be too high to establish a design system by themselves, and it is also difficult to recruit qualified designers. Therefore, design systems can be outsourced in small- and medium-sized manufacturing enterprises and instead, they can hire experienced designers with high hourly pay, improving development efficiency at a lower overall cost. For large manufacturing enterprises, internalized design resources are more controllable, with lower communication barriers with technical department and a higher collaborative efficiency as a whole. Higher costs can also be allocated through diverse product lines. Hence, an internal design center is necessary for large manufacturing enterprises to improve their R&D systems, boost their overall development efficiency, and raise their product values.
Fourth, design enterprises may moderately recruit engineering and technical personnel to deepen their understanding of products and technology. Currently, they focus on offering appearance design, but cultivate a relatively weak understanding of product technology and structure, which can be attributed to the fact that the majority of the personnel in design enterprises are designers. Limited by time and energy, most designers find it difficult to balance their focus on design while also considering technology and structure, causing them to have a poor understanding of products and technology. Under these circumstances, engineering technicians should be introduced to optimize the personnel structure. Their professional technical expertise can strengthen the understanding of product and technology, which will help design enterprises to provide products with aesthetic and innovative appearances and technical and structural feasibility. Design enterprises may attract manufacturing enterprises to purchase design services through enhancing their service quality, thereby achieving business sustainability. Moreover, the service scopes of design enterprises will be expanded so that they can become involved in more R&D processes to better drive manufacturing innovation and achieve sustainable development.

Author Contributions

Conceptualization, B.X. and S.K.; methodology, B.X., S.K., Z.Y., J.C. and S.Z.; formal analysis, B.X., S.K. and Y.Y.; investigation, Z.Y. and J.C.; data curation, S.K. and Y.Y.; writing—original draft, S.K.; writing—review and editing, B.X. and S.K.; visualization, S.Z.; supervision, B.X. and J.X.; project administration, B.X.; funding acquisition, J.X. All authors have read and agreed to the published version of the manuscript.

Funding

This research was financially supported by the National Social Science Fund of China (Grant No. 22BMZ038).

Data Availability Statement

The data presented in this study are available on request from the corresponding author.

Conflicts of Interest

The authors declare no conflicts of interest.

References

  1. Yu, Q.-H.; Qi, Z.-Y.; Yu, Y.-T. Industrialization and Economic Growth in China: A Panel Test of Kaldor’s Growth Laws. In Proceedings of the 2018 25TH Annual International Conference on Management Science & Engineering, Frankfurt, Germany, 17–20 August 2018; IEEE: New York, NY, USA; pp. 382–389. [Google Scholar]
  2. Institute of Industrial Economics of CASS. China Industrial Development Report 2021, 1st ed.; Economy & Management Publishing House: Beijing, China, 2021. [Google Scholar]
  3. Banker, R.D.; Charnes, A.; Cooper, W.W. Some Models for Estimating Technical and Scale Inefficiencies in Data Envelopment Analysis. Manag. Sci. 1984, 30, 1078–1092. [Google Scholar] [CrossRef]
  4. Bu, L.; Zhang, Q.; Su, H.; Zhou, B. Research on Innovation Efficiency of China’s Pharmaceutical Manufacturing Industry. Chin. J. New Drugs 2021, 30, 1633–1637. [Google Scholar]
  5. Chen, J.; Tang, Q. Research on the Efficiency Measurement of High-quality Development of Sharing Manufacturing in China Based on Three-stage DEA-Malmquist Method. J. Ind. Technol. Econ. 2022, 41, 106–115. [Google Scholar]
  6. Yan, X.; Luo, Y.; Zhao, Q.; Pan, J. Research on the Efficiency Evaluation and Countermeasures of High-quality Development of Manufacturing Industry in Shaanxi Province based on SBM-DEA. Sci. Technol. Manag. Res. 2022, 42, 44–50. [Google Scholar]
  7. He, Z.; Cai, X.; Pan, H.; Liu, Y. Collaborative Agglomeration of Finance and Manufacturing in the Yangtze River Economic Belt and Its Impact on Manufacturing Innovation Efficiency. Resour. Environ. Yangtze Basin 2023, 32, 895–904. [Google Scholar]
  8. Zhang, L.; Mu, R.; Hu, S.; Zhang, Q. Influence of Specialized Agglomeration and Diversified Agglomeration on the Innovation Efficiency of Manufacturing Industry. Forum Sci. Technol. China 2019, 57–65. [Google Scholar] [CrossRef]
  9. Sun, C.; Liu, C. Industrial Design to Enhance the Key to Development of the Manufacturing Industry. Art Des. 2009, 197–199. [Google Scholar] [CrossRef]
  10. Lan, J.; Fu, Z.; Fang, S. Industrial Creativity Industry: A New Engine for the Transformation and Upgrading of Manufacturing Industry. Zhejiang Econ. 2009, 5, 47–48. [Google Scholar]
  11. Several Opinions of the State Council on Further Promoting the Integrated Development with Relevant Industries of Cultural Creativity and Design Services Government Information Disclosure Column [2023–03–02]. Available online: https://www.gov.cn/zhengce/content/2014-03/14/content_8713.htm (accessed on 14 March 2014).
  12. Han, S.; Wang, W. Comparative Study on Alternative Approaches to the Measurement of Technical Efficiency. China Soft Sci. 2004, 147–151. [Google Scholar]
  13. Farrell, M.J. The Measurement of Productive Efficiency. J. R. Stat. Society. Ser. A (Gen.) 1957, 120, 253–290. [Google Scholar] [CrossRef]
  14. Leibenstein, H. Allocative efficiency vs. ‘x-efficiency’. Am. Econ. Rev. 1966, 56, 392–415. [Google Scholar]
  15. Charnes, A.; Cooper, W.W.; Rhodes, E. Measuring the efficiency of decision making units. Eur. J. Oper. Res. 1978, 2, 429–444. [Google Scholar] [CrossRef]
  16. Xu, Q. Review of Technical Efficiency and Frontier Theory. Collect. Essays Financ. Econ. 2005, 2, 29–34. [Google Scholar]
  17. Yuan, X.; Zhang, B.; Fang, Y. Total Factor Productivity Growth and Technological Progress in Communication Equipment Manufacturing Industry. Econ. Manag. J. 2009, 35, 126–132. [Google Scholar]
  18. Dou, C.; Guan, Z.; Chen, G.; Liu, Z. Research on the Innovation Efficiency of Small and Medium-sized Enterprises under the Innovation-driven Development Strategy. Sci. Technol. Dev. 2018, 14, 289–297. [Google Scholar]
  19. Liu, Z.; Song, D.; Liu, G. The Threshold Effect of Environmental Regulations on Manufacturing Green Technology Innovation Capabilities. Commer. Res. 2018, 4, 111–119. [Google Scholar]
  20. Li, Y.; Meng, G. Two-stage DEA Evaluation of Technological Innovation Efficiency in Pharmaceutical Manufacturing Industry under the Perspective of Government Incentive Policies. Chin. J. Pharm. 2022, 53, 912–918. [Google Scholar]
  21. Wu, H.; Liu, S. The Impact of Mergers and Acquisitions on Corporate Technological Innovation Capabilities—Based on Perspective of China’s Manufacturing Sub-sectors. Financ. Account. Mon. 2018, 1, 130–134. [Google Scholar]
  22. Xu, L.; Song, Z. Innovation Efficiency of Manufacturing Industry from the Perspective of Innovation Value Chain—Taking Hebei Province as an example. China Bus. Mark. 2017, 31, 71–81. [Google Scholar]
  23. Chen, A.; Zhong, G. Does International Trade in China’s Equipment Manufacturing Industry Promote Its Technological Development—DEA-BASED Panel Data Analysis. Economist 2014, 43–53. [Google Scholar] [CrossRef]
  24. Ren, Y. Analysis of Technological Innovation Efficiency of China’s Manufacturing Industry. Stat. Decis. 2017, 140–142. [Google Scholar] [CrossRef]
  25. Hu, H.; Gao, N. Discuss of Chinese industrial structure adjustment based on design innovation. In Proceedings of the 2013 IEEE Tsinghua International Design Management Symposium, Shenzhen, China, 1–2 December 2013; IEEE: Piscataway, NJ, USA; pp. 83–89. [Google Scholar]
  26. Zhuo, H. Upgrading of Industrial Design Industry and Manufacturing Industry: Mechanism, Current Situation and Countermeasures. Master’s Thesis, Shanghai Academy of Social Sciences, Shanghai, China, 2016. [Google Scholar]
  27. Du, C.; Guo, M. Analysis of the Mechanism and Effect of China’s Creative Industries in Promoting Manufacturing Upgrading. Jianghuai Trib. 2015, 26–33. [Google Scholar]
  28. Yue, L. Research on Public Policy Formulation of China’s Design Industry Based on the Perspective of Manufacturing Demand. Master’s Thesis, Nanjing University of Aeronautics and Astronautics, Nanjing, China, 2011. [Google Scholar]
  29. Bo, M.Z.; Zhang, M.; Li, W. The role of new industrial design training model in the transformation and upgrading of manufacturing industry. IOP Conf. Ser. Mater. Sci. Eng. 2019, 573, 012040. [Google Scholar] [CrossRef]
  30. Yin, H. Research on P2P Traffic Classification Method Based on Pearson Coefficient Distance Weight KNN Algorithm. Master’s Thesis, Hunan University of Technology, Zhuzhou, China, 2019. [Google Scholar]
  31. Andersen, P.; Petersen, N.C. A Procedure for Ranking Efficient Units in Data Envelopment Analysis. Manag. Sci. 1993, 39, 1261–1264. [Google Scholar] [CrossRef]
  32. Zhao, X. Bank Branch Efficiency Measurement and Analysis of Influencing Factors-An Empirical Study Based on Super-efficiency DEA and Tobit Model. Econ. Sci. 2010, 85–96. [Google Scholar] [CrossRef]
  33. Greene, W.H. On the Asymptotic Bias of the Ordinary Least Squares Estimator of the Tobit Model. Econometrica 1981, 49, 505. [Google Scholar] [CrossRef]
  34. Yang, S.; Tan, Z. Research on Improving Efficiency of Independent Innovation in China’s Manufacturing Industry. Econ. Manag. 2015, 29, 54–59. [Google Scholar]
  35. What Is ‘Industrial Enterprises above Designated Size’? How to Determine? What Is the Difference between “above the Limit” and “above Designated Size”? Available online: http://tjj.qinghai.gov.cn/tjWork/tjknowledge/202104/t20210401_72295.html (accessed on 1 April 2021).
  36. Zhu, Y.; Xu, K. An Empirical Study on the R&D Efficiency of China’s High-tech Industries. China Ind. Econ. 2006, 38–45. [Google Scholar] [CrossRef]
  37. Wang, J. Comparative Study on the Core Capabilities of Art and Design Industries in Typical Countries. Des. Res. 2022, 12, 50–55. [Google Scholar]
  38. Zhou, C. Research on Interactive Integration of Industrial Design Industry and Manufacturing. Master’s Thesis, Zhejiang University of Technology, Hangzhou, China, 2018. [Google Scholar]
  39. Xiang, Y. Research on Coupling Relationship between Industrial Design Industry and Regional Economic Development. Master’s Thesis, Zhejiang University of Technology, Hangzhou, China, 2022. [Google Scholar]
  40. Shi, L.; Yao, H. Technological Progress, Technical Efficiency and Scale Adjustment of Shanghai’s Manufacturing Industry—An empirical study based on DEA. Shanghai J. Econ. 2011, 15–24. [Google Scholar] [CrossRef]
  41. Lai, S. Examination of Productivity Changes in Sub-sectors of the U.S. Manufacturing Industry before and after the International Financial Crisis—Based on the DEA-Malmquist Index Method. Mod. Manag. Sci. 2014, 2, 60–62. [Google Scholar]
  42. Tang, S.; Zhang, Y. Measure and Change of Technical Efficiency of China’s Manufacturing Industry. J. Beijing Univ. Posts Telecommun. (Soc. Sci. Ed.) 2014, 16, 59–65. [Google Scholar]
  43. Chen, J.; Lei, L. Productivity Growth, Technological Progress and Technical Efficiency of China’s Manufacturing Industry—An empirical analysis based on DEA. Mod. Econ. Sci. 2010, 32, 83–89+127. [Google Scholar]
  44. Fang, H.; Wang, H. Research on Technological Change of Chinese Manufacturing Industries. Stat. Res. 2008, 40–44. [Google Scholar] [CrossRef]
  45. Zhu, Z.; Li, X. Capital Formation, Total Factor Productivity Changes and Divergence in China’s Industrial Industries: A Study Based on Panel Data by Industry. J. World Econ. 2005, 9, 51–62. [Google Scholar]
  46. Shan, C. R&D Performance Evaluation of High-Tech Industries Based on DEA-Malmquist Index Method. Stat. Decis. 2011, 70–74. [Google Scholar] [CrossRef]
  47. Huang, S.; Tan, Q. An Empirical Analysis of the Innovation Efficiency of Manufacturing Industry—Based on DEA-Malmquist Index. J. Wuhan Univ. Technol. (Soc. Sci. Ed.) 2011, 24, 27–33. [Google Scholar]
  48. Xia, W.; Zhong, P. Study on R&D Dynamic Efficiency of Chinese Manufacturing Industries Based on DEA Malmquist Index. R D Manag. 2011, 23, 58–66. [Google Scholar]
  49. Zhang, T.; Xiao, H. Research on Evaluation of Technological Innovation Capabilities and Efficiency of China’s Manufacturing Industry—Based on Factor Analysis and Data Envelopment Methods. J. Ind. Technol. Econ. 2015, 34, 99–106. [Google Scholar]
  50. Cheng, H.; Dong, L.; Hu, Z. Research on Coordination of Technological Innovation Efficiency and Industrial Competitiveness—A Study Based on Manufacturing Industry in Zhejiang Province. Sci. Technol. Econ. 2012, 25, 6–10. [Google Scholar]
  51. Chi, R. Research on Enterprise Technological Innovation Efficiency and Its Influencing Factors. J. Quant. Tech. Econ. 2003, 6, 105–108. [Google Scholar]
  52. Liang, L.; Ma, R.; Tian, Y. Science and Technology Funding Investment Structure and Enterprise Technological Innovation—An Empirical Study Based on China’s Large and Medium-sized Industrial Enterprises. Sci. Manag. Res. 2009, 27, 104–107. [Google Scholar]
  53. Bai, J.; Jiang, K.; Li, J. Convergence Analysis of China’s Regional Innovation Efficiency. Financ. Trade Econ. 2008, 119–123. [Google Scholar] [CrossRef]
  54. Bo, Q. Data Envelopment Analysis for Performance Evaluation; Wu-Nan Culture Enterprise: Taiwan, China, 2005. [Google Scholar]
  55. Fisher, R.; Yates, F. Statistical Methods for Research Workers; Genesis Publishing Pvt Ltd.: Delhi, India, 1925. [Google Scholar]
  56. Akaike, H. A New Look at the Statistical Model Identification. IEEE Trans. Autom. Control 1974, 6, 716–723. [Google Scholar] [CrossRef]
  57. Schwarz, G. Estimating the Dimension of a Model. Ann. Stat. 1978, 6, 461–464. [Google Scholar] [CrossRef]
  58. Zhao, K. Model Analysis of Industrial Design Promoting Industrial Upgrading of Changzhou Equipment Manufacturing Industry. J. Mach. Des. 2013, 30, 123–125. [Google Scholar]
  59. Zhao, K. On the Role Positioning of Industrial Design in Context of Manufacturing Industry Upgrading. Packag. Eng. 2014, 35, 130–133. [Google Scholar]
  60. Lei, J. Vigorously Develop China’s Design Industry and Comprehensively Improve China’s Design Level. Sci. Technol. Ind. China 2018, 32. [Google Scholar] [CrossRef]
Figure 1. Bar chart of pure technical efficiency of manufacturing innovation in Zhejiang Province from 2011 to 2021.
Sustainability 16 07230 g001
Figure 2. Line chart for pure technical efficiency of manufacturing industry in Zhejiang Province from 2011 to 2021.
Sustainability 16 07230 g002
Table 1. Design innovation components indicator system (preliminary screening).
Primary IndicatorSecondary IndicatorDefinition
Development
environment (GA)
Support funds (G1)
(Unit: RMB 10,000)
Financial subsidies and special funds for industries from governments at all levels in Zhejiang Province
Number of policy regulations (G2) (Qty.)Design innovation policies issued by governments at all levels
Economic environment (G3)
(Unit: RMB 10,000)
GDP per capita
Innovation atmosphere (G4) (Qty.)Number of patents per 10,000 people
Human resources (GB)Number of full-time
professionals (G5) (Qty.)
Number of full-time professionals
Percentage of personnel holding certificates (G6) (%)Percentage of designers who passed Industrial Designer Professional Qualification Examination
Percentage of personnel
with intermediate and senior
professional titles (G7) (%)
Percentage of designers with intermediate or senior professional titles
Growth rate of designers (G8) (%)Growth rate of personnel engaged in design innovation activities
Scale (GC)Design service income (G9)
(Unit: RMB 10,000)
Design service income
Number of design enterprises (G10) (Qty.)Number of design enterprises
Number of practitioners (G11) (Qty.)Number of practitioners
Number of service enterprises (G12) (Qty.)Number of service enterprises
Output (GD)Number of design output transactions
(G13) (Qty.)
Number of design service contracts signed
Conversion of industrial achievements into output value (G14) (Unit: RMB 10,000)Output value of industrialization of design results
Number of patent applications (G15) (items)Number of patents applied for this year
Number of patents granted (G16) (items)Number of patents granted this year
Number of design awards
at provincial level or above (G17) (items)
Number of design awards at provincial level or above
Design competitions held (G18) (items)Number of design competitions held
Design activities held (G19) (Qty.)Number of design activities held
Number of foreign exchanges
and cooperation (G20) (Qty.)
Number of foreign exchanges and cooperation
Table 2. Design innovation components indicator system (first adjustment).
Primary
Indicator
Secondary IndicatorDefinition
Development
environment (GA)
Number of policy regulations (G1) (Qty.)Financial subsidies and special funds for industries
from governments at all levels in Zhejiang Province
Economic environment (G2)
(Unit: RMB 10,000)
GDP per capita
Innovation atmosphere (G3) (Qty.)Number of patents per 10,000 people
Design competitions held (G4) (items)Number of design competitions at all levels held
Human
resources (GB)
Number of full-time professionals (G5) (Qty.)Number of full-time professionals
Percentage of personnel with intermediate
and senior professional titles (G6) (%)
Percentage of designers with intermediate
or senior professional titles
Growth rate of designers (G7) (%)Growth rate of personnel engaged
in design innovation activities
Scale (GC)Design service income (G8) (Unit: RMB 10,000)Design service income
Number of design enterprises (G9) (Qty.)Number of design enterprises
Number of service enterprises (G10) (Qty.)Number of service enterprises
Output (GD)Number of design output transactions (G11) (Qty.)Number of design service contracts signed
Conversion of industrial achievements
into output value (G12) (Unit: RMB 10,000)
Output value of industrialization of design output
Number of patents granted (G13) (items)Number of patents granted in the previous year
Number of design awards at provincial level
or above (G14) (items)
Number of design awards at provincial level or above
Table 3. Pearson correlation coefficient of secondary indicators subordinate to development environment (GA).
Number of Policy
Regulations (G1) (Qty.)
Economic Environment (G2) (RMB)Innovation Atmosphere (G3) (Qty.)Design Competitions Held (G4) (Items)
Number of policy
regulations (G1) (Qty.)
1−0.033−0.132−0.121
Economic environment (G2) (RMB)−0.03310.874 *0.972 **
Innovation atmosphere (G3) (Qty.)−0.1320.874 *10.930 **
Design competitions held (G4) (items)−0.1210.972 **0.930 **1
Note: *: p < 0.05, **: p < 0.01.
Table 4. Pearson correlation coefficient of secondary indicators subordinate to human resources (GB).
Number of Full-Time
Professionals (G5) (Qty.)
Percentage of Personnel
with Intermediate and Senior Professional Titles (G6) (%)
Growth Rate
of Designers (G7) (%)
Number of full-time
professionals (G5) (Qty.)
10.900 **−0.078
Percentage of personnel
with intermediate and senior professional titles (G6) (%)
0.900 **1−0.368
Growth rate of designers (G7) (%)−0.078−0.3681
Note: **: p < 0.01.
Table 5. Pearson correlation coefficient of secondary indicators subordinate to scale (GC).
Design Service Income (G8) (Unit: RMB 10,000)Number of Design
Enterprises (G9) (Qty.)
Number of Service
Enterprises (G10) (Qty.)
Design service income (G8) (Unit: RMB 10,000)10.949 **0.807 *
Number of design
enterprises (G9) (Qty.)
0.949 **10.816 *
Number of service
enterprises (G10) (Qty.)
0.807 *0.816 *1
Note: *: p < 0.05, **: p < 0.01.
Table 6. Pearson correlation coefficient of secondary indicators subordinate to output (GD).
Number of Design
Output Transactions (G11) (Qty.)
Conversion of Industrial Achievements into Output Value (G12) (Unit: RMB 10,000)Number of Patents Granted (G13) (Items)Number of Design Awards at Provincial Level or above
(G14) (Items)
Number of design output transactions (G11) (Qty.)1−0.757 *0.2420.67
Conversion of industrial achievements into output value (G12) (Unit: RMB 10,000)−0.757 *1−0.582−0.633
Number of patents
granted (G13) (items)
0.242−0.5821−0.021
Number of design awards
at provincial level or above (G14) (items)
0.67−0.633−0.0211
Note: *: p < 0.05.
Table 7. Design innovation component indicator system (first round of correlation analysis and elimination of highly correlated indicators).
Primary IndicatorSecondary IndicatorDefinition
Development
environment (GA)
Number of policy regulations (G1) (Qty.)Financial subsidies and special funds for industries from governments at all levels in Zhejiang Province
Design competitions held (G4) (items)Number of design competitions at all levels held
Human resources (GB)Number of full-time professionals (G5) (Qty.)Number of full-time designers
Growth rate of designers (G7) (%)Growth rate of personnel engaged in design innovation activities
Scale (GC)Number of design enterprises (G9) (Qty.)Number of design enterprises
Output (GD)Number of design output
transactions (G11) (Qty.)
Number of design service contracts signed
Conversion of industrial achievements into output value (G12) (Unit: RMB 10,000)Output value of industrialization of design results
Number of patents granted (G13) (items)Number of patents granted in the previous year
Number of design awards
at provincial level or above (G14) (items)
Number of design awards at provincial level or above
Table 8. Pearson correlation coefficients for secondary indicators of design innovation components (first round of correlation analysis and elimination of highly correlated indicators).
Number of Policy Regulations
(G1) (Qty.)
Design Competitions Held (G4) (Items)Number of Full-Time Professionals (G5) (Qty.)Growth Rate
of Designers (G7) (%)
Number of Design
Enterprises (G9) (Qty.)
Design Output Transactions (G11) (Qty.)Conversion of Industrial Achievements into Output Value (G12) (Unit: RMB 10,000)Number of Patents Granted (G13) (Items)Number of Design Awards at Provincial Level or above (G14) (Items)
Number of policy
regulations (G1) (Qty.)
1−0.1210.134−0.2050.021−0.2180.092−0.460.076
Design competitions held (G4) (items)−0.12110.886 **−0.2430.969 **−0.814 *0.933 **−0.438−0.607
Number of full-time
professionals (G5) (Qty.)
0.1340.886 **1−0.0780.941 **−0.815 *0.960 **−0.432−0.623
Growth rate
of designers (G7) (%)
−0.205−0.243−0.0781−0.2650.205−0.2910.5590.423
Number of design
enterprises (G9) (Qty.)
0.0210.969 **0.941 **−0.2651−0.767 *0.988 **−0.581−0.573
Number of design
output transactions (G11) (Qty.)
−0.218−0.814 *−0.815 *0.205−0.767 *1−0.757 *0.2420.67
Conversion
of industrial achievements into output value (G12)
(Unit: RMB 10,000)
0.0920.933 **0.960 **−0.2910.988 **−0.757 *1−0.582−0.633
Number of patents granted (G13) (items)−0.46−0.438−0.4320.559−0.5810.242−0.5821−0.021
Number of design awards at provincial level or above
(G14) (items)
0.076−0.607−0.6230.423−0.5730.67−0.633−0.0211
Note: *: p < 0.05, **: p < 0.01.
Table 9. Pearson correlation coefficients for secondary indicators of design innovation components (second round of correlation analysis and elimination of highly correlated indicators).
Number of Policy
Regulations
(G1) (Qty.)
Growth Rate
of Designers
(G7) (%)
Number of Design
Enterprises (G9) (Qty.)
Number of Patents Granted (G13) (Items)Number of Design Awards at Provincial Level or above (G14) (Items)
Number of policy
regulations (G1) (Qty.)
1−0.2050.021−0.460.076
Growth rate
of designers (G7) (%)
−0.2051−0.2650.5590.423
Number of design
enterprises (G9) (Qty.)
0.021−0.2651−0.581−0.573
Number of patents granted (G13) (items)−0.460.559−0.5811−0.021
Number of design awards at provincial level
or above (G14) (items)
0.0760.423−0.573−0.0211
Table 10. Design innovation component indicator system.
Primary IndicatorSecondary IndicatorDefinition
Development
environment (GA)
Number of policy regulations (G1) (Qty.)Financial subsidies and special funds for industries from governments at all levels in Zhejiang Province
Human resources (GB)Growth rate of designers (G2) (%)Growth rate of personnel engaged in design innovation activities
Scale (GC)Number of design enterprises (G3) (Qty.)Number of design enterprises
Output (GD)Number of patents granted (G4) (items)Number of patents granted in the previous year
Number of design awards
at provincial level or above (G5) (items)
Number of design awards at provincial level or above
Table 11. Manufacturing innovation evaluation indicator system.
Primary IndicatorSecondary Indicator
Innovation input (YA)Industrial R&D expenditure (Y1) (Unit: RMB 10,000)
Industrial R&D personnel investment (Y2) (person/year)
New product development expenses (Y3) (Unit: RMB 10,000)
Innovation output (YB)New product sales revenue (Y4) (Unit: RMB 10,000)
Number of patents granted (Y5) (items)
Table 12. Innovation data of industrial enterprises above designated size in Zhejiang province from 2011 to 2021.
YearIndustrial R&D
Expenditure (Y1) (Unit: RMB 10,000)
Industrial R&D
Personnel Investment (Y2) (Person/Year)
New Product
Development Expenses (Y3)
(Unit: RMB 10,000)
New Product Sales Revenue (Y4)
(Unit: RMB 10,000)
Number of Patents Granted (Y5) (Items)
20114,891,527203,9046,130,552107,987,720.49335
20125,632,975228,6186,838,103142,207,37612,844
20136,539,434263,5077,851,412157,502,317.315,036
20147,328,932290,3398,549,299174,992,037.616,824
20157,928,587316,6728,349,961204,919,010.517,242
20168,962,107321,8459,616,946214,084,546.419,280
201710,427,258333,64611,209,272231,508,850.421,817
201811,396,500394,14712,614,705252,593,555.327,998
201912,332,147451,75214,823,827270,582,619.230,914
202013,345,322480,49316,876,932377,564,365.435,319
202116,290,387482,14023,796,708411,717,093.541,292
Table 13. Tobit regression analysis of design innovation factors affecting pure technical efficiency of manufacturing innovation.
Independent VariableRegression CoefficientSDz Valuep Value95% CI
Number of policy regulations (G1) (Qty.)0.0380.0241.5690.117−0.010~0.086
Growth rate of designers (G2) (%)−0.1260.045−2.7820.005−0.215~−0.037
Number of design enterprises (G3) (Qty.)0.2160.0623.4870.0010.095~0.337
Number of patents granted (G4) (items)0.1570.0712.230.0260.019~0.296
Design awards at provincial level
or above (G5) (items)
0.1950.0553.5270.0010.087~0.304
Disclaimer/Publisher’s Note: The statements, opinions and data contained in all publications are solely those of the individual author(s) and contributor(s) and not of MDPI and/or the editor(s). MDPI and/or the editor(s) disclaim responsibility for any injury to people or property resulting from any ideas, methods, instructions or products referred to in the content.

