Article

Modeling Ecosystem Regulation Services and Performing Cost–Benefit Analysis for Climate Change Mitigation through Nature-Based Solutions Using InVEST Models

1
National Institute of Research in Rural Engineering Water and Forestry, Ariana 2080, Tunisia
2
Centre for Advanced Middle Eastern Studies, Lund University, 223 62 Lund, Sweden
*
Authors to whom correspondence should be addressed.
Sustainability 2024, 16(16), 7201; https://doi.org/10.3390/su16167201
Submission received: 8 July 2024 / Revised: 17 August 2024 / Accepted: 19 August 2024 / Published: 22 August 2024

Abstract

:
Climate change and land degradation menace ecosystem sustainability. This study assessed the effectiveness of integrating nature-based solutions (NBSs); soil and water conservation techniques, agroforestry, and reforestation, to mitigate these impacts. Focusing on carbon storage and sediment retention at the watershed level (Sidi Barrak), the InVEST model quantified changes from 1990 to 2050 under the Business as Usual (BAU) and management scenarios. The results showed a significant decrease in sediment retention and carbon storage from 19.25 to 15.5 t ha−1year−1 and from 1.72 to 1.61 t ha−1year−1, respectively, between 1990 and 2021. By 2050, BAU scenario projections demonstrate a 28% decrease in sediment retention and a 16% drop in carbon storage under Representative Concentration Pathways (RCP) 4.5. The Management scenarios indicate substantial improvements, with carbon storage increasing by 77% and sediment retention by 87% when all strategies were combined. The economic valuation, performed through the application of the cost–benefit analysis, shows positive net benefit values (NPVs) for the different NBS management scenarios. The combined management scenario, which includes soil and water conservation techniques, agroforestry, and reforestation under the same scenario, presents the highest total NPV with 11.4 M€ (2%, 2050), an average of 130 €/ha (2%, 2050), and an opportunity cost of 1.7 M€ compared to BAU. Such results may orient decision-making by providing solid arguments toward ecosystem resilience and climate change mitigation.

1. Introduction

Landscapes provide important ecosystem services for key economic sectors such as agriculture and water supply, provide livelihoods for poor inhabitants of rural areas in lagging regions, and sequester as much carbon as emitted by industry. However, landscape ecosystems have been degrading due to poor management and climate change. Particularly in Mediterranean countries, climatic variability and land degradation pose significant challenges to sustainable development. In these regions, the preservation of ecosystem services is of paramount importance [1,2]. Tunisia, a southern Mediterranean country, is significantly impacted by climate change and land degradation [3]. The annual maximum and minimum surface temperatures have increased by 2.1 °C. Climate projections for 2100 indicate that the average annual temperature will increase from 2 to 3 °C and that the average annual precipitation will decrease by 20% [3]. Tunisia currently is one of 33 countries that suffer from severe water stress [4]. The effects of climate change will have severe effects on the country [5].
The first areas to be affected are forests, with an increase in severe fires, then comes agriculture, livestock production, and drinking water [5,6]. Ultimately, it is the populations who will be most impacted.
In addition, climate change threatens soil sustainability. It is modifying the frequency, intensity, geographic distribution, and duration of rainfall and soil erosion process. This is likely to accelerate soil losses and increase the occurrence of muddy water flows and reservoir sedimentation [7]. Soil stores carbon primarily in the form of organic matter, which is beneficial for the fertility of agricultural and forestry soils. Additionally, the sequestration of carbon contributes to the reduction of the CO2 concentration in the atmosphere [8]. On the other side, forests capture emitted carbon. They constitute the main terrestrial reservoir of carbon [9]. In addition, this ecosystem is an important anthropogenic pillar for human well-being, providing a multitude of ecosystem services (ESs), especially in Mediterranean countries, which makes preservation even more crucial [10]. Forest planning tools accurately account for the investments required to maintain forests, but not for the benefits, because they mainly include direct use ESs and not the indirect uses. In any case, valuation of ESs is a useful tool to highlight the benefits of forest ecosystems and the need to maintain them. In addition to provisioning services (wood, cork, grazing, etc.) that are usually direct use products, forests also provide regulating services (carbon sequestration and sediment retention), which are indirect use services that are critical to integrate into decision-making processes aiming at more relevant and sustainable management [11]. Nonetheless, the status of change in forest resources is affected by a set of human activities and ecological conditions [12,13]. Forest growth, natural disturbances, and management actions are among the factors that influence the amounts of forest biomass and stored carbon in landscapes and their changes over time [14].
The integration of ecosystem services projections into decisions relies on access to good scientific information showing where ecosystem services are provided and how they will be affected by alternative plans and policies. Ecosystem service modeling can help local, regional, and national decision-makers incorporate ecosystem services into a range of policy and planning contexts. Model outputs can inform spatial planning by assessing the current and potential status of ecosystem services under alternative, spatially explicit future scenarios and by assessing the impacts of proposed activities and providing guidance for where mitigation activities will provide the greatest ecosystem service benefits. Many studies have mapped and analyzed ecosystem services [15,16,17,18]. Despite its widespread use in the scientific community, there are few studies in in the southern Mediterranean context focusing on mapping ecosystem services.
The first goal of this research was to model and map ecosystem regulation services, namely sediment retention and carbon storage, and evaluate the effectiveness of NBSs in maintaining soil and mitigating climate change using InVEST models. The second objective was to perform cost–benefit analyses. The incorporation of these models and analyses is of great value for better understanding and improving ecosystem services. The significance of this research lies in its potential to predict how different management scenario affect LULC changes. This, in turn, may lead to offer actionable insights for policymakers and stakeholders and more effective conservation strategies and improved resource management under climate change and human activities in the southern Mediterranean regions’ context.

2. Materials and Methods

2.1. Case Study Area

The total area of the Sidi El Barrak watershed is about 896 km2, with water from the outlet of the basin collected in the Sidi El Barrak reservoir situated on the extreme northwestern coast of Tunisia (Figure 1). The watershed lies between 4,070,000 to 4,105,000 m north and 480,000 to 525,000 m east in the UTM coordinate system. The site of the dam is located 6.5 km from the Mediterranean Sea, 15 km from the Nefza region, and 20 km northeast of Tabarka City. The reservoir level is 29 m, with a total capacity of about 275 million cubic meters, providing irrigation water for fertile lands that extend over an area of 4000 ha [19].
The hydrographic network is dense formed by the confluence of three major rivers: Melah, Madene, and the Bellif–Bouzenna Rivers. The population in the Sidi El Barrak watershed has been estimated to be 119,026 inhabitants [20], representing 10% of the population of the northwestern Tunisia, with a density of 70 inhabitants per km2. The main economic activities in the Sidi El Barrak watershed are education, health, and administrative services, representing 29% of the active population, followed by construction and public works and agriculture, with 18% and 16% of the active population, respectively. Agriculture relies on mixed, traditional (gravity-fed), and modern irrigation (sprinkler and drip), depending on the type of crop. Cereals and vegetable crops are the main activities in the irrigated areas [10].
The Sidi el Barrak Dam is one of the most important dams and reservoirs in Tunisia for its use for irrigation and supply of potable water. The site is adjacent to the Mediterranean coast in the northwest. The selection of the Sidi Barak watershed was based on several criteria. First, this region showcases a diverse range of LULC, such as forests, agricultural lands, and water bodies, making it a significant representation of Tunisian and Mediterranean diversity. Second, working at watershed level permits for testing and validating models under diverse conditions. Finaly, there is the presence of sufficient high-quality climatic and ecologic data available for this region, which is crucial for the modeling.

2.2. Operational Framework

Figure 2 presents an operational framework for estimating the impact of land use and land cover (LULC) changes and climate change on ecosystem services, as well as evaluating the capacity of nature-based solutions (NBSs) to address climate change impacts. First, LULC changes from 1990 to 2021 were analyzed using ArcGIS. The InVEST models were then employed to estimate sediment retention and carbon storage under current LULC and climate conditions using historical data, and under future scenarios considering climate scenario RC 4.5 and proposed NBSs aimed at enhancing these two ecosystem services.

2.3. Data Collection

Climate data spanning from 1990 to 2021 were collected from the National Institute of Meteorology of Tunisia (INM), encompassing monthly precipitation records. For the year 1990, a land use land cover (LULC) map with 30 m resolution was collected from the Department of National Forestry (DGF). We obtained digital elevation model (DEM) data from the U.S. Geological Survey. The soil type and pedology data were gathered from the General Directorate for Agricultural and Regional Development (DGACTA).
The InVEST SDR model requires average values of climate data. Consequently, we considered the average values for the period 1990–2021 for representing 2021 as the base year. In addition, for the horizon of 2050, average climate values for the period 2045–2050 were represented as the average climate values in 2050.
For the horizon of 2050, we choose future climate scenario RCP 4.5, widely used to evaluate the impact of climate change, for the period 2045–2050. The data related to this scenario were collected from the Climat-c portal (https://climat-c.tn/INM/web/, (accessed on 15 March 2024) of the Tunisian National Meteorological Institute (INM).

2.4. Land Use Land Cover Mapping

United States Geological Survey (USGS) archived Landsat images from 2021 with a 30 m spatial resolution were used for the classification. These images have already been quality checked and corrected. The characteristics of the Landsat images used in this research are shown in Table 1.
The downloaded images were selected using a cloud cover threshold under 10%. To reduce confusion between cropland and vegetation, the images were obtained during a dry month, August [21]. For training and accuracy evaluation purposes, during Landsat image classification, ground-truth data from Google Earth and field surveys were gathered.
The LULC in the Sidi Barrak watershed was classified into eight categories: Arboriculture, deciduous forest, coniferous forest, mixed forest, field crop, shrubland, bare soil, and surface water. To predict the future LULC map, we used the Land Change Modeler (LCM) which is fully integrated into the TerrSet (version 2020) software [22]. The LCM simplifies the complexities of change analysis. It analyzes land cover change, empirically models relationships to explanatory variables, and simulates future land change scenarios. TerrSet software involves an approach that combines Geographic Information System (GIS) techniques with predictive modeling algorithms. It indicates how the factors affect future LULC change and how much land cover change happens between earlier and later LULC, and then determines a relative number of transitions. The LCM uses the change analysist, the transition potentials, and the change prediction tabs. It requires various GIS data layers informing about the LULC, DEM, slope, and distance from roads and rivers. Second, distance-based analysis was used to evaluate the proximity of different areas to roads and rivers, considering their influence on land use dynamics. Then, machine learning algorithms were applied to develop predictive models based on historical patterns of LULC change and the identified factors. Produced maps were calibrated and validated using historical LULC maps to ensure their accuracy.

2.5. Modeling Carbon Storage and Sediment Retention Ecosystem Services

The InVEST https://naturalcapitalproject.stanford.edu/ (accessed on 3 December 2023) models are a suite of software developed by the Natural Capital Project, a collaboration between Stanford University, University of Minnesota, the Nature Conservancy, and the World Wildlife Fund [23]. This model was developed to quantify and map multiple ecosystem services and to provide explicit spatial information for land use management at the watershed scale. The advantages of this model are its spatial visualization, broad applicability, and ability to reflect the ecological processes and impacts of climate and LULC change and management options. Two of the models within InVEST, which are the carbon storage and sediment retention models, were used in the present study.

2.5.1. Carbon Storage

The InVEST Carbon Storage and Sequestration model employs a spatially explicit approach that integrates data on land cover, vegetation types, and carbon pools to determine the spatial distribution of carbon stock [24]. The model aggregates the biophysical amount of carbon stored in four carbon pools (aboveground living biomass, belowground living biomass, soil, and dead organic matter) based on LULC maps [25]. It then estimates the carbon storage and carbon sequestration in actual and future situations.
Carbon storage on a parcel of land largely depends on the size of the four carbon pools. Aboveground biomass includes all living plant material above the ground (e.g., bark, stems, branches, and leaves). Belowground biomass encompasses the living root systems of aboveground biomass. Soil organic matter is the organic component of soil and represents the largest terrestrial carbon pool. Dead organic matter includes litter as well as lying and standing dead wood. Data on the four carbon pools in the study were gathered from an analysis of existing literature (Table 2), based on research carried out in Tunisia, the Mediterranean region, and beyond [26,27,28,29,30,31,32]. Carbon stocks in water bodies were assumed to be negligible and therefore assigned a value of 0. Additionally, the carbon stock in each carbon pool was supposed to persist as a constant during the past and the future scenario periods.

2.5.2. Sediment Retention

The sediment retention ecosystem service refers to the ability of the landscape to retain sediment that would otherwise flow into rivers and streams and eventually settle in reservoirs [33]. This service is crucial for avoiding reservoir sedimentation and reductions of reservoir lifespan. The Sediment Delivery Ratio (SDR) model of InVEST was developed to map soil erosion and quantify sediment retention at the watershed level. This model has been widely applied in many countries and regions worldwide [34,35,36]. The SDR is based on the Revised Universal Soil Loss Equation (RUSLE) used to estimate soil loss. It includes climate, soil, topographic, and LULC data. The model converts the estimated soil loss into sediment export that represents the amount of sediment reached the stream. Sediment retention is defined as the contribution of LULC to trapping soil loss from entering a stream. The RUSLE equation is given by [37], as follows:
RUSLE = R·K·LS·C·P
where R, K, LS, C, and P are the rainfall erosivity, erodibility, topography, cover management, and support practice factors, respectively. The sediment load E(t·ha−1 year−1) is given by the following:
E = RUSLE·SDR
The sediment delivery ratio is then directly derived from the conductivity index IC using a sigmoid function [38]. The amount of sediment retention on each pixel is given by the following:
Sediment Retention = RKLS − RUSLE
The model requires the DEM of the catchment area, LULC, soil erosivity (R factor), soil erodibility (K factor) raster datasets, the sub-watershed boundaries, and a biophysical table that contains characteristics of the watersheds. The LULC map was used as a tool in the allocation of C and P factors for each class. Crop management factor was assigned to each class by using available C factor values. The P factor relies on the type of conservation measures implemented in slope classes. In the present study area, land areas with no conservation measures are attributed a P factor value of 1 (Table 3).
The K factor represents soil erodibility. It is a function of the percentage of silt, sand structure, permeability of soil, and the percentage of organic matter. This factor depends on soil types. The K factor layer was derived from the map of soil types obtained from DG/ACTA (Direction Générale des Aménagements et de Conservation des Terres Agricoles). We assigned a factor K for each soil type, following [39]. We used the formula of [40], specifically selected for its suitability within the Tunisian context, to estimate rainfall erosivity:
R = 0.142 P1.356
where R represents rainfall erosivity (MJ mm ha1 h1 yr1) and P is annual rainfall (mm year1). It was estimated for two different time periods in the past, present, and future. The average value of actual and past situation was calculated for the period 2010–2020. For the future climate projection, an average value for the R factor was selected for the period 2040–2050 following the RCP 4.5 climate change scenario.
To calibrate the SDR model, we compared the total amount of sediment generated by the entire catchment calculated by the model with observed sedimentation in the Sidi El Barrak watershed. We used the observed sedimentation data obtained from bathymetry surveys available in the DGBTH (Direction Générale des Barrages et des Grands Travaux Hydrauliques).

2.6. Scenario Development

Two scenarios were designed in this study, the Business as Usual scenario and the management scenario, according to the below.

2.6.1. Business as Usual Scenario (BAU)

The BAU scenario is a reference case following past and recent socio-economic trends. The projection will demonstrate how the LULC will change in the future if current trends, policies, and practices continue without significant changes [41]. This scenario assumes the influences of climate change (RCP 4.5) by the horizon of 2050 (2021–2050) using future erosivity.

2.6.2. Management Scenario (MS)

In this scenario, we retained the rainfall erosivity and future LULC map of the BAU scenario while adding management techniques. We considered the implementation of three types of NBSs (nature-based solutions); namely, soil and water conservation (SWC) techniques, forest plantation, and agroforestry. Figure 3 and Table 4 show the localization and areas of these interventions.

Forest Plantation

Reforestation initiatives to plant native trees includes the environmentally beneficial cork oak, the coniferous maritime pine and stone pine, and the restoration of degraded landscapes. Specifically, we focused on transforming bare land areas that are vulnerable to increased degradation from the combined impacts of climate change and erosion. To design management interventions, we targeted regions where carbon sequestration predictions indicate a negative trajectory in the future under the BAU scenario. The objective of this approach is to ensure a sustainable response to climate change and land degradation.

Agroforestry

Agroforestry is a method of exploiting agricultural land, combining trees and crops or livestock, to obtain products or services useful to humans. These practices and systems can provide multiple advantages, such as maintaining soil retention, enhanced carbon sequestration in both trees and soil, and increased biodiversity. In the Sidi Barrak watershed, agroforestry can offer several benefits, such as increased agricultural productivity, improved soil fertility, and biodiversity conservation. Here, we select carob tree species that are well-adapted to the soil conditions and climate resistant in the northern regions of Tunisia.

Soil and Water Conservation Techniques (SWC)

Soil and Water Conservation (SWC) techniques include all techniques and practices that focus on the sustainable use and maintenance of soils that are used as a natural resource in agriculture, forestry, and livestock production. Among the different techniques and practices that allow good land management, and which help to reverse the degradation of soils as a natural resource, we find erosion control measures, such as cover contour ridges and basins (water harvesting technique). The soil erosion map generated by the SDR model was useful to identify areas at high risk of erosion, where we targeted potential interventions. Contour ridges with olive tree consolidation were implemented in cereal field areas with a high risk of erosion. This dual-purpose intervention addresses erosion concerns and enhances agriculture production. For arboriculture zones facing elevated erosion risks, we involved the implementation of micro-basins as a water harvesting technique.

2.7. Economic Valuation Methodology

2.7.1. Ecosystem Services

For carbon sequestration, the economic valuation was processed through the application of the 2020 voluntary market price to the annual average carbon flux. Regarding sediment retention, the valuation was carried out applying the economic price of water, at 0.274 €/m3, resulting from the application of the demand function model [10].

2.7.2. Management Scenarios

The cost–benefit analysis (CBA) applies the net present value (NPV) to verify the efficiency of a new project in terms of resource allocation, checking whether the sum of discounted gains is higher than the sum of discounted losses, considering the time period of the project:
NPV = ∑Bt(1 + i) − t − ∑Ct[(1 + i) − t]
Benefits cumulate gains from both considered regulation services, sediment retention and carbon sequestration, provided under a BAU scenario with each of the mentioned above intervention scenarios. Expenses related to the intervention costs are detailed in Table 5. These costs were meticulously compiled through consultations with subject matter expects in the field. Specifically, the data were obtained from discussions with professionals affiliated with the National Research Institute of Rural Engineering, Water, and Forests (INRGREF) in Tunisia. The experts provided insights based on recent studies and project reports relevant to the Sidi Barrak watershed and management interventions. The costs encompass various categories, including installation, plantation, and maintenance, which are crucial for implementing the planned interventions. Each expense was cross-verified with current market prices and adjusted for regional economic conditions to ensure accuracy.

2.7.3. Sensitivity Analysis

The net present value was estimated for the intervention options at the 2050 horizon to determine the impact of the option and whether it will lead to a profitable result or to an economic loss. During the last decade, an intense debate has been taking place about the determination of an appropriate discount rate. An extreme attempt was made by [42], applying a discount rate of 0.001% to estimate the optimal global response to climate change. The argument used by Stern, because “the welfare of future generations should not be discounted at all”, encouraged several studies to decrease the discount rate between 0–4% for environmental CBA [42,43,44]. In the present study, different discount rates were applied between 2 and 10. The choice was made to be in line with the previously described literature (for discount rates between 0 and 4%), the World Bank recommendations (for discount rate of 6%), and the public forestry investment recommendations in Tunisia (for a discount rate of 10%).

3. Results and Discussion

3.1. Land Use Land Cover Change

Figure 4 and Table 6 represents simulation outcomes of LULC changes during the period 1990–2050. Results show that there was significant change of the Sidi Barrak landscape composition. Between 1990 and 2021, cultivation of field crops increases by 5.55%. Arboriculture shows a dramatical increase of more than 100%. Nevertheless, coniferous forests decrease by 17.46%. Mixed forests showed a similar decrease of 17.11%. Deciduous forests also declined by 14.72%. However, scrubland decreased by 22.47%.
Notable transformations have occurred during the period 1990–2021, arising from the social and economic shifts that ensued after the Tunisian revolution of 2011 [7]. In almost the same area, [45] reported that over the 1952–2017 period, the croplands and buildings increased by 6% and 3%, respectively. In contrast, shrubland and bare soil decreased by 13% and 2%, respectively, during the same period.
By 2050, following these past trends, field crops and arboriculture will continue to increase by 2.29% and 46.34%, respectively, compared with the base year 2021. However, the areas of coniferous, deciduous, and mixed forests will shrink by 16.31%, 10.14%, and 23.69%. These areas will be replaced by cultivated lands. These changes will mostly occur in the flat lands.

3.2. Ecosystem Services

3.2.1. Sediment Retention

Currently, in Sidi El Barrak, the rainfall erosivity stands at 820 MJ mm ha1 h1 yr1. Concurrently, the average soil loss in the current situation is 13.08 t ha1. Under the BAU scenario, which considers both climate change and future land cover alterations, rainfall erosivity will decrease to 798 MJ mm ha1 h1 yr1 and soil loss will escalate to 17.89 t ha1 in the 2050 horizon.
The InVEST model was a useful tool to map the spatial distribution of soil loss within the Sidi Barrak watershed. Figure 5 shows areas of high erosion risk. These areas are mainly located in the southeastern region where combination steep slopes and extensive cultivation occur. Additionally, the inherent erosivity of the soil in these areas amplifies the risk. These high-risk regions are suitable to implement conservation strategies aimed at reducing erosion and maintaining the integrity of this watershed ecosystem.
The evaluation of sediment retention as a regulating ecosystem service, utilizing the InVEST model, revealed a concerning trend over time. Between previous assessments, there has been a notable decline in sediment retention capacity, dropping from an estimated 19.3 to 15.5 t ha1year1 (Table 7).
SDR modeling results demonstrate that the mean soil retention capacity for agricultural land is about 10.33 t ha1 in the actual situation year 2021. Forest areas present a high sediment retention ecosystem service with a value of 18.85 t ha1. These findings point out the crucial role of forests in avoiding sediment delivery into water reservoirs, whereas the alteration of these natural vegetations led to the decline of the ecosystem’s ability to capture and retain sediments, which affects the storage capacity of downstream reservoirs.

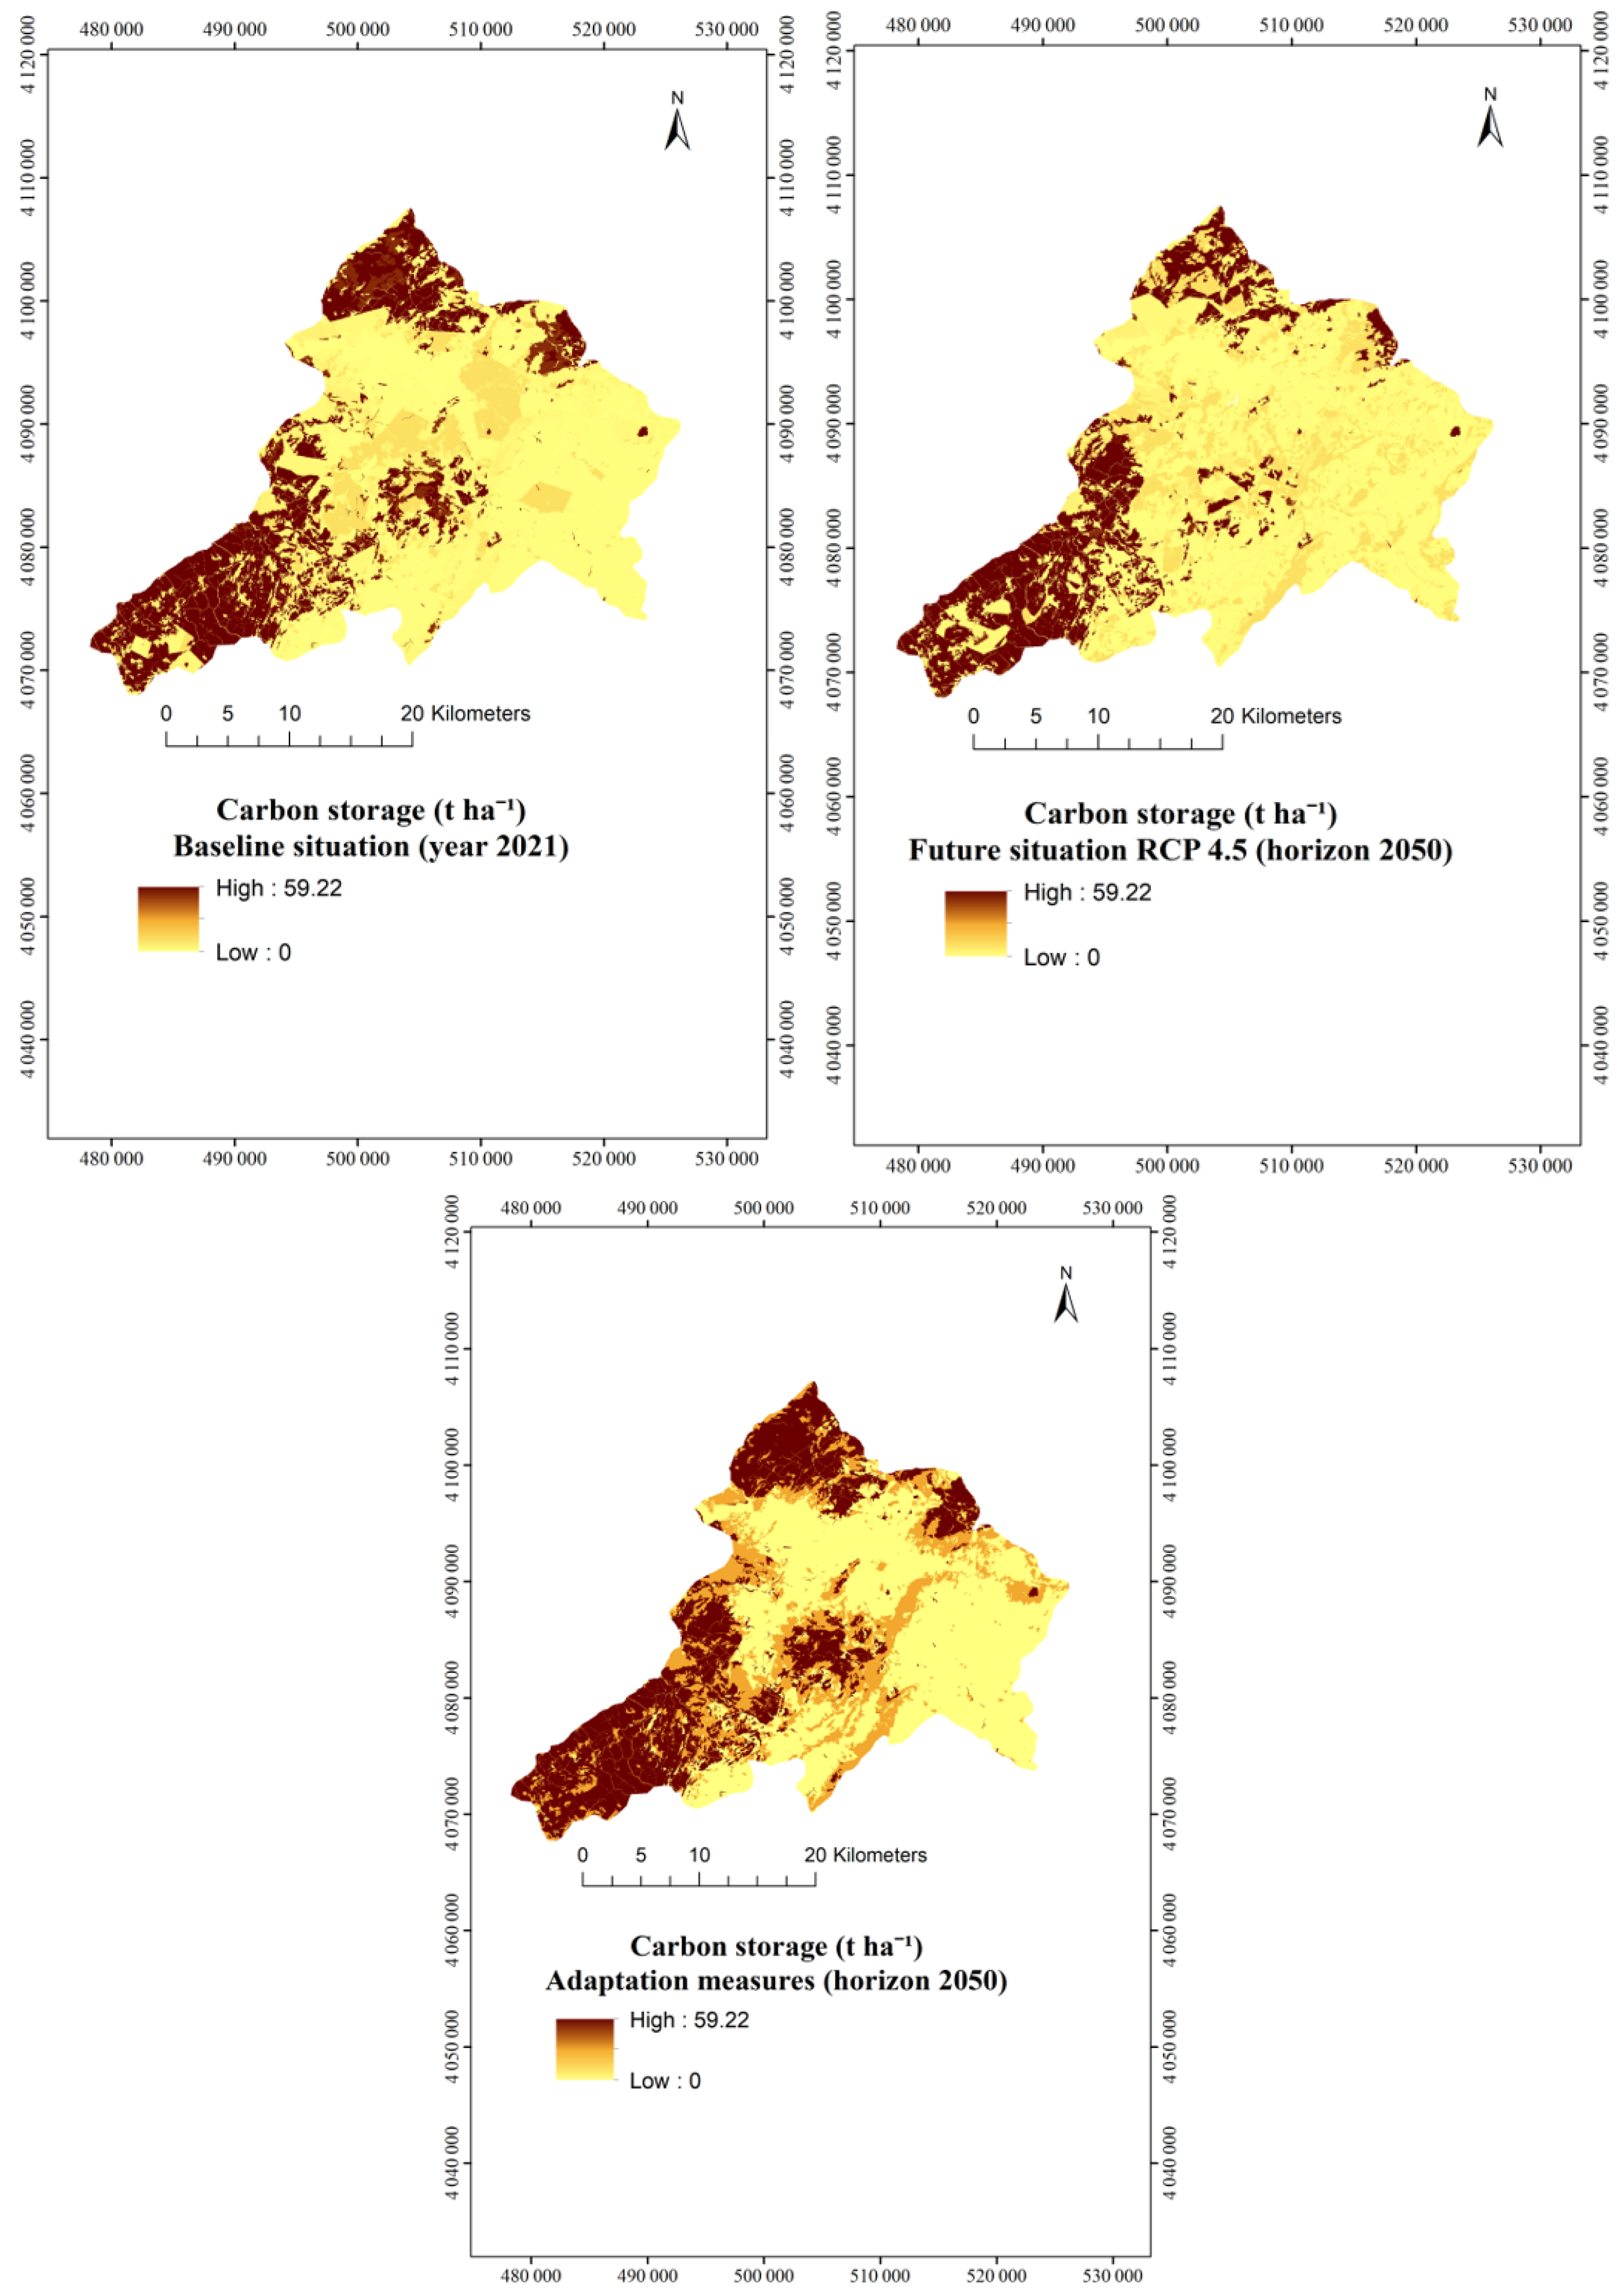
3.2.2. Carbon Storage

The simulation results of carbon storage in the Sidi Barrak watershed decreased during the period of the study. Carbon storage decreased from 1.72 to 1.61 t ha1 between 1990 and 2021. These losses are mainly related to the higher rate of transition from natural to cultivated land use in this case study (Figure 6). Losses mainly occurred in degraded forests and shrubland areas.

3.3. Impact of Future Change Scenarios on Biophysical Services

3.3.1. Impact of the BAU Scenario

The use of the InVEST tool proved instrumental in analyzing the repercussions of climate and LULC change on the sediment retention and carbon storage ecosystem services [46]. The results of this study shed light on an unsettling projection: the expected decline in sediment retention (Table 6). According to the results, this crucial ecosystem service is poised to decrease.
In the BAU scenario, which includes the combined effects of climate change and land cover changes in line with existing trends, it is projected that sediment retention will decrease by approximately 28%. The carbon storage capacity will decline by 16%. These changes in carbon stocks will mainly occur in the south-western and northeastern parts of the watershed (Figure 6).

3.3.2. Impact of Management Scenarios

Based on the Carbon Storage and Sequestration model and under the BAU scenario which combines climate change challenges and land cover patterns, the integration of nature-based adaptation practices led to a remarkable improvement. The implementation of agroforestry practices within crop fields increased carbon storage by 13.33% and sediment retention by 21.52%. For soil and water conservation techniques, contour ridges and basins showed a low increase in carbon of 5% and an important increase in sediment retention of 32%. Forest plantation led to an increase in carbon storage and sediment retention of 34.8% and 28.13% respectively. Nevertheless, the combination of all NBS practices results in a substantial increase in carbon storage and in sediment retention of 77% and 86% respectively. This underlines the synergistic benefits of NBSs in enhancing ecosystem services’ resilience against soil erosion and reservoir sedimentation. This means there is potential for substantial carbon sequestration gains and preserving soil capital, giving hope for successful climate adaptation and mitigation in a changing world.

3.4. Economic Valuation

3.4.1. Ecosystem Services Valuation and Actual Situation

The regulation services prices were calculated as follows. For carbon sequestration, the economic valuation was processed through the application of the 2021 voluntary market price at 1.1 €/Mg C to the annual average carbon flux estimated with the Invest Model. Regarding sediment retention, the valuation was carried out applying the economic price of water, based on the Tunisian national water distribution utility data and water price elasticity [10], assuming the market inflation between 2016 and 2021. Considering potable water as the main use of the water from the watershed, the sediment retention service was valued by applying water’s economic price of 0.367 €/m3, resulting from the application of the demand function model. The total net benefits obtained for 2021 from the valuation of both carbon and sediment retention were estimated to be 0.48 M€/year for the total area covered by the Sidi El Barrak Watershed.

3.4.2. Economic Impact of BAU Scenario

As already shown in the biophysical valuation paragraph, the economic valuation follows, showing a negative impact of the climate changes on the watershed level considering both regulation services at the different land cover types. The results show a total net benefit of 9.7 M€ for a total period of 30 years when applying a 2% discount rate. The obtained results give an equivalent value of 0.32 M€/year with a 2% discount rate in 2050. A notable decrease in the total value based only on regulation services with 32% in the annual net benefits was noticed.

3.4.3. Economic Impact of Management Scenario

The application of the NPV at 2% for 2050 for the three types of management scenarios, besides the combined intervention, shows that all scenarios provide positive NPV, higher than the BAU net benefits. As shown in Table 8, the combined intervention, which integrates the three types of nature-based solution scenarios, soil and water conservation, agroforestry, and reforestation, shows the highest NPV (2%, 2050) of 11.4 M€ compared to soil and water conservation (10.04 M€), followed by afforestation (10 M€) and agroforestry (9.9 M€). Looking into the net benefits, we can notice that afforestation provides higher values than agroforestry and soil and water conservation; however, the intervention costs differ significantly depending on the scenario.
Figure 7 shows the annual NPV of 130 €/yr with a 2% discount rate and for 2050 for the combined interventions, followed by soil and water conservation with 114 €/ha, reforestation with 113.8 €/ha, and agroforestry with 113 €/ha. The same figure also shows the BAU with 111 €/ha.
Figure 8 presents the opportunity cost, which is the difference between the NPV of the scenarios and the NPV of the Business as Usual (BAU) situation. As shown in the figure, all scenarios have positive differences, with the highest value for the combined intervention being 1.7 M€ for the 30-year time period, followed by soil and water intervention with 0.27 M€, reforestation with 0.23 M€, and agroforestry with 0.19 M€.

3.4.4. Sensitivity Analysis

A comparison between conservation scenarios (NPV) applying different discount rate ranging from 2 to 10% over the 30-year period shows that all scenarios give a positive NPV when applying different levels of discount rates (Table 9).

3.5. Discussion

The Sidi Barrak watershed provides a valuable case study for assessing the impacts of climate change and the effectiveness of nature-based solutions (NBSs) on ecosystem regulation services. The region has experienced significant changes in land use and land cover (LULC), including a reduction in forests and natural areas, and an increase in agricultural and urban surfaces. A similar trend of increasing permanent crops and built-up areas and decreasing pastures was observed in the nearby Oued Beja watershed between 1985 and 2016 [47]. Over the period from 1952 to 2017, cropland and built-up areas in the same area increased by 6% and 3%, respectively, while shrubland and bare soil areas decreased by 13% and 2%, respectively [45]. These changes are attributed to the increased frequency and intensity of droughts, as indicated by the Standardized Precipitation–Evapotranspiration Index (SPEI), which has significantly correlated with decreased vegetation activity and growth on the 12- and 24-month time scales [45].
The lack of alternative management practices involving local communities has accelerated the degradation of natural forests, particularly oak trees [48]. In addition, Sirocco episodes, characterized by high temperatures and large fires, have become a major climate event in Tunisia [49]. Historical data reveals that forest fires affected about 1000 hectares per year between 1996 and 2010, increasing to approximately 3167 hectares per year from 2011 to 2014 [50]. The increase in forest fires is partly due to the socio-economic turmoil following the revolution of January 2011, which led to a temporary loss of state authority [51].
Previous studies underscore the critical role of vegetation and land management practices in controlling soil erosion and sediment yield in watersheds. Ref. [52] demonstrated that forest area extension enhances sediment retention and carbon storage, demonstrating the environmental benefits of expanding forest cover. Similarly, ref. [53] highlighted that existing vegetative cover and effective management practices in watersheds significantly contribute to sediment retention. Ref. [54] also emphasized the protective function of agroforestry in preventing soil erosion. Their study suggested that increasing the area dedicated to agroforestry can be a vital strategy for soil conservation. Moreover, human activities have been shown to influence erosion and sediment yield adversely. Ref. [55] studied the Chemoga watershed and found that vegetation loss in upstream areas leads to soil erosion, which subsequently degrades agricultural land and causes sedimentation. These findings collectively highlight the importance of maintaining and managing vegetative cover to mitigate erosion and its associated negative impacts on the environment.
Previous studies highlighted to the role of assessing spatial LULC analysis in efficient conservation strategies [56,57]. Incorporating NBSs into landscape planning can enhance benefits from ecosystem services and make the environment more sustainable. In spite of significant progress in the field of landscape management with scientific research, ecosystem services and NBSs have not been incorporated into decision-making [58,59]. This can be explicated by the transdisciplinary approaches to handle landscape management issues and the necessity to integrate research and policy development. In this context, ecosystem service models that provide spatially explicit information are acquiring attention to assess the relationship among LULC and climate change, ecosystem services, and conservation strategies [60]. In the present study, the effectiveness to deliver regulation of ecosystem services, namely sediment retention and carbon sequestration, has been assessed by InVEST models. This tool serves to decrease the gap between science and decision-making by enabling understanding the value of nature solutions. In addition, the flexibility and open-source format facilitate their appropriation by decision-makers. This might be relevant nowadays, where the role of NBSs is acknowledged at different levels and boosted to be applied at large scales.
The InVEST modeling tool is widely utilized to map the spatial dynamics of ecosystem services. However, it has limitations that must be acknowledged for further research and tool improvement, as detailed by the developers and other studies [34,61].
Economic valuation reveals two key points: the importance of indirect use values provided by ecosystems at a watershed level and the significant total value of regulation services, such as carbon sequestration and sediment retention, estimated at 0.48 million euros in 2021 [10]. Despite the substantial costs associated with potential interventions, conservation scenarios demonstrate a considerable annual net present value (NPV) varying between 0.33 and 0.38 million euros per year, remaining positive even under sensitivity analysis. This indicates the capacity of NBSs to yield returns surpassing opportunity costs. The lowest annual NPV, offered by agroforestry interventions, at 0.33 million euros per year, still exceeds the Business as Usual (BAU) value of 0.32 million euros per year, considering only indirect use values, although it falls short of the current situation. This highlights the beneficial outcomes of NBSs in mitigating climate change impacts and suggests opportunities for further improvements to build resilience.
In alignment with Tunisia’s Sustainable Development Strategy 2015–2024, which prioritizes sustainable governance and community engagement, it is essential to involve stakeholders in discussing the findings of this study to achieve more accurate and actionable results.

4. Conclusions

The results of this study highlight important opportunities to improve sediment retention and carbon storage and integrate nature-scale adaptation measures. Combining soil and water management, agricultural regeneration, and forestry efforts could significantly improve ecosystem stability and resilience. The combined effects of these management strategies significantly increased carbon storage by 77% and sediment retention by 86%, exceeding the results achieved by any individual measure. These results highlight the importance of an integrated approach to addressing the complex challenges of climate change and land degradation. In addition to the potential improvements that can be achieved through environmental solutions, economic evaluations have highlighted the importance of the costs associated with these measures and this should be taken into account. The success of these nature-based solutions provides valuable information for policymakers, practitioners, and local communities to develop and implement effective climate change mitigation and adaptation strategies. Looking to the future, integrating conservation approaches into national and regional development planners will be essential to foster a more sustainable future in regions such as the Mediterranean and semi-arid regions.

Author Contributions

Conceptualization, S.J.; Methodology, S.B. and M.K.; Software, S.B.; Formal analysis, S.B., B.S. and M.K.; Data curation, S.B., B.S. and M.K.; Writing—original draft, B.S.; Writing—review & editing, S.B. and M.K.; Supervision, S.J., A.K. and R.B.; Funding acquisition, R.B. All authors have read and agreed to the published version of the manuscript.

Funding

This research was funded by the European Union Horizon 2020 program Faster project, grant agreement N° 810812, FFEM and the MECW-research program and the Centre for Advanced Middle Eastern Studies (CMES), Lund University and the PACTE program implemented by DG/ACTA and funded by AFD.

Institutional Review Board Statement

Not applicable.

Informed Consent Statement

Not applicable.

Data Availability Statement

Data are contained within the article.

Conflicts of Interest

The authors declare no conflict of interest.

References

  1. Eekhout, J.P.C.; Boix-Fayos, C.; Pérez-Cutillas, P.; de Vente, J. The Impact of Reservoir Construction and Changes in Land Use and Climate on Ecosystem Services in a Large Mediterranean Catchment. J. Hydrol. 2020, 590, 125208. [Google Scholar] [CrossRef]
  2. MEA (Millennium Ecosystem Assessment). Ecosystems and Human Wellbeing: Synthesis; Island Press: Washington, DC, USA, 2005; p. 137. [Google Scholar]
  3. MARRH (Ministère de l’Agriculture, des Ressources hydrauliques et de la Pêche). Phase 5 Report of the Water 2050 Study; MARRH: Tunis, Tunisia, 2022. [Google Scholar]
  4. McGuire, S. FAO, IFAD, and WFP. The State of Food Insecurity in the World 2015: Meeting the 2015 International Hunger Targets: Taking Stock of Uneven Progress. Rome: FAO, 2015. Adv. Nutr. 2015, 6, 623–624. [Google Scholar] [CrossRef] [PubMed]
  5. World Bank Group. Tunisia Country Climate and Development Report; CCDR Series; World Bank: Washington, DC, USA, 2023; Available online: http://hdl.handle.net/10986/40658 (accessed on 17 March 2024).
  6. Khemiri, K.; Jebari, S.; Berndtsson, R.; Maalel, K. Is Climate or Direct Human Influence Responsible for Discharge Decrease in the Tunisian Merguellil Basin? Water 2021, 13, 2748. [Google Scholar] [CrossRef]
  7. Bouguerra, S.; Jebari, S.; Tarhouni, J. Spatiotemporal Analysis of Landscape Patterns and Its Effect on Soil Loss in the Rmel River Basin, Tunisia. Soil Water Res. 2021, 16, 39–49. [Google Scholar] [CrossRef]
  8. Bisaro, A.; Meyer, K. Integrating Nature-Based Solutions into Policies for Climate Change Adaptation and Disaster Risk Reduction; IUCN: Gland, Switzerland, 2022. [Google Scholar]
  9. Mo, L.; Zohner, C.M.; Reich, P.B.; Bastin, J.-F.; Crowther, T.W. Integrated global assessment of the natural forest carbon potential. Nature 2023, 624, 92–101. [Google Scholar] [CrossRef]
  10. Khalfaoui, M.; Daly-Hassen, H.; Stiti, B.; Jebari, S. Toward Decision-Making Support: Valuation and Mapping of New Management Scenario for Tunisian Cork Oak Forests. Forests 2020, 11, 197. [Google Scholar] [CrossRef]
  11. FAO (Food and Agriculture Organization of the United Nations). State of the World’s Forests; FAO: Rome, Italy, 2022; ISBN 978-92-5-1072929. [Google Scholar]
  12. Pugh, T.A.M.; Arneth, A.; Kautz, M.; Poulter, B.; Smith, B. Important Role of Forest Disturbances in the Global Biomass Turnover and Carbon Sinks. Nat. Geosci. 2019, 12, 730–735. [Google Scholar] [CrossRef]
  13. Bouguerra, S.; Jebari, S.; Tarhouni, J. An Analysis of Sediment Production and Control in Rmel River Basin Using InVEST Sediment Retention Model. J. New Sci. 2019, 66, 4. [Google Scholar]
  14. Pechanec, V.; Purkyt, J.; Benc, A.; Nwaogu, C.; Štěrbová, L.; Cudlín, P. Modelling of the Carbon Sequestration and Its Prediction under Climate Change. Ecol. Inform. 2018, 47, 50–54. [Google Scholar] [CrossRef]
  15. Benra, F.; De Frutos, A.; Gaglio, M.; Álvarez-Garretón, C.; Felipe-Lucia, M.; Bonn, A. Mapping water ecosystem services: Evaluating InVEST model predictions in data scarce regions. Environ. Model. Softw. 2021, 138, 104982. [Google Scholar] [CrossRef]
  16. Wang, R.; Zhao, J.; Chen, G.; Lin, Y.; Yang, A.; Cheng, J. Coupling PLUS–InVEST Model for Ecosystem Service Research in Yunnan Province, China. Sustainability 2023, 15, 271. [Google Scholar] [CrossRef]
  17. Dworczyk, C.; Burkhard, B. Challenges Entailed in Applying Ecosystem Services Supply and Demand Mapping Approaches: A Practice Report. Land 2023, 12, 52. [Google Scholar] [CrossRef]
  18. Shaaban, M.; Schwartz, C.; Macpherson, J.; Piorr, A. A Conceptual Model Framework for Mapping, Analyzing and Managing Supply–Demand Mismatches of Ecosystem Services in Agricultural Landscapes. Land 2021, 10, 131. [Google Scholar] [CrossRef]
  19. Guettaya, I.; El Ouni, M.R. In Situ-based Assessment of Soil Liquefaction Potential—Case Study of an Earth Dam in Tunisia. Front. Struct. Civ. Eng. 2014, 8, 456–461. [Google Scholar] [CrossRef]
  20. INS (Institut National de la Statistique). Rapport National Genre Tunisie 2015; Institut National de la Statistique: Tunis, Tunisia, 2015. [Google Scholar]
  21. Larbi, I.; Forkuor, G.; Hountondji, F.C.C.; Agyare, W.A.; Mama, D. Predictive Land Use Change under Business as Usual and Afforestation Scenarios in the Vea Catchment, West Africa. Int. J. Adv. Remote Sens. GIS 2019, 8, 3011–3029. [Google Scholar] [CrossRef]
  22. Clark, L. Clark Labs. Available online: http://www.clarklabs.org (accessed on 2 January 2015).
  23. Tallis, H.T.; Ricketts, T.; Nelson, E.; Ennaanay, D.; Wolny, S.; Olwero, N.; Vigerstol, K.; Pennington, D.; Mendoza, G.; Aukema, J.; et al. InVEST 1.004 Beta User’s Guide; The Natural Capital Project, Stanford University: Stanford, CA, USA, 2010. [Google Scholar]
  24. Liang, C.; Schimel, J.; Jastrow, J. The Importance of Anabolism in Microbial Control Over Soil Carbon Storage. Nat. Microbiol. 2017, 2, 17105. [Google Scholar] [CrossRef]
  25. Qiu, J.; Turner, M.G. Spatial Interactions among Ecosystem Services in an Urbanizing Agricultural Watershed. Proc. Natl. Acad. Sci. USA 2013, 110, 12149–12154. [Google Scholar] [CrossRef] [PubMed]
  26. Tao, Y.; Li, F.; Wang, R.; Zhao, D. Effects of Land Use and Cover Change on Terrestrial Carbon Stocks in Urbanized Areas: A Study from Changzhou, China. J. Clean. Prod. 2015, 103, 651–657. [Google Scholar] [CrossRef]
  27. Roig, S.; del Río, M.; Cañellas, I.; Montero, G. Litter Fall in Mediterranean Pinus pinaster Ait. Stands under Different Thinning Regimes. For. Ecol. Manag. 2005, 206, 179–190. [Google Scholar] [CrossRef]
  28. Shaiek, O.; Loustau, D.; Garchi, S.; Bachtobji, B.; El Aouni, M.H. Estimation Allométrique de la Biomasse du Pin Maritime en Dune Littorale: Cas de la Forêt de Rimel (Tunisie). Forêt Méditerranéenne 2010, 31, 231–242. [Google Scholar]
  29. Shaiek, O.; Loustau, D.; Trichet, P.; Meredieu, C.; Bachtobji, B.; Garchi, S.; El Aouni, M.H. Generalized Biomass Equations for the Main Aboveground Biomass Components of Maritime Pine Across Contrasting Environments. Ann. For. Sci. 2011, 68, 443–452. [Google Scholar] [CrossRef]
  30. Zuazo, V.H.D.; Martínez, J.R.F.; Pleguezuelo, C.R.R.; Tavira, S.C. Biomass Carbon Stock in Relation to Different Land Uses in a Semiarid Environment. J. Land Use Sci. 2014, 9, 474–486. [Google Scholar] [CrossRef]
  31. Stiti, B.; Khaldi, A.; Hanchi, B. Carbon Stocks Distribution in Shrub Species of a North African Cork Oak Forest. Afr. J. Ecol. 2016, 55, 693–696. [Google Scholar] [CrossRef]
  32. Zribi, L.; Chaar, H.; Khaldi, A.; Hanchi, B.; Mouillot, F.; Gharbi, F. Estimate of Biomass and Carbon Pools in Disturbed and Undisturbed Oak Forests in Tunisia. For. Syst. 2016, 25, e060. [Google Scholar] [CrossRef]
  33. Repullo-Ruibérriz De Torres, M.A.; Ordóñez-Fernández, R.; Moreno-García, M.; Márquez-García, J.; Carbonell-Bojollo, R. Soil Nitrate and Organic Carbon Improvement by Use of Leguminous Plants as Cover Crops in an Organic Olive Orchard. AGROFOR Int. J. 2019, 4, 41–49. [Google Scholar] [CrossRef]
  34. Hamel, P.; Chaplin-Kramer, R.; Sim, S.; Mueller, C. A new approach to modeling the sediment retention service (InVEST 3.0): Case study of the Cape Fear catchment, North Carolina, USA. Sci. Total Environ. 2015, 524–525, 166–177. [Google Scholar] [CrossRef]
  35. Bouguerra, S.; Jebari, S. Identification and Prioritization of Sub-watersheds for Land and Water Management Using In-VEST SDR Model: Rmel River Basin, Tunisia. Arab J. Geosci. 2017, 10, 348. [Google Scholar] [CrossRef]
  36. Rukundo, E.; Liu, S.; Dong, Y.; Rutebuka, E.; Asamoah, E.F.; Xu, J.; Wu, X. Spatio-temporal Dynamics of Critical Ecosystem Services in Response to Agricultural Expansion in Rwanda, East Africa. Ecol. Indic. 2018, 89, 696–705. [Google Scholar] [CrossRef]
  37. Majumdar, A.; Avishek, K. Assessing Tradeoffs and Synergies between Land Use Land Cover Change and Ecosystem Services in River Ecosystem Using InVEST Model. Res. Square 2024. [Google Scholar] [CrossRef]
  38. Renard, K.G.; Foster, G.R.; Weesies, G.A.; McCool, D.K.; Yoder, D.C. Predicting Soil Erosion by Water: A Guide to Conservation Planning with the Revised Universal Soil Loss Equation (RUSLE); Agriculture Handbook No. 703; USDA-ARS: Washington, DC, USA, 1997.
  39. Vigiak, O.; Borselli, L.; Newham, L.T.H.; McInnes, J.; Roberts, A.M. Comparison of conceptual landscape metrics to define hillslope-scale sediment delivery ratio. Geomorphology 2012, 138, 74–88. [Google Scholar] [CrossRef]
  40. Zante, P.; Collinet, J. Cartographie des Risques Érosifs sur le Bassin Versant de la Retenue Collinaire de el Hnach (Dorsale Tunisienne); IRD: Tunis, Tunisia, 2001; 70p.
  41. Yang, D.; Kanae, S.; Oki, T.; Koike, T.; Musiake, K. Global potential soil erosion with reference to land use and climate changes. Hydrol. Process. 2003, 17, 2913–2928. [Google Scholar] [CrossRef]
  42. Teng, F.; Xu, S.-Q. Definition of Business as Usual and Its Impacts on Assessment of Mitigation Efforts. Adv. Clim. Change Res. 2012, 3, 212–219. [Google Scholar] [CrossRef]
  43. Stern, N. The Economics of Climate Change: The Stern Review; Cambridge University Press: Cambridge, UK, 2008. [Google Scholar]
  44. Richard Mark, D.; Rafik Fatehali, H. Climate Change and Water Resources Planning, Development, and Management in Zimbabwe (English); The Zimbabwe Water Forum Policy Note, no. 11; World Bank Group: Washington, DC, USA, 2016; Available online: http://documents.worldbank.org/curated/en/115321468197068948/Climate-change-and-water-resources-planning-development-and-management-in-Zimbabwe (accessed on 8 February 2024).
  45. Verdone, M. The Economics of Ecosystem Restoration: Case Studies and Benefits; IUCN: Gland, Switzerland, 2015. [Google Scholar]
  46. Touhami, I.; Aouinti, H.; Khabthani, M.A.; Bergaoui, K.; Chirino, E.; Rzigui, T.; Bellot, J.; Khaldi, A.; Khouja, M.L.; Mannaï-Tayech, B. Monitoring Land-Cover Changes in Mediterranean Coastal Dunes, Northwest Tunisia, Using Remote Sensing Data. Not. Bot. Horti Agrobot. Cluj-Napoca 2022, 50, 12794. [Google Scholar] [CrossRef]
  47. Hamel, P.; Guswa, A.J. Uncertainty analysis of a spatially explicit annual water-balance model: Case study of the Cape Fear basin, North Carolina. Hydrol. Earth Syst. Sci. 2015, 19, 839–853. [Google Scholar] [CrossRef]
  48. Jendoubi, D.; Liniger, H.; Ifejika Speranza, C. Impacts of Land Use and Topography on Soil Organic Carbon in a Mediterranean Landscape (North-western Tunisia). SOIL 2019, 5, 239–251. [Google Scholar] [CrossRef]
  49. EFIMED. New Observation Site in Tunisia to Study Climate Change and Forests. MedForest, 7 May 2020. [Google Scholar]
  50. Belhadj Khedher, F.; Mouillot, F. Gizement climatique et incendies de forêt en Tunisie: Sècheresse et évènements de sirocco dans les modèles climatiques. In Proceedings of the Actes du XXXIV ème Colloque International de l’AIC, Casablance, Morocco, 7–8 July 2021. [Google Scholar]
  51. FAO. The Multiple Dimensions of Food Security, WFP, The State of Food Insecurity in the World 2016; FAO: Rome, Italy, 2016. [Google Scholar]
  52. Panyawai, J.; Tuntiprapas, P.; Prathep, A. High macrophyte canopy complexity enhances sediment retention and carbon storage in coastal vegetative meadows at Tangkhen Bay, Phuket, Southern Thailand. Ecol. Res. 2019, 34, 201–212. [Google Scholar] [CrossRef]
  53. Degife, A.; Worku, H.; Gizaw, S. Environmental implications of soil erosion and sediment yield in Lake Hawassa watershed, south-central Ethiopia. Environ. Syst. Res. 2021, 10, 28. [Google Scholar] [CrossRef]
  54. Fahad, S.; Chavan, S.B.; Chichaghare, A.R.; Uthappa, A.R.; Kumar, M.; Kakade, V.; Pradhan, A.; Jinger, D.; Rawale, G.; Yadav, D.K.; et al. Agroforestry Systems for Soil Health Improvement and Maintenance. Sustainability 2022, 14, 14877. [Google Scholar] [CrossRef]
  55. Bewket, W. Towards Integrated Watershed Management in Highland Ethiopia: The Chemoga Watershed Case Study. Land Degrad. Dev. 2003, 44, 169. [Google Scholar]
  56. Ersoy Tonyaloğlu, E. Future land use/land cover and its impacts on ecosystem services: Case of Aydın, Turkey. Int. J. Environ. Sci. Technol. 2024. [Google Scholar] [CrossRef]
  57. García-Mayor, C.; Nolasco-Cirugeda, A. New Approach to Landscape-Based Spatial Planning Using Meaningful Geolocated Digital Traces. Land. 2023, 12, 951. [Google Scholar] [CrossRef]
  58. Zandebasiri, M.; Goujani, H.J.; Iranmanesh, Y.; Azadi, H.; Viira, A.-H.; Habibi, M. Ecosystem services valuation: A review of concepts, systems, new issues, and considerations about pollution in ecosystem services. Environ. Sci. Pollut. Res. 2023, 30, 83051–83070. [Google Scholar] [CrossRef] [PubMed]
  59. Meraj, G.; Singh, S.K.; Kanga, S.; Islam, N. Modeling on comparison of ecosystem services concepts, tools, methods and their ecological-economic implications: A review. Model. Earth Syst. Environ. 2022, 8, 15–34. [Google Scholar] [CrossRef]
  60. Sharp, R.; Tallis, H.T.; Ricketts, T.; Guerry, A.D.; Wood, S.A.; Chaplin-Kramer, R.; Nelson, E.; Ennaanay, D.; Wolny, S.; Olwero, N.; et al. InVEST User’s Guide; The Natural Capital Project: Stanford, CA, USA, 2014. [Google Scholar]
  61. Daly-Hassen, H.; Gader, G.; Potthast, M.C. Une Approche Économique pour Choisir les Options d’Adaptation des Forêts au Changement Climatique: Application à la Forêt de Chêne Liège en Tunisie. In Proceedings of the XIVème Congrès Forestier Mondial, Durban, South Africa, 7–11 September 2015. [Google Scholar]
Figure 1. Location of the studied Sidi El Barrak watershed.
Sustainability 16 07201 g001
Figure 2. Methodological framework applied in the present study. SDR = Sediment Delivery Ratio, DEM = Digital Elevation Model, LULC = land use land cover, RCP = Representative Concentration Pathway.
Sustainability 16 07201 g002
Figure 3. Location of nature-based solutions in the Sidi Barrak watershed.
Sustainability 16 07201 g003
Figure 4. LULC distribution in 1990, 2021, and 2050.
Sustainability 16 07201 g004
Figure 5. Soil erosion map for 2021, under RCP 4.5 climate scenario (2050) and with adaptation measures’ implementation (2050).
Sustainability 16 07201 g005
Figure 6. Spatial distribution of carbon storage in Sidi El Barrak watershed in year 2021, horizon 2050 (RCP 4.5), and with adaptation measures’ implementation.
Sustainability 16 07201 g006
Figure 7. Annual net present value for the different scenarios (in €/ha, 2%, 2050).
Sustainability 16 07201 g007
Figure 8. Opportunity cost compared to BAU (in M€).
Sustainability 16 07201 g008
Table 1. Characteristics of satellite imageries.
TypeDate of AcquisitionResolution (m)SourceNumber of Bands
Landsat8 (OLI/TIRS)21 August 202130Earth Explorer (usgs.gov)11
Table 2. Data for carbon pools (t ha−1) of different LULC types collected from existing literature. (Lucode: land use code, lulc_name: name of land use land cover, c_above: carbon stored in the aboveground biomass, c_below: carbon stored in the belowground biomass).
LucodeLulc_Namec_Abovec_Belowc_Soilc_Dead
1Bare soil0000
2Arboriculture951000
3Coniferous trees339103
4Crop field7400
5Constructed area00100
6Deciduous forest151434586
7Scrubland411103
8Water0000
9Mixed forest93264585
Table 3. Data requirements for the SDR module.
DataTypeSource
Digital Elevation model (DEM)Raster (30 m)SRTM
Rainfall (2010–2020)Monthly, annuallyINM/DGRE
Map of Soil typesRaster (30 m)DG/ACTA
LULC mapRaster (30 m)DG/ACTA
C, K, P factorsDecimal[39]
K, IC, SDR max parametersDecimal[33,38]
Table 4. Adaptation Management: Details and Areas of Intervention Scenarios.
HorizonScenarioAdaptation ManagementIntervention DetailsArea
(ha)
2050BAU: Business as UsualNo managementNo interventions-
Management ScenarioSoil and water conservation techniquesContour ridges in crop field230.12
Contour ridges in scrubland270.98
Mico-basin277.30
Agroforestry plantationPlantation of carob trees857.00
Forest plantationPlantation of cork trees1156.87
Plantation of pine trees
Plantation of carob trees
CombinationAll types of interventions2792.27
Table 5. Costs and lifetime of the interventions (€/ha).
Soil and Water ConservationForest PlantationAgroforestry Plantation
Contour RidgesMicro-BasinsCork OakPineCarob
Cost of installation/plantation485.2175.81585.57736.91606.51
Cost of maintenance/fencing00402.100348.74
Lifetime15103001000500
Table 6. Areas and percentages of LULC classes’ change between 1990, 2021, and 2050.
LULC ClassArea (ha)
1990% Change2021% Change2050
Arboriculture2860280.6110,885.546.3415,929.91
Coniferous forests3956.08−17.463265.2−16.312732.52
Crop field27,889.35.6629,469.062.2930,142.61
Deciduous forests24345−14.7220,760.21−10.1418,655.02
Scrubland17,978.8−22.4713,939.74−9.3012,643.92
Mixed forests3898.34−17.113231.18−23.692465.57
Table 7. Sediment retention and carbon storage results using the InVEST model.
Year Carbon Storage
t ha−1
Sediment Retention
t ha−1
1990Past situation1.7119.25
2021Actual situation1.6115.55
2050BAU: Business as Usual1.3511.08
Soil and water conservation techniques1.4214.58
Agroforestry1.5314.34
Reforestation1.8215.12
Combination2.4223.25
Table 8. NPV (2%, 2050) for adaptation measures.
BAUSoil and Water ConservationAgroforestryReforestationCombined Intervention
Benefits M€9.7610.6410.7511.2414.11
Costs M€-−0.60−0.79−1.242.64
NPV M€-10.049.9510.0011.46
Intervention surface (ha)-778.40857.001156.872792.27
Table 9. NPV for all management scenarios using different discount rates (M€/yr).
NPV 2%NPV 4%NPV 6%NPV 10%
Soil and Water Conservation10.047.766.184.21
Agroforestry9.957.565.903.87
Reforestation10.007.465.713.58
Combined intervention11.468.206.003.37
Disclaimer/Publisher’s Note: The statements, opinions and data contained in all publications are solely those of the individual author(s) and contributor(s) and not of MDPI and/or the editor(s). MDPI and/or the editor(s) disclaim responsibility for any injury to people or property resulting from any ideas, methods, instructions or products referred to in the content.

