Article

Bus Route Sketching: A Multimetric Analysis from the User’s and Operator’s Perspectives

1
Public Transportation Division, Sejong City Hall, Sejong City 30103, Republic of Korea
2
Department of Transportation, Korea National University of Transportation, Chungju 27469, Republic of Korea
*
Author to whom correspondence should be addressed.
Sustainability 2024, 16(16), 7172; https://doi.org/10.3390/su16167172
Submission received: 8 July 2024 / Revised: 12 August 2024 / Accepted: 18 August 2024 / Published: 21 August 2024

Abstract

:
The purpose of this study is to develop an optimal bus route search algorithm that considers both the user’s and supplier’s perspectives. The process of providing bus route service involves route network design, route allocation, and operation and management in sequence. Among these, establishing the optimal rationality for route network design in practical applications is challenging, and route modifications often occur during the operation process. To minimize these practical difficulties, this study proposes the Bus Route Sketch (BRS) methodology. This methodology, designed for network-level optimization, distinguishes itself from existing bus route setting methodologies by minimizing travel costs while taking user needs into account. This study yielded positive results, with the evaluation score improving from 8.83 to 9.50 from the supplier’s perspective and from 7.13 to 9.89 from the user’s perspective. This BRS methodology, developed to suit both route planning and operation processes, is expected to be utilized in the practical evaluation, adjustment, and design of bus routes.

1. Introduction

In new cities, gradual urban development and population growth often lead to the need for bus route reorganization due to insufficient bus supply. However, a comprehensive system for the evaluation of bus routes is lacking. Without clear and reasonable evaluation indicators, it is challenging to establish a direction for improvement during route reorganization. As a result, users raise complaints about new routes, demanding shorter travel times and reduced fares, while suppliers face difficulties in providing adequate service due to limited budgets. Consequently, many cities rely on trial-and-error approaches to route creation, often driven by the field-oriented perspectives of transportation experts.
To address this issue, it is essential to find a compromise and coordinate between reasonable bus route times and destinations, waypoint selection, and the level of demand from both users and suppliers. Currently, many cities prioritize efficiency-oriented designs when planning bus route networks, aiming to minimize total network costs. However, there is a growing need to shift toward a route operation method that prioritizes transportation welfare policies for users, rather than solely focusing on minimizing travel costs. Traditional public transportation route design relies on the transportation zone system, which is an artificial spatial division for the estimation of passenger or cargo movement and flow. This approach has limitations as it cannot fully capture social and economic characteristics or transportation conditions.
Therefore, this study proposes the Bus Route Sketch (BRS) methodology based on socio-economic cell-based spatial division. The BRS methodology is valuable because it generates all possible driving route alternatives between a given origin and destination, considering transit options, and then uses multi-layered and multi-level evaluation indicators to identify optimal alternatives for policy decisions.

2. Literature Review and Research Direction

2.1. Literature Review

Research related to bus route evaluation and selection can be broadly categorized into (a) evaluation index and evaluation, and (b) route optimization and route network design. Studies focusing on evaluation indicators have been conducted from both the supplier’s and user’s perspectives [1,2]. On the supplier side, the route flexibility index, calculated by the ratio of the travel distance between model points of the bus route and the shortest distance/straight distance, has been used. On the user side, an evaluation method emphasizing economic feasibility and using the route flexibility index to the destination was presented. However, this evaluation method has limitations as it evaluates suppliers and users independently, preventing the simultaneous consideration of both perspectives.
Additionally, studies on social equity suggest that for bus services, it is essential to consider a social perspective when establishing a route system as a high percentage of users are dependent passengers (elderly people, children, disabled individuals, low-income groups, etc.) who do not own private vehicles [3,4]. It has been noted that spatial, social, and economic equity factors influence one another and that the costs and financial resources required for regional facility investment should be determined by calculating the benefits of improved accessibility. This study intends to consider a route selection methodology that considers a socio-economic cell-based survival system and simultaneously considers both suppliers and users, which were evaluated independently in previous studies, as multi-layers.
Furthermore, several studies have explored the evaluation of route operation efficiency [5,6,7,8]. Efficiency evaluation involves assessing the number of users and transportation income using variables such as the number of operations, dispatch intervals, stops, facilities for transportation-disadvantaged individuals, and redundancy. This method evaluates routes based on their profitability. Although route adjustments are reviewed through this process, the latter differs from the provision of public bus services in terms of social equity.
Since the goal of this research is to develop a bus route design methodology, we draw implications from the existing research on route optimization and bus route network design. Research on bus route optimization and network design has been reported on route network optimization, prioritization methodology, and multi-level and multi-stage bus route network design [9,10,11].
Bus route network optimization research has evolved from set-covering theory [12,13,14,15,16,17] and early studies that applied spatially weighted regression [18,19,20,21,22,23] to multi-level and multi-stage bus route network design. Most urban bus route planning studies are based on a localized analysis of individual routes, but this study presents a route planning methodology for optimizing the network rather than considering each route individually. The methodology of this study derives an alternative route network consisting of the shortest route from each origin point under the basic premise that all traffic objects, including bus users, want to travel by the shortest route from a planner’s point of view and reduces the level of route supply by applying set-covering theory, which introduces the concept of a matrix-like set. In addition, during the route reduction process, transit, which has been recognized as an incidental traffic factor, is used to derive the minimum route network that satisfies traffic demand. Unlike existing studies that assume fixed demand, this study implements variable demand for city bus route network alternatives to derive the optimal route network that reflects passenger behavior. Therefore, the optimal city bus route network, which minimizes the scale of service provision while minimizing the travel cost of the entire network that consists of private car users and bus users, was derived. Compared to previous studies, this study not only reduces the scale of service provision but also improves realism by deriving a solution that considers passenger behavior. However, this study has a limitation in that it is based on a toy network for methodology development rather than a real bus route network.
Park et al. (2014) [10] conducted a study using Geographically Weighted Regression (GWR), in which they identified the potential demand for buses at bus stops and bus routes through GIS-T data and GWR analysis and analyzed the supply situation to determine whether the supply and demand of buses are balanced to build efficient bus routes and derive a balance in the spatial demand relationship. Based on the GWR model that considers spatial effects, we predicted the demand for buses using smart cards and bus information system data and compared it to the supply to identify supply shortages. We identified route surplus and shortage areas for all routes. Then, we analyzed where additional routes need to be allocated to optimize the supply of buses and tried to visualize the advantages of GIS. In this study, transportation planning alternatives were prepared based on the transportation demand forecasting model, and it is expected that it will help to prepare more reasonable transportation policies through bus demand forecasting and demand–supply balance analysis considering spatial characteristics.
Set-covering theory and GWR-based studies have the limitation of not constructing multi-level and multi-mode integrated public transportation networks, which was overcome in a multi-level and multi-mode integrated public transportation network optimization study [24]. In this study, the transportation network level is composed of Skelton, arterial, and feeder transportation networks and divided into arterial transportation (rail, subway, light rail, BRT, and trolley) and feeder transportation (regular bus and village bus). The optimal integrated transportation network was designed through multi-objective optimization, which considers various variables such as access time, travel cost, speed, waiting time, traffic volume, and capacity as a function of cost. An analysis based on the application showed that the total travel time could be reduced by 21.51%.
As an implication, when analyzing bus operation routes with a focus on accessibility to bus services, it is evident that applying the traditional traffic zone approach used in general transportation demand estimation methods is not straightforward. Therefore, for bus operation route analysis, the traffic zone aims to consider the user’s accessibility to bus services (e.g., walking distance). Additionally, while spatial clustering techniques group objects based on similarity or proximity, the cluster size is determined by the spatial distribution of objects. This limits the ability to consider access time or access distance for bus service users. Hence, the intention is to develop a clustering technique suitable for defining spatial clusters (i.e., bus traffic zones), specifically for bus operation route analysis.
Furthermore, in contrast to previous studies that assumed fixed demand, this study aims to implement variable demand for city bus route network alternatives to derive an optimal route network that reflects actual passenger behavior. By doing so, we intend to identify an optimal city bus route network that minimizes the travel cost for the entire network, including both private and bus users, while also minimizing the scale of service provision. Compared to previous research, the results of this study are significant in that they reduce the level of service supply and enhance realism by deriving a solution that considers the behavior of passengers.
Finally, while shortest route search algorithms seek single or multiple routes that minimize travel costs (e.g., travel distance and travel time), the operation route of a bus service has limitations that cannot be solved by the shortest route problem alone. For instance, the k-route search technique cannot guarantee an alternative route for the shortest path from the perspectives of both bus service providers and users. Therefore, it is necessary to develop a technique that calculates all possible routes to incorporate the positions of both suppliers and users as evaluation indicators.

2.2. Research Directions

The step after designing and planning the bus route network and determining the number of routes through route prioritization is to determine the appropriate route for each individual route. To perform this series of decision processes, it is necessary to establish effective traffic zones, set up route alternatives, and determine the optimal route using evaluation indicators. Existing studies have performed bus route network optimization using traditional analysis techniques, but they have a fundamental limitation, which is that the bus route is not the shortest route problem related to the travel cost minimization problem. Therefore, it is necessary to analyze the selection of appropriate bus routes from a public service perspective, which reflects multi-level evaluation indicators from both the supplier’s and consumer’s perspectives.
For the individual route decision, it is necessary to identify a schematic route that reflects the level of demand from both the supply and demand perspectives and to make policy decisions based on route prioritization. In addition, it is necessary to monitor the effectiveness of the routes during operation and continuously adjust the routes. To carry out these processes effectively, this study proposes a BRS methodology for practical use. The BRS methodology derives all possible route alternatives, considering transfers based on the origin and destination, and derives the optimal alternative for policy decisions using multi-layered and multi-level evaluation indicators.

3. BRS Methodology

3.1. Concept of Methodology

The concept of BRS methodology presented in this study is a process in which a transportation expert sketches all possible operational routes through key points (e.g., transit bus stops) on a road network diagram while obtaining spatial data of socio-economic indicators of the city and performs an effectiveness analysis using multiple evaluation indicators at multiple levels (supplier and consumer) to determine the optimal alternative.
The BRS methodology consists of (a) the establishment of bus traffic zones, (b) the exploration and derivation of bus route alternatives using the connectivity of bus traffic zones, and (c) the ranking of bus routes using multiple evaluation indicators in terms of multiple levels (providers and users) (Figure 1). (a) The bus traffic zone consists of a general traffic zone and a transit traffic zone. The general traffic zone is determined by a spatial clustering technique using socio-economic indicators (e.g., population and number of employees), and the transit traffic zone is determined using the transit demand of the general traffic zone. (b) The exploration and derivation of operating route alternatives are performed by the route combination method using a set of all possible traffic zones (i.e., nodes consisting of the general traffic zone, nodes consisting of the general traffic zone, nodes consisting of the general traffic zone and the transit traffic zone via the transit traffic zone from the origin traffic zone to the destination traffic zone). (c) The ranking of bus routes is performed by scoring multi-provider indicators and multi-user indicators.
In terms of spatial scale, the maximum distance between bus stops is 500 m, the maximum allowable spatial distance to adjacent traffic zones is 1.5 km, and the multi-unit spatial cell is 100 m × 100 m. The maximum allowable distance is currently set to 1.5 km, in accordance with the maximum distance for commuting and walking rights stipulated in the Korean “Rules on the Detergence, Structure, and Installation Standards of Urban Planning Facilities”. This standard is also applied in Sejong City, which is the focus of this study; therefore, the maximum distance for bus stop placement was set to 1.5 km. This spatial division functions as a repeater or mediator when one node establishes a network between other nodes. The more nodes connecting different groups, the higher the mediation centrality measured. Mediation centrality is defined as the number of shortest paths through that node. Currently, many municipalities divide administrative or urban planning areas into bus traffic zones, but at the macro level, this study defines the environment accessible to passengers on foot (within 500 m) as a bus traffic zone, and a bus traffic zone consists of multiple cell spaces. Walkability is an important criterion for defining neighborhoods, and outside this zone, the concept of transit-oriented development (TOD) has evolved to ensure mobility using public transportation. In the U.S., a half mile (about 800 m) is the standard for a 10-min walk to a transit stop, and similar studies analyzing ridership growth by transit access distance have shown that ridership declines rapidly beyond 91 m and disappears beyond 580 m [25,26]. They also found that for every 500 m away from a transit stop, ridership decreases by 50%, and for every 10% increase in access distance, ridership decreases by 10% [27]. Therefore, in this study, we follow the existing spatial scope and set the walking distance to bus stops to 500 m. The maximum allowable distance was set to 1.5 km, which is currently the maximum distance for commuting and walking rights in Korea’s urban planning facility decision criteria, and it is also applied in Sejong City; so, we used it as the maximum value. Multi-unit spatial cells are provided by the Korea National Geospatial-Intelligence Agency, which divides the entire country into cell units (100 m × 100 m) and provides cell-based socio-economic big data (population by age, number of workers, etc.), which we intend to use actively.

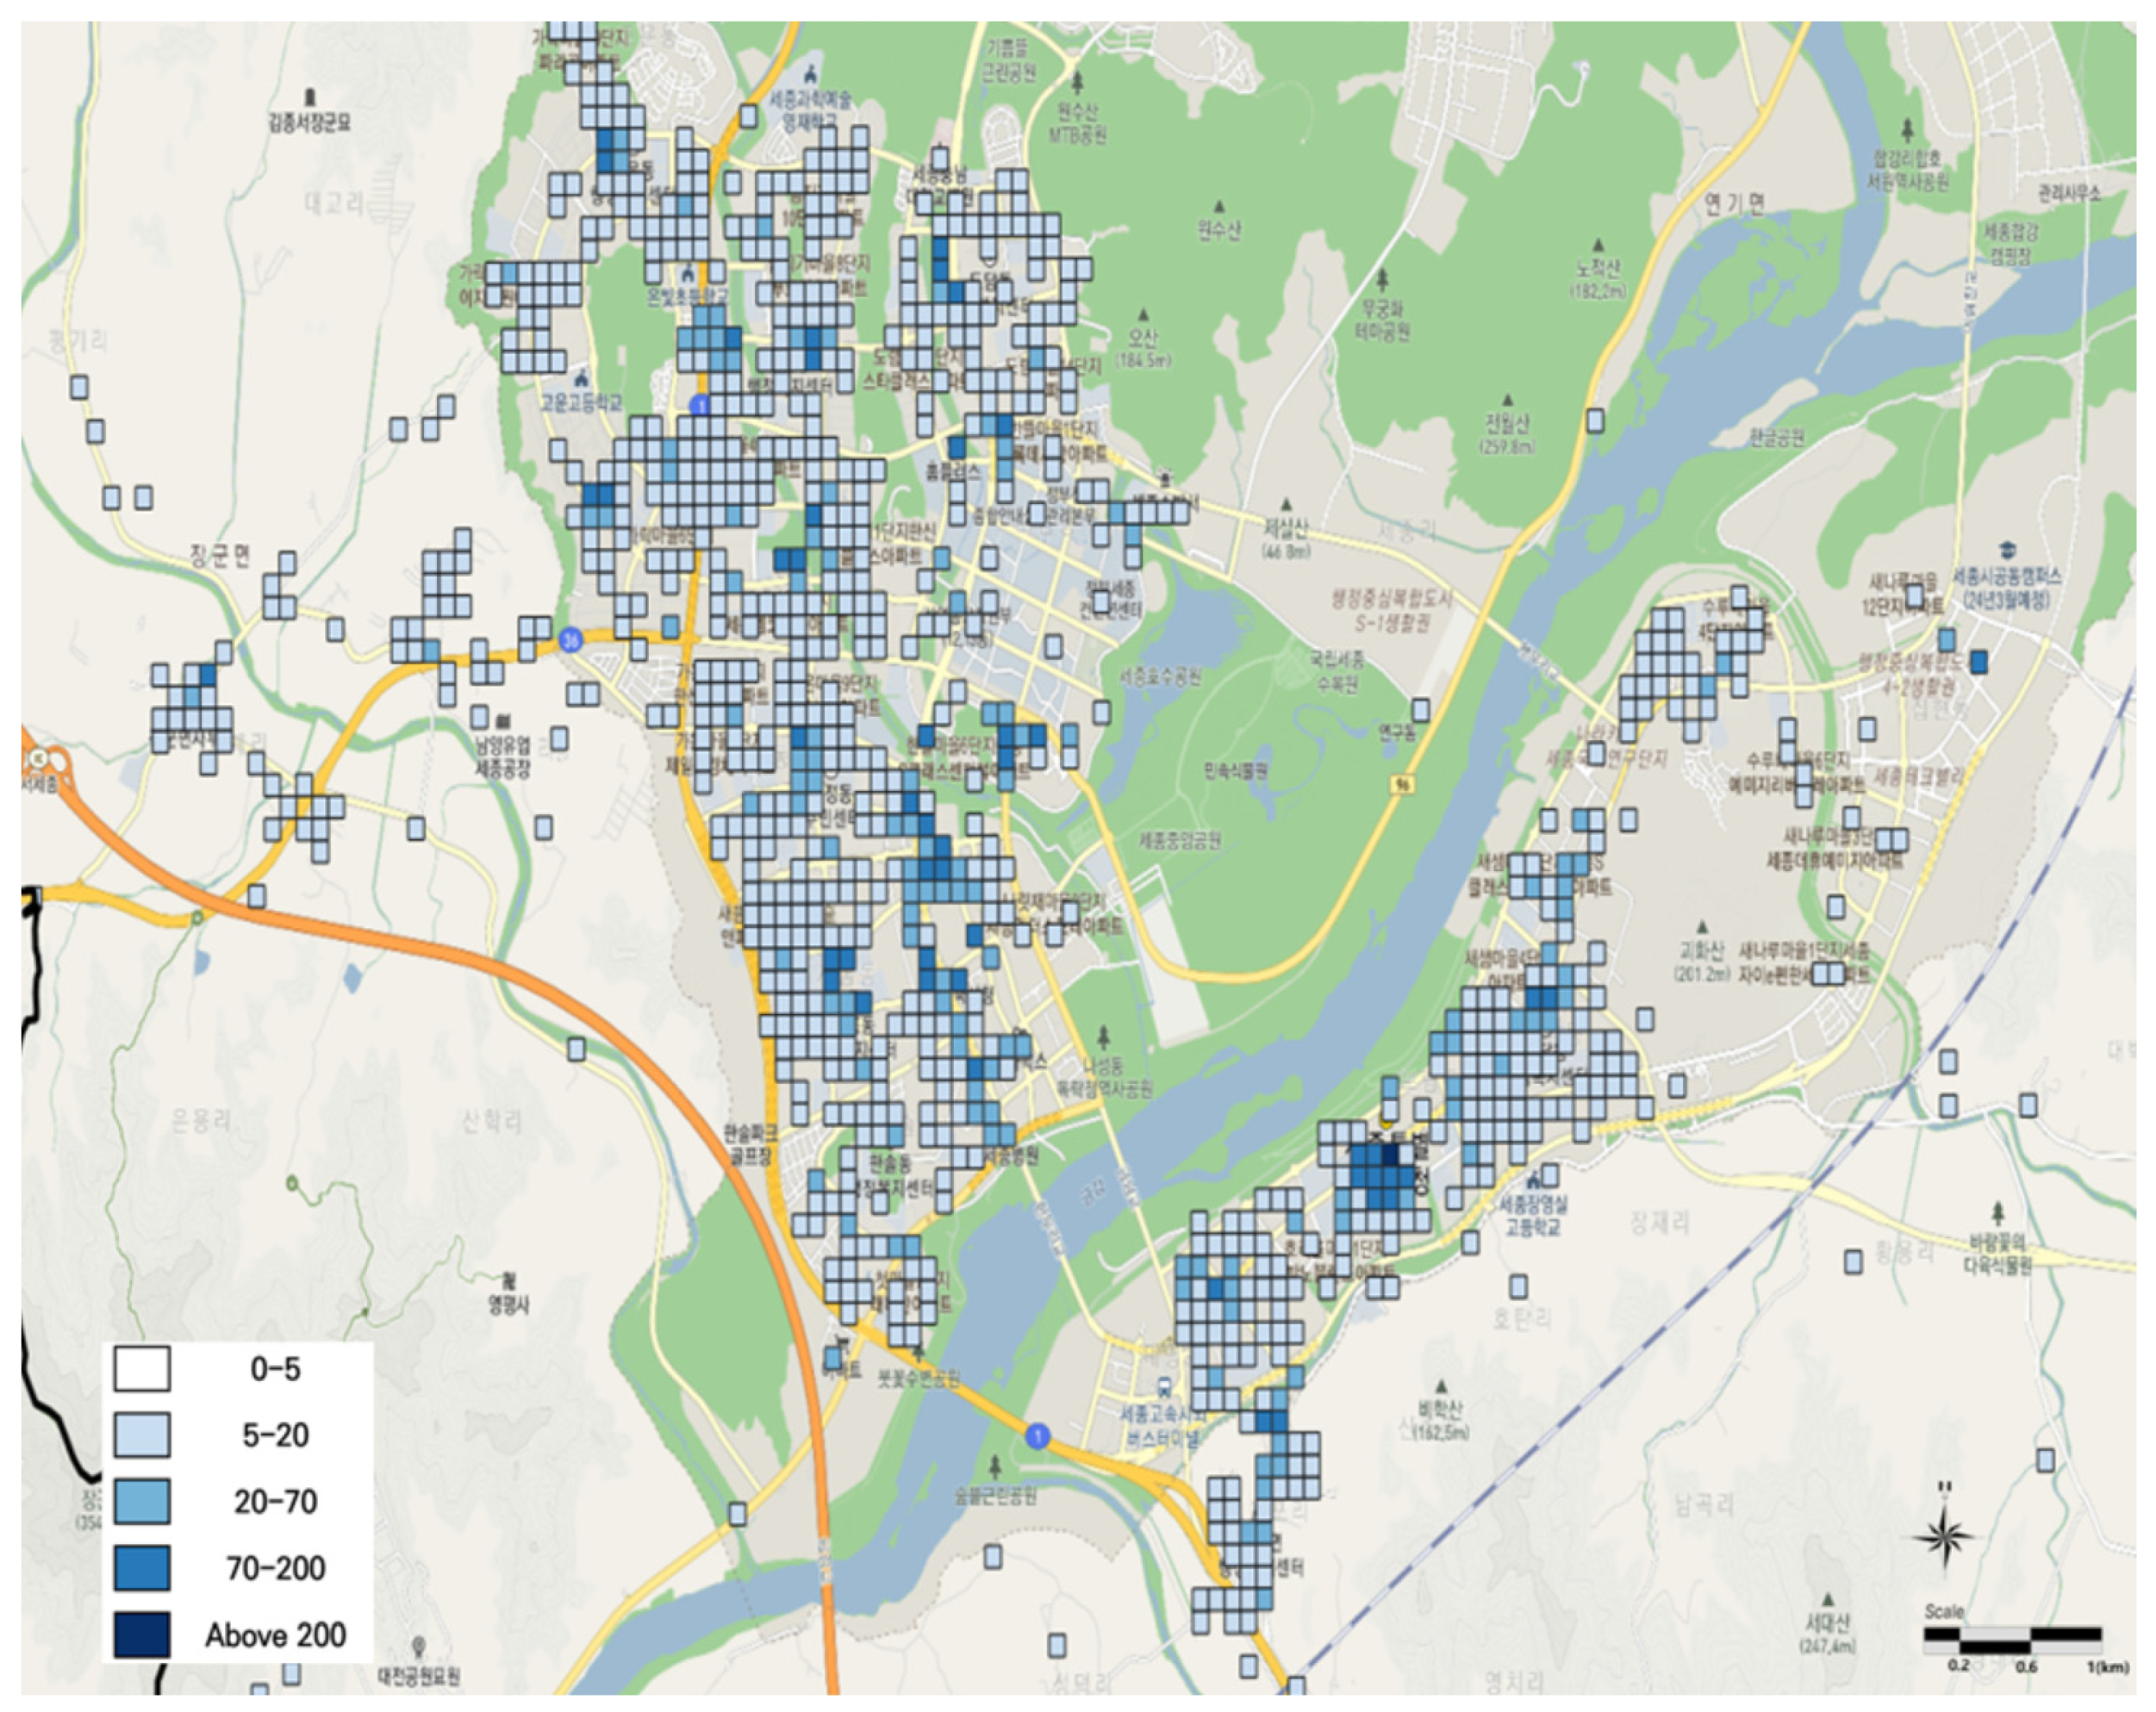
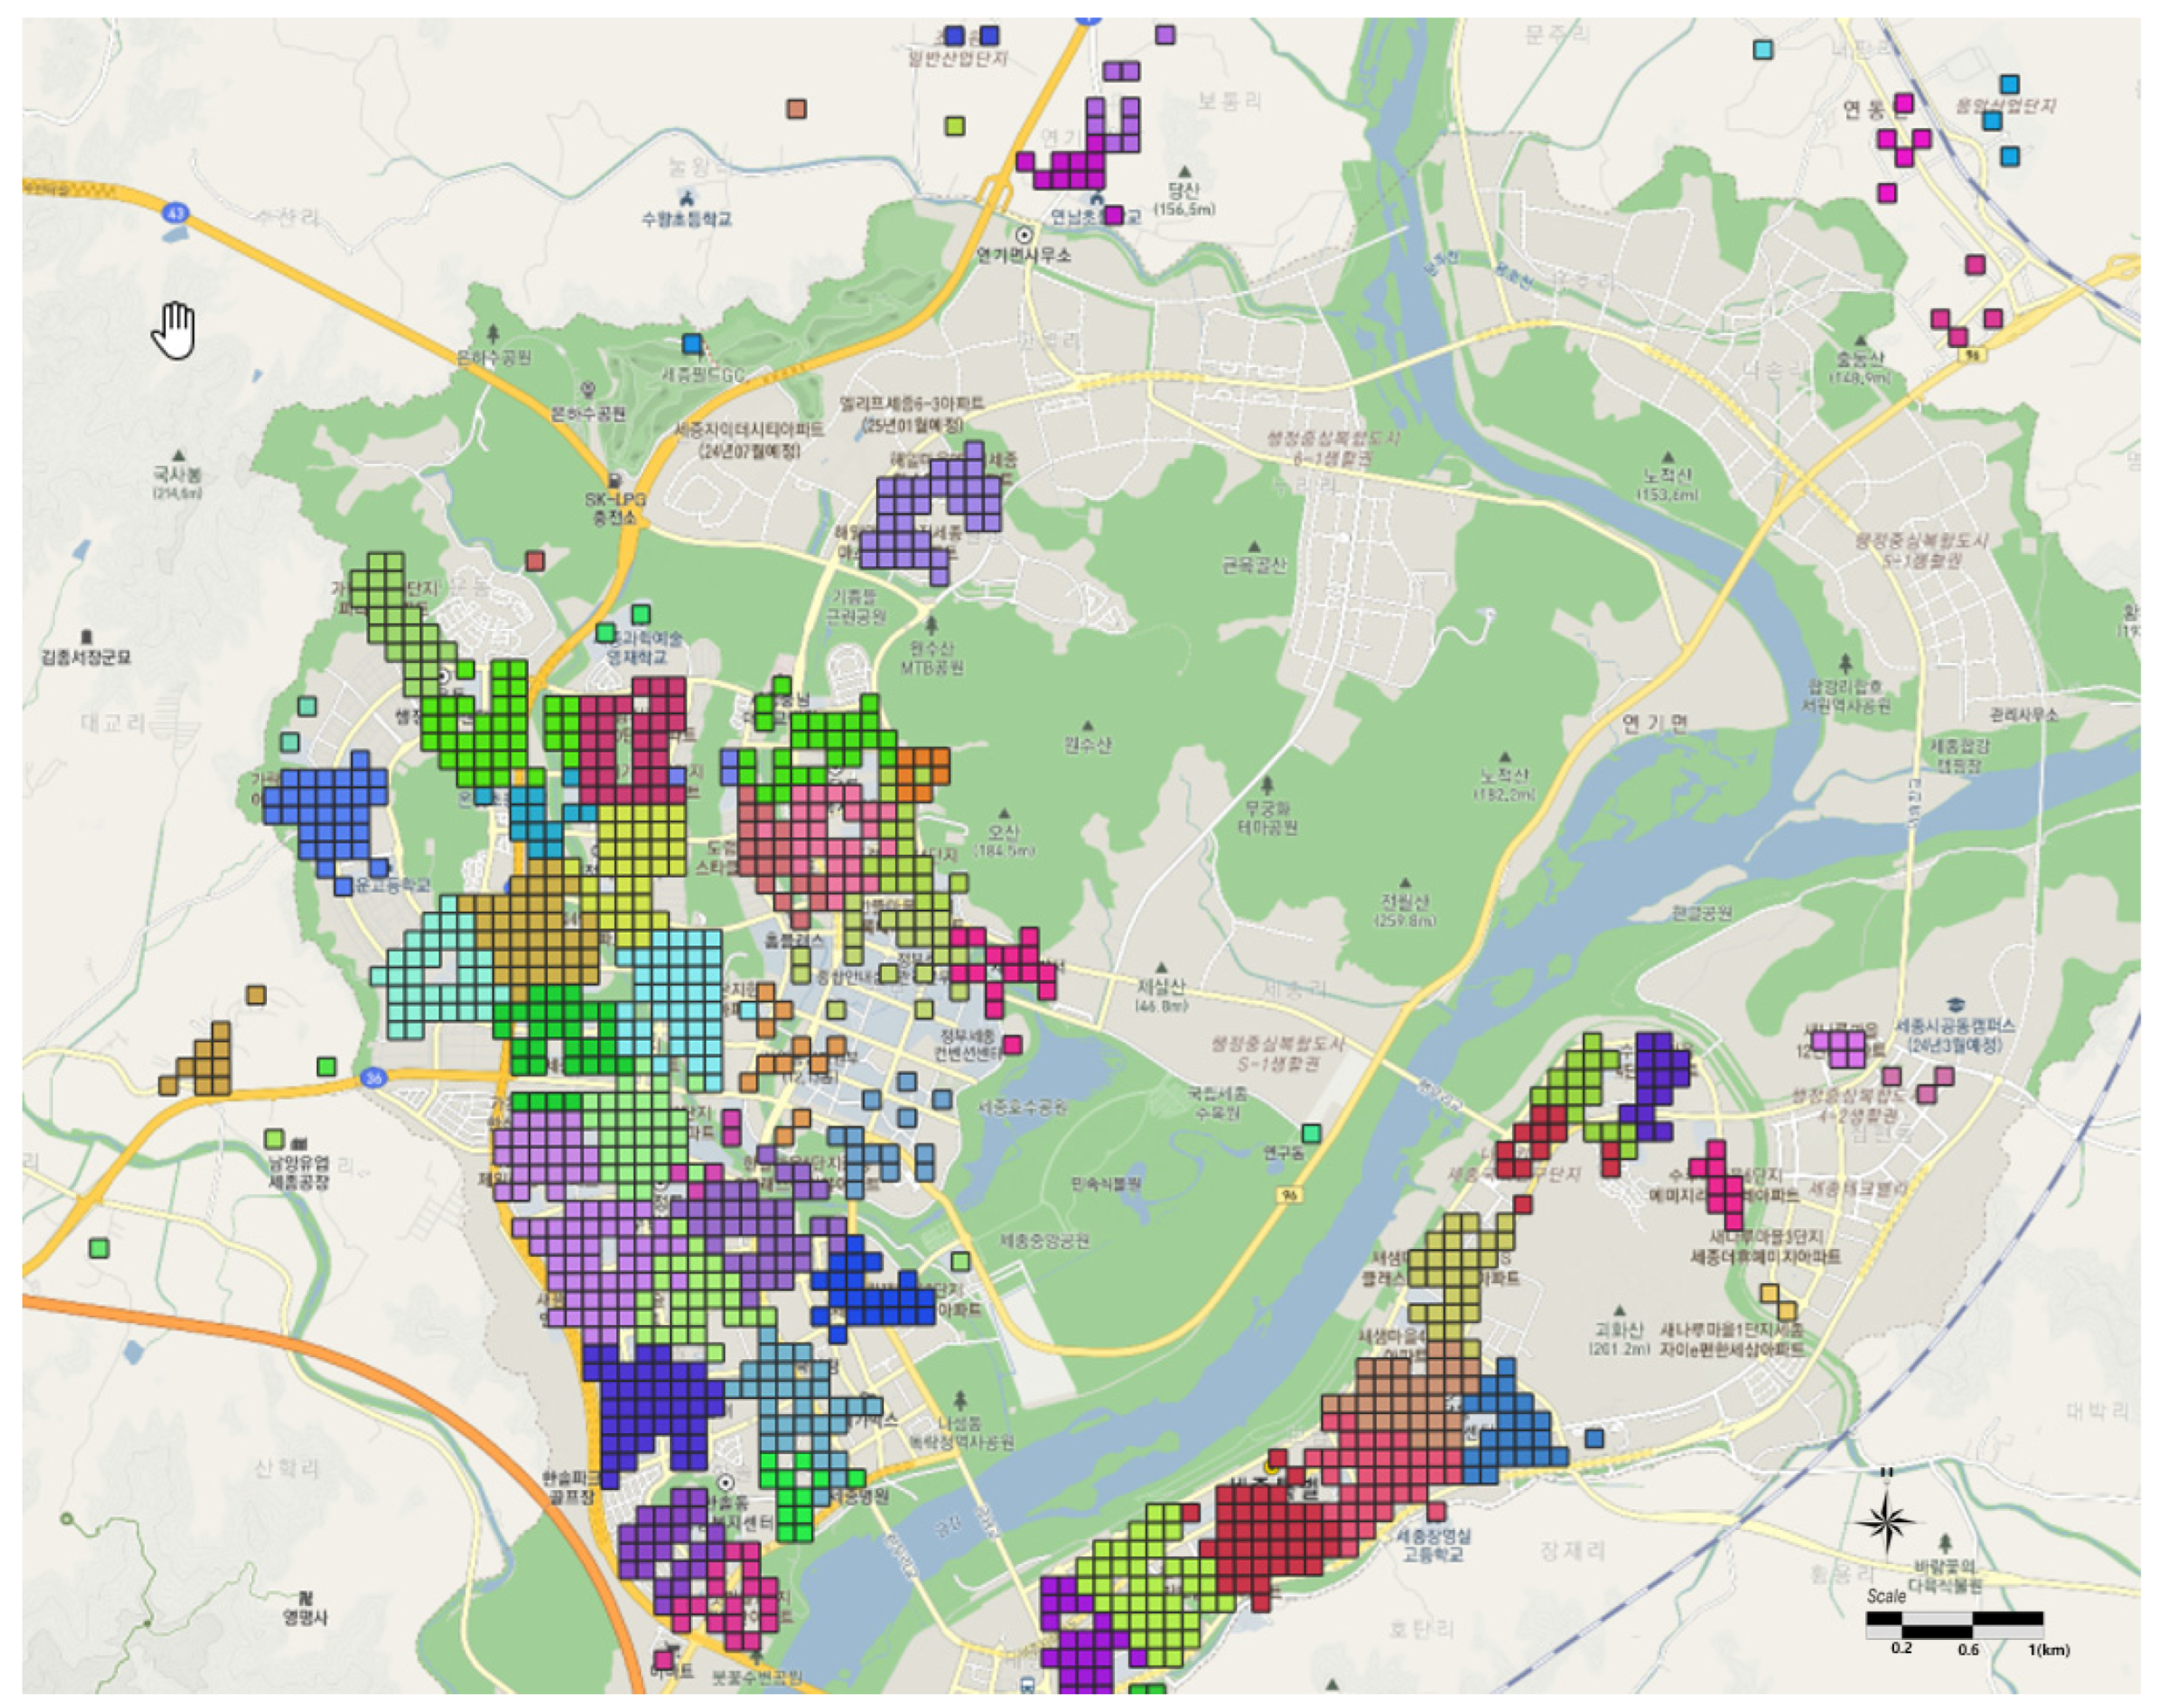
3.2. Setting up Bus Traffic Zones

Bus traffic zones are composed of multi-unit spatial cells (100 m × 100 m), and zoning is performed by using information on the population and number of workers, which are typical socio-economic indicators used to predict traffic generation and arrival in order to establish bus traffic zones. In addition, the population and number of workers per cell are generally complementary in spatial occupancy distribution and are suitable data to explain people’s transportation demands. Therefore, the population and number of workers are divided and constructed in cell space and used as input data for zoning.
For the zoning of traffic zones suitable for bus route analysis [28,29,30], a scale for the calculation of the centroid of the corresponding traffic zone consisting of individual cells is required. The centroid scale uses the normalized weight (0.0~1.0) of the population (inhabitants/cell) and the normalized weight (0.0~1.0) of the number of workers (inhabitants/cell); the normalized weight value combining the population and the number of workers is defined as follows.
ω i = p i m a x · p i + e i m a x · e i
where i = the number in cell (i = 1, 2, …, m), p i = the population in cell I, and e i = the employment index in cell i.
c k ( x , y ) , the center of the second traffic zone ( z k ), consisting of m cells, is calculated as shown in Equation (2) using the cell-specific ω i defined in Equation (1). ω i is a weighting factor for population and the number of workers, and the center of the traffic zone is calculated by considering cells with a high concentration of population and workers. Therefore, the route through the center of the traffic zone considers the spatial accessibility between the bus service and the users.
c k ( x , y ) = i = 1 m ω i × x i i = 1 m ω i , i = 1 m ω i × y i i = 1 m ω i
where ( x i , y i ) = x , y spatial coordinates of cell i.
In order to perform bus traffic zoning using the cell-space-based spatial clustering technique, a criterion between the center point of the traffic zone and a cell (not a member cell of the traffic zone) is required. We use the maximum distance d z , c m a x between the center point of the traffic zone (z) and the center point of the cell as the separation criterion. In addition, we set it to d z , c m a x = 500   m in this study to consider the separation distance between bus stops and the approach distance of users. With the above definition, the process of bus traffic zoning algorithm is described by pseudo code [31], as follows.
  • Define the full set of cell members ( C ) as C = c 1 , c 2 , , c j , , c J , consisting of J partitioned into unit cells (100 m × 100 m), and the cell member list ( c j ) as C , consisting of [cell center coordinates ( x i , y i ) , population ( p j ), and the number of workers ( e j )].
  • Define the set of K traffic zones ( Z ) as Z = z 1 , z 2 , , z k , , z K The k th traffic zone ( z k ) has a member list ( L k ) of m k cells, with k = 1 , 2 , , K · L k , consisting of the center point of the traffic zone ( c k z ( x , y ) ), the center coordinates of the member ( x k , i , y k , i ), the population ( p k , i ), and the number of workers ( e k , i ). L k for the i m k ·traffic zone ( z k ) is defined as follows:
    L k = c k z x , y , x k , 1 , y k , 1 , p k , 1 , e k , 1 , x k , 2 , y k , 2 , p k , 2 , e k , 2 , x k , m , y k , m , p k , m , e k , m
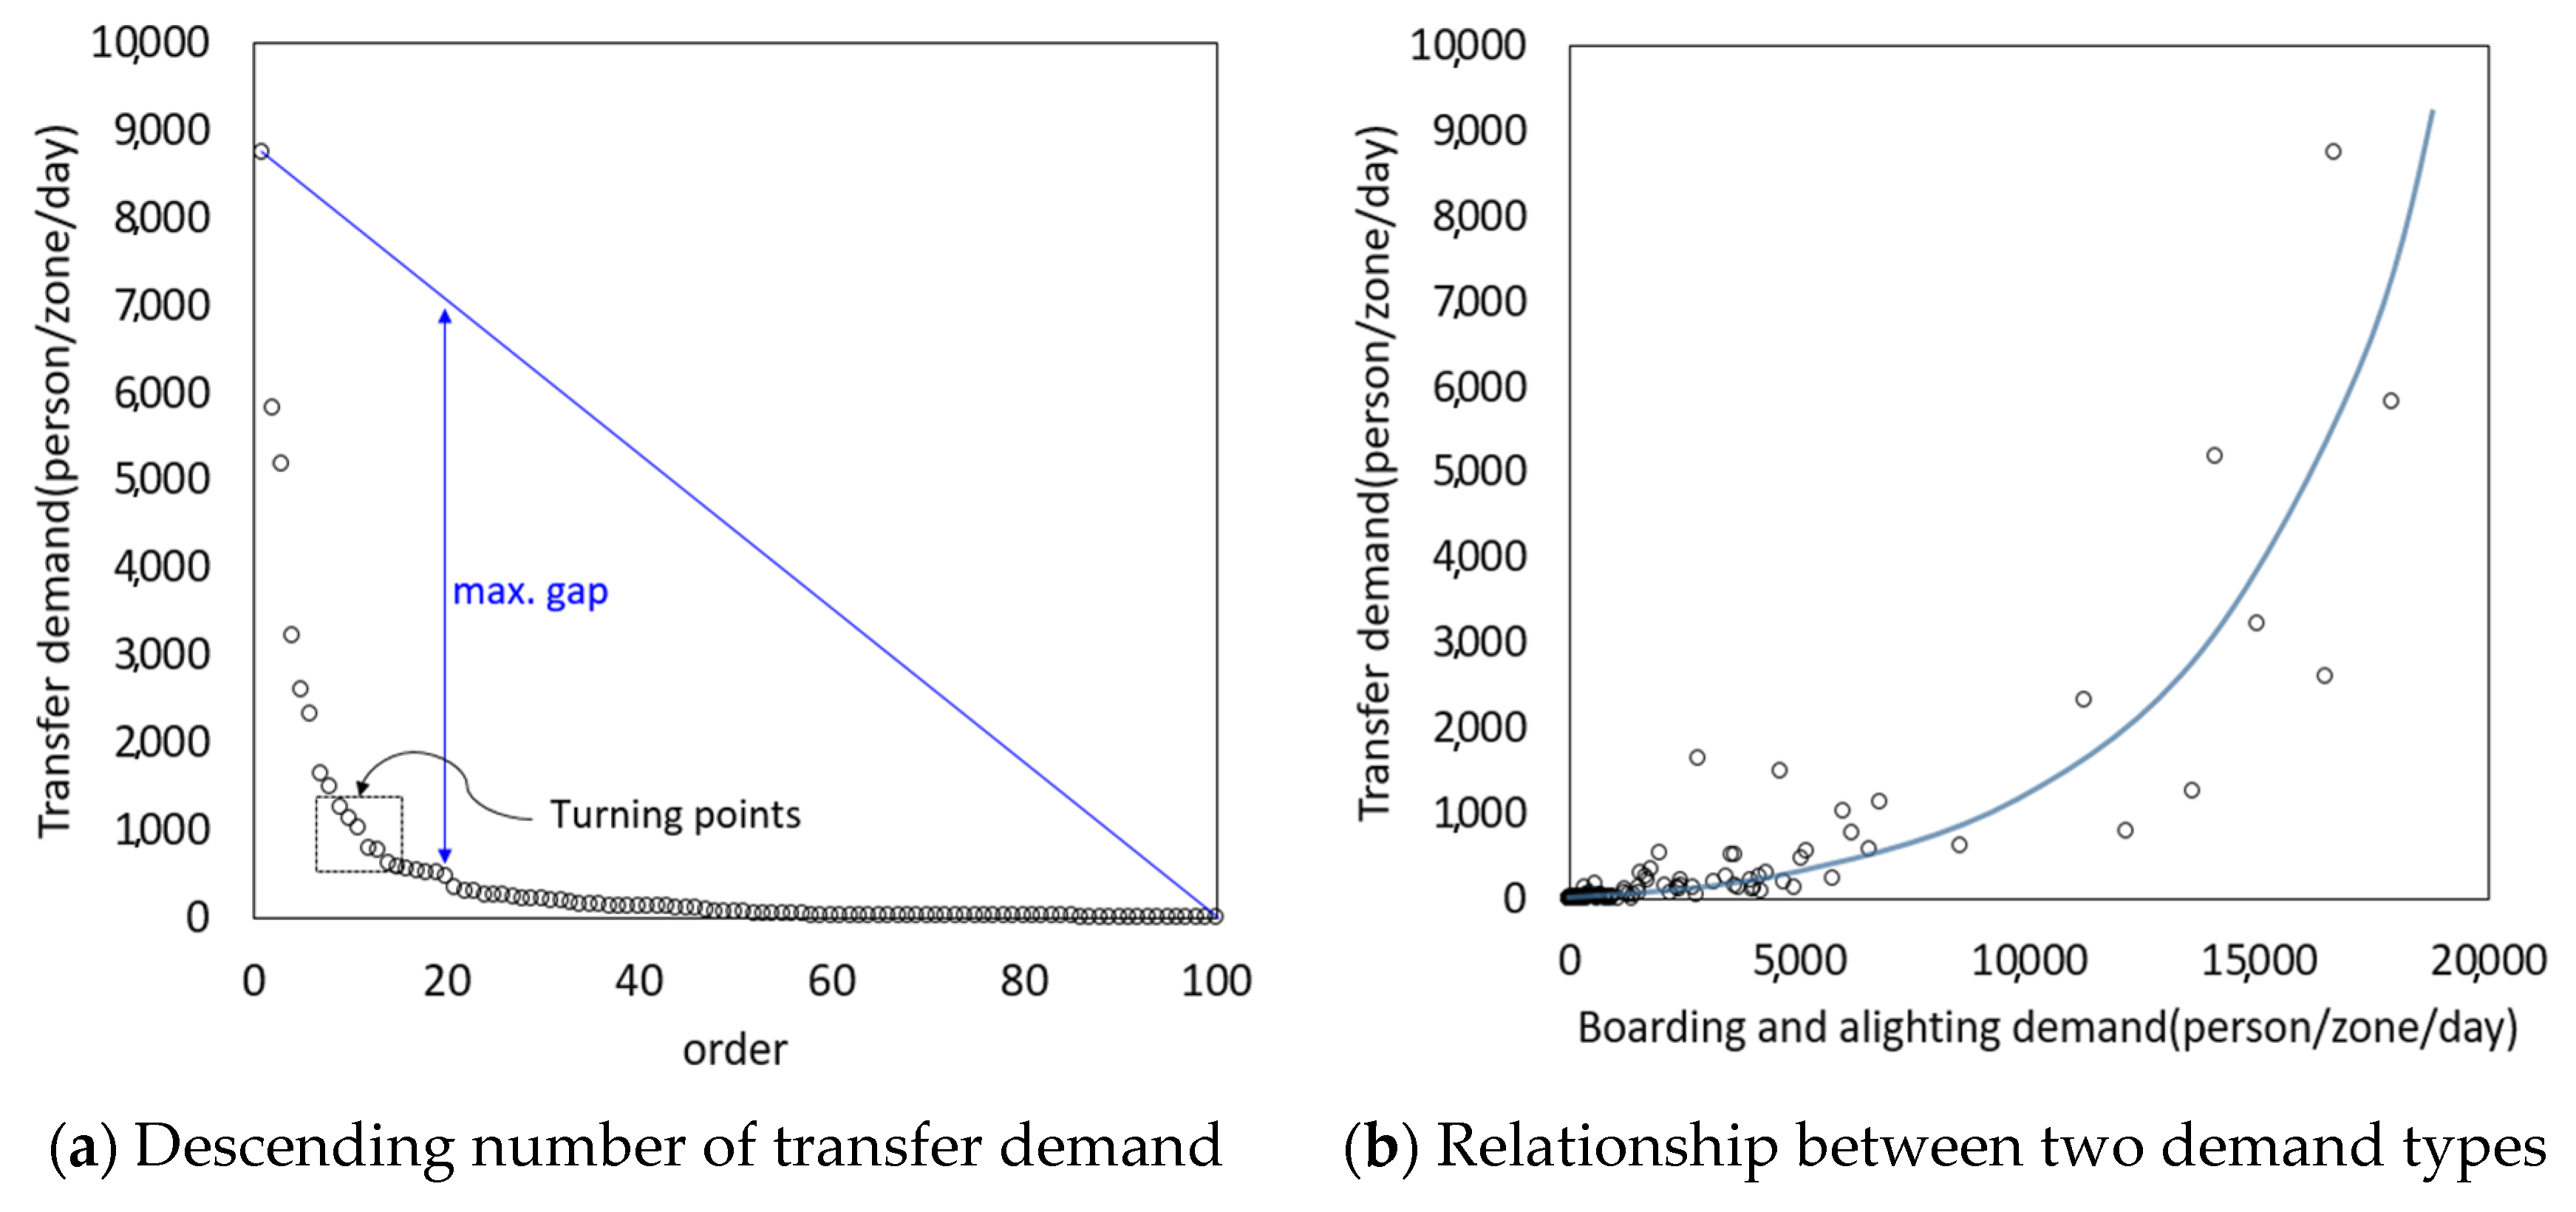
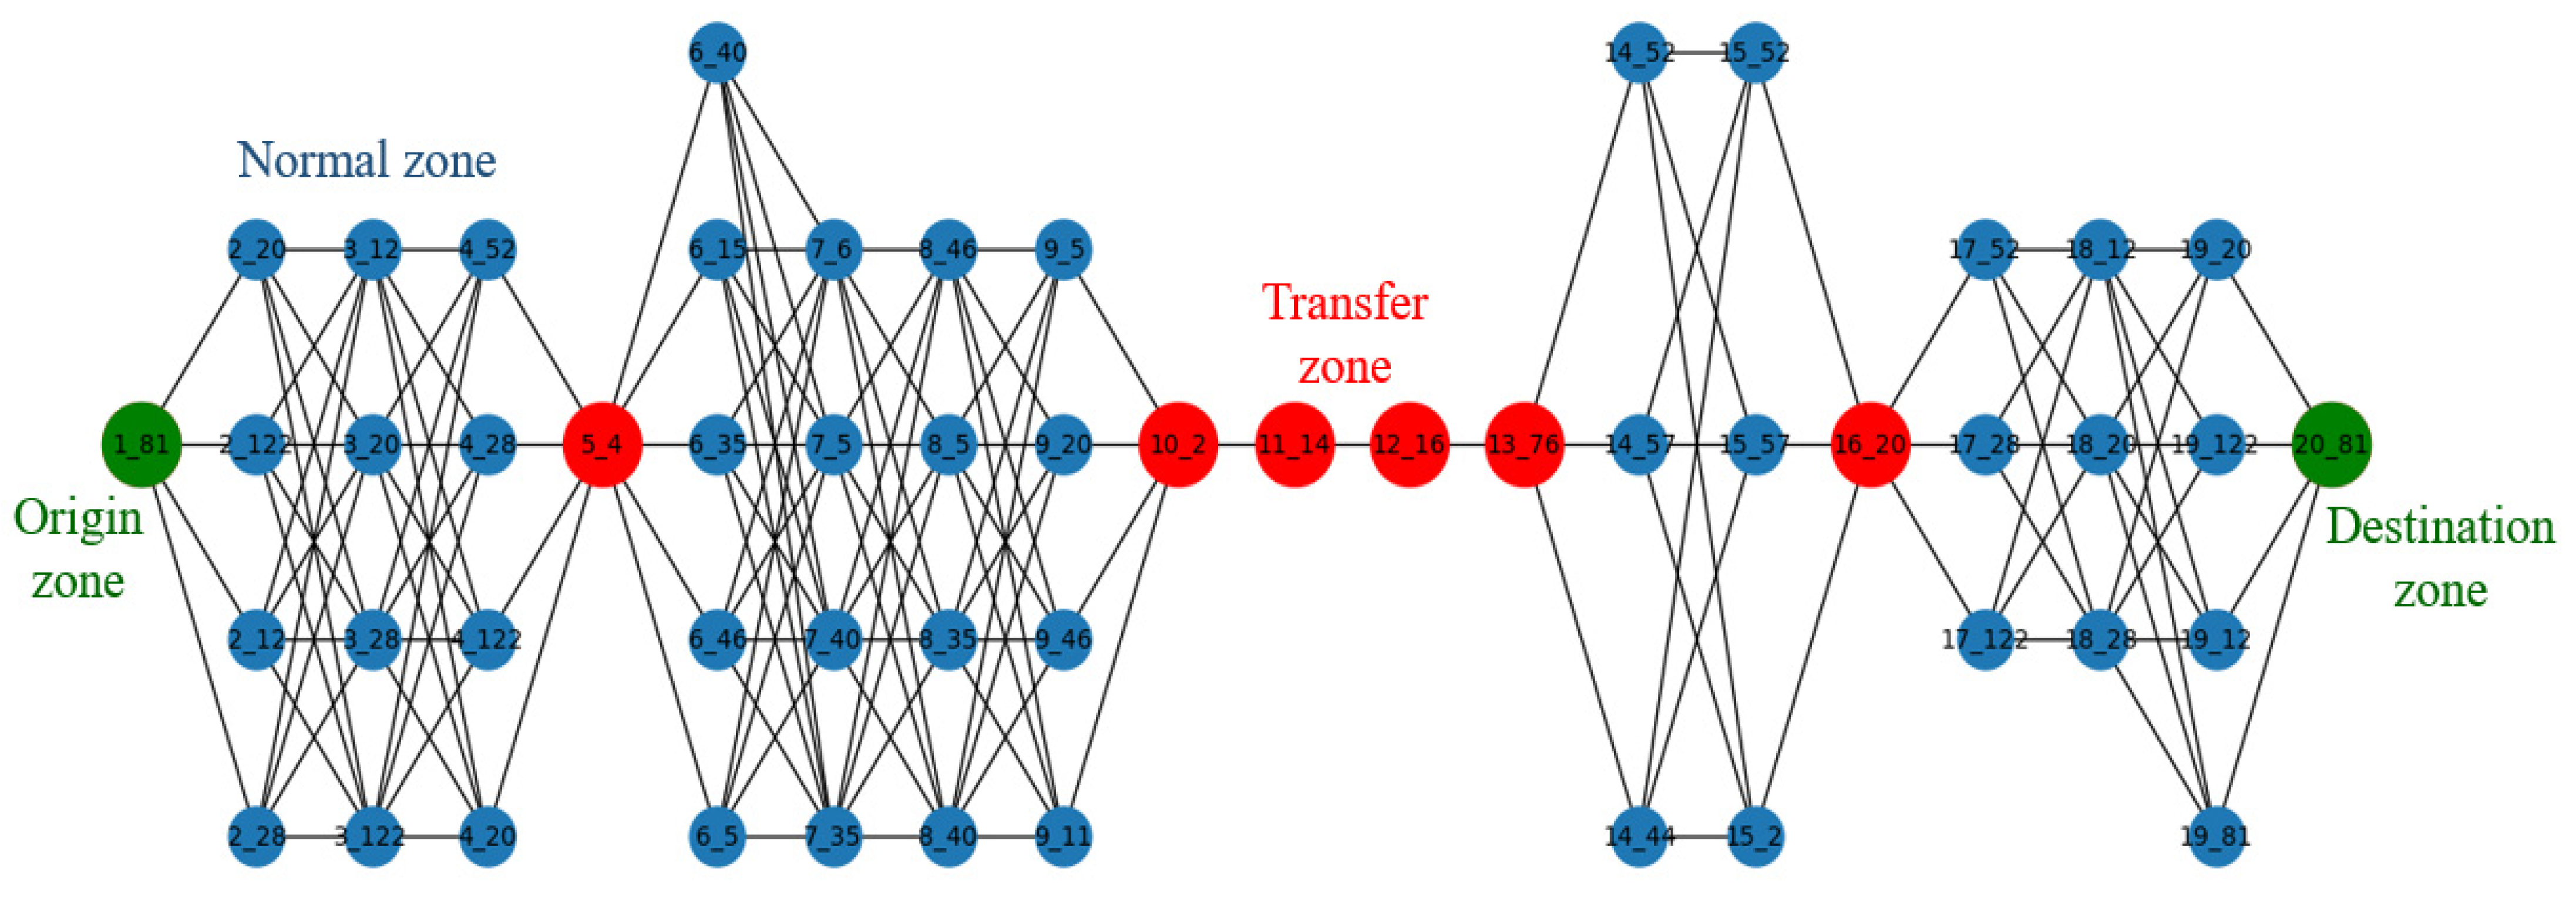
  • Once the general traffic zones are established through the above process, the transit traffic zones are determined using the transit demand generated by the bus stops located within the established traffic zones. The transit traffic zone concept introduced in this study is effective in deriving more reasonable bus route alternatives that account for transfers and connections with other bus routes while significantly reducing the number of possible bus routes with the BRS methodology. When designing and adjusting routes, it is not possible to account for all transfers that occur due to the intersection or partial overlap of routes, and routes are designed around transit stations. Therefore, transit zones are defined as traffic zones with high transit demand among general traffic zones. In addition, it is not possible to consider transfers in all traffic zones where transfers occurred at least once; so, it is necessary to select representative transit traffic zones.
If we sort the transfer performance of all stops within the traffic zone in descending order, the transfer performance shows an exponential decrease, as shown in Figure 2a. In order to select a transit zone, it is necessary to have certain criteria for transit demand or performance. The criteria can be considered in various ways, such as the political judgment of the analyst, mathematical criteria, and the convenience of transit in terms of service provision. In the mathematical criteria, i.e., the inflection points (Figure 2a), the problem of setting a small number of traffic zones as transit traffic zones arises; so, it is necessary to consider the transit convenience aspect and political judgment. In this study, we use the elbow method, which is widely used in the clustering field to determine the optimal number of clusters [32,33,34], to determine the boundaries of transit and general traffic zones. In the elbow method, the optimal number of clusters (i.e., the boundary in this study) is determined at the point where the distance between the extension line connecting the maximum and minimum values and the transit demand curve is maximized [35,36,37]. This technique has the advantage of considering transit comfort (from the perspective of bus users) rather than the criteria of mathematical inflection points.
However, for the planning stage, transit demand can be applied by estimating the population and employment of the general traffic zone and the number of trip-generating units in the assigned or built traffic zone (Figure 2b). In addition, by designing the bus route network with transit stations in mind at the bus route network design stage, the general traffic zone containing transit stations can be used as the transit traffic zone.

3.3. Candidate Bus Route Alternatives

Bus route decision is not just a matter of finding the shortest distance using link travel cost, but it is also a rational decision-making process to find the optimal route from the perspectives of consumers and suppliers. Therefore, this study proposes a bus route exploration methodology that explores all available alternatives for a given route, which consists of (a) creating a list of candidate traffic zones to visit and (b) a route combination method.
Before explaining how to explore bus route alternatives, we define a route traffic zone set ( Z ) consisting of N traffic zones ( z ) as Z = [ z 1 , z 2 , , z n , , z N ] , where Z is a route consisting of traffic zones established by the analyst (or set by the analyst) during the planning, design, or operation phase. A bus traffic zone ( z ) consists of a fixed visiting zone ( z f ) and a candidate visiting zone ( z g ). A fixed visiting zone consists of departure, arrival, and transfer zones, and a candidate visiting zone is defined as a traffic zone that can be replaced by another regular traffic zone.
From the perspective of route exploration, a candidate visiting zone can be replaced by a number of regular visiting zones (excluding fixed visiting zones) adjacent to the candidate visiting zone, which are connected to a given set of visiting zones ( Z ) to form different routes. In this study, we define the h number of traffic zones adjacent to the candidate visiting zone ( z g ) as the candidate visiting zone list ( z g , h ), z g , h = [ z g , 1 , z g , 2 , , z g , h ] . As an example of z g , h , h = 3 for the candidate visit zone z g = 6 is [ z 6,1 , z 6,2 , z 6,3 ] . z g , h selects all z j that satisfy the d g , j d g , h m a x condition using the spatial distance ( d g , j ) between the center of z g   and the center of the adjacent traffic zone ( z j ) and the maximum allowable spatial distance ( d g , h m a x , e.g., 1.5 km) to the adjacent traffic zone z g . Here, z g is included in z g , h because z j is not a fixed visit traffic zone and is d g , j = 0.0 between z g and z g .
Once the list ( z g , h ) of candidate visitation zones is created for candidate visitation zones ( z g ), all similar routes in the route network consisting of fixed visitation zones ( z f ) and z g , h can be explored using the route combination method. Route combination is performed by combining sub-routes to create a sub-route and then recombining the sub-routes. Sub-route combinations are built using the full z g , h connections that exist between z f .

3.4. Ranking Bus Routes

3.4.1. Choosing Evaluation Indicators

Evaluation metrics are needed to prioritize the I routes ( 1 , 2 , , i , , I ) examined by the route combination methodology proposed in this study. In this study, several metrics are set to consider both the provider side and the user side of the route bus service. The provider requires maximizing the operating revenue and minimizing the operating distance, while the user prefers minimizing the travel time along with the spatial accessibility of the bus service. In this study, we selected two evaluation indicators for the provider side and two for the user side, as follows.
The supply-side indicators are potential passengers ( P P i ) and route bend ( R C i , Kim et al., 2015 [1]), as shown in Equations (3) and (4). To calculate the indicators, we use the origin point bus traffic (person/day) between bus traffic zones. For the planning and design phase, the estimated ( r s ) traffic zone bus traffic can be applied. In the operation phase, you can aggregate and use the traffic zone traffic at the start and end points by using the location information of bus stops within the traffic zone and the traffic data of the traffic map.
P P i = r = 1 N i s = 1 N i P C i r , s D i         r , s
where P P i = potential passengers on route i   (people/day/km), P C i r , s = travel demand from traffic zone r to traffic zone s for route i   (person/day), r , s = members of the N i traffic zones that make up route i   ( 1 , 2 , , r , , s , , N i ), D i = the distance from the origin traffic zone to the destination traffic zone for route i   ( k m ) , and N i = the number of traffic zones that make up route i .
R C i = r = 1 N i 1 T D r i S D i         r
where R C i = the route curvature for route i , T D r i = the distance between the i th traffic zone and the ( r + 1 ) th traffic zone for route i , S D i = the straight-line distance between the origin and destination traffic zones for route i   k m , and N i = the number of traffic zones from the origin traffic zone to the destination traffic zone for route i .
The potential accessibility of bus service ( P A i ), which is the sum of the population and number of workers in a transportation zone, and traffic diversion ( T C i ) were selected as user-side indicators [1]. A high population and number of workers in a transportation zone means that the spatial accessibility of bus service is shorter (i.e., stop accessibility is relatively good) than in transportation zones with a low population and number of workers. Therefore, spatial accessibility can be measured by the cost of accessing bus service (e.g., time or distance) and the demand in the space within the accessibility threshold. In this study, we use potential accessibility [38,39,40,41], which is the number of people and workers within the maximum distance ( d z , c m a x ) from the center of the zone to the center of the cell that meets the accessibility threshold, as previously described in the transit zone zoning methodology.
P A i = r = 1 N i C P r i         r
where P A i = the potential accessibility of route i , C P r i = the sum of the socio-economic population and workers in the r th traffic zone of route i , and N i = the number of traffic zones from the origin traffic zone to the destination traffic zone for route i .
T C i = 1 U i u = 1 U i P T D u i P S D u i         u
where T C i = traffic detours for route i , P T D u i = the distance traveled by user u on route i , P S D u i = the linear distance traveled by user u on route i (   k m ) , u U i , and U i = the total number of users on route i .

3.4.2. Scoring Evaluation Indicators

The provider-side metrics, potential ridership ( P P i ), and route curvature ( R C i ) favor the provider with P P i →+∞ and R C i →+1.0. Also, the user-side indicators, potential accessibility of bus service ( P A i ), and traffic diversion ( T C i ) are favorable to the user with P A i →+∞ and T C i →+1.0. Therefore, for the indicators with indicator value → +∞ (i.e., P P i and P A i ), the indicator value → +maximum is 10 points and the indicator value → +minimum is 0 points, and for the indicators with indicator value → +1.0 (i.e., R C i and T C i ), the indicator value → +minimum is +10 points and the indicator value → +maximum is 0 points. Then, the two indicators were scored as S B I i for the provider side and U B I i for the user side, and the scoring of the two scores is defined by Equations (7) and (8). In addition, the weights for the indicators are set equally under the assumption that the relative importance is equal. The weights can also be set by the policy judgment of the practitioner.
S B I i = α × R P P i + ( 1 α ) × R R C i
where S B I i = the provider metric score for route i   ( 0.0 ~ 10.0 ) , R P P i ,   R R C i = P P i and R C i scoring metric values for route i   ( 0.0 ~ 10.0 ) , and α = the supply-side evaluation ratio (analyst parameter 0.5).
U B I i = w h e r e , β × R P A i + ( 1 β ) × R T C i
where U B I i = the user metric score for route i   ( 0.0 ~ 10.0 ) , R P A i ,   R T C i = P A i and T C i scoring metric values for route i   ( 0.0 ~ 10.0 ) , and β = the user-side evaluation ratio (analyst parameter 0.5).
S B I i and U B I i , described above, can be integrated and evaluated using Equations (7) and (8). M B I i is an evaluation score that considers both provider and user aspects, and the evaluation scores of the two optimized candidate routes can be used to rank alternative routes.
M B I i = γ × S B I i + ( 1 γ ) × U B I i
where M B I i = the multi-level metric score for route i   ( 0.0 ~ 10.0 ) , and γ = the multi-level evaluation ratio (analyst parameter 0.5).

4. Results and Discussions

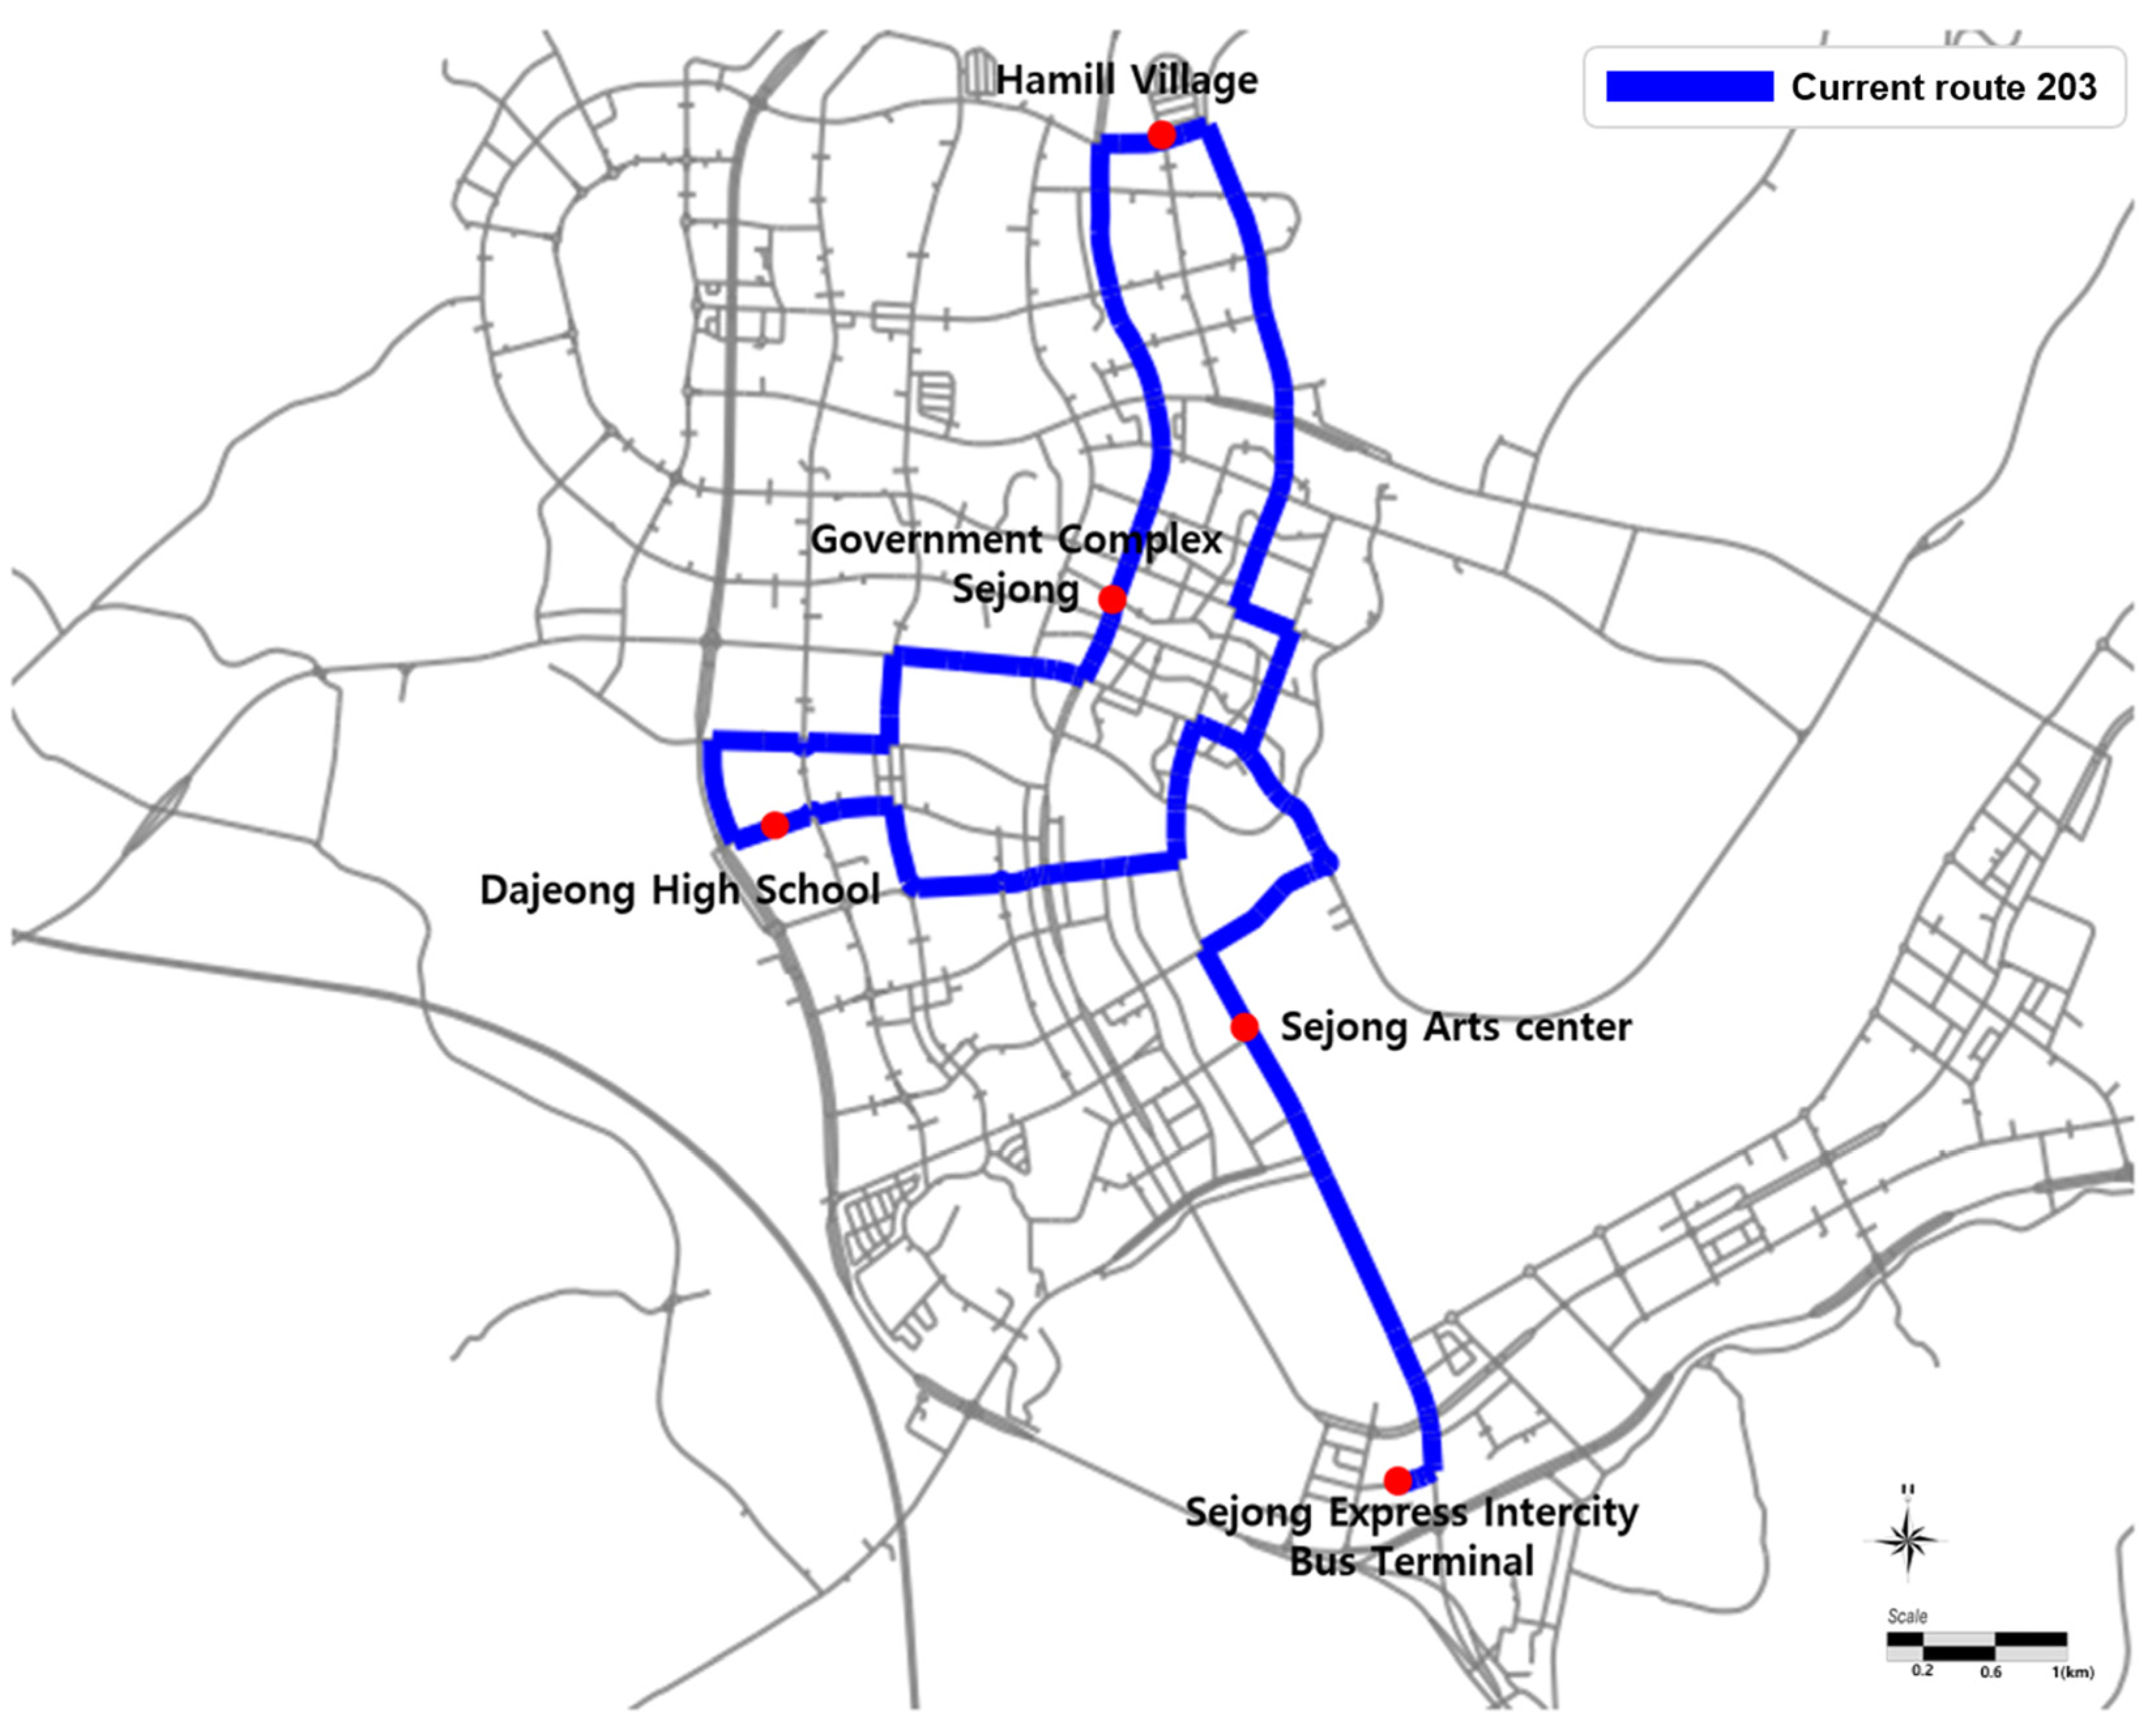
4.1. Evaluation Design and Bus Traffic Zoning

The application and evaluation of the proposed BRS methodology in this study were carried out by applying the BRS methodology to routes in operation and evaluating the improvement effect by deriving optimal route alternatives. The socio-economic indicator data for each unit spatial cell (100 m × 100 m) are the population and number of workers, and the population and number of workers are the population and number of workers of the statistical aggregation district (Statistics Korea, 2022) (Figure 3 and Figure 4). The bus route to be evaluated was Route 203, which is considered to be in need of adjustment for efficient operation among the routes operating in Sejong City, and had the lowest number of passengers among the currently operating routes (Figure 5). The destination bus route operates 57 times a day, with a frequency of 20 to 25 min and 30 bus stops. The origin–destination traffic (person/day) between the traffic zones of the target route and the transfer traffic (person/day) between traffic zones were analyzed using the origin–destination data of individual bus passengers collected by smart cards during the month of October 2022.
The parameters required by the proposed BRS methodology for the analysis are d z , c m a x   = 500 m, d g , h max   = 1.5 km, α   = 0.5, β   = 0.5, and γ   = 0.5. d z , c max = 500 m ensures the maximum approach distance from the center of the cell to the center of the traffic zone within 500 m, and d g , h m a x = 1.5 km ensures the detour route of the route within six urban planning blocks (0.5 km × 0.5 km). We set the parameter values as α = β = γ = 0.5, assuming that the relative dominance of the indicators is equal.
The results of the analysis of the central area of Sejong City, excluding counties and towns, using the number of people and workers per cell (100 m × 100 m), are shown in Figure 3 and Figure 4 (note: cells with no population and workers are excluded). There is a clear difference in land use characteristics (residential, business, commercial, and green), which indirectly implies that effective bus routes can be selected [42,43,44,45].
By applying the methodology proposed in this study to establish bus traffic zones, a total of 163 traffic zones were analyzed in the center of Sejong City (Figure 6). Among the analyzed traffic zones, 106 traffic zones where transfers occurred at least once were analyzed, and the transit traffic volume in the traffic zones ranged from 1 to 8750 (persons/day). By determining the transit traffic zones using the method proposed in this study, 20 transit traffic zones were identified, accounting for 87.3% (39,715) of the total transit traffic (45,599 persons/day). Nineteen transit zones comprised the target bus routes, and the number of bus stops within the transit zones ranged from one to three. Ridership (persons/day) in the transit zones ranged from 0.8 to 110.6 (mean 28.1 and SD 26.8) on weekdays and from 0.0 to 58.0 (mean 14.1 and SD 13.9) on weekends.

4.2. Results of the Bus Route Alternative Exploration Analysis

After analyzing the transit and general traffic zones of the target route, 8 fixed visit zones ( z f ), including departure, arrival, and transit zones, and 12 candidate visit zones ( z g ) were analyzed; the number of candidate visit zone lists ( z g , h ) of candidate visit zones ( z g ) ranged from 3 to 5 (Figure 7). Table 1 shows the types of traffic zones analyzed and their locations on the target bus routes. The total number of routes to be analyzed was 6,635,520 [ = ( 4 3 ) × ( 5 × 4 3 ) × ( 3 2 ) × ( 3 2 × 4 ) ] , and the evaluation of all individual routes was performed using the route evaluation methodology proposed in this study.

4.3. Analyzing the Metrics and Selecting the Best Alternative

The results of the evaluation index analysis of the above alternative routes from the provider’s and user’s perspectives are shown in Figure 6. In the case of the provider indicator, potential ridership ( P P ) and route curvature ( R C ) were found to be inversely related, and the current route was ranked in the upper-middle tier of the possible route combinations, with a potential ridership of 330.8 persons/day, while the route curvature was ranked at the bottom, with a value of 3.93. For the ridership indicators, potential accessibility ( P A ) and diversion degree ( T C ) were found to have a weak positive relationship, with a potential accessibility of 81,155 persons/day, ranking in the upper-middle tier of the possible route combinations, while a diversion degree of 1.79 ranked in the middle. These results suggest that it is possible to improve the evaluation indicators through route creation from both the provider’s and user’s perspectives.
The analysis of the evaluation scores for the provider side ( S B I , 0.0~10.0) and the user side ( U B I , 0.0~10.0) (Figure 8) showed that the S B I score of the target route was 8.83, which was ranked at the top (Figure 9a), while the U B I score was 7.13, which was ranked in the middle-to-top tier (Figure 9b); the difference between the evaluation scores was 0.7 (about 7%). These analysis results indicate that the target route is operated in a way that is suitable for both providers and users, but it has a route characteristic that is biased toward the requirements of providers rather than users (Figure 9c), which was ranked in the middle tier to the upper tier (Figure 9b), and the difference between the evaluation scores was 0.7 (about 7%).
S B I and U B I were close to the Epanechnikov and triangular distributions, respectively, and the distribution of S B I had a relatively large standard deviation compared to the distribution of U B I . This indicates that there are a large number of non-similar alternative paths when the middle and top alternative paths are selected using S B I . On the other hand, the number of paths for the middle and upper ranks using U B I is not as large as in the case of S B I . Therefore, it means that an alternative path that is in the upper-middle rank of U B I can satisfy the upper-middle rank of S B I , suggesting that there may be an optimal alternative path with S B I and U B I evaluation scores in the upper-middle rank.
Among the above route alternatives, the score analysis results for the route with the maximum comprehensive evaluation scores ( S B I and U B I ) from the provider and user aspects and the alternative route with the maximum comprehensive evaluation score ( M B I ), considering both aspects, are shown in Table 2. As a result of optimization based on S B I , the provider composite evaluation metric, S B I increased by 1.16, from 8.83 to 9.99, and had the best ranking, while U B I , the user composite evaluation metric, increased from 7.13 to 9.33. On the other hand, as a result of optimization based on U B I , S B I decreased by 2.44, from 8.83 to 6.40, falling into the medium-to-high range, while U B I , the user overall evaluation index, increased from 7.13 to 9.91, with the best ranking. To summarize the above analysis, it can be said that the optimal route selection from the bus service provider’s perspective ranks high in both the provider’s and user’s rankings, indicating that it can be an improved alternative to the current route for both the provider and the user. On the other hand, the optimal route choice from the user’s perspective means that it is not the optimal alternative for the provider when considering both aspects.
According to the analysis results (Table 2), the best alternative route is selected by the multi-level optimal overall evaluation score ( M B I , 0.0~10.0) considered from both the bus service provider’s and user’s perspectives, which shows a significant improvement of 2.22 (29.7%) from the current mid-to-high ranking score of 7.48 to the highest-ranking score of 9.70. It also shows an improvement of 0.04 (0.41%) and 1.54 (18.8%) over the M B I of 9.66 and 8.16 for the best alternative route from the provider’s and user’s perspectives, respectively. On the other hand, the S B I score of the best path from the provider’s perspective decreases slightly from 9.99 to the S B I score of the best path from the multi-level perspective of 9.50, and the U B I score of the best path from the user’s perspective decreases slightly from 9.91 to the U B I score of the best path from the multi-level perspective of 9.89, but in all cases, the best scores are above 9.50. The above analysis results indicate that it is possible to select a route that satisfies the indicators from both the bus service provider’s and the user’s perspectives by selecting the route combination.
Figure 10, Figure 11 and Figure 12 show the sketch results of the optimized alternative routes from the bus service provider’s, user’s, and multi-level perspectives. For the target route, the route overlap and route complexity are shown from the bus traffic zone’s perspective. Although there is no significant difference in the alternative routes between the provider and the user, the route from traffic zone 20 → 81 in user perspective optimization has a negative impact on the S B I score. In addition, for both optimal alternatives, route complexity seems to be unavoidable, which is inefficient in terms of providing, managing, and using bus services.
The alternative routes optimized from a multi-level perspective have a simpler shape, with no overlapping routes. Therefore, it is more efficient in terms of bus service provision, management, and utilization. In addition, the spatial coverage of the optimal route from the multi-level perspective is larger than the spatial coverage of the current route, the optimal route from the provider’s perspective, and the optimal route from the user’s perspective. This means that it is possible to reduce the number of routes in the bus route network and select effective routes from the perspectives of bus service providers and users.
The above sketch result has the advantage of selecting the best alternative route from the perspectives of bus service providers and users, and the effectiveness of the alternatives and the causes of inefficiency can be analyzed relatively intuitively and quickly in terms of socio-economic indicators, bus traffic zones, transfers, etc. Furthermore, it is suggested that once the best alternative sketch is determined, the design of detailed transit road sections and bus stops can be easily carried out.
The optimal route search tool for individual routes developed in this study is expected to enhance public transportation policies in the following ways:
First, it can be utilized to evaluate the appropriateness of existing routes. This tool evaluates routes by searching for nearby potential demand information zones based on the starting and ending points of an existing route. As the evaluation results consider both the supplier’s and user’s perspectives, it is anticipated that this tool can suggest improvement alternatives tailored to each demand.
Second, when introducing new bus routes, it can serve as a preliminary evaluation tool. Currently, new bus routes often undergo several adjustments after their introduction. The individual route optimal route search tool is expected to minimize the trial and error involved in determining such routes by acting as a preliminary evaluation method.

5. Conclusions

In this study, the Bus Route Sketch (BRS) methodology is proposed to select bus route alternatives in the planning and operation stages of local bus service and perform optimal evaluation from the perspectives of bus service providers and users. The proposed methodology is developed to intuitively and quickly determine the bus routes through route sketching, which consists of a methodology for setting bus traffic zones suitable for the provision and use of bus services, a methodology for exploring bus route alternatives through route combinations by considering transfers and connections and a methodology for ranking bus routes using multi-level evaluation indicators from the perspectives of bus service providers and users.
The BRS methodology consists of (1) establishing a proper transportation zone, (2) creating a bus operation route combination using the established transportation zone and route combination methodology, and (3) evaluating and ranking alternative routes using multiple evaluation indicators in terms of route bus service providers and users to design bus routes that can satisfy both providers and users.
By applying the proposed BRS methodology to bus route 203 in Sejong City, it was possible to establish a more reasonable traffic zone than the existing traffic zone in terms of bus service provision and utilization, derive a number of route alternatives considering the transit traffic zone, and derive the optimal route alternative that satisfies the requirements of bus service providers and users by using multi-level evaluation. Through the analysis that used multiple evaluation indicators from the provider’s and user’s perspectives, it was possible to determine the optimal alternatives that satisfy the multi-level requirements from the provider’s and user’s perspectives, and the determined route alternatives could be intuitively grasped through the sketching process. By applying the proposed methodology, the evaluation score improved from 8.83 to 9.50 from the supplier’s point of view, and the evaluation score improved from 7.13 to 9.89 from the user’s point of view.
In addition, it was partially confirmed that it is possible to design effective routes from the perspectives of bus service providers and users while reducing the number of routes in the bus route network. Therefore, it is expected that the BRS methodology proposed in this study will be effectively used in route planning practice to evaluate the adequacy of routes in operation, adjust routes, and select appropriate routes in the planning stage.
In the future, research is needed to enhance the BRS methodology developed in this study. First, it is essential to re-evaluate the performance indicators from the perspectives of both bus service providers and users. This involves identifying additional indicators beyond those currently presented. From the user’s viewpoint, indicators like travel time (access time, waiting time, and in-vehicle travel time), safety, comfort, and convenience should be considered. From the supplier’s perspective, additional indicators, such as cost-effective operation, cost savings, social public interest, and social benefits, should be incorporated.
Furthermore, it is crucial to verify the methodology on routes in regions with diverse socio-economic indicators and spatial characteristics beyond Sejong City. This study’s focus on new cities necessitates examining its applicability to outer cities and mixed urban–rural areas. Practical usability should be enhanced through verification results that consider spatial similarities and dissimilarities, such as road networks and population composition.
Additionally, since this methodology focused on designing individual bus routes, it did not address the optimization of the city’s overall public transportation network. To design an optimal urban bus route system, an advanced methodology that integrates route systems by region (wide area, trunk line, branch line, and village bus) and individual routes is required. This necessitates continuous research on route design methodologies in the future.

Author Contributions

Conceptualization, J.J.; Methodology, J.J.; Software, Y.C.; Formal analysis, Y.C.; Writing—review & editing, J.P.; Visualization, Y.C.; Supervision, J.P. All authors have read and agreed to the published version of the manuscript.

Funding

This research received no external funding.

Institutional Review Board Statement

Not applicable.

Informed Consent Statement

Not applicable.

Data Availability Statement

Data are contained within the article.

Conflicts of Interest

The authors declare no conflict of interest.

References

  1. Kim, K.T.; Lee, I.M.; Kwak, H.C.; Min, J.H. An Evaluation of curvature for bus lines using smart card data in Seoul. Seoul Urban Res. 2015, 16, 113–122. [Google Scholar]
  2. Lee, S.Y.; Park, K.A. Quantitative evaluation indicators for the city bus route network. J. Korea Soc. Transp. 2003, 21, 29–44. [Google Scholar]
  3. Faghihinejad, F.; Zoghifard, M.M.; Amiri, A.M.; Monajem, S. Evaluating social and spatial equity in public transport: A case study. Transp. Lett. 2023, 15, 1420–1429. [Google Scholar] [CrossRef]
  4. Yang, S.K.; Chang, H.B. Development and application of social equity indicators for evaluation of bus networks. J. Korea Inst. Intell. Transp. Syst. 2016, 15, 24–35. [Google Scholar] [CrossRef]
  5. Yao, D.; Xu, L.; Li, J. Evaluating the performance of public transit systems: A case study of eleven cities in China. Sustainability 2019, 11, 3555. [Google Scholar] [CrossRef]
  6. Kim, S.H.; Sim, T.I. The Analysis of efficiency for the city bus route operation using DEA: Focused on Suwon city. J. Korea Soc. Transp. 2021, 39, 264–279. [Google Scholar] [CrossRef]
  7. Lao, Y.; Liu, L. Performance evaluation of bus lines with data environment analysis and geographic information systems. Comput. Environ. Urban Syst. 2009, 33, 247–255. [Google Scholar] [CrossRef]
  8. Litman, T. Evaluating transportation equity. World Transp. Policy Pract. 2005, 8, 50–65. [Google Scholar] [CrossRef]
  9. Lee, S.J.; Choi, J.S.; Baek, H.S. A Study on the optimal urban bus network design using the set covering theory. J. Korea Soc. Transp. 1999, 17, 137–147. [Google Scholar]
  10. Park, C.G.; Cho, S.K. A Study on the optimization of Suwon city bus route using GWR model. J. Korean Soc. Geospat. Inf. Syst. 2014, 22, 41–46. [Google Scholar] [CrossRef]
  11. Lee, Y.J. Optimizing Express Bus Route and Operation Scheme with Smart Card Travel Data. Ph.D. Dissertation, Ajou University, Suwon, Republic of Korea, 2016. [Google Scholar]
  12. Boghani, A.B.; Kimble, E.W.; Spencer, E.E. Can Telecommunications Help Solve America’s Transportation Problem? A Multiclient Study; Arthur D. Little, Inc.: Cambridge, MA, USA, 1991. [Google Scholar]
  13. Alterkawi, M.M. A computer simulation analysis for optimizing bus stops spacing: The case of Riyadh, Saudi Arabia. Habitat Int. 2006, 30, 500–508. [Google Scholar] [CrossRef]
  14. Kimpel, T.J.; Dueker, K.J.; El-Geneidy, A.M. Using GIS to measure the effect of overlapping service areas on passenger boardings at bus stops. URISA J. 2007, 19, 5–11. [Google Scholar]
  15. Wuhan Transportation Annual Report 2012 (Blue Book); Wuhan Transport Planning Institute: Wuhan, China, 2012.
  16. Mangla, M.; Akhare, R.; Ambarkar, S. Implementing genetic algorithm to solve facility location problem. Int. Res. J. Eng. Technol. 2015, 2, 781–784. [Google Scholar]
  17. Murray, A.T. A Coverage Model for Improving Public Transit System Accessibility and Expanding Access. Ann. Oper. Res. 2003, 123, 143–156. [Google Scholar] [CrossRef]
  18. Pulugurtha, S.S.; Agurla, M. Assessment of Models to Estimate Bus-Stop Level Transit Ridership using Spatial Modeling Methods. J. Public Transp. 2012, 15, 33–52. [Google Scholar] [CrossRef]
  19. Andres, M.; Nair, R. A predictive-control framework to address bus bunching. Transp. Res. B Methodol. 2017, 104, 123–148. [Google Scholar] [CrossRef]
  20. Arriagada, J.; Gschwender, A.; Gschwender, M.A.; Munizaga, M.T. Modeling bus bunching using massive location and fare collection data. J. Intell. Transp. Syst. 2019, 23, 332–344. [Google Scholar] [CrossRef]
  21. Chow, L.F.; Zhao, F.; Liu, X.; Li, M.T.; Ubaka, I. Transit ridership model based on geographically weighted regression. Transp. Res. Rec. 2006, 1972, 105–114. [Google Scholar] [CrossRef]
  22. Fotheringham, A.S.; Brunsdon, C.; Charlton, M. Geographically Weighted Regression: The Analysis of Spatially Varying Relationships; John Wiley & Sons: Hoboken, NJ, USA, 2002; ISBN 978-0-471-49616-8. [Google Scholar]
  23. Tu, W.; Cao, R.; Yue, Y.; Zhou, B.; Li, Q.; Li, Q. Spatial variations in urban public ridership derived from GPS trajectories and smart card data. J. Transp. Geogr. 2018, 69, 45–57. [Google Scholar] [CrossRef]
  24. Wang, C.; Ye, Z.; Wang, W. A Multi-objective optimization and hybrid heuristic approach for urban bus route network design. IEEE Acess 2020, 8, 12154–12167. [Google Scholar] [CrossRef]
  25. Guerra, E.; Cervero, R.; Tischler, D. Half-mile circle: Does it best represent transit station catchments? Transp. Res. Rec. 2012, 2276, 101–109. [Google Scholar] [CrossRef]
  26. Zhao, F.; Chow, L.F.; Li, M.T.; Ubaka, I.; Gan, A. Forecasting Transit Walk Accessibility-Regression Model Alternative to Buffer Method. Transp. Res. Rec. 2003, 1835, 34–41. [Google Scholar] [CrossRef]
  27. Dill, J. The effect of neighborhood design on public transit use: A case study of San Francisco. Transp. Res. Part A Policy Pract. 2003, 37, 1–19. [Google Scholar]
  28. Lee, K.T.; Kim, I.K.; Shim, J.Y.; Kim, J.H. Improvement of Zone-based Regional Transportation Mode Choice Model Reflecting Behavioral Difference by Travel Distance. J. Korean Soc. Transp. 2020, 38, 346–360. [Google Scholar] [CrossRef]
  29. Tang, J.; Xu, L.; Luo, C.; Ng, T.S.A. Multi-disruption resilience assessment of rail transit systems with optimized commuter flows. Reliab. Eng. Syst. Saf. 2021, 214, 107715. [Google Scholar] [CrossRef]
  30. Javid, M.A.; Ali, N.; Hussain Shah, S.A.; Abdullah, M. Travelers’ attitudes toward mobile application–based public transport services in Lahore. Sage Open 2021, 11, 2158244020988709. [Google Scholar] [CrossRef]
  31. Oda, Y.; Fudaba, H.; Neubig, G.; Hata, H.; Sakti, S.; Toda, T.; Nakamura, S. Learning to generate pseudo-code from source code using statistical machine translation. In Proceedings of the 2015 30th IEEE/ACM International Conference on Automated Software Engineering (ASE), Lincoln, NE, USA, 9–13 November 2015; pp. 574–584. [Google Scholar]
  32. Thorndike, R.L. Who belongs in the family? Psychometrika 1953, 18, 267–276. [Google Scholar] [CrossRef]
  33. Syakur, M.A.; Khotimah, B.K.; Rochman, E.M.S.; Satoto, B.D. Integration K-means clustering method and elbow method for identification of the best customer profile cluster. IOP Conf. Ser. Mater. Sci. Eng. 2018, 335, 012017. [Google Scholar] [CrossRef]
  34. Liu, F.; Deng, Y. Determine the number of unknown targets in open World based on Elbow method. IEEE Trans. Fuzzy Syst. 2021, 29, 986–995. [Google Scholar] [CrossRef]
  35. Chang, H.H.; Lee, S.B.; Han, D.H.; Lee, Y.I. Methodology for estimation of link travel time using density-based disaggregated approach. J. Korea Inst. Intell. Transp. Syst. 2017, 16, 134–143. [Google Scholar] [CrossRef]
  36. Dion, F.; Rakha, H. Estimating dynamic roadway travel times using automatic vehicle identification data for low sampling rates. Transp. Res. Part B 2006, 40, 745–766. [Google Scholar] [CrossRef]
  37. Mouskos, K.C.; Niver, E.; Pignataro, L.J.; Lee, S.; Antoniou, N. TRANSMIT System Evaluation: Final Report; Institute for Transportation, New Jersey Institute of Technology: Newark, NJ, USA, 1998. [Google Scholar]
  38. Claire, P.; Dupont-Kieffer, A.; Palmier, P. Potential Accessibility to the Workplace by Public Transit and Its Social Distribution in Lille, France: A Scenario-Based Equity Appraisal. Transp. Policy 2022, 125, 256–266. [Google Scholar] [CrossRef]
  39. Banister, D. Unsustainable Transport; Routledge: London, UK, 2005; pp. 124–128. [Google Scholar]
  40. Maria, V.C.; Nicola, F. A Methodology to Evaluate Accessibility to Bus Stops as a Contribution to Improve Sustainability in Urban Mobility. Sustainability 2019, 11, 803. [Google Scholar] [CrossRef]
  41. Sun, C.; Quan, W. Evaluation of bus accessibility based on hotspot detection and matter-element analysis. IEEE Access 2020, 8, 138800–138809. [Google Scholar] [CrossRef]
  42. Handy, S. Regional Versus Local Accessibility: Implications for Nonwork Travel. In Transportation Research Record 1400; UCTC No. 234; National Research Council: Washington, DC, USA, 1993; pp. 58–66. [Google Scholar]
  43. Chapman, R.A.; Gault, H.E.; Jenkins, I.A. The Operation of ürban Bus Routes. Traffic Eng. Control 1977, 18, 364–367. [Google Scholar]
  44. Lownes, N.E.; Machemehl, R.B. Exact and heuristic methods for public transit circulator design. Transp. Res. Part B Methodol. 2010, 44, 309–318. [Google Scholar] [CrossRef]
  45. Saeed, K.; Kurauchi, F. Design of multimodal transit services with stochastic demand. Int. J. Transp. 2017, 5, 1–16. [Google Scholar] [CrossRef]
Figure 1. Flowchart of the proposed methodology.
Sustainability 16 07172 g001
Figure 2. Characteristics of transfer demand.
Sustainability 16 07172 g002
Figure 3. Spatial distributions of socio-economic data—population (person/cell).
Sustainability 16 07172 g003
Figure 4. Spatial distributions of socio-economic data—employee (person/cell).
Sustainability 16 07172 g004
Figure 5. Bus transportation zoning and target bus line—target bus line.
Sustainability 16 07172 g005
Figure 6. Bus transportation zoning and target bus line—the result of bus transportation zoning.
Sustainability 16 07172 g006
Figure 7. Analysis result of the network structure for the target bus route.
Sustainability 16 07172 g007
Figure 8. Relationships between performance measures.
Sustainability 16 07172 g008
Figure 9. Distributions of evaluation scores.
Sustainability 16 07172 g009
Figure 10. Optimization results of bus route sketch—provider.
Sustainability 16 07172 g010
Figure 11. Optimization results of bus route sketch—user.
Sustainability 16 07172 g011
Figure 12. Optimization results of bus route sketch—SBIs and UBIs.
Sustainability 16 07172 g012
Table 1. Analysis results for the bus transportation zone.
Visit OrderZone TypeTitle 3
FixedVisiting Zone CandidateVisiting Zone Candidate List
181--Sustainability 16 07172 i001
2-2820, 122, 12, 28
3-12212, 20, 28, 122
4-2052, 28, 122, 20
54--
6-540, 15, 35, 46, 5
7-356, 5, 40, 35
8-4046, 5, 35, 40
9-115, 20, 46, 11
102--
1114--
1216--
1376--
14-4452, 57, 44
15-252, 57, 2
1620--
17-12252, 28, 122
18-2812, 20, 28
19-1220, 122, 81, 12
2081--
Table 2. Summary of estimated performance measures.
StakeholdersPerformance MeasuresAs-isOptimized by
Provider (SBI)User (UBI)Multi-Level (MBI)
ProviderPP330.80375.74336.80349.95
RC3.933.203.683.61
SBI8.839.996.409.50
UserPAD81,15569,84284,04984,100
TC1.791.311.401.43
UBI7.139.339.919.89
Multi-levelMBI7.489.668.169.70
Disclaimer/Publisher’s Note: The statements, opinions and data contained in all publications are solely those of the individual author(s) and contributor(s) and not of MDPI and/or the editor(s). MDPI and/or the editor(s) disclaim responsibility for any injury to people or property resulting from any ideas, methods, instructions or products referred to in the content.

