Article

Spatial Distribution Characteristics of Leisure Urban Spaces and the Correlation with Population Activity Intensity: A Case Study of Nanjing, China

by
Xinyang Li
,
Marek Kozlowski
*,
Sumarni Binti Ismail
and
Sarah Abdulkareem Salih
Department of Architecture, Faculty of Design and Architecture, Universiti Putra Malaysia (UPM), Serdang 43400, Malaysia
*
Author to whom correspondence should be addressed.
Sustainability 2024, 16(16), 7160; https://doi.org/10.3390/su16167160
Submission received: 10 July 2024 / Revised: 13 August 2024 / Accepted: 18 August 2024 / Published: 21 August 2024

Abstract

:
The spatial distribution of Leisure Urban Spaces (LUSs) is closely linked to urban sustainability and residents’ quality of life. This study uses the Central Urban Area of Nanjing as the study area. Using POI and AOI data, the locations of LUS were precisely identified and categorized, including parks, squares, waterfront spaces, and leisure blocks. GIS spatial analysis methods, the nearest neighbor index, standard deviation ellipse, and kernel density estimation were used to analyze these spaces’ form, directivity, and density. Population activity intensity (PAI) data at various time points, collected by Baidu heat map, are correlated with LUS distribution through multiple linear regression analysis. (1) Parks and squares exhibit significant clustering tendencies, whereas waterfront spaces show weaker clustering, and leisure blocks are randomly distributed; (2) The central points of all types of LUS are located in the city center, extending from southeast to northwest, with parks and squares offering a broader range of services; (3) The overall LUS layout shows a ‘core and multiple points’ structure, with varying density patterns across different spaces, indicating concentrated and dispersed leisure areas; (4) The correlation between LUS distribution and PAI strengthens throughout the day and is greater on weekends than weekdays. Leisure blocks significantly enhance activity intensity, while parks have a limited effect, and waterfront spaces often show a negative correlation due to their remote locations. These results provide insights for future urban planning in Nanjing and underscore patterns in residents’ leisure activities.

1. Introduction

Leisure is considered a core function of urban spaces, reflecting the level of urban life quality [1]. As living standards improve and lifestyles evolve, the demand for urban leisure has significantly increased, becoming a crucial component of modern life. Leisure urban spaces (LUSs) are not only vital components of the urban ecological and social systems, but their effective allocation also indicates a city’s environmental, social, and economic development level [2]. These spaces provide venues for entertainment and social interaction and play a critical role in enhancing urban vitality [3,4], improving residents’ health and well-being [5,6], and strengthening social cohesion [7,8]. However, despite the gradual improvement of public services, the distribution of services enjoyed by residents remains highly uneven, with significant disparities in leisure service provision between different regions and urban–rural areas [9]. Therefore, studying the spatial distribution characteristics of LUS is crucial for identifying potential planning issues, promoting reasonable facility layout, and improving residents’ quality of life.
Analyzing the spatial distribution of urban spaces not only aids in understanding urban forms but also addresses real social issues such as social justice. Specifically, equitable spatial distribution can alleviate socioeconomic segregation in cities and, by ensuring that different social groups have access to high-quality leisure facilities, can enhance the quality of life for all residents [10]. Notably, existing studies often limit themselves to the spatial distribution analysis of single types of leisure facilities, such as parks [11,12], tourist attractions [13,14], cultural facilities [15,16], and sports venues [17]. Overall, comprehensive studies on urban spaces with leisure functions are relatively scarce, especially in regions with well-developed leisure services like Nanjing. Therefore, a thorough understanding and categorization of the functions of LUS are essential for effectively utilizing these resources to meet broad societal needs. By examining the commonalities and differences in the distribution of different leisure urban spaces, one can reveal some regional characteristics of leisure in the city.
According to the “Classification and Requirements for Urban Public Leisure Spaces” (GB/T31171-2014) issued in China, Chinese leisure urban spaces are categorized into specialized public leisure spaces and comprehensive public leisure spaces [18]. This paper focuses on comprehensive public leisure spaces with a welfare-oriented approach, considering them more representative and capable of showcasing the current state and diversity of activities in China’s leisure spaces. Therefore, based on previous research, Chinese LUS can essentially be summarized as parks, squares, waterfront spaces, and leisure blocks. These four types of leisure urban spaces have distinct characteristics and functions. Parks emphasize ecological and entertainment facilities [19]; squares, often surrounded by buildings, serve as social hubs [20]; waterfront spaces combine natural and artificial elements, offering leisure options around water bodies [21]; and leisure blocks concentrate on cultural, retail, and dining activities, prioritizing pedestrian comfort [22].
With rapid technological advancements, tools such as Geographic Information Systems (GISs), big data analytics, and social media data have significantly enhanced the precision and depth of urban space studies. Primary research directions include using geographic spatial information described in maps through Point of Interest (POI) or Area of Interest (AOI) data to analyze urban structures [13,15,17] and identify urban functional zones [23,24]. Additionally, data related to human activity, such as remote sensing data [25,26], GPS trajectory data [27], mobile signaling data [28,29], and Baidu heat map data [30,31], are used to analyze the spatiotemporal behavior of urban populations. Some studies also utilize user reviews on social media platforms to reveal urban activities’ spatiotemporal dynamics and behavioral preferences [32,33].
Although big data analysis has been widely applied to study urban spatial structures and the behavioral characteristics of urban residents, research on the dynamic spatiotemporal relationship between the distribution of LUS and the PAI remains limited. The study emphasizes the importance of researching urban population density distribution due to the complexity of the urban internal structure [34]. An in-depth analysis of the distribution of population activity intensity (PAI) helps reveal residents’ movement and activity patterns within urban spaces, providing new perspectives on urban residents’ leisure activities and lifestyles [35]. Therefore, by analyzing the relationship between the distribution of LUS and the PAI, it is possible not only to understand how residents utilize these spaces but also to identify which areas are deficient in leisure facilities, thus guiding future urban planning and resource allocation to ensure that the optimized layout of leisure facilities meets the needs of all residents.
This study explores the distribution characteristics of LUS and their relationship with the PAI. Utilizing Point of Interest (POI) and Area of Interest (AOI) data, along with social media platforms, the study verifies the location information of various LUSs and analyzes their distribution characteristics through GIS. Furthermore, given the timeliness and extensive coverage of Baidu heat map data, the research employs a multivariate linear regression analysis to examine the relationship between the distribution of LUSs and PAI. The findings from this study are intended to provide a scientific basis for urban planning, promote sustainable urban development, and enhance the quality of life for residents.

2. Materials and Methods
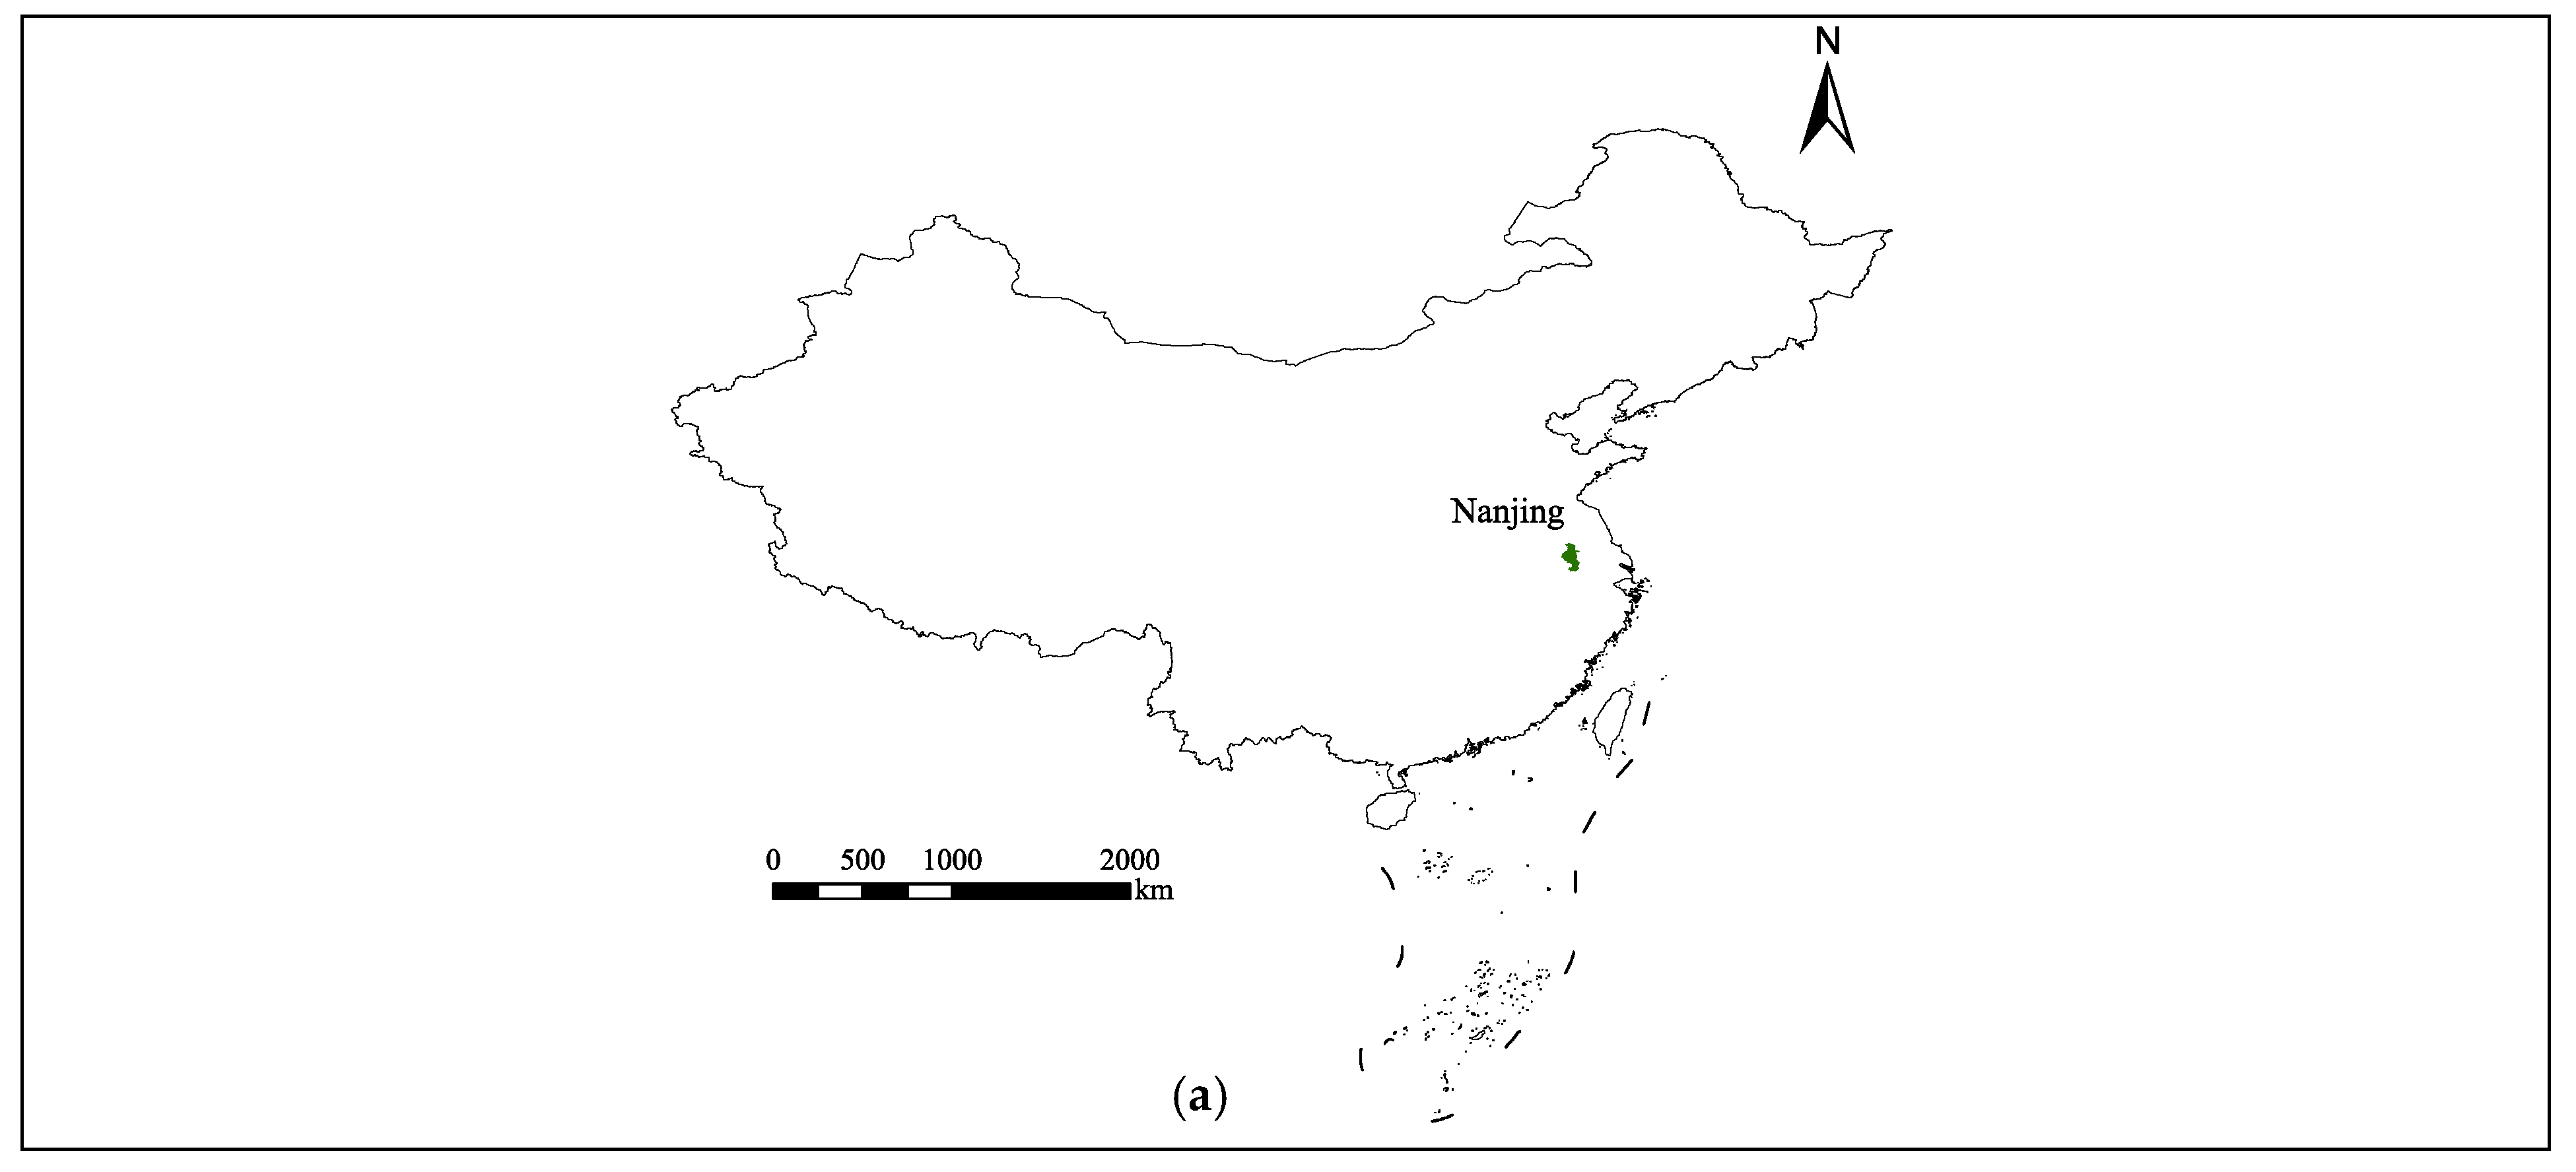
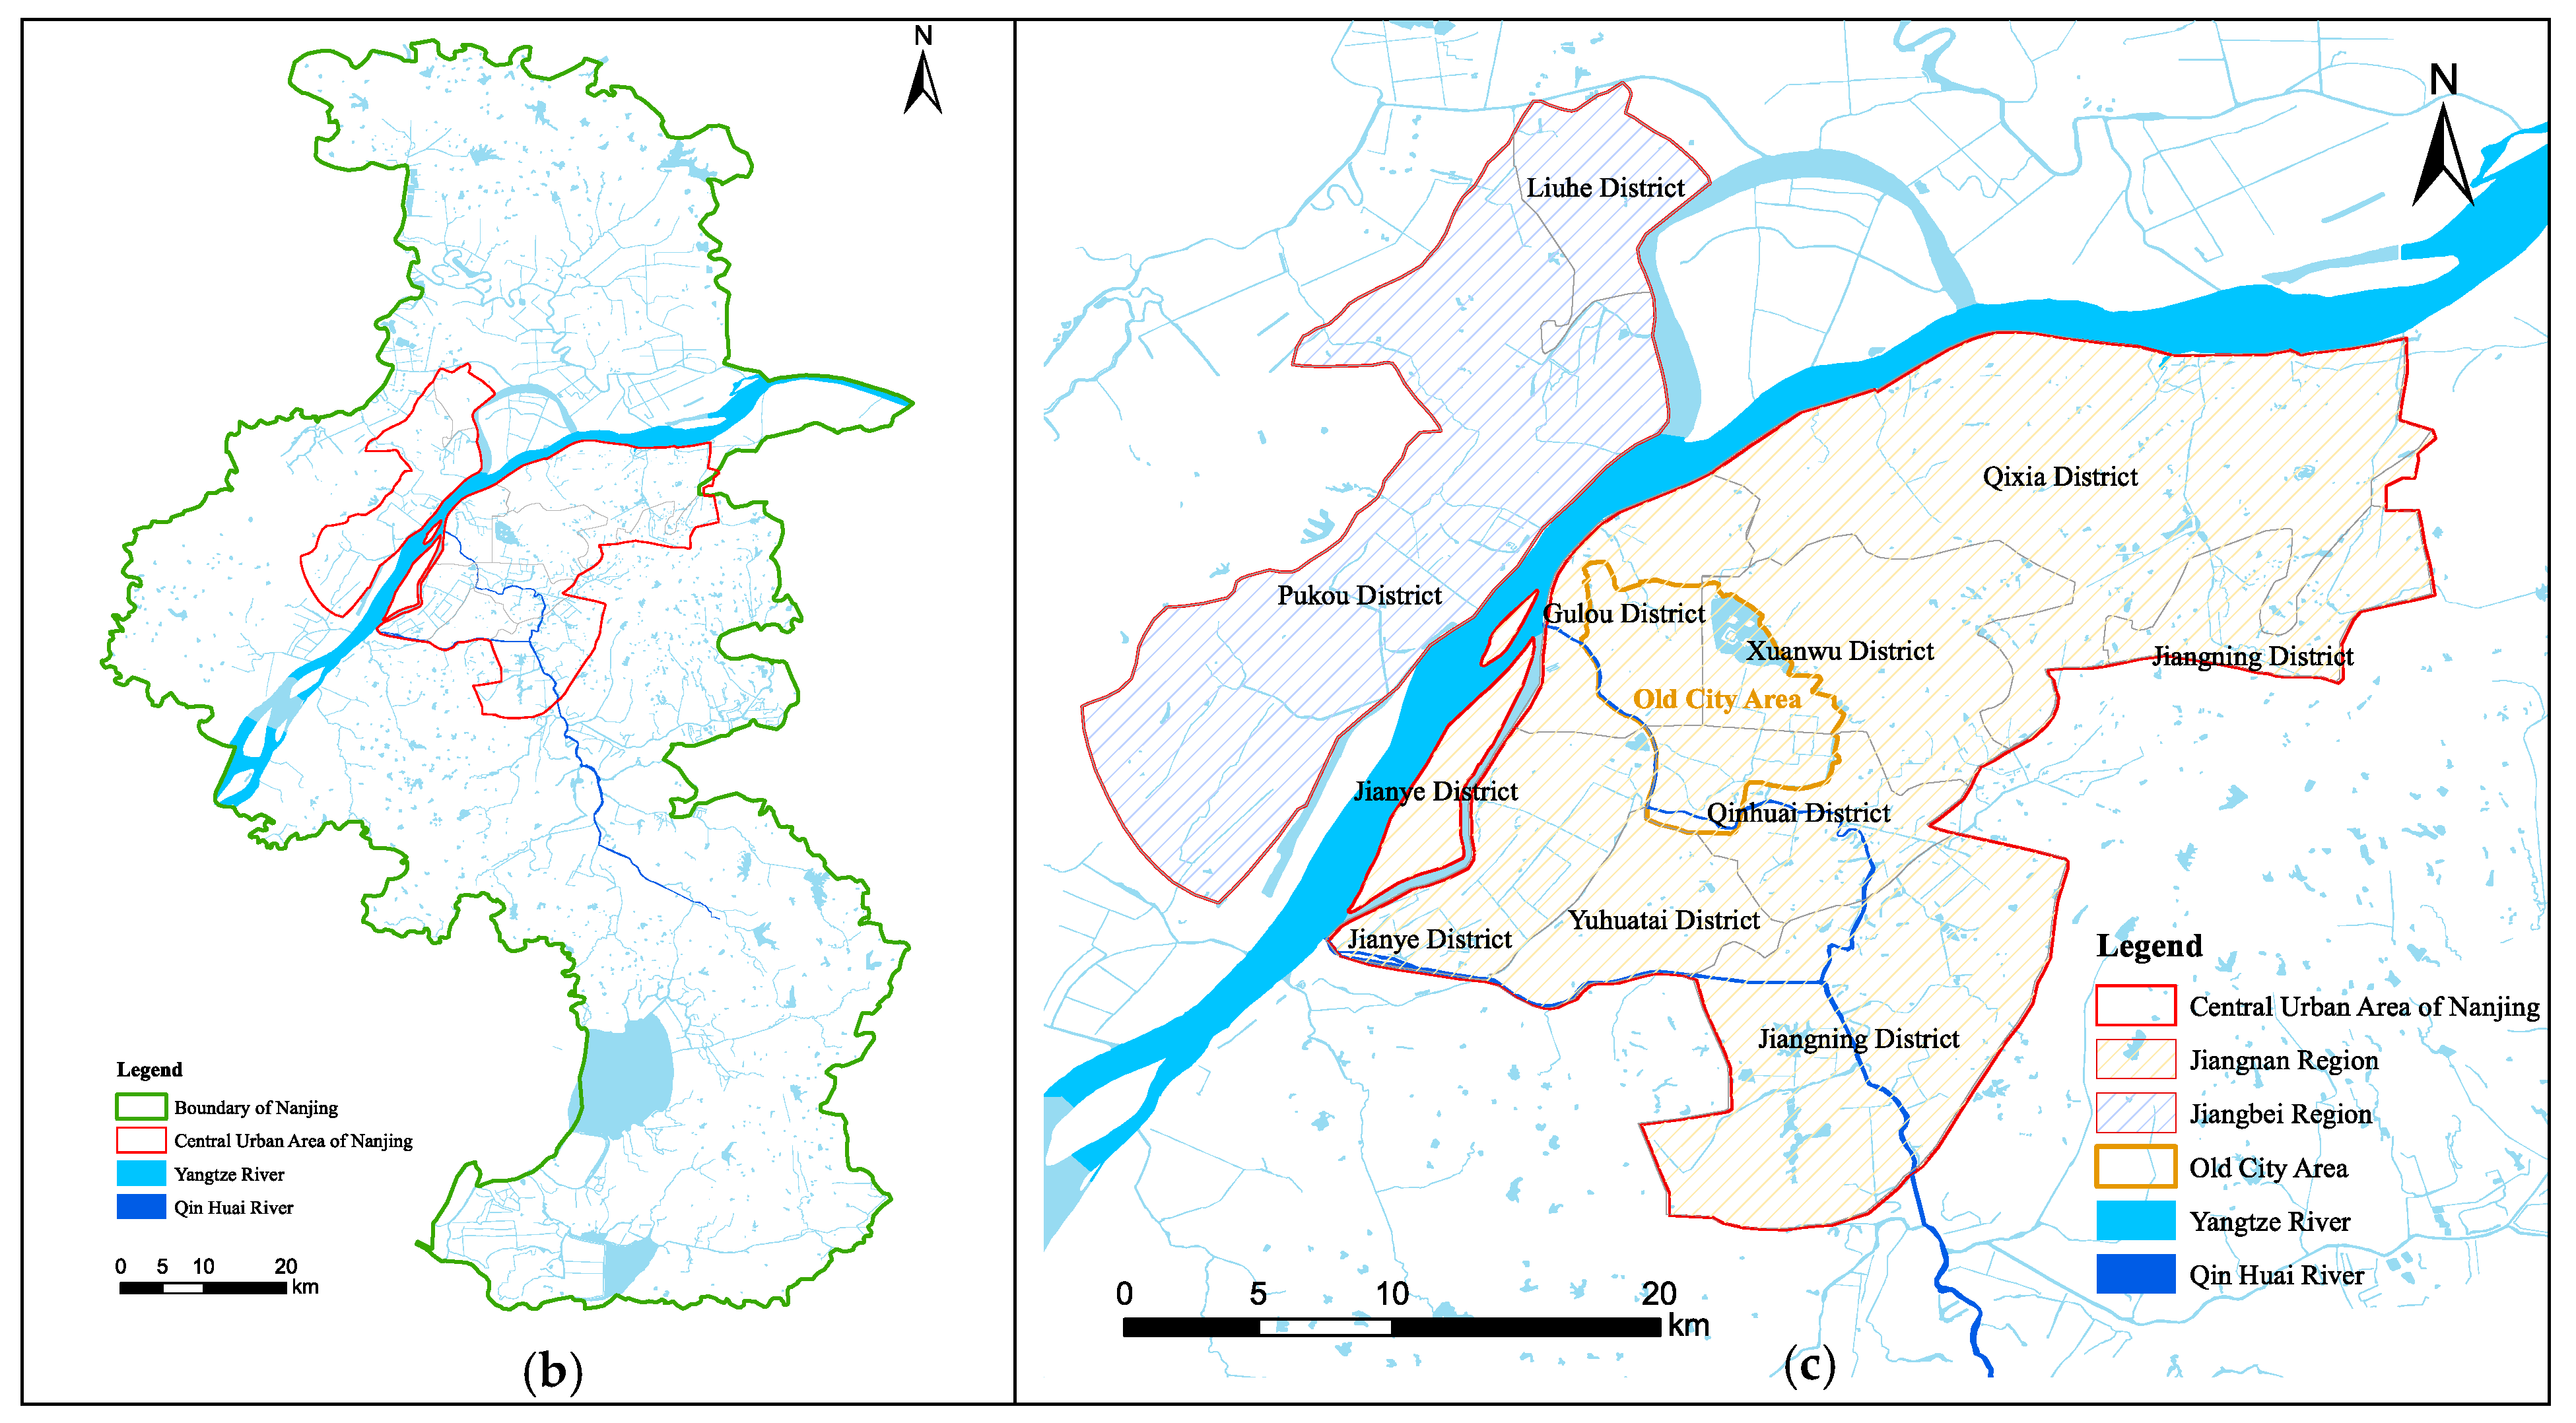
2.1. Study Area

This study selects the Central Urban Area (CUA) of Nanjing, China, as the research region, primarily based on the following considerations. For a detailed visual reference, Figure 1a,b illustrate the specific locations of Nanjing and its CUA. Firstly, Nanjing, the largest provincial capital in Eastern China, in the Yangtze River Delta Economic Zone, has a permanent population of 9.31 million according to the 2020 national census, with an urbanization rate of 86.9% [36]. The densely populated and highly urbanized population urgently requires leisure activities to relax and improve their physical condition. Secondly, the CUA of Nanjing not only holds a special geographical position as the core of the Nanjing metropolitan area and the main area carrying the central urban functions of Nanjing but also features various geographical elements. Nanjing, renowned as a historical and cultural city, attracts millions with its rich cultural resources and unique heritage, as evidenced by the over 10 million tourists in 2019 alone [37]. It has a natural wetland protection rate of 68.6%, a built-up area green coverage rate of 45.16%, and a water system coverage rate of 11.4% [25,38]. In summary, with its rich historical and cultural resources, unique geographical location, and positive urban planning and leisure space developments, Nanjing provides an ideal setting for this study’s analysis.
Figure 1c illustrates the CUA of Nanjing, which spans 804 square kilometers and is designed to enhance the city’s stature with a planned population of 7.85 million. The CUA comprises the culturally rich Jiangnan region, south of the Yangtze, focused on improving environmental quality and city functionality, and the developing Jiangbei region to the north. Additionally, the Old City Area (OCA) within Jiangnan is a crucial zone with a dense population and high-quality resources, which is vital for understanding Nanjing’s urban structure [39].

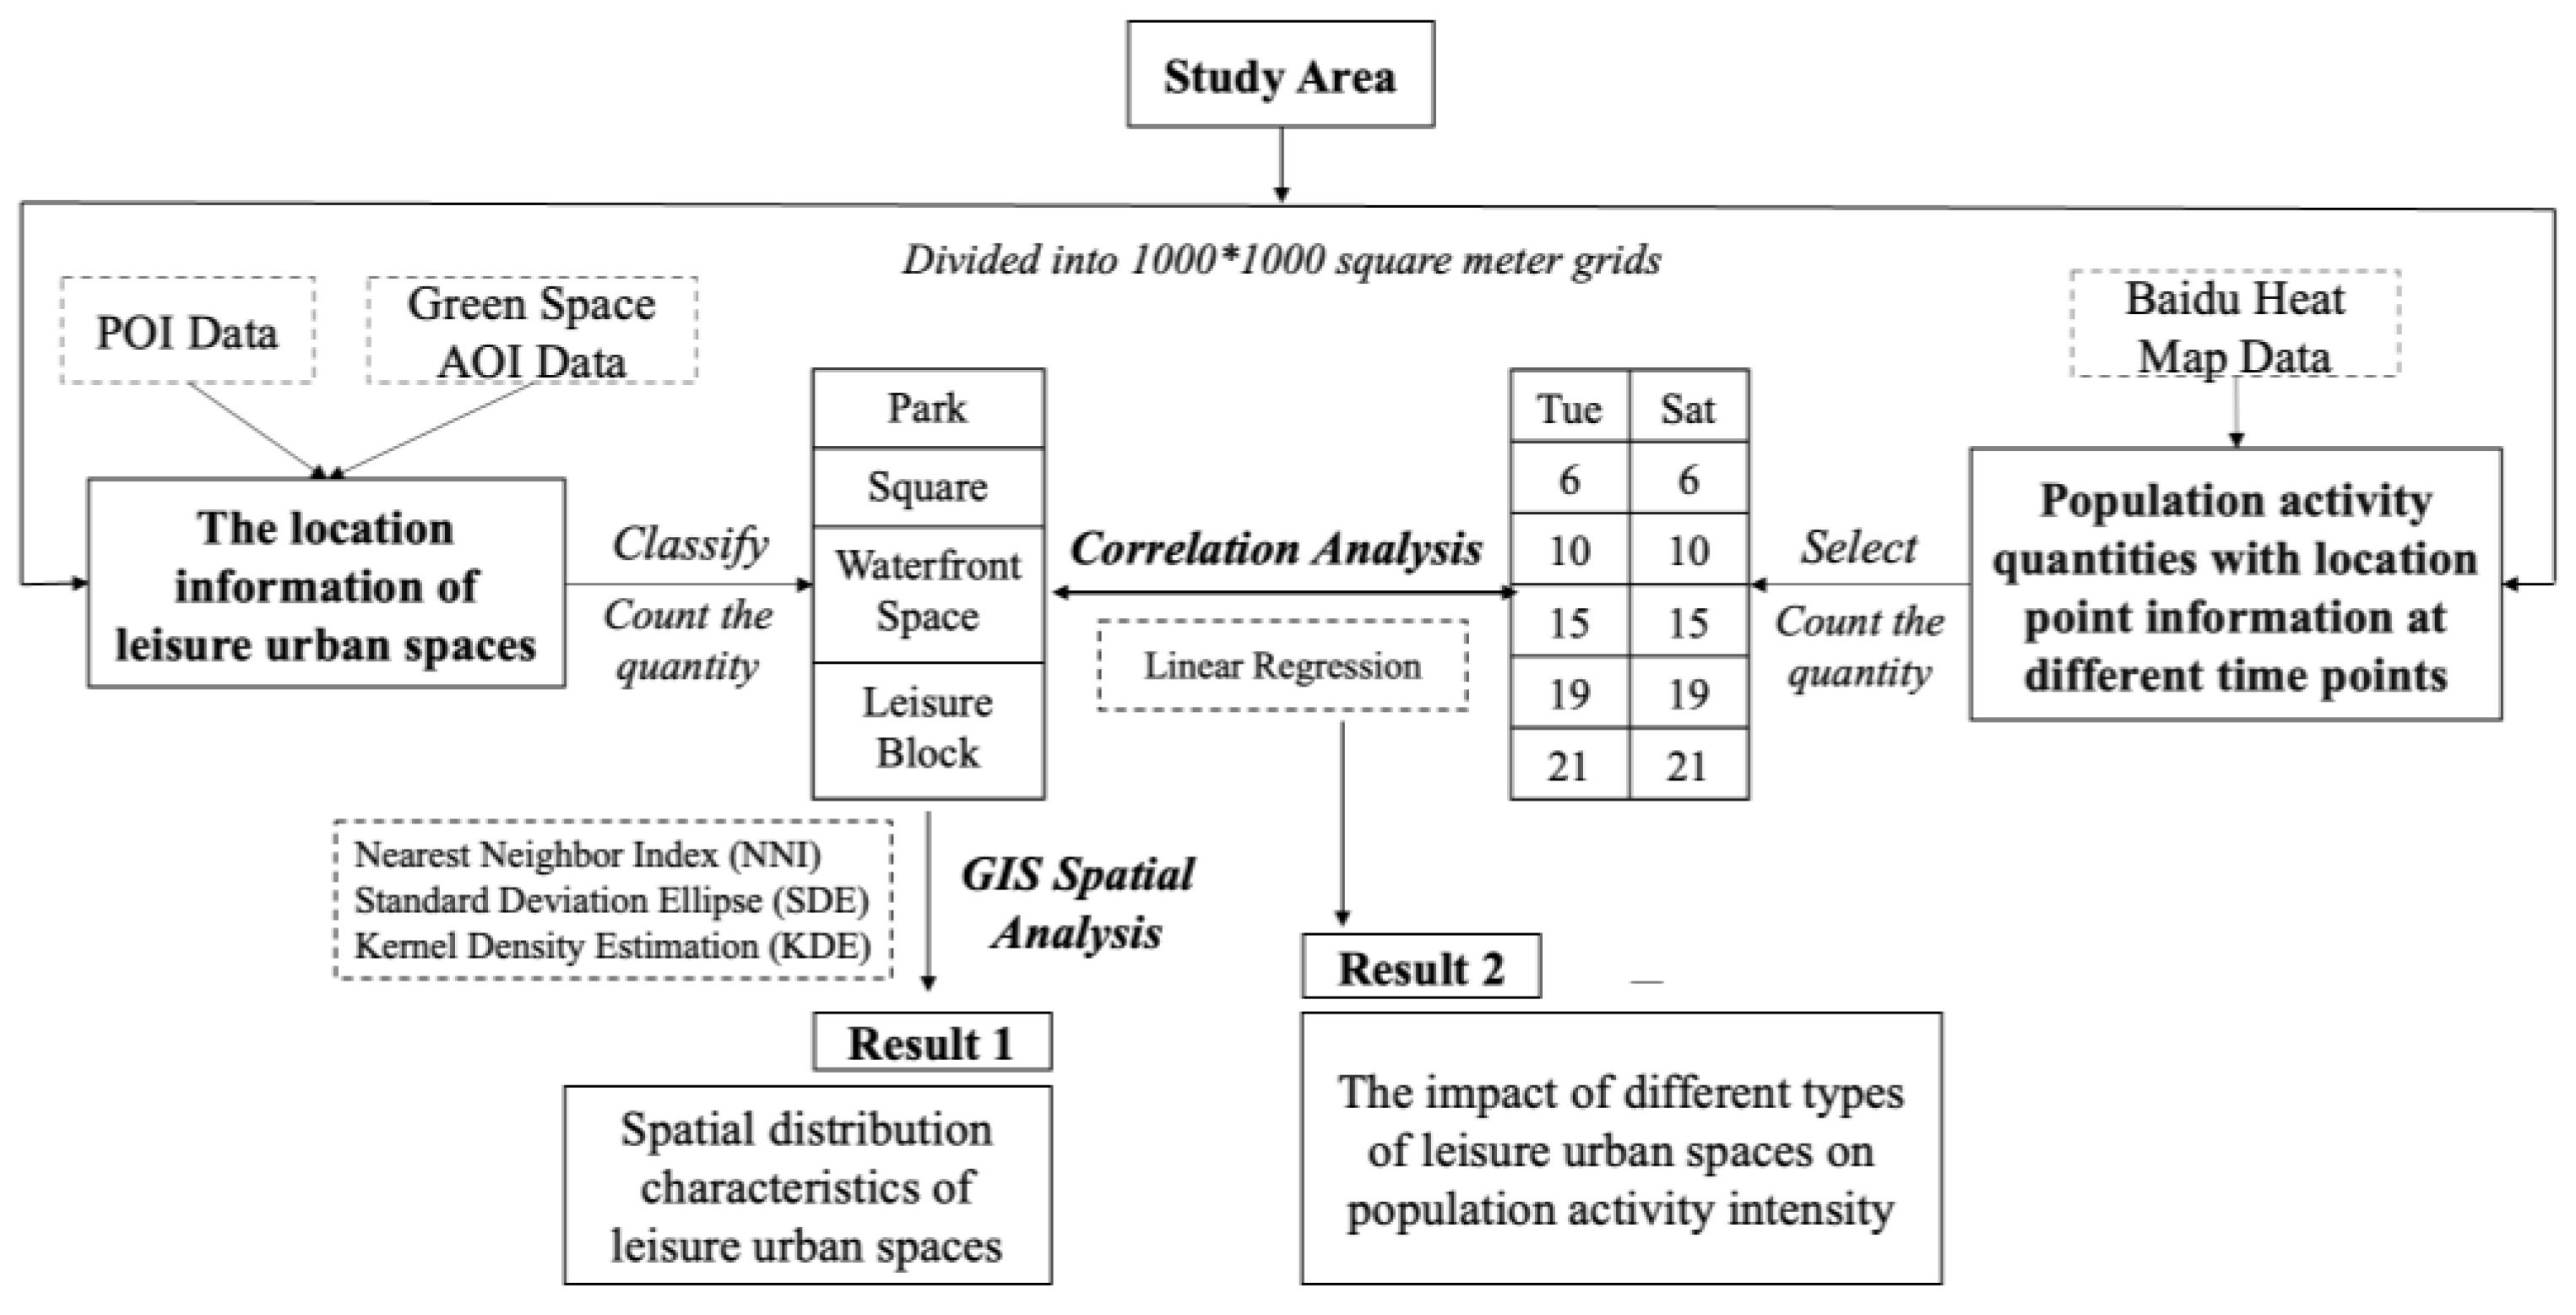
2.2. Analytical Framework

This study utilizes a comprehensive analytical framework depicted in Figure 2. As illustrated, the study area is initially divided into 1000 × 1000 square meter grids. According to related research, this size aligns with the commonly used grid sizes of 250, 500, and 1000 square meters for urban functional area layout analysis, primarily to balance data density and computational efficiency [40]. This study aims to analyze the correlation between the number of LUSs and the population within each grid. The use of larger grid sizes ensures sufficient LUS and population data within each analytical unit, also aligning with the spatial scale of the study area, thus enhancing the accuracy and effectiveness of the research. The results of the study are presented in two parts:
Result 1: Utilizing POI and AOI data obtained via the Amap API, the locations of LUS, including parks, waterfront areas, and leisure blocks, were identified and categorized. Using GIS spatial analysis techniques, the spatial distribution characteristics of these different types of LUS were analyzed.
Result 2: Employing location-based population activity data provided by the Baidu map and selecting five time points on Tuesday and Saturday (6:00, 10:00, 15:00, 19:00, and 21:00), the PAI at different times was statistically analyzed. A linear regression analysis was used to explore the correlation between the distribution of LUS and the aggregation of population activities.

2.3. Data and Pre-Processing

2.3.1. POI Data and AOI Data

This study primarily utilizes Point of Interest (POI) and Area of Interest (AOI) data to collect location information on LUS. The data for these two categories were retrieved from the (http://ditu.amap.com/) (accessed on 20 August 2023) API using web scraping techniques. AOI data, similar to POI data, typically include basic information such as name, address, category, and latitude and longitude coordinates but also encompass area boundary coordinates to mark two-dimensional geographic entities on electronic maps. Given the similarities between AOI and POI data, they often originate from the same electronic internet map platforms.
However, the location information for some LUSs cannot be directly obtained from these two data sources. To address this, the study utilizes GIS technology combined with data from social media platforms for location verification and data confirmation. Figure 3 displays the data processing procedure for four types of LUS. The location information for all squares and some parks and blocks can be obtained through POI data. To accurately obtain the location information for leisure blocks, this study incorporates data cleaning and location matching using the Meituan–Dianping platform. Meituan–Dianping is one of China’s leading online-to-offline (O2O) platforms, where locals can rate various commercial and leisure locations [33]. Moreover, its specialized category for leisure blocks addresses the lack of such detailed classifications in traditional map data.
Waterfront spaces are defined as the leisure green spaces surrounding natural water bodies within the study areas, including areas near the Yangtze River and the Qinhuai River. Using ArcGIS software (version 10.8.2), a 100 m buffer zone is created around these water bodies to identify and clean the central point location information of green spaces adjacent to the water bodies and match them with positions on Amap, thus determining the final location of the waterfront spaces. Park locations are determined by merging park POI with waterfront space location information and removing duplicate geographic data points. Ultimately, the study acquired location data for 407 LUSs, including 186 parks, 166 squares, 27 waterfront spaces, and 28 leisure blocks.

2.3.2. Baidu Heat Map Data

The Baidu Heat Map Data (BHMD) utilize location information from hundreds of millions of mobile phone users engaging with Baidu products to calculate the heat values of pedestrian traffic in various areas and times, effectively reflecting the density of people in a region. As a big data application with hundreds of millions of users, the Baidu Heat Map is significant for urban studies [34]. Therefore, BHMD extensively mirror the crowd heat in precise areas and are widely used in studies on population dynamic distribution [30,31]. BHMD’s real-time data, accessible via API (https://huiyan.baidu.com) (accessed on 23 August 2023) from Baidu’s site, effectively captures spatiotemporal behavior patterns. Data are collected in 200 × 200 grid cells over one-hour intervals, assigning heat values to cell centroids based on user locations from Baidu apps. The cell centroids represent the locations of population activities, and their heat values indicate the intensity of these activities. This method reveals not only the intensity of population but, more importantly, the spatial distribution characteristics of their activities.
Leisure activities exhibit two behavioral patterns on weekdays and weekends [28,41]. To deeply understand these differences, this study selected two representative days, 22 August 2023 (Tuesday) and 26 August 2023 (Saturday), to collect population activity data in the study area using BHMD at five key time points (6:00, 10:00, 15:00, 19:00, and 21:00). These time points were chosen as they typically reflect the peaks of various leisure activities throughout the day, including morning wake-up time, afternoon rest, and evening social and relaxation periods.

2.4. Research Methods

2.4.1. GIS Spatial Analysis

This section employs three distinct GIS techniques for spatial analysis: Nearest Neighbor Index (NNI), Standard Deviation Ellipse (SDE), and Kernel Density Estimation (KDE). Each method offers unique insights into the spatial distribution patterns of Leisure Urban Space (LUS) locations. The analyses were conducted using ArcGIS software, version 10.8.2.
Nearest Neighbor Index (NNI): The NNI describes distribution patterns by measuring the distance between the nearest points [42]. By measuring the distance from each location point to its nearest neighbor and comparing these distances with the expected values of a random distribution, it can be determined whether the location points tend to be clustered or dispersed [14,15,43]. The Nearest Neighbor Ratio, denoted as R, interprets the distribution, the smaller the value of R, the more clustered the distribution. If R > 1, the spatial distribution is dispersed; if R = 1, it is random; if R < 1, it is clustered. The formula is as follows:
R = r o b s r e x p = 1 n i = 1 n d m i n i 0.5 n A
In the formula, R is the NNI value; r o b s is the observed average nearest neighbor distance; r e x p is the expected average nearest distance; A is the size of the study area; d m i n ( i ) represents the distance from each point to its closest neighbouring point.
Standard Deviation Ellipse (SDE): SDE, first introduced by Lefever in 1926, is a spatial statistical method that reveals the multidimensional characteristics of geographic feature distributions [44]. SDE involves the dispersion of data points and their primary trend direction, ultimately forming an ellipse. This method has been extensively integrated into GIS analyses to reveal spatial relationships of geographic features [45]. The calculation of SDE depends on several key parameters: the center of the ellipse reflects the relative position and change of the centroid of the geographic features; the orientation angle indicates the main trend direction; the standard deviations in the X and Y directions represent the dispersion of spatial features in the primary and secondary trend directions, respectively. Their ratio reveals the pattern of dispersion [14,46]. The formula is as follows:
S D E x = 1 n i = 1 n ( x i x ¯ ) 2
S D E y = 1 n i = 1 n ( y i y ¯ ) 2
In the formula, x i and y i denote the coordinates of each element i ; x ¯ , y ¯ represents the mean center of the elements; and n is the total number of elements.
Kernel Density Estimation (KDE): KDE is an interpolation technique used to compute the probability density function of a random variable, widely applied for estimating the spatial density distribution of geographic features [47]. As a common statistical method for analyzing point feature distributions, KDE visually displays the distribution of discrete measurements in a continuous area. This method is extensively used in studies of spatial distribution characteristics, helping to analyze and understand geographical phenomena by revealing the spatial distribution patterns and characteristics of point features [14,15,17]. The higher the kernel density value, the more concentrated the point distribution; the lower the value, the more dispersed the distribution. The formula is as follows:
f ^ ( x , y ) = 3 n h 2 π i = 1 n 1 x x i 2 + y y i 2 h 2 2
In the formula, f ^ ( x , y ) represents the estimated density value at the location ( x , y ) ; n is the total number of data points; ( x i , y i ) are the coordinates of the i-th point; h is the bandwidth, controlling the smoothness k is the kernel function, determining how each point contributes to the density estimate.

2.4.2. Correlation Analysis

Linear regression is widely used to determine variables’ interactions, impact levels, and underlying statistical patterns [48]. Many studies have successfully utilized this method to explore factors influencing urban public facilities [29,49]. This research employs a multiple linear regression approach to assess the impact of different types of LUS (parks, squares, waterfront spaces, leisure blocks, and overall leisure urban spaces) on the PAI at different times (Wednesday at 6, 10, 15, 19, 21 and Saturday at 6, 10, 15, 19, 21). Unlike Geographically Weighted Regression (GWR) or other spatial analysis models, this study posits that the correlation between leisure urban spaces and the PAI is primarily driven by the types of spaces rather than their spatial positions. Therefore, spatial non-stationarity is not a concern in this issue. Instead, the linear regression method provides a better explanation and assessment of how the quantity of different LUS influences the PAI. The formula is as follows:
Y = β 0 + β 1 X 1 + β 2 X 2 + + β n X n + ε
In the formula, Y is the dependent variable representing the PAI at different times, including average numbers ( Y a ) on Tuesday ( Y w 6 , Y w 10 , Y w 15 , Y w 19 , Y w 21 ) and on Saturday ( Y s 6 , Y s 10 , Y s 15 , Y s 19 , Y s 21 ).  X is the independent variable representing the supply numbers of different space types, including the overall number ( X o ), parks ( X p ), squares ( X s ), waterfront spaces ( X w ), and leisure blocks ( X b ). β 0 is the intercept, β 1 , β 2 , …, β n are the coefficients for the independent variables, and ε is the random error.
R 2 indicates the proportion of sample data the regression equation can explain; values closer to 1 indicate a more accurate model. In multiple regression, an R 2 between 0.8 and 1 suggests a high model fit; an R 2 between 0.5 and 0.8 indicates a reasonable fit. The regression coefficients reflect the impact of the independent variable X on the dependent variable Y ; a larger coefficient indicates a greater impact; positive values indicate that Y increases with X , while negative values indicate Y decreases with X .

3. Results

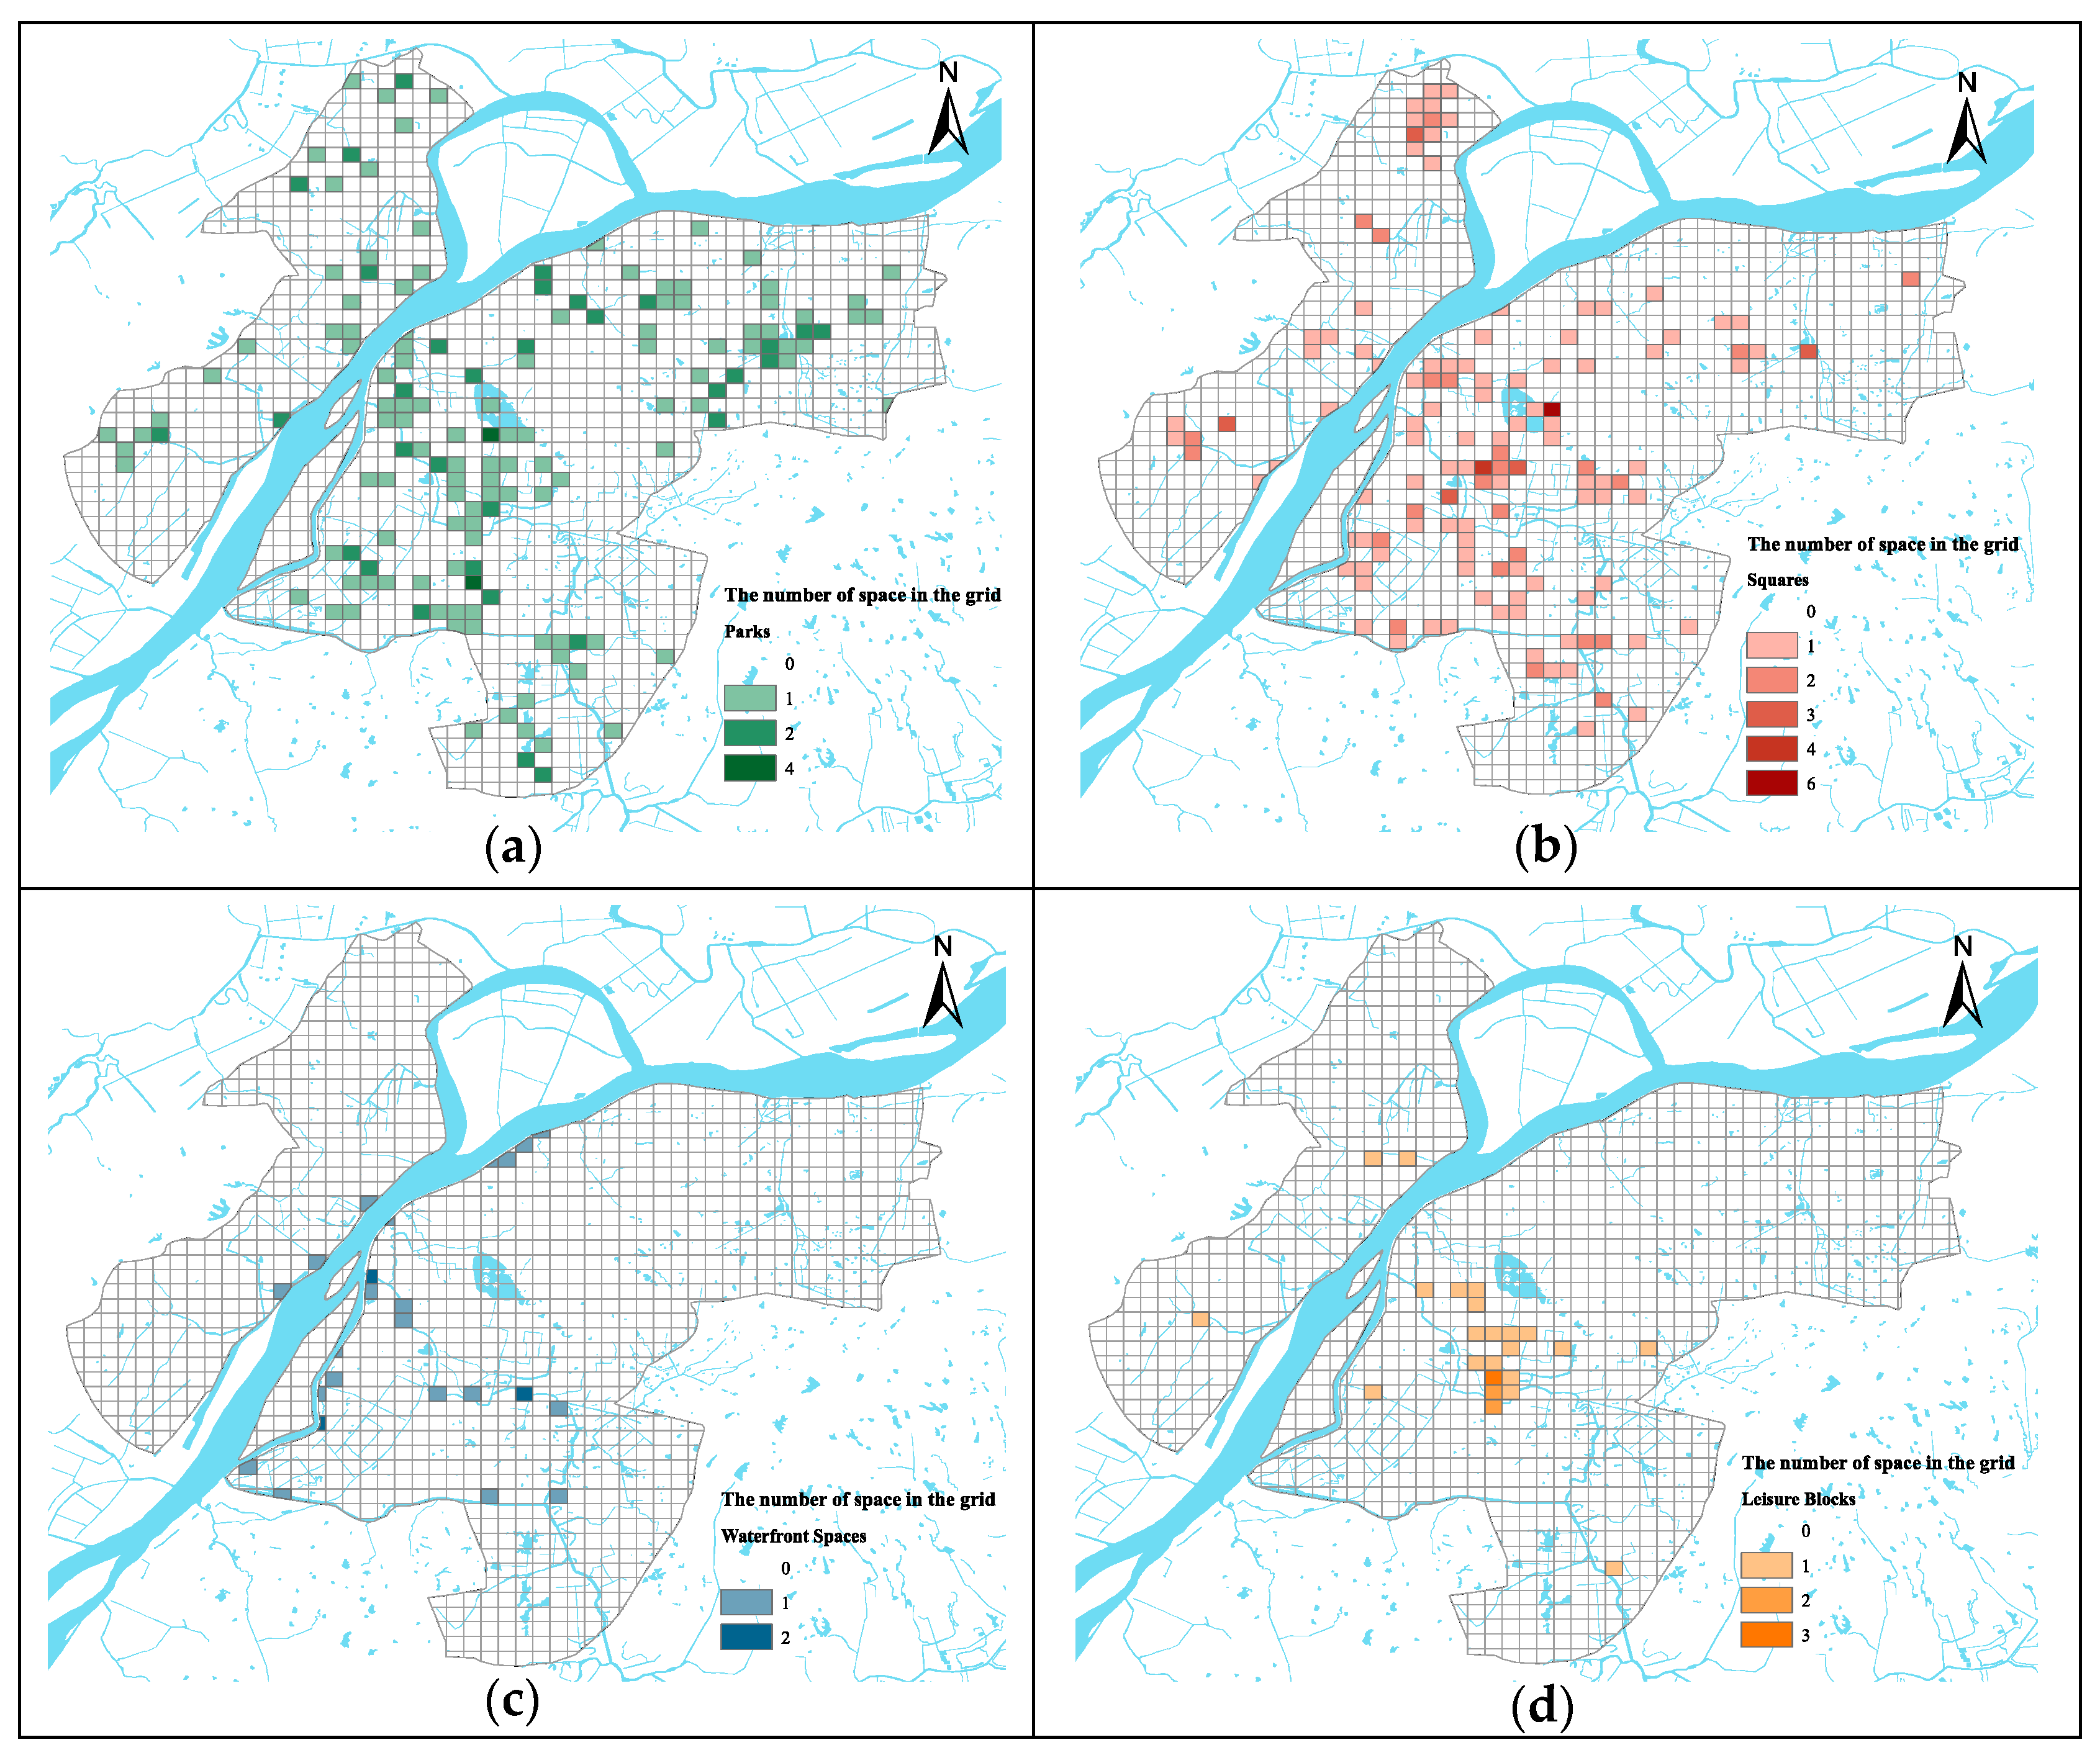
3.1. Distribution Characteristics of Leisure Urban Spaces

3.1.1. Nearest Neighbor Analysis

Nearest Neighbor Analysis indicates a pronounced clustering trend within leisure urban spaces. Key metrics elucidate the distribution patterns within the study area. Specifically, according to Table 1, the observed average distance is approximately 612.29 m, whereas the expected average distance for a random distribution is 1175.94 m. This results in a significant Nearest Neighbor Ratio of about 0.52, highlighting a high degree of spatial clustering of leisure activities. The statistical significance of these results is further supported by a Z-value of −18.5 and a p-value of 0, indicating that the observed clustering is not a random occurrence but highly statistically significant.
Different types of leisure urban spaces exhibit varying clustering characteristics. Parks and squares show significant clustering, with Nearest Neighbor Index (NNI) values of 0.65 and 0.58, respectively, and Z-values and a p-value of 0 significantly support this clustering. These results indicate strategic arrangements in urban planning for these spaces, evidently influenced by careful landscape design and urban layout. In contrast, waterfront spaces have an NNI of 0.77, with a Z-value of −2.3 and a p-value of 0.07, displaying a relatively weak clustering trend, suggesting a distribution close to random but still slightly inclined towards clustering. Leisure blocks nearly exhibit a random distribution, with an NNI of 0.99, a Z-value of −0.12, and a p-value of 0.9, showing a more uniform distribution pattern across these spaces.

3.1.2. Standard Deviation Ellipse Analysis

SDE analysis reveals the spatial distribution characteristics and directional trends of different LUSs within the study area. These spaces are relatively centralized around the central geographical coordinates but differ in rotation angles and distribution ranges (see Figure 4). As shown in Table 2, the overall LUSs cover an average area of 545.98 square kilometers, accounting for 68% of Nanjing’s CUA (802 square kilometers). This indicates that these spaces are widely distributed in the CUA and are significant in residents’ daily lives. The standard deviations for the XStdDist and YStdDist are both 0.109, suggesting a relatively balanced distribution within the CUA of Nanjing, with a clear directional tilt from southeast to northwest at 132.43 degrees.
LUSs show significant clustering, primarily concentrated in the Jiangnan region’s Gulou, Xuanwu, Jianye, Qinhuai, and Yuhuatai districts. The centroids of all types of LUS are located in the Jiangnan region, demonstrating a commonality in their layout, being close to the main urban functional areas and densely populated districts. The analysis results further reveal the distribution characteristics and directional trends of different types of LUS in Nanjing. Parks occupy the largest area, at 614.44 square kilometers, slightly above the city’s overall average, with a rotation angle of 65.99 degrees, suggesting an east–west orientation. The standard deviation ellipse area for squares is 485.42 square kilometers, with a central position (X: 118.79, Y: 32.06) consistent with the overall level and a rotation angle of 159.81 degrees tilting northwest, possibly reflecting its integration with the urban structure. Waterfront spaces are relatively concentrated, covering 242.05 square kilometers, distributed along a north–south direction (rotation angle of 23.89 degrees), consistent with the linear characteristics of water bodies. The distribution of leisure blocks is the most concentrated, covering an area of 275.76 square kilometers, primarily along a southeast–northwest direction (rotation angle of 144.10 degrees), with the center located at the southernmost point (X: 118.78, Y: 32.03).
Parks and squares in Nanjing’s CUA cover large areas with notable directionality, indicating their strategic deployment in urban planning to fulfil residents’ daily leisure needs. Waterfront spaces, though smaller, are strategically placed along the city’s waterways, highlighting the influence of water resources on leisure space planning. Leisure blocks are highly concentrated and serve as commercial and entertainment hubs, effectively generating a clustering effect. Despite the overall uniform distribution of LUSs in the central district, the limited range of waterfront spaces and leisure blocks suggests potential for future expansion.

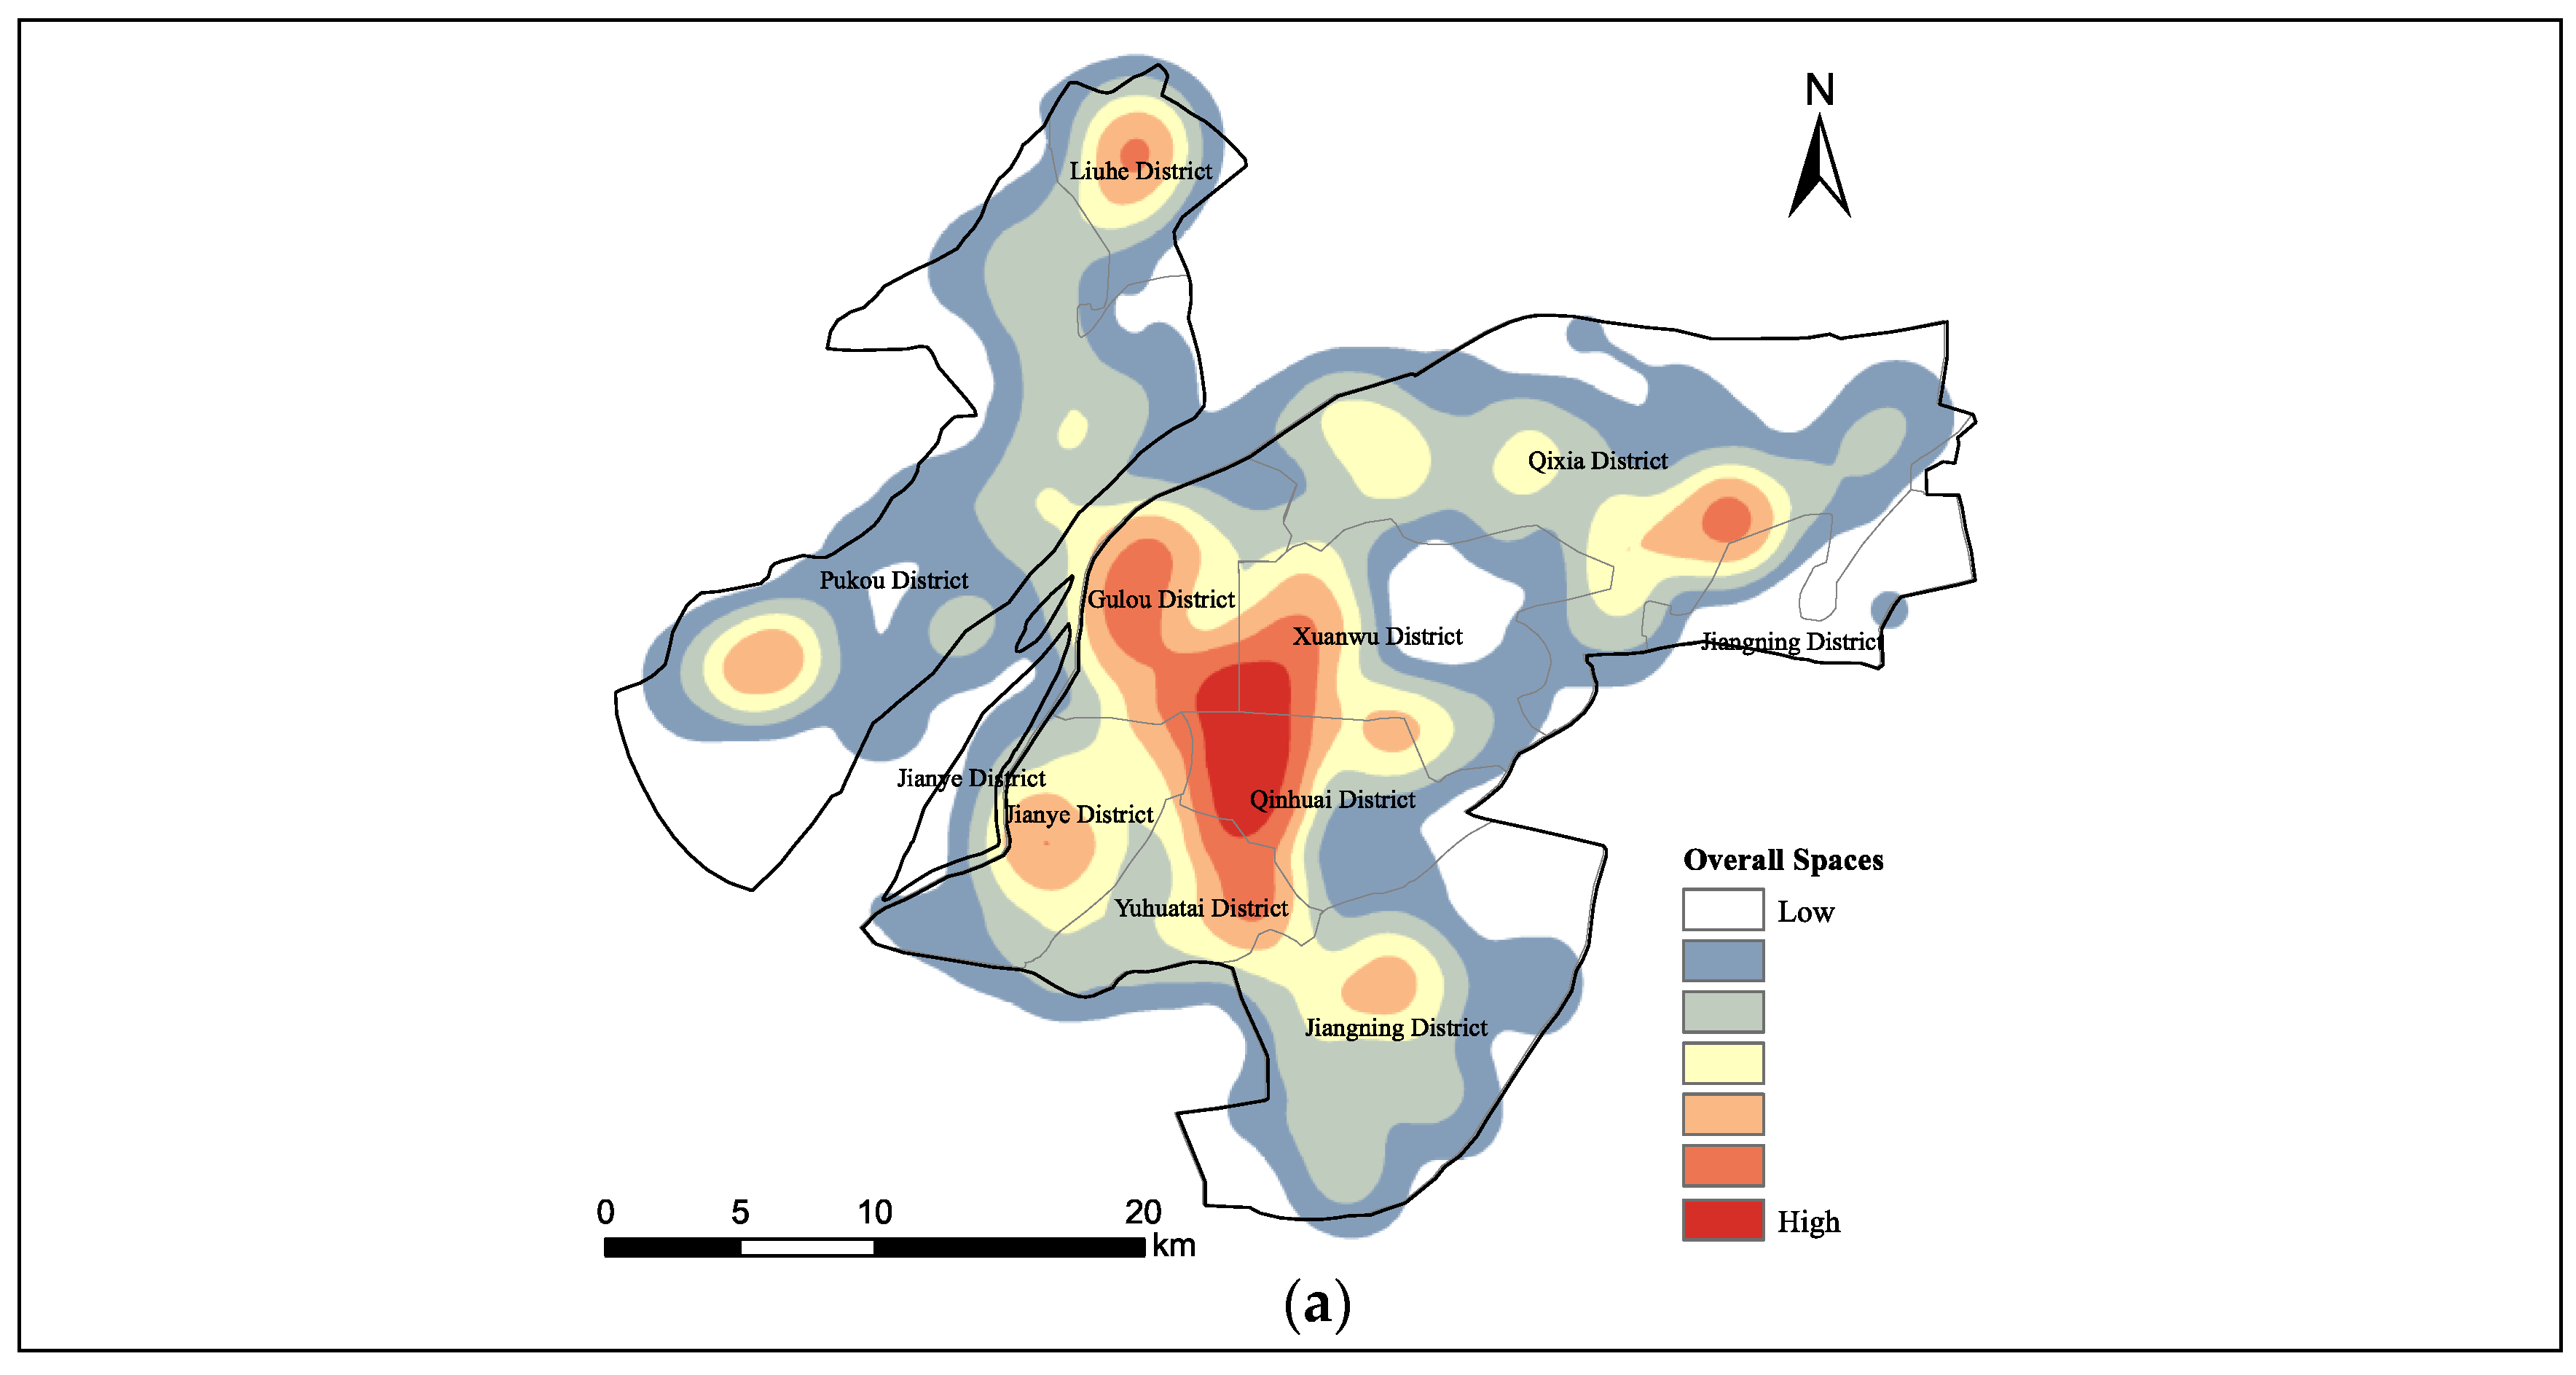
3.1.3. Kernel Density Distribution

KDE analysis provides a clearer representation of the unit density of elements within their surrounding neighborhoods. As seen in Figure 5, the CUA of Nanjing exhibits distinct spatial characteristics in the distribution of LUS, presenting a “one core, multiple points” pattern. LUSs are densely distributed and exhibit strong spatial continuity at the intersection of the Gulou, Qinhuai, and Xuanwu districts within the Old City Area (OCA), forming the most densely clustered area in large groups, with wide-ranging, high-density, and strong continuity spreading outward. Beyond this high-density cluster, other areas also feature smaller clustered centers, such as the Luhe district in the northeast and the Qixia district in the southeast. Some new urban areas, such as the Jianye, Pukou, and Jiangning districts, show lower sprawl and diffusion density.
Parks are primarily concentrated in the OCA and the urban new areas in the northeast, mainly consisting of two connected high-density cores represented by the Qinhuai and Yuhuatai districts and a high-density core in the Jiangning district to the northeast, forming three similarly sized clustered centers. In the OCA, parks are densely distributed, providing convenient leisure spots despite their smaller size. The southern Yuhuatai district has many parks with larger areas, forming a significant leisure green network. In the eastern Qixia, southeastern Jiangning, and northwestern Pukou districts, parks are more sparsely distributed but offer expansive outdoor activity spaces. The northern Luhe and Pukou districts have fewer parks, but these open areas are generally suitable for park development.
Squares are mainly concentrated in the core areas of the OCA and the northern new urban districts. At the intersection of the Gulou, Qinhuai, and Xuanwu districts within the OCA, squares are densely distributed, often in commercial areas and key nodes, providing convenient social and leisure places. In the south (Jianye, Yuhuatai, and Jiangning districts), squares are widely distributed, with new development projects’ squares fostering community interaction. There are fewer squares in the east and north (Qixia and Liuhe districts), but they cover larger areas that support community activities. In the western Pukou district, square distribution is sparse but still provides important public spaces at key locations. The distribution of squares is focused on core areas, with a significant presence in both old and new urban districts, reflecting their importance in urban public life, similar to the distribution characteristics of parks.
Waterfront spaces form distinct clusters in areas adjacent to the Yangtze River and Qinhuai River water bodies, consisting of a large cluster center in the middle of the Yangtze, two smaller centers, and a small cluster center along the Qinhuai River. Waterfront spaces are densely distributed in the Jiangnan region’s Gulou, Jianye, and Yuhuatai districts, offering a wealth of water-based activities and leisure places. In the western Pukou district, waterfront spaces along the north bank of the Yangtze provide unique waterfront landscapes and recreational opportunities. In the eastern and southern new development areas, such as the Qixia, Jiangning, and Liuhe districts, waterfront spaces are relatively sparse but still provide important leisure resources at some key locations.
Leisure blocks are primarily concentrated in the OCA, particularly in the Gulou and Qinhuai districts, often in commercially bustling areas. These areas serve as primary venues for leisure and entertainment, offering diverse social and cultural activities. A few leisure blocks exist in the Jianye, Xuanwu, and Pukou districts, with almost no supply in other areas. Overall, the siting of leisure blocks is similar to squares, concentrated in areas of frequent commercial and social activities, but their distribution is more focused, and there is very little supply in newly developed areas.

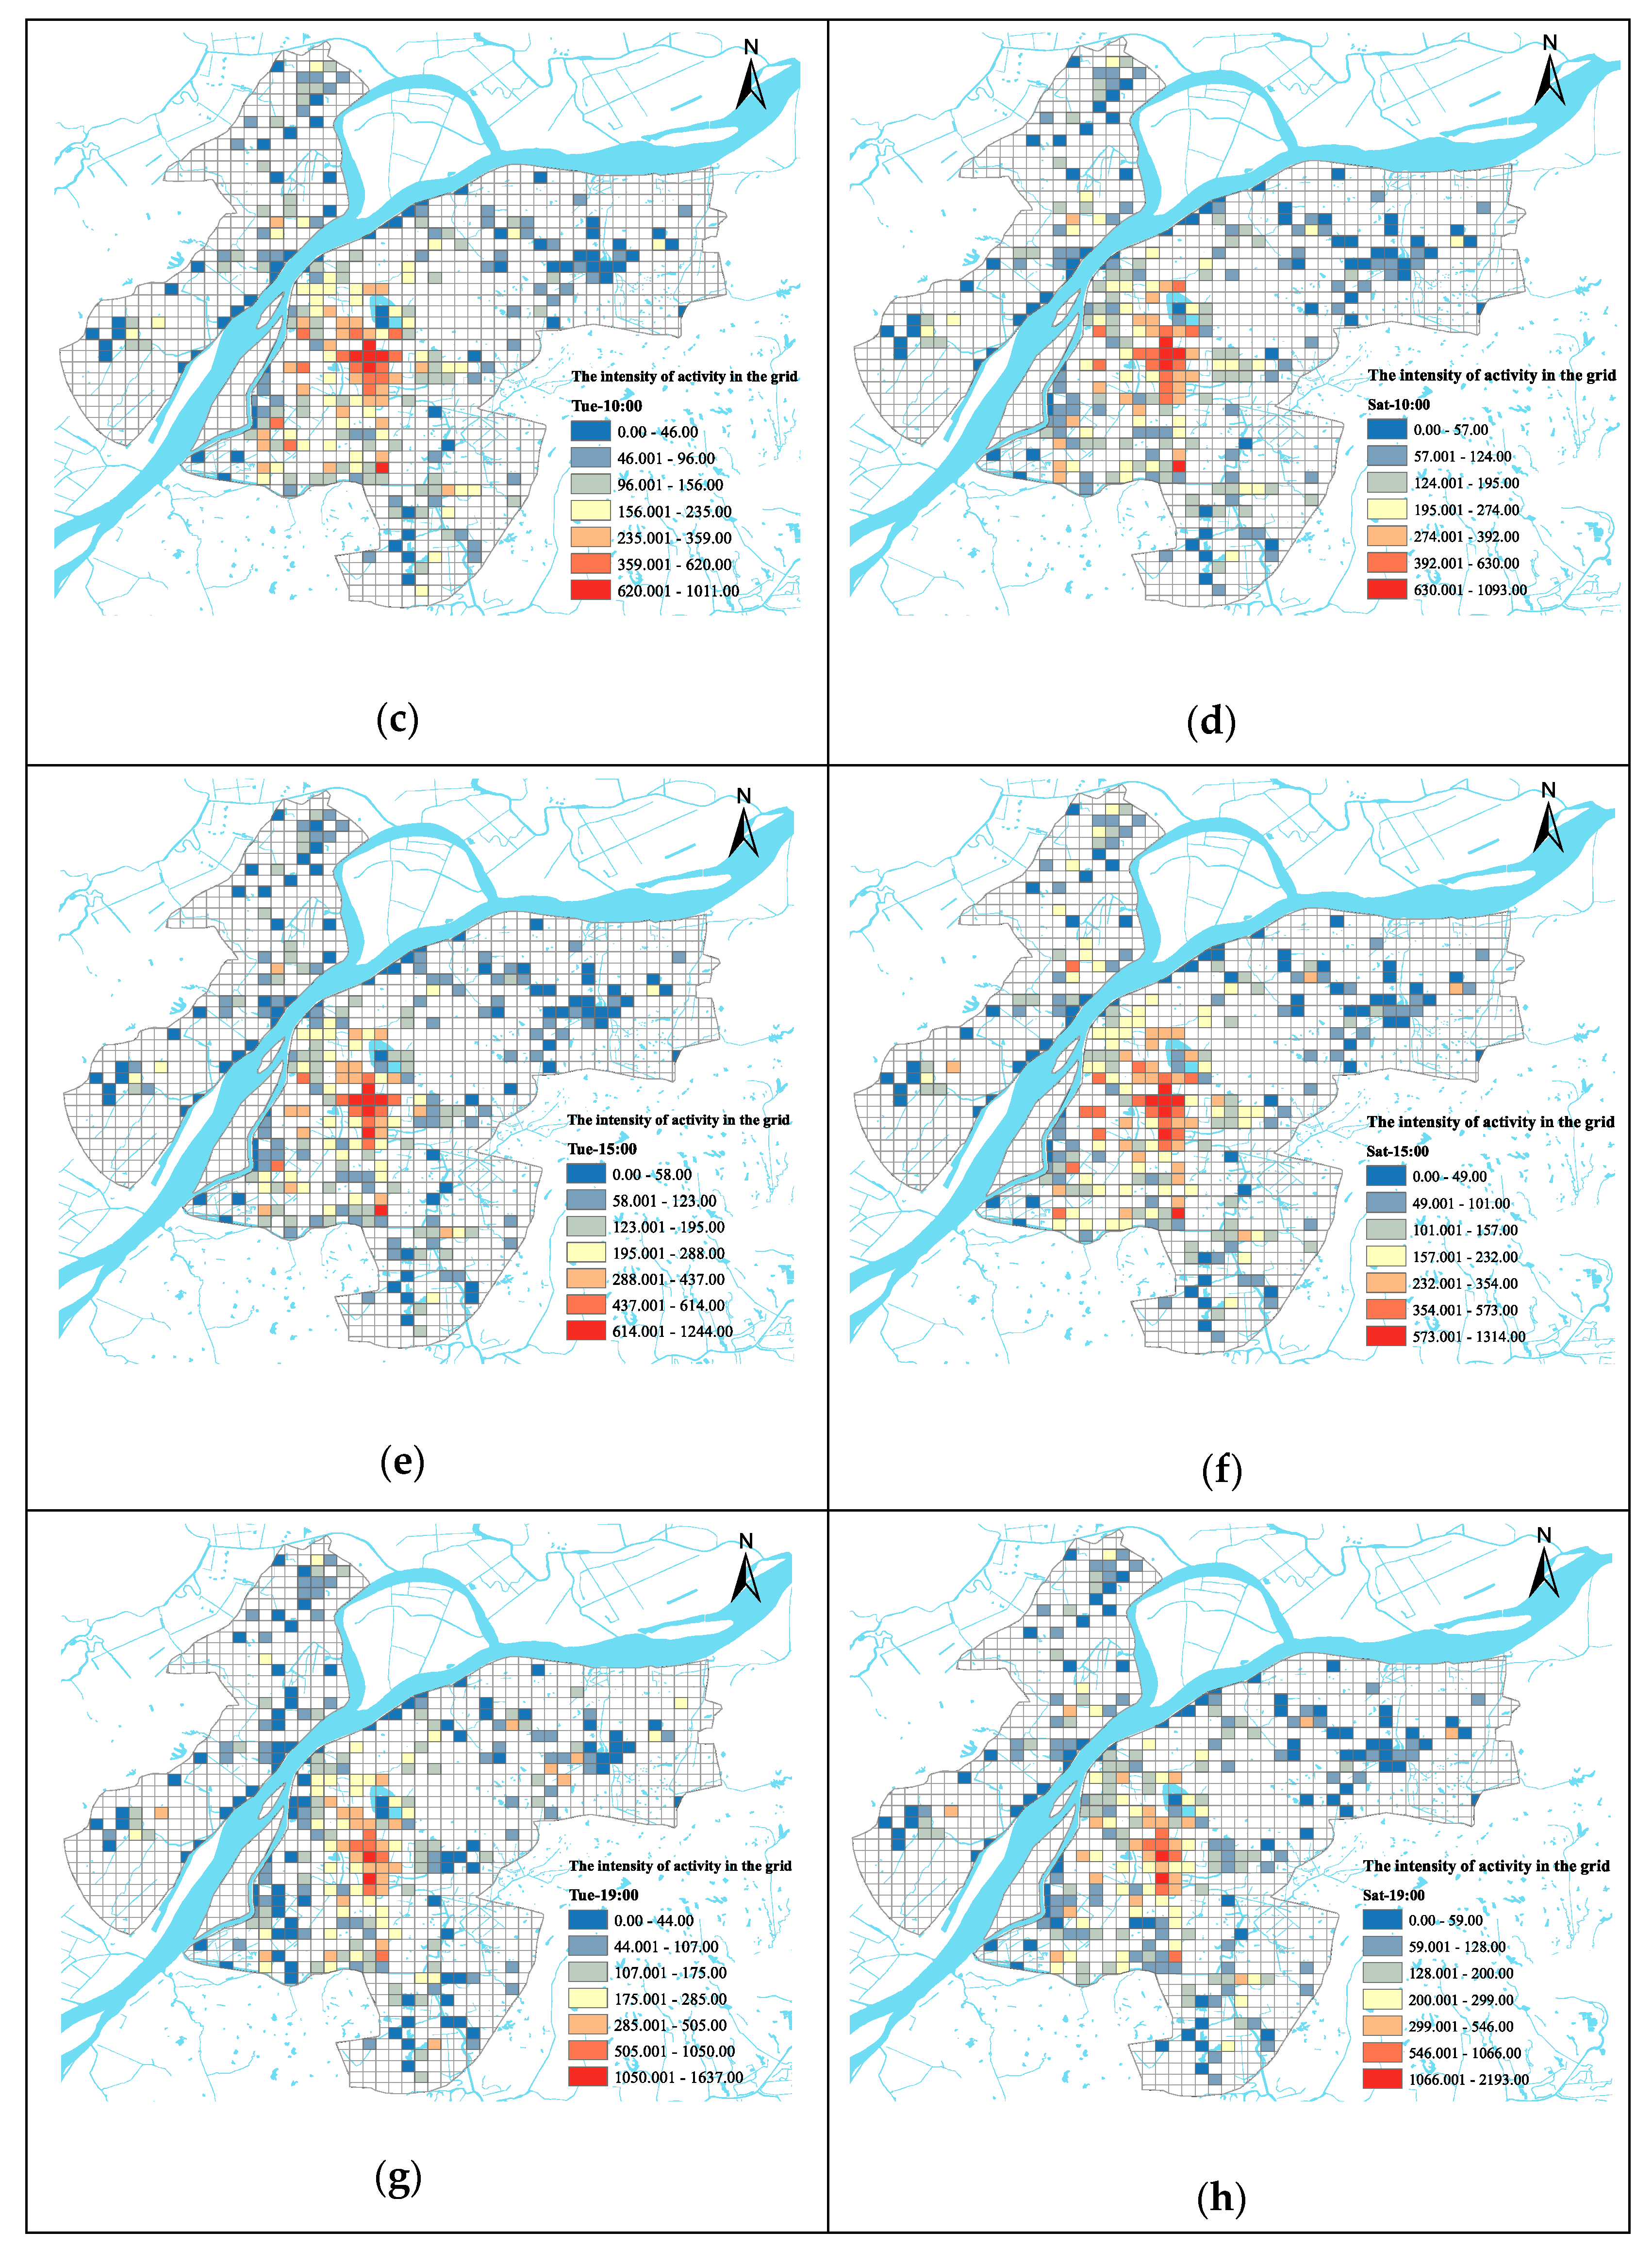
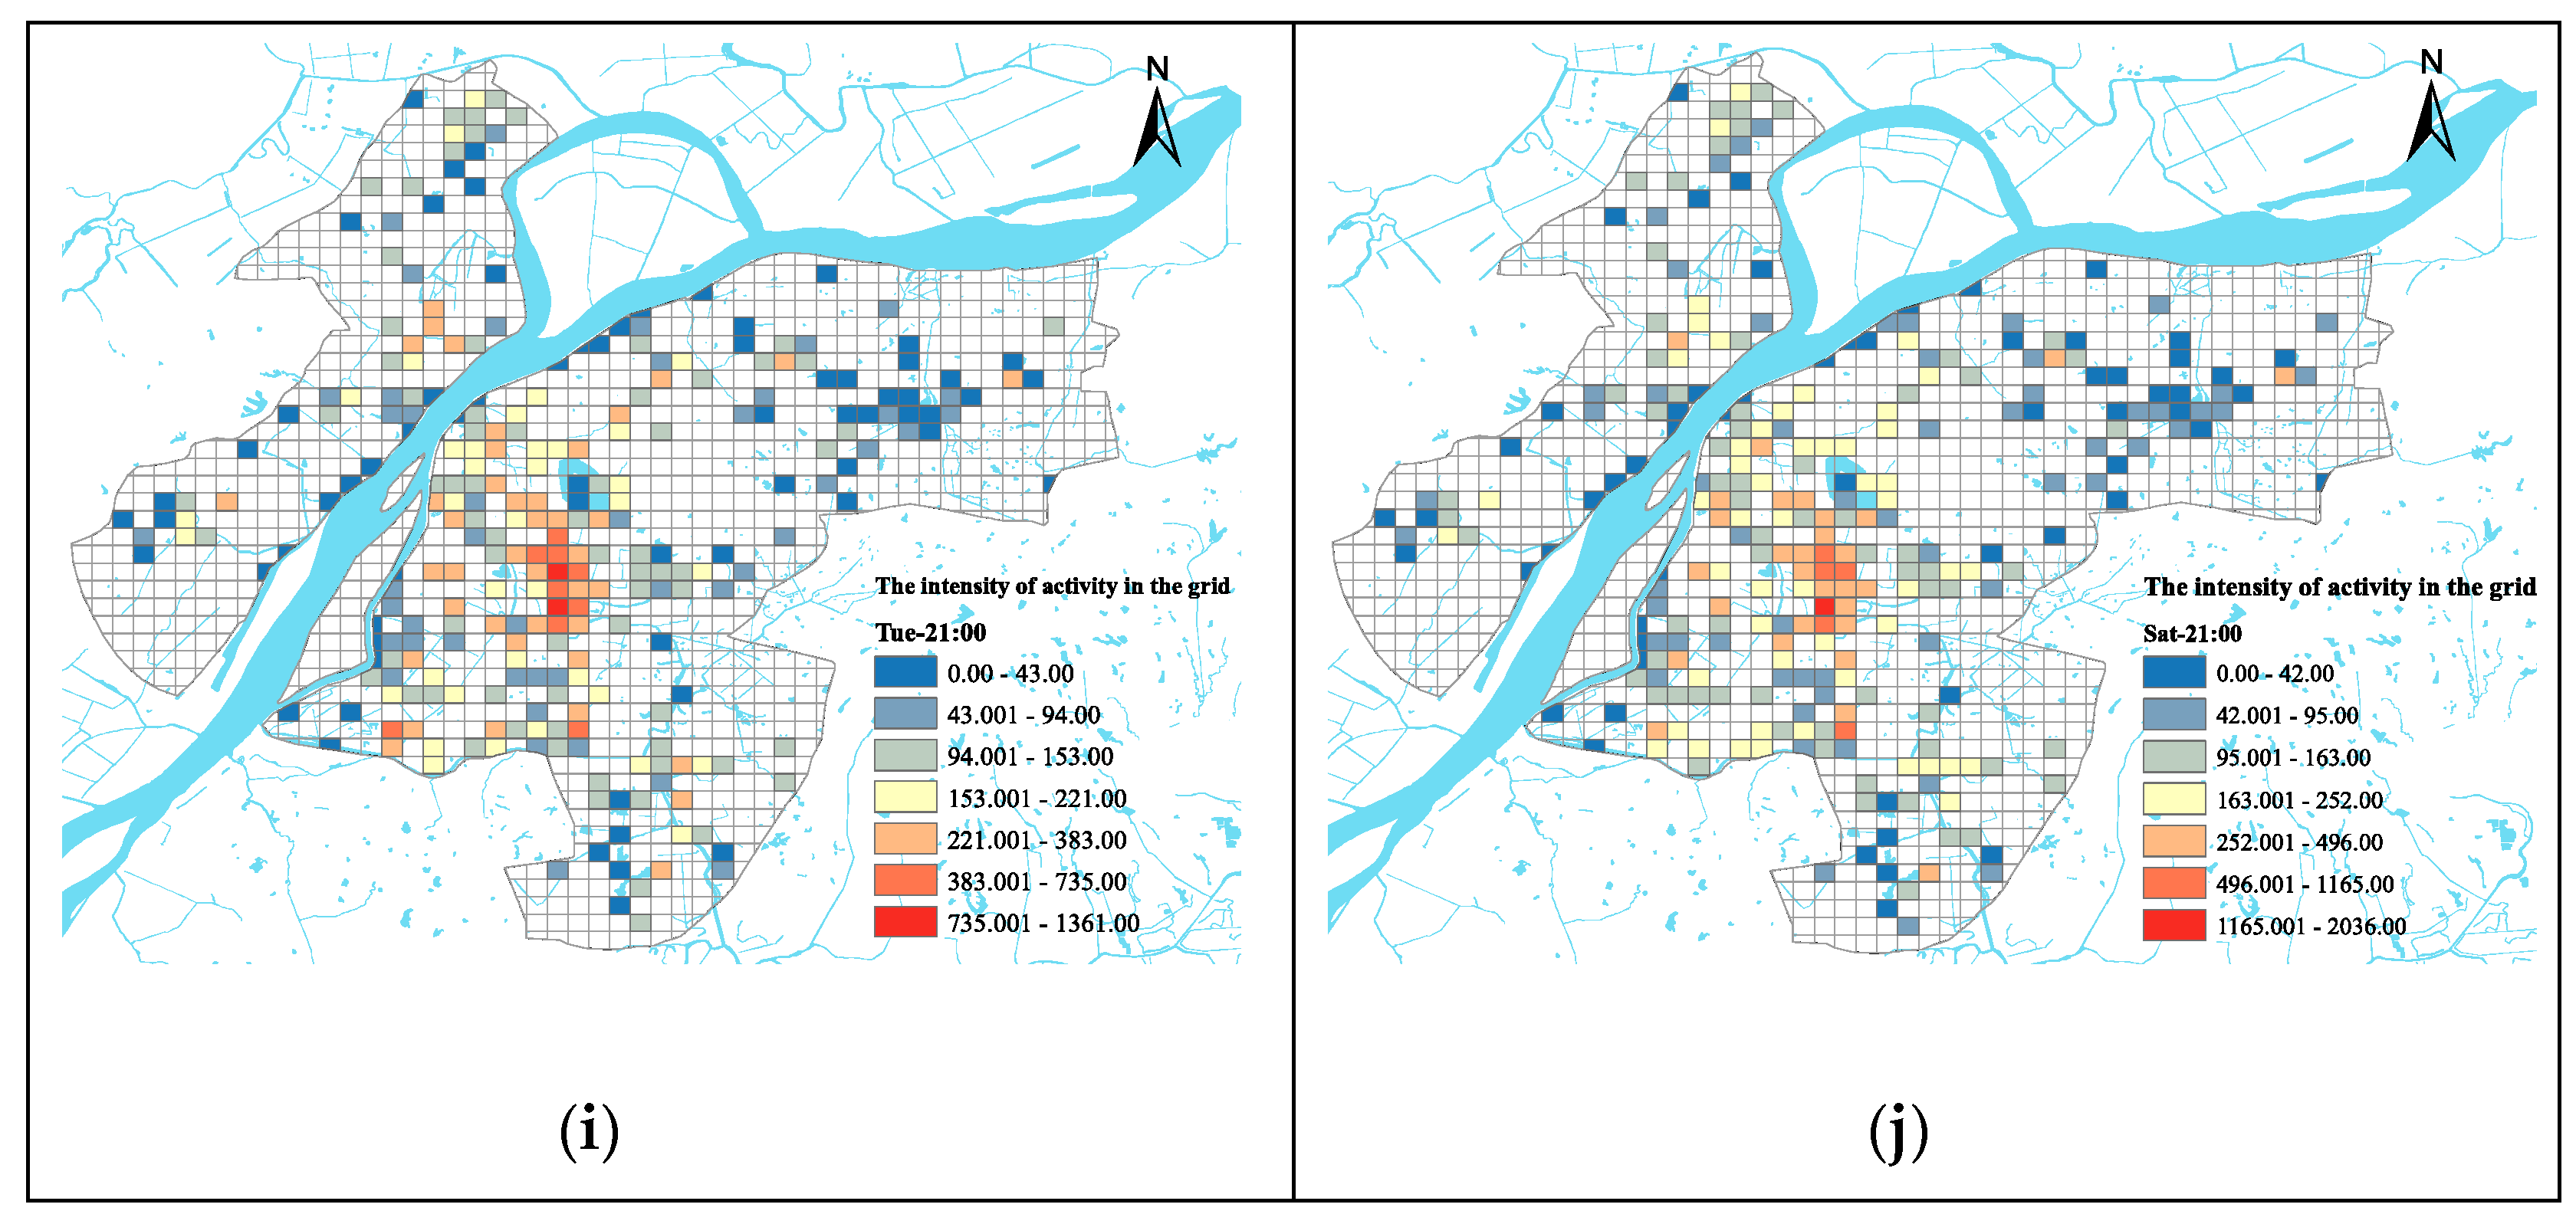
3.2. Correlation between the Distribution of Leisure Urban Spaces and the Intensity of Population Activity

To enhance readability and provide additional data supporting our research findings, Figure 6 and Figure 7 set the stage for our analysis by mapping the distribution of LUSs and PAI across urban grids. Figure 6 visualizes the concentration of LUSs, providing a spatial context for understanding the areas with high leisure potential. Complementing this, Figure 7 depicts the PAI in these grids, using color gradients to indicate varying activity levels. This visual foundation illustrates the geographic dynamics and directly supports our regression analysis results.
The regression analysis results (Table 3) indicate a significant correlation between leisure urban spaces and the PAI. The adjusted R-squared values range from 0.106 to 0.523, with all models displaying high statistical significance, as evidenced by F-statistics ranging from 0.000 to 0.005. Leisure blocks consistently show a significant positive impact at all time points, underscoring their central role in enhancing the intensity of urban population activities. Conversely, waterfront areas generally exhibit a negative impact, and parks also show negative correlations during certain periods, aligning with residents’ patterns of work and recreation during the day and rest in the evening. However, the impact of squares is statistically insignificant, suggesting their limited influence on the PAI.
On weekday, the PAI is significantly positively influenced by the overall LUS starting from 15:00, marking residents’ transition from daily work to leisure and social activities. Waterfront spaces and leisure blocks are the primary spaces influencing daytime activities, with leisure blocks showing a continuous positive effect and waterfront areas displaying the opposite trend. The impact of both increases over time, reflecting the changing reliance on and activity patterns within these spaces throughout the day. Around dinner time (approximately 19:00), the significant negative impact of parks may be related to environmental and safety factors, but by 21:00, this effect lessens, likely due to residents choosing to visit parks for walks and other routine leisure activities after completing evening family activities.
The situation on weekends is similar to weekdays but with notable differences. From 10:00, the overall space significantly influences the PAI, indicating an increase in leisure activities starting in the morning. This change shows that weekend residents are more flexible in choosing the timing of their leisure and social activities. Especially by 21:00, the positive effects of overall space and leisure blocks and the negative impact of waterfront areas are more pronounced than on weekdays. These findings suggest that urban residents have a higher intensity and participation in leisure activities on weekends compared to weekdays, emphasizing the flexibility of weekend time management and the importance of urban planning in adapting to residents’ needs.

4. Discussion

4.1. Clustering Trends and Distribution Patterns of Leisure Urban Spaces

Through a holistic analysis, this study demonstrates that Nanjing’s LUSs exhibit a pattern of central clustering with sparse peripheries, indicating meticulous urban planning to optimize spaces for residents’ leisure and social activities. This pattern confirms the significant core–periphery structure of urban leisure resource distribution highlighted in prior studies [12,13].
NNI analysis shows significant clustering tendencies for parks and squares in the city center, reflecting an urban planning focus on enhancing residents’ quality of life. This aligns with the suggestion that the vitality of these spaces is crucial for urban vitality [4]. The analysis suggests that parks and squares, as essential components of urban leisure, are well situated in densely populated areas, while waterfront spaces and leisure blocks show potential for expansion due to their limited range.
SDE analysis reveals a strategic distribution of these spaces along the southeast-to-northwest trajectory, likely influenced by Nanjing’s topography and historical urban expansion. This orientation is intended to maximize leisure space coverage and accessibility, leveraging natural geography and existing urban structures [12]. Different periods and cities show varied trends in leisure space orientation, influenced by multiple factors, including natural and socioeconomic conditions, exemplified by Beijing’s leisure industry trend “northeast-southwest” [35].
KDE analysis identifies a “one core, multiple points” distribution of LUSs in Nanjing’s central district, particularly prominent at the intersections of the Gulou, Qinhuai, and Xuanwu districts. This pattern shows a high density and continuity of LUSs, with parks and squares predominantly located in these core areas, highlighting a strategic balance between established and developing parts of the city. In contrast, waterfront spaces adjacent to natural water bodies show limited clustering and coverage. Many of these areas, previously underutilized or industrial, have been transformed into active sites for commerce and recreation, underlining the importance of urban waterfront development in city planning [50]. Leisure blocks are randomly distributed, typically along historical, cultural streets, integrating into commercial and cultural hubs. However, detailed research into the spatial characteristics of leisure blocks is scarce, suggesting a need for focused studies on these areas [51].
However, this distribution may also lead to resource concentration, with relatively lacking facilities in newly developed surrounding areas. Therefore, urban planning needs to focus on the equitable distribution of leisure resources to avoid the “core-periphery” differentiation of city services, ensuring that all residents can fairly enjoy high-quality leisure and social facilities.

4.2. Impact of Leisure Urban Space Configuration on Residents’ Activity Patterns

This study highlights the significant role these LUS play in shaping everyday behavioral patterns. The findings indicate that the activity levels of different spaces vary with time and location, with notably higher activity on weekends compared to weekdays, a phenomenon supported by the literature [28,41]. Leisure blocks, especially those in bustling old city areas, demonstrate significant activity intensity regardless of the day of the week due to their concentrated commercial functions and prime locations. Conversely, parks show decreased activity around dinner time (7 p.m.), reflecting a preference for post-dinner walks and other leisure activities, aligning with findings from previous research [52]. However, squares do not exhibit statistically significant impacts, possibly indicating their design or functionality limitations or an underactivation of their sociocultural roles. Additionally, waterfront spaces often display limited appeal in attracting residents and tourists due to their remote locations. Additionally, the distance and accessibility of leisure urban spaces (LUSs) like parks and waterfront spaces are critical factors affecting visitor utilization, as suggested by other studies [53,54]. These insights underscore the importance of enhancing accessibility in urban planning to increase the frequency of space usage and public satisfaction. Urban planners should consider different LUSs’ activity patterns and spatiotemporal variations to optimize functionality and safety.
While the analysis of the correlation between the spatial distribution of LUSs and the PAI can reveal specific patterns of residents’ leisure behaviors, this paper argues that the interaction between LUS spatial configurations and residents’ leisure behaviors and social interactions is far more complex than what is superficially observed. This complexity is likely driven by urban social determinants that shape residents’ access to LUSs and profoundly determine the usage patterns of these spaces [55]. As a critical metric for measuring urban accessibility, real estate prices directly affect the geographic distribution of leisure spaces and the structure of communities. Real estate prices may not only determine the geographical locations of leisure spaces but also shape the structure and dynamics of surrounding communities, thereby indirectly influencing the social value and functional realization of these spaces [56]. Surrounding environmental factors, such as recreational facilities and commercial services, significantly affect population activity patterns, increase footfall, and sometimes even alter surrounding areas’ social structure and economic activities [4]. Climatic conditions, especially microclimate and outdoor thermal comfort, significantly affect the use of LUS and the distribution of populations. Favorable climatic conditions can significantly enhance the frequency of outdoor activities and strengthen community interactions [57]. Therefore, future research needs to explore and validate the comprehensive impact and mechanisms of various environmental and social factors on the distribution and use of LUS further.

4.3. Limitations

While this study provides detailed insights into the distribution characteristics of LUSs in the CUA of Nanjing and their relationship with PAI, it also encounters several limitations. Firstly, the focus on Nanjing’s CUA may restrict the broader applicability of the findings, as other cities or regions within Nanjing might exhibit different leisure space distributions and activity patterns. Secondly, the types of LUS covered are limited, including primarily parks, squares, waterfront spaces, and leisure blocks, and do not encompass other types of leisure spaces, such as gardens or art spaces that might be prevalent in other urban or regional contexts. Moreover, although the study includes data on population activities during the weekday and weekend, it does not account for seasonal variations or special holidays, which could significantly impact population activity levels. Additionally, the correlation analysis reveals general urban leisure activity trends and does not delve into specific patterns and distributions. Finally, the population in these spaces may not comprehensively represent the entire city’s demographic. Mainly, these high-quality spaces often attract residents with specific socioeconomic characteristics, which may limit the generalizability of conclusions, as the results might be biased towards middle- and high-income groups that frequently visit these leisure facilities.
To enhance the breadth and depth of future research, studies should expand the scope to include comparative analyses across different types of LUS and examine how seasonal changes affect the usage of spaces and the PAI. Integrating urban climate models, especially microscale building resolution models like PALM, ENVI-met, and MITRAS, is recommended. These models precisely document the impacts of microclimatic variations and outdoor thermal comfort on LUS at various times. They are instrumental in identifying and mitigating urban heat island effects, optimizing climate change adaptation measures, and providing robust empirical data for urban planning and adaptive strategies [58]. Research should also refine the categorization of LUSs based on regional characteristics to comprehensively assess their contributions to urban quality of life. Furthermore, future studies should employ more sophisticated data analysis techniques to deepen the understanding of leisure activity patterns and identify activity hotspots in specific areas. Future research should include a broader demographic sample, particularly those from low-income and less frequent users of these facilities, to provide a more comprehensive and inclusive assessment of urban leisure space use. In light of the discussion above, further validating the impact and mechanisms of various environmental and social factors on the distribution and use of LUS is necessary.

4.4. Urban Planning Recommendations

Based on an in-depth analysis of the distribution characteristics of LUS in Nanjing’s Central Urban Area (CUA), the study proposes targeted recommendations to enhance urban leisure environments: (1) Develop a Balanced Urban Leisure Network: Prioritize easy access to LUS within walking distance across all neighborhoods, especially targeting underserved peripheries and newly developed areas. Establish a diversified leisure system responsive to local population density and needs. (2) Optimize Park Functionality and Distribution: Increase green space availability in densely populated districts by constructing small parks and micro-green areas. In less dense areas like Pukou, Liuhe, and Jiangning, develop larger parks to meet growing leisure demands. (3) Enhance Squares for Social and Cultural Interaction: Establish new squares in high-need areas such as Pukou and Qixia to improve leisure space distribution and accessibility. Promote cultural activities and public interactions in existing squares, transforming them into vibrant urban cultural exchange hubs. (4) Enhance the Attractiveness and Functionality of Waterfront Areas: Transform underutilized waterfront areas along the Yangtze River in the Jiangbeweand Qinhuai River into accessible public spaces. Restore historical waterways and construct cultural facilities to enhance these areas’ cultural heritage and recreational appeal. Strengthen connectivity between waterfront spaces to enrich the city’s overall functional layout. (5) Develop Regionally Distinctive Leisure Blocks: Develop culturally unique leisure blocks in the Luhe district in Jiangbei and the Qixia and Yuhuatai districts in Jiangnan, blending historical and modern design elements to enhance regional distinctiveness. These strategies aim to create inclusive, functional, and attractive leisure environments, fostering enhanced quality of life and greater social interaction among residents of Nanjing.

5. Conclusions

This study conducted an in-depth analysis of the distribution of LUSs in the Central Urban Area of Nanjing and their impact on PAI, revealing these spaces’ clustering trends and spatial characteristics and how they influence residents’ daily life patterns. By integrating POI and AOI data, this study accurately captured the locations of various types of LUS and used Baidu heat map data to analyze PAI thoroughly. The study employed nearest neighbor analysis, standard deviation ellipse analysis, and kernel density estimation and further explored the impact of LUS on PAI through multiple linear regression analysis.
The results show that parks and squares in the CUA of Nanjing exhibit strong clustering tendencies, while waterfront spaces show relatively weak clustering and leisure blocks tend to be randomly distributed, reflecting strategic planning for different LUSs. Standard deviation ellipse analysis reveals that LUSs in the CUA of Nanjing are relatively concentrated and exhibit a clear southeast-to-northwest direction of clustering expansion, with parks having the largest spatial distribution and widest service range, centered approximately in the old town area. Kernel density analysis indicates that the spatial distribution pattern of LUS in Nanjing’s CUA displays a “one core, multiple points” layout, with the intersection of the Gulou, Qinhuai, and Xuanwu districts as the major core, gradually expanding outward. The distribution of different spaces includes parks forming three dense cores, squares concentrated in the city center and northern new districts, waterfront spaces distributed along major water bodies forming a large central cluster and several smaller clusters, and leisure blocks mainly concentrated in the bustling commercial areas of the old town.
Furthermore, the study revealed the pivotal role of LUS in influencing residents’ daily activity patterns and demonstrated how activity intensity varies over time. Leisure blocks in the city center exhibit high activity levels on weekends and weekdays, while the activity in parks decreases during dinner time, reflecting a trend towards evening leisure activities. In contrast, squares’ social and cultural functions seem not to be fully activated, and their impact is less significant than expected. Additionally, the attractiveness of waterfront spaces is lower due to their remote locations.
These findings reveal the patterns of residents’ daily leisure activities and provide empirical support for the future planning of leisure spaces in Nanjing. The study shows urban planners how to effectively configure leisure spaces to enhance the region’s cultural vitality and resource efficiency, thereby significantly improving urban living quality and residents’ well-being. Additionally, the research emphasizes the importance of considering spatiotemporal patterns in the design of leisure spaces and suggests that future studies explore the usage patterns of leisure urban spaces in different cultural and climatic contexts and their potential health impacts.

Author Contributions

Conceptualization, X.L.; methodology, X.L.; software, X.L.; validation, X.L.; formal analysis, X.L.; investigation, X.L.; resources, X.L.; data curation, X.L.; writing—original draft preparation, X.L.; writing—review and editing, X.L., M.K., S.B.I. and S.A.S.; visualization, X.L.; supervision, X.L. and M.K.; project administration, X.L. and M.K.; funding acquisition, X.L. All authors have read and agreed to the published version of the manuscript.

Funding

This research received no external funding.

Institutional Review Board Statement

Not applicable.

Informed Consent Statement

Not applicable.

Data Availability Statement

Data are contained within the article.

Conflicts of Interest

The authors declare no conflicts of interest.

References

  1. Corbusier, L.; Eardley, A. The Athens Charter; Grossman Publishers: New York, NY, USA, 1973; ISBN 0-670-13970-X. [Google Scholar]
  2. Lubowiecki-Vikuk, A.; Đerčan, B.M.; de Sousa, B.M.B. Sustainable Development and Leisure Services: Changes and Trends. In Handbook of Sustainable Development Leisure Services; Springer: Cham, Switzerland, 2021; pp. 1–20. [Google Scholar]
  3. Chen, L.; Ma, Y. How Do Ecological and Recreational Features of Waterfront Space Affect Its Vitality? Developing Coupling Coordination and Enhancing Waterfront Vitality. Int. J. Environ. Res. Public Health 2023, 20, 1196. [Google Scholar] [CrossRef]
  4. Wang, T.; Li, Y.; Li, H.; Chen, S.; Li, H.; Zhang, Y. Research on the Vitality Evaluation of Parks and Squares in Medium-Sized Chinese Cities from the Perspective of Urban Functional Areas. Int. J. Environ. Res. Public Health 2022, 19, 15238. [Google Scholar] [CrossRef] [PubMed]
  5. Kondo, M.; Fluehr, J.; McKeon, T.; Branas, C. Urban Green Space and Its Impact on Human Health. Int. J. Environ. Res. Public Health 2018, 15, 445. [Google Scholar] [CrossRef]
  6. White, M.P.; Elliott, L.R.; Gascon, M.; Roberts, B.; Fleming, L.E. Blue Space, Health and Well-Being: A Narrative Overview and Synthesis of Potential Benefits. Environ. Res. 2020, 191, 110169. [Google Scholar] [CrossRef]
  7. Jennings, V.; Bamkole, O. The Relationship between Social Cohesion and Urban Green Space: An Avenue for Health Promotion. Int. J. Environ. Res. Public Health 2019, 16, 452. [Google Scholar] [CrossRef]
  8. Wan, C.; Shen, G.Q.; Choi, S. Underlying Relationships between Public Urban Green Spaces and Social Cohesion: A Systematic Literature Review. City Cult. Soc. 2021, 24, 100383. [Google Scholar] [CrossRef]
  9. Sun, X.; Liu, H.; Liao, C.; Nong, H.; Yang, P. Understanding Recreational Ecosystem Service Supply-Demand Mismatch and Social Groups’ Preferences: Implications for Urban–Rural Planning. Landsc. Urban Plan. 2024, 241, 104903. [Google Scholar] [CrossRef]
  10. Jian, I.Y.; Luo, J.; Chan, E.H. Spatial Justice in Public Open Space Planning: Accessibility and Inclusivity. Habitat Int. 2020, 97, 102122. [Google Scholar] [CrossRef]
  11. Feng, S.; Chen, L.; Sun, R.; Feng, Z.; Li, J.; Khan, M.S.; Jing, Y. The Distribution and Accessibility of Urban Parks in Beijing, China: Implications of Social Equity. Int. J. Environ. Res. Public Health 2019, 16, 4894. [Google Scholar] [CrossRef]
  12. Zhang, S.; Liu, J.; Song, C.; Chan, C.-S.; Pei, T.; Wenting, Y.; Xin, Z. Spatial-Temporal Distribution Characteristics and Evolution Mechanism of Urban Parks in Beijing, China. Urban For. Urban Green. 2021, 64, 127265. [Google Scholar] [CrossRef]
  13. Qu, X.; Xu, G.; Qi, J.; Bao, H. Identifying the Spatial Patterns and Influencing Factors of Leisure and Tourism in Xi’an Based on Point of Interest (POI) Data. Land 2023, 12, 1805. [Google Scholar] [CrossRef]
  14. Wang, M.; Liu, S.; Wang, C. Spatial Distribution and Influencing Factors of High-Quality Tourist Attractions in Shandong Province, China. PLoS ONE 2023, 18, e0288472. [Google Scholar] [CrossRef]
  15. He, D.; Chen, Z.; Ai, S.; Zhou, J.; Lu, L.; Yang, T. The Spatial Distribution and Influencing Factors of Urban Cultural and Entertainment Facilities in Beijing. Sustainability 2021, 13, 12252. [Google Scholar] [CrossRef]
  16. Wang, X.; Zhang, T.; Duan, L.; Liritzis, I.; Li, J. Spatial Distribution Characteristics and Influencing Factors of Intangible Cultural Heritage in the Yellow River Basin. J. Cult. Herit. 2024, 66, 254–264. [Google Scholar] [CrossRef]
  17. Zhang, Y.; Yi Ming, Y.; Shi, B. Spatial Distribution Characteristics and Causes of Public Sports Venues in China. Sci. Rep. 2023, 13, 15056. [Google Scholar] [CrossRef] [PubMed]
  18. Zhu, L.; Hu, A. Reading and Interpretation of “Classification and Requirements of Urban Public Leisure Spaces”. Pop. Stand. 2014, 8–11. [Google Scholar]
  19. Mehhdi, R.; Johari, M.Y.M.; Afshin, S. Terminology of Urban Open and Green Spaces. In Proceedings of the 11th ASEAN Postgraduate Seminar (APGS 2017), At Faculty of Built Environment, Kuala Lumpur, Malaysia, 15 November 2017. [Google Scholar]
  20. Salama, A.M.; Remali, A.M.; MacLean, L. Deciphering urban life: A multi-layered investigation of St. Enoch Square, Glasgow CIty Centre. ArchNet-IJAR 2017, 11, 137. [Google Scholar] [CrossRef]
  21. Shangi, Z.A.D.; Tanvir, H.; Imtiaz, A.M. Rethinking Urban Water-Front as a Potential Public Open Space: Interpretative Framework of Surma Waterfront. Archit. Res. 2020, 10, 69–74. [Google Scholar]
  22. Carmona, M. Public Places Urban Spaces: The Dimensions of Urban Design; Routledge: London, UK, 2021; ISBN 1-315-15845-0. [Google Scholar]
  23. Lu, C.; Pang, M.; Zhang, Y.; Li, H.; Lu, C.; Tang, X.; Cheng, W. Mapping Urban Spatial Structure Based on POI (Point of Interest) Data: A Case Study of the Central City of Lanzhou, China. Int. J. Geo-Inf. 2020, 9, 92. [Google Scholar] [CrossRef]
  24. Luo, G.; Ye, J.; Wang, J.; Wei, Y. Urban Functional Zone Classification Based on POI Data and Machine Learning. Sustainability 2023, 15, 4631. [Google Scholar] [CrossRef]
  25. Nanjing GOV. Natural Conditions. 2023. Available online: https://www.nanjing.gov.cn/zjnj/zrzk/201910/t20191014_1676314.html (accessed on 20 August 2023).
  26. Teng, F.; Wang, Y.; Wang, M.; Wang, L. Monitoring and Analysis of Population Distribution in China from 2000 to 2020 Based on Remote Sensing Data. Remote Sens. 2022, 14, 6019. [Google Scholar] [CrossRef]
  27. Marquet, O.; Hirsch, J.A.; Kerr, J.; Jankowska, M.M.; Mitchell, J.; Hart, J.E.; Laden, F.; Hipp, J.A.; James, P. GPS-Based Activity Space Exposure to Greenness and Walkability Is Associated with Increased Accelerometer-Based Physical Activity. Environ. Int. 2022, 165, 107317. [Google Scholar] [CrossRef]
  28. Liu, S.; Chen, X.; Zhang, F.; Liu, Y.; Ge, J. What Drives the Spatial Heterogeneity of Urban Leisure Activity Participation? A Multisource Big Data-Based Metrics in Nanjing, China. Int. J. Geo-Inf. 2023, 12, 499. [Google Scholar] [CrossRef]
  29. Shi, Y.; Yang, J.; Shen, P. Revealing the Correlation between Population Density and the Spatial Distribution of Urban Public Service Facilities with Mobile Phone Data. Int. J. Geo-Inf. 2020, 9, 38. [Google Scholar] [CrossRef]
  30. Bao, W.; Gong, A.; Zhang, T.; Zhao, Y.; Li, B.; Chen, S. Mapping Population Distribution with High Spatiotemporal Resolution in Beijing Using Baidu Heat Map Data. Remote Sens. 2023, 15, 458. [Google Scholar] [CrossRef]
  31. Zhang, S.; Zhang, W.; Wang, Y.; Zhao, X.; Song, P.; Tian, G.; Mayer, A.L. Comparing Human Activity Density and Green Space Supply Using the Baidu Heat Map in Zhengzhou, China. Sustainability 2020, 12, 7075. [Google Scholar] [CrossRef]
  32. Ding, J.; Luo, L.; Shen, X.; Xu, Y. Influence of Built Environment and User Experience on the Waterfront Vitality of Historical Urban Areas: A Case Study of the Qinhuai River in Nanjing, China. Front. Archit. Res. 2023, 12, 820–836. [Google Scholar] [CrossRef]
  33. Zhu, J.; Lu, H.; Zheng, T.; Rong, Y.; Wang, C.; Zhang, W.; Yan, Y.; Tang, L. Vitality of Urban Parks and Its Influencing Factors from the Perspective of Recreational Service Supply, Demand, and Spatial Links. Int. J. Environ. Res. Public Health 2020, 17, 1615. [Google Scholar] [CrossRef]
  34. Li, J.; Li, J.; Yuan, Y.; Li, G. Spatiotemporal Distribution Characteristics and Mechanism Analysis of Urban Population Density: A Case of Xi’an, Shaanxi, China. Cities 2019, 86, 62–70. [Google Scholar] [CrossRef]
  35. Liu, Y.; Zhang, Y.; Jin, S.T.; Liu, Y. Spatial Pattern of Leisure Activities among Residents in Beijing, China: Exploring the Impacts of Urban Environment. Sustain. Cities Soc. 2020, 52, 101806. [Google Scholar] [CrossRef]
  36. Nanjing GOV. The Seventh National Census Data 2021. Available online: https://www.nanjing.gov.cn/zgnjsjb/jrtt/202202/t20220222_3299732.html (accessed on 20 August 2023).
  37. Liu, S.; Long, Y.; Zhang, L.; Liu, H. Quantifying and Characterizing Urban Leisure Activities by Merging Multiple Sensing Big Data: A Case Study of Nanjing, China. Land 2021, 10, 1214. [Google Scholar] [CrossRef]
  38. Nanjing GOV. Survey Report on Satisfaction with Urban Parks and Greening in Nanjing. 2021. Available online: https://www.nanjing.gov.cn/hdjl/zjdc/wsdc/202110/t20211021_3165310.html (accessed on 20 August 2023).
  39. Nanjing GOV. Territorial Spatial Master Planning of Nanjing (2021–2035). 2022. Available online: https://www.nanjing.gov.cn/zgnjsjb/jrtt/202210/t20221029_3740005.html (accessed on 20 August 2023).
  40. Luo, S.; Liu, Y.; Du, M.; Gao, S.; Wang, P.; Liu, X. The Influence of Spatial Grid Division on the Layout Analysis of Urban Functional Areas. ISPRS Int. J. Geo-Inf. 2021, 10, 189. [Google Scholar] [CrossRef]
  41. Yang, Y.; Pentland, A.; Moro, E. Identifying Latent Activity Behaviors and Lifestyles Using Mobility Data to Describe Urban Dynamics. EPJ Data Sci. 2023, 12, 15. [Google Scholar] [CrossRef]
  42. Clark, P.J.; Evans, F.C. Distance to Nearest Neighbor as a Measure of Spatial Relationships in Populations. Ecology 1954, 35, 445–453. [Google Scholar] [CrossRef]
  43. Li, X.; Qian, Y.; Zeng, J.; Wei, X.; Guang, X. The Influence of Strip-City Street Network Structure on Spatial Vitality: Case Studies in Lanzhou, China. Land 2021, 10, 1107. [Google Scholar] [CrossRef]
  44. Lefever, D.W. Measuring Geographic Concentration by Means of the Standard Deviational Ellipse. Am. J. Sociol. 1926, 32, 88–94. [Google Scholar] [CrossRef]
  45. Zhang, Y.; Jiang, P.; Cui, L.; Yang, Y.; Ma, Z.; Wang, Y.; Miao, D. Study on the Spatial Variation of China’s Territorial Ecological Space Based on the Standard Deviation Ellipse. Front. Environ. Sci. 2022, 10, 982734. [Google Scholar] [CrossRef]
  46. Zhong, Y.; Lin, A.; Zhou, Z. Evolution of the Pattern of Spatial Expansion of Urban Land Use in the Poyang Lake Ecological Economic Zone. Int. J. Environ. Res. Public Health 2019, 16, 117. [Google Scholar] [CrossRef]
  47. Bowman, A.W.; Azzalini, A. Applied Smoothing Techniques for Data Analysis: The Kernel Approach with S-Plus Illustrations; OUP Oxford: Oxford UK, 1997; Volume 18, ISBN 0-19-154569-4. [Google Scholar]
  48. Neter, J.; Kutner, M.H.; Nachtsheim, C.J.; Wasserman, W. Applied Linear Statistical Models; McGraw-Hill Professional Publishing: New York, NY, USA, 1996. [Google Scholar]
  49. Zhao, K.; Cao, X.; Wu, F.; Chen, C. Spatial Pattern and Drivers of China’s Public Cultural Facilities between 2012 and 2020 Based on POI and Statistical Data. Int. J. Geo-Inf. 2023, 12, 273. [Google Scholar] [CrossRef]
  50. Wu, J.; Li, J.; Ma, Y. Exploring the Relationship between Potential and Actual of Urban Waterfront Spaces in Wuhan Based on Social Networks. Sustainability 2019, 11, 3298. [Google Scholar] [CrossRef]
  51. Zheng, B.; Tian, F.; Lin, L.; Fan, J. Study on the Morphological Analysis and Evolution of the Street Network in the Historic Urban Area of Changsha City from 1872–2023. Land 2024, 13, 738. [Google Scholar] [CrossRef]
  52. Mu, B.; Liu, C.; Mu, T.; Xu, X.; Tian, G.; Zhang, Y.; Kim, G. Spatiotemporal Fluctuations in Urban Park Spatial Vitality Determined by On-Site Observation and Behavior Mapping: A Case Study of Three Parks in Zhengzhou City, China. Urban For. Urban Green. 2021, 64, 127246. [Google Scholar] [CrossRef]
  53. Tu, X.; Huang, G.; Wu, J.; Guo, X. How Do Travel Distance and Park Size Influence Urban Park Visits? Urban For. Urban Green. 2020, 52, 126689. [Google Scholar] [CrossRef]
  54. Niu, Y.; Mi, X.; Wang, Z. Vitality Evaluation of the Waterfront Space in the Ancient City of Suzhou. Front. Archit. Res. 2021, 10, 729–740. [Google Scholar] [CrossRef]
  55. Yu, S.; Zhu, X.; He, Q. An Assessment of Urban Park Access Using House-Level Data in Urban China: Through the Lens of Social Equity. Int. J. Environ. Res. Public Health 2020, 17, 2349. [Google Scholar] [CrossRef] [PubMed]
  56. Chen, Y.; Yue, W.; La Rosa, D. Which Communities Have Better Accessibility to Green Space? An Investigation into Environmental Inequality Using Big Data. Landsc. Urban Plan. 2020, 204, 103919. [Google Scholar] [CrossRef]
  57. Niu, J.; Xiong, J.; Qin, H.; Hu, J.; Deng, J.; Han, G.; Yan, J. Influence of Thermal Comfort of Green Spaces on Physical Activity: Empirical Study in an Urban Park in Chongqing, China. Build. Environ. 2022, 219, 109168. [Google Scholar] [CrossRef]
  58. Anders, J.; Schubert, S.; Sauter, T.; Tunn, S.; Schneider, C.; Salim, M. Modelling the Impact of an Urban Development Project on Microclimate and Outdoor Thermal Comfort in a Mid-Latitude City. Energy Build. 2023, 296, 113324. [Google Scholar] [CrossRef]
Figure 1. Maps showing: (a) the location of Nanjing in China; (b) the Central Urban Area within Nanjing; (c) a detailed map of the Central Urban Area. Source: (Author, 2024).
Sustainability 16 07160 g001aSustainability 16 07160 g001b
Figure 2. Analytical Framework. Source: (Author, 2024).
Sustainability 16 07160 g002
Figure 3. Data Processing Workflow for Various Leisure Urban Space Locations. Source: (Author, 2024).
Sustainability 16 07160 g003
Figure 4. Standard Deviation Ellipse of Leisure Urban Spaces in Central Urban Area of Nanjing. Source: (Author, 2024).
Sustainability 16 07160 g004
Figure 5. Nuclear Density Distribution: (a) Overall LUS; (b) Parks; (c) Squares; (d) Waterfront Spaces; (e) Leisure Blocks. Source: (Author, 2024).
Sustainability 16 07160 g005aSustainability 16 07160 g005b
Figure 6. Distribution of the Number of LUSs in Each Grid: (a) Parks; (b) Squares; (c) Waterfront Spaces; (d) Leisure Blocks. Source: (Author, 2024).
Sustainability 16 07160 g006
Figure 7. Distribution of PAI in Grids Providing LUSs in Each Grid: (a) Tue-6:00; (b) Sat-6:00; (c) Tue-10:00; (d) Sat-10:00; (e) Tue-15:00; (f) Sat-15:00; (g) Tue-19:00; (h) Sat-19:00; (i) Tue-21:00; (j) Sat-21:00. Source: (Author, 2024).
Sustainability 16 07160 g007aSustainability 16 07160 g007bSustainability 16 07160 g007c
Table 1. Results of nearest distance analysis.
Average Observational Distance (m)Expected Average Distance (m)NNI (R)Z-Valuep-ValueSpatial Distribution Type
Overall612.291175.940.52−18.50Clustered
Parks779.131199.820.65−9.150Clustered
Squares775.171346.890.58−10.460Clustered
Waterfront Spaces1338.971735.600.77−2.30.02Weakly clustered
Leisure Blocks1766.751788.380.99−0.120.9Random
Table 2. Results of standard deviation ellipse analysis.
Area (Km2)Center XCenter YXStdDistYStdDistRotation
Overall545.9836118.784832.05950.10930.1087132.4345
Parks 614.4414118.798932.06670.12330.108465.9951
Squares 485.4175118.785532. 05880.0970.109159.8054
Waterfront Spaces 242.0485118.748332.04970.06380.082623.8854
Leisure Blocks 275.7554118.783632.02510.04390.1369144.099
Table 3. Results of multiple linear regression.
Workday6:0010:0015:0019:0021:00
Overall 42.183 ***78.741 ***64.289 ***
Parks −54.468 **−26.308 *
Squares
Waterfront Spaces−22.026 ***−61.777 **−70.212 **−70.398 **−78.694 **
Leisure Blocks25.176 ***71.621 ***111.947 ***217.578 ***169.428 ***
R20.2030.1420.250.4550.511
Adj. R20.1690.1060.2180.4320.491
F6.053.9217.89619.81924.828
Sig.0.0000.0050.0000.0000.000
Weekend6:0010:0015:0019:0021:00
Overall 27.577 **51.439 ***78.741 ***106.303 ***
Parks −54.468 **−57.155 *
Squares
Waterfront Spaces−15.583 *−60.389 **−69.652 **−70.398 **−99.07 **
Leisure Blocks21.935 ***86.784 ***125.127 ***217.578 ***264.931 ***
R20.1470.1860.2750.4550.523
Adj. R20.1110.1510.2450.4320.503
F4.0883.9215.4199.01626.086
Sig.0.0040.0050.0010.0000.000
***, **, * represent significance levels of 1%, 5%, and 10%, respectively.
Disclaimer/Publisher’s Note: The statements, opinions and data contained in all publications are solely those of the individual author(s) and contributor(s) and not of MDPI and/or the editor(s). MDPI and/or the editor(s) disclaim responsibility for any injury to people or property resulting from any ideas, methods, instructions or products referred to in the content.

