Article

Enhancing Decision Making and Decarbonation in Environmental Management: A Review on the Role of Digital Technologies

by
Abdel-Mohsen O. Mohamed
1,2,*,
Dina Mohamed
3,
Adham Fayad
4 and
Moza T. Al Nahyan
5
1
Uberbinder Limited, Oxford OX4 4GP, UK
2
EX Scientific Consultants, Abu Dhabi P.O. Box 762428, United Arab Emirates
3
Educational Research, Lancaster University, Lancaster LA1 4YW, UK
4
Business Management, De Montfort University, Dubai Campus, Dubai P.O. Box 294345, United Arab Emirates
5
College of Business, Abu Dhabi University, Abu Dhabi P.O. Box 59911, United Arab Emirates
*
Author to whom correspondence should be addressed.
Sustainability 2024, 16(16), 7156; https://doi.org/10.3390/su16167156
Submission received: 16 July 2024 / Revised: 12 August 2024 / Accepted: 15 August 2024 / Published: 20 August 2024
(This article belongs to the Section Waste and Recycling)

Abstract

:
As global concerns about climate change intensify, the need for effective strategies to reduce carbon emissions, has never been more urgent. This review paper explores the crucial role of digital technologies (i.e., data automation (DA) and decision support systems (DSSs)) in enhancing decision making and achieving a ZERONET initiative (decarbonation efforts) within the realms of solid waste management (SWM), wastewater treatment (WWT), and contaminated soil remediation (CSR). Specifically, the paper provides (a) an overview of the carbon footprint (CFP) in relation to environmental management (EM) and the role of DA and DSS in decarbonization; (b) case studies in areas of SWM, WWT, and CSR in relation to the use of (i) digital technology; ((ii) life cycle assessment (LCA)-based DSS; and (iii) multi-criteria decision analysis (MCDA)-based DSS; and (c) optimal contractual delivery method-based DSS case studies in EM practices. This review concludes that the adoption of DA and DSSs in SWM, WWT, and CSR holds significant potential for enhancing decision making and decarbonizing EM processes. By optimizing operations, enhancing resource efficiency, and integrating renewable energy sources, smart EM technologies can contribute to a reduction in GHG emissions and the promotion of sustainable EM practices. As the demand for more effective and eco-friendly solutions grows, the role of DA and DSSs will become increasingly pivotal in achieving global decarbonization goals.

1. Introduction

As per the 2022 IEA CO2 emission report, which was presented at COP28UAE (www.iea.org), the global carbon dioxide (CO2) emissions from energy combustion and industrial processes grew 0.9% or 321 Mt in 2022 to a new all-time high of 36.8 Gt. In 2020, emissions reduced by more than 5% as the COVID-19 pandemic cut energy demand. However, in 2021, emissions rebounded past pre-pandemic levels, growing more than 6%. The CO2 emissions from energy combustion grew by around 1.3% or 423 Mt in 2022, while CO2 emissions from industrial processes declined by 102 Mt. At a global level, CO2 emissions from power and transport (including international bunkers) grew by 261 Mt and 254 Mt, respectively, more than offsetting reductions from industry and buildings.
The contributions of practitioners, from the environmental management (EM) profession, to the reduction of the carbon footprint (CFP) are highlighted using three different engineering practices: solid waste management (SWM), wastewater treatment (WWT), and contaminated soil remediation (CSR). The CFP associated with SWM practices is addressed in view of a study by Hong et al. [1], who quantified the CO2e of three medical waste disposal scenarios (i.e., pyrolysis, chemical disinfection, and steam sterilization) using the life cycle assessment (LCA) method as the decision support system (DSS). The results showed that steam sterilization exhibit the highest CFP (3.73 × 10³ kg CO2e) followed by pyrolysis (1.26 × 10³ kg CO2e) and chemical disinfection (8.00 × 10² kg CO2e) because of the differences in energy consumption (Figure 1). Therefore, practitioners must consider the climate change impact of the technologies used to treat solid wastes in their EM projects.
The CFPs associated with WWT plants were reported to be 23–43% of the GHG emissions due to N2O generated by microbial metabolic activities throughout the processes of WWT and sludge treatment/disposal [2,3] and 14–36% of the total emissions due to CO2 from the consumption of energy and resources [4]. For example, in a study by Sweetapple et al. [5], it was reported that the emissions of CH4 and N2O from the wastewater sector were over 5% of the global non-CO2 GHG emissions in 2005 and are expected to increase to about 22% by 2030. Although the quantity of N2O emissions is less than that of CH4 emissions, N2O emissions usually have a much higher impact (546 g CO2e/m3) than CH4 (284 g CO2e/m3) emissions [6]. In addition, Zhang et al. [7] have indicated that the CFP due to gaseous emissions (CH4 and N2O) plays an important role, especially for WWT plants with high influent concentrations of pollutants.
Furthermore, the consumption of electricity and chemicals in running a typical WWT plant is very high. It is estimated that about 3–4% of the total global electricity consumption is attributed to running of the aeration system, lifting pumps, and sludge dewatering units within a WWT [8,9]. Chemicals are consumed in removing phosphorus and the dewatering of sludge, or they are utilized as carbon sources for denitrification. For example, in a study by Zawartka et al. [10], the total CFP for all stages of each element within the system of a central wastewater treatment plant, septic tank, household wastewater treatment plant, and sewerage system (Figure 2) was estimated at 3290.82 kg CO2e/functional unit with percent contributions as 53, 17, 16, and 14% for the central wastewater treatment plant, septic tank, and household wastewater treatment plant, respectively.
Therefore, reducing the carbon emissions from WWT plants could assist in reducing GHG. As per the IWA [https://iwa-network.org/net-zero-the-race-we-all-win/ accessed on 27 May 2024], about 50% of energy-related emissions from the wastewater sector can be subsided with existing technologies, such as intelligent wastewater pumping systems, adaptive mixers with variable speed drives, and real-time DSS. For example, the EWE WASSER GmbH (EWE) company, in Cuxhaven Germany, has adopted a digital twin in their systems, resulting in an optimized operation, reducing the aeration energy use by 30% and saving 1.1 million kWh annually, while ensuring effluent water quality compliance. Other innovative approaches highlighted by the IWA include remote, real-time monitoring, intelligent pump stations, and the generation of renewable power from waste. Moreover, additional approaches that can be implemented are carbon capture to improve energy recovery by digestion, biological treatment to improve effluent quality, and digital technologies to help decision making when choosing the appropriate treatment technology that contributes to lowering CFP.
The CFP associated with CSR practices can be emphasized in view of a study by Vocciante et al. [11], who estimated the CO2e using LCA of four CSR technologies (excavation and landfilling, soil washing, electro-kinetics, and phytoremediation) for soil contaminated with heavy metals (lead, arsenic, and thallium) in Italy (Figure 3). The CFP over a period of 100 years was normalized per m3 of contaminated soil and the analysis considered each process from cradle-to-grave with reclamation potential of the site. The results indicated that phytoremediation (total CPF = 7.94 Kg CO2e/m3) was the best option followed by soil washing (total CPF = 44.64 Kg CO2e/m3) and electro-kinetics (total CPF = 301.73 Kg CO2e/m3). Excavation and landfilling produced the highest CFP (total CPF = 11,436.51 Kg CO2 eq./m3) and was considered the least favored technology. Therefore, the use of an appropriate digital technology would help the decision making process in choosing the best technology with minimum CFP.
Therefore, decarbonation (i.e., the reduction of CO2 emissions) is a critical aspect in EM practices aimed at mitigating climate change impacts. Effective decarbonation strategies by using LCA, as an example, to assist in deciding the most suitable treatment technology in SWM, WWT, and CSR are essential.
Traditional approaches in SWM, WWT, and CSR often rely on manual data collection and analysis, which are prone to inefficiencies and inaccuracies. To mitigate these issues, researchers have used digital technologies [i.e., Internet of Things (IoT), Artificial Intelligence (AI), machine learning (ML), blockchain technologies, data automation and decision support systems (DSSs)] in EM processes to help in decision making and achieving decarbonization in SWM, WWT, and CSR practices, as highlighted in Table 1.
Therefore, this review paper aims to discuss those various digital technologies (data automation and DSS) and highlight their contributions in helping to optimize operation processes, reduce GHGs emissions, lower global warming potential (GWP), reduce health and environmental impacts, and reduce energy consumption. Also, this paper highlights how digital technologies can revolutionize EM processes through providing real-time and accurate insights that enhance decision making for (a) the choice of an optimal sustainable waste management strategy that has a low CFP; (b) the best smart waste management treatment technologies that are socially acceptable with minimal impact on the environment and economic feasibility; and (c) the optimal location of a waste management facility. In doing so, GHG emissions; global warming potentials (GWPs); energy consumption; and air, water, and land pollution will be reduced, hence lowering the environmental impacts on human health and the environment and contributing to the achievement of a ZERONET initiative (decarbonization) in EM practices.

2. Methodology and Data Analysis

To obtain the required information, the following methodology was used. First, an initial search was performed by entering key words/phrases into a scholarly search engine, such as Google Scholar. Then, the most relevant results were examined, and if more detail was required, sources cited by those articles were also reviewed. These findings were used to guide searches performed using non-scholarly search engines, which were used to collect information on specific digital technologies and DSSs used for a specific area of application.
In terms of the data analysis, a ground theory approach (flexible and iterative method) was used as per the following steps: (i) an on-line search; (ii) use relevant keywords; (iii) review the abstracts; (iv) analyze the full-length papers (i.e., review the evolving patterns of discussions (agreement and disagreements); familiarization with points made by the respective authors); and (v) identify the application areas and cluster them.

3. Digital Technologies in Environmental Management (EM)

Data automation involves using digital technology to collect, process, and analyze data with minimal human intervention. In EM, this encompasses the use of sensors, remote monitoring systems, and automated reporting tools. The convergence of the Internet of Things (IoT), Artificial Intelligence (AI), and blockchain technologies offers exciting possibilities for sustainable EM in the profession of SWM, WWT, and CSR.
The following discussions for SWM, WWT, and CSR are related to the use of digital technologies to enhance decision making in achieving sustainable EM practices. The studies are related to the design of systems for specific applications (Table 1) without estimating the direct contribution to enhancing decarbonation (i.e., calculation of the global warming potentials (GWPs)). Only in few cases was there a mention of a reduction in energy consumption that impacted global warming potentials. However, as highlighted in Table 1, implementation of digital technologies would enhance process efficiency, reduce energy consumption, and provide alerts for initiating an appropriate remedial action prior to exceeding the regulatory norms of a specific environmental setting.

3.1. Solid Waste Management (SWM)

The following 11 studies [12,13,14,15,16,17,18,19,20,21,22] have been chosen to highlight the impact of using digital technology in SWM to enhance decision making and contribute to a ZERONET initiative (Table 1). For example, in a study by Hannan et al. [12], information communication technology tools (IoT and AI) were used to assist in the separation, collection, transportation, and disposal of different types of waste. The study reviewed the available information communication technologies (ICTs) and their applications in municipal SWM systems. The ICTs were characterized into four classes: (a) spatial technologies including geographic information systems (GISs), global positioning systems (GPSs), and remote sensing (RS); (b) the identification of technologies containing barcode and radio frequency identification (RFID); (c) data acquisition technologies including sensing and imaging technologies; and (d) data communication technologies comprising both short-range and long-range communication technologies. In another study by Khoa et al. [13], an AI tool was used to estimate the amount of waste collected in waste bins and to optimize the distance between bins to enhance waste collection efficiency. Also, in a study by Kassou et al. [14], IoT-based applications were integrated with blockchain technology to create a framework for improving the management of hospital waste and wastewater. Furthermore, in a study by Jiang et al. [15], several IoT tools were used to aid the decision makers in examining the consumption patterns of city residents according to the type of discharged waste. In a study by Senthilkumar et al. [16], an air quality monitoring system using fog computing-based IoT was demonstrated. The sensor module, the fog computing device, and the IoT cloud platform were integrated to evaluate the effectiveness of the monitoring system.
Moreover, AI-powered systems can analyze waste streams and guide sorting processes for increased efficiency and material recovery. Blockchain technology can ensure transparency and traceability throughout the recycling chain, boosting consumer confidence in recycled products. In a study by Sheng et al. [17], AI enabled classification of wastes in smart collection bins (e.g., plastic, metal, paper, or general waste). Then, the data received via the long-range communication protocol, object detection, and waste classification were utilized in the TensorFlow framework using a pre-trained object detection model. In another study by Kang et al. [18], smart management of e-waste was demonstrated by using level sensors in smart collection boxes and a mobile application connected to a cloud database and Wi-Fi module. The mobile application guides users to the nearest e-waste collection box on campus based on their current location using GPS. Also, Seker [19] developed a real-time, smart, and cost-effective waste collection system that employs IoT with technologies like RFID, GISs, and ground penetrating radar systems (GPRSs). It is effective for municipal waste collection and transportation and has the goal of reducing environmental pollution.
In a recent study by Zhou et al. [20], a novel image recognition system was introduced called Deep MW for the purpose of sorting medical waste. Deep MW utilizes a Convolutional Neural Network (CNN) as its underlying architecture. The system aims to enhance the ease, accuracy, and efficiency of medical waste sorting and recycling processes, while also reducing the risk of occupational exposure for workers in medical waste facilities.
Furthermore, geo-environmental engineering can incorporate real-time data to optimize landfill operations, such as methane capture and leachate management, hence enabling smarter landfills. AI can analyze data to predict potential environmental impacts and identify areas for improvement. In a study by Gopikumar et al. [21], IoT technology was used to manage landfill leachate and feed the real-time data of a fuzzy control system, such as turbidity, suspended solids, dissolved oxygen, and chemical oxygen demand collected by sensors. In another study by Mabrouki et al. [22], an intelligent system equipped with different sensors for CO, CO2, NO2, CH4, and H2S measurements using an Arduino Uno card and IoTs module was used to monitor landfill biogas to prevent potential hazardous emissions.

3.2. Wastewater Treatment (WWT)

The following 18 studies [23,24,25,26,27,28,29,30,31,32,33,34,35,36,37,38,39,40] have been selected to highlight the impact of using digital technology in WWT plants to enhance decision making and contribute to a ZERONET initiative (Table 1). Recently, Li et al. [23] provided a comprehensive review on the use of AI applied to WWT plants based on the visualization of bibliometric tools. They have highlighted the importance of machine learning (ML) algorithms, such as Convolutional Neural Networks (CNNs) and Long Short-Term Memory (LSTM), in predicting process parameters, enhancing material performance, and optimizing energy utilization. Also, they have pointed out that AI applied to WWT plants is still in its primary stage, and with the rapid development of AI, significant technical innovation in WWT can be anticipated soon.
In a study by Chen et al. [24], a Convolutional Neural Network (CNN) framework for collecting near-infrared data to monitor water quality, which provided technical support for agricultural irrigation, water recycling, and water resource protection, was developed. Also, Geng et al. [25] designed a Cross-Coupled Attention Recurrent Neural Network (CCA-RNN) that could accurately predict changes in total nitrogen in WWT plants. In another study by Yaqub et al. [26], a Long Short-Term Memory (LSTM)-based neural network (NN) for predicting the removal of total phosphorus, ammonia nitrogen, and total nitrogen in a membrane bioreactor after data visualization was established. Also, Xu et al. [27] developed a sensor based on LSTM for monitoring and predicting key performance parameters of the two-stage anaerobic–oxic process in WWT, demonstrating high-resolution automatic measurements and effective prediction of key performances in biological WWT. Zhang et al. [28] established a multi-source data-driven delayed water quality index (WQI) detection model based on the LSTM-NN algorithm, achieving the monitoring of water quality parameters in WWT plants.
In addition, advanced real-time instrumentation, Control, and Automation (art-ICA) controllers were developed and their performance, energy consumption, and GHG emissions of several full-scale WWT plants were evaluated [29,30,31,32]. This process used three feedback controllers, where each one regulates either the total suspended solids (TSSs) in the biological treatment tank, the concentration of nitrates (NO3–N) at the end of the denitrification zone, and the concentration of ammonium (NH4–N) in the last aerated tank, close to predefined set-points. Each controller works by simultaneously performing a real-time adaptation of the three actuators, namely, the sludge surplus pump, the internal recycling pump, and the external air supply [30].
Furthermore, the art-ICA has already been proven in a pilot plant configured for a biological nutrient removal (BNR) process treating domestic wastewater of Bilbao (Spain) [29,33] and in two full-scale WWT plants in Galindo-Bilbao and Mekolalde (Spain) [30,31]. The implementation of art-ICA in these two facilities revealed that the nitrogen emissions in the treated water reduced from 12–15 to 8–10 mg N/l, which corresponds to a reduction in nitrogen discharges of about 25–30%. Furthermore, the electricity used for aeration was reduced after art-ICA implementation, saving 13–20% of energy consumption [30,31]. In another study by Vieira et al. [32], the raw wastewater, nitrous oxide emissions, energy consumption, and water discharges were quantified in two independent trains operated under different operational modes, conventional operation and art-ICA control. The implementation of the art-ICA strategy improved the effluent quality and reduced the operational costs, resulting in a better performance of these WWT plants. The art-ICA controllers’ activation led to a reduction of 54% and 7–10% of the total nitrogen effluent and in the specific energy consumption, respectively. Moreover, process control with art-ICA did not have a negative impact on the N2O emissions of the plants and contributed to a lower global warming potential (GWP) of the facilities. The lower indirect CO2 production due to lower energy consumption contributes to the observation that art-ICA control is environmentally preferable to conventional control systems.
In another study by Moldovan and Nuca [33], Supervisory Control and Data Acquisition (SCADA) and an automated system were implemented into WWT systems and the results indicated that the maintenance costs reduced by 30–40%, the increase energy efficiency increased by 20%, and the reject water quality (biological oxygen demand (BOD), chemical oxygen demand (COD), ammonia, nitrogen, chloride, and hydrogen sulfide) was in compliance with the environmental regulations. Also, Oduah and Ogunye [34] developed a low-cost smart remote sensing septic tank that can be used onsite to prevent sewage overflow. It uses an ultrasonic sensor for the detection and monitoring of the wastewater level in the septic tank and a Global System for Mobile Communication (GSM) module to send Short Message Service (SMS) alerts to the users, avoiding spills of contaminants that can cause health problems.
Moreover, Porro [35], with several partners, has developed the N2ORisk-DSS, which uses AI to combine expert knowledge on N2O and ML to quickly diagnose the WWT process and N2O emissions, propose mitigation actions, and ultimately eliminate N2O. Also, a commercial product such as a Siemens gPROMS digital twin has been developed and used to reduce and remove CO2, CH4, and N2O emissions, which account for 57% of all emissions from the WWT process (https://smartwatermagazine.com/news/siemens/siemens-digital-twin-set-drive-worlds-first-carbon-neutral-wastewater-treatment-plant; accessed on 27 May 2024).
In a study by Khan et al. [36], a system composed of wireless sensor networks, a GSM module for notifications in case of emergency, an Arduino Uno R3 microcontroller, and an IoT-based cloud server was developed to monitor water quality for an industrial effluent treatment plant. Also, Soleimani et al. [37] applied an Artificial Neural Network (ANN) to optimize process conditions such as crossflow velocity, influent temperature, and pH value, obtaining the maximum permeated flux with the minimum fouling resistance.
In summary, the use of AI can provide decision makers with new and effective ways to save energy, reduce emissions, and lower costs. In recent years, research has explored the application of AI in optimizing energy costs in WWT. For example, Wang et al. [38] used real operational data from a WWT plant in China as a dataset, an ANN to develop a process model for estimating material costs, and all-inclusive cost calculations; the results showed that this model could reduce total energy and material costs by 10–15%. In another recent study by Adibimanesh et al. [39], a hybrid model using an ML algorithm used for various incineration systems in European WWT plants resulted in a 6% reduction in total energy consumption. In addition, Wang et al. [40] developed a feature engineering automatic framework based on variation sliding layers (VSLs) to precisely control the air demand of aeration tanks in WWT plants, and the results demonstrated that using VSL in classic ML, deep learning, and ensemble learning could significantly improve the efficiency of aeration intelligent control in WWT plants by 16.12% compared to conventional aeration control of preset dissolved oxygen (DO) and feedback to the blower.

3.3. Contaminated Soil Remediation (CSR)

AI-driven sensor systems, AI, and the IoT can be efficiently used to detect contamination levels and track the progress of remediation efforts. These data help in optimizing the use of remediation techniques, minimizing energy usage, and reducing emissions associated with soil treatment. The following 13 studies [41,42,43,44,45,46,47,48,49,50,51,52,53] have been chosen to highlight the impact of using digital technology (IoT, AI, and ML) in CSR to enhance decision making and contribute to a ZERONET initiative (Table 1). Popescu et al. [41] provided a comprehensive review of the recent advancements in using AI, sensors, and the IOT for environmental pollution monitoring, considering the complexities of predicting and tracking pollution changes due to the dynamic nature of the environment. In another study by Davis et al. [42], sensing measurements linked to a digital twin computation platform [43] were successful in providing subsurface mapping processes spatially and temporally and continuous estimates of degradation rates for management decisions. The multiple sensors targeting parameters, such as major gasses (O2, CO2, and CH4) and temperature, relevant to the subsurface biodegradation processes at a petroleum contaminated site were used.
In another study by Vasudevan and Baskaran [44], an innovative unmanned surface vehicle (USV) based on the IoT and sensors was developed to monitor subsurface water. The system is efficient, with low investment and reduced energy consumption. In addition, Mohamed [45] used time domain electrometry (TDR) to monitor the changes in subsurface soil moisture content and aqueous and non-aqueous solute concentrations by using eigen-decomposition and Fourier spectral analysis [46,47,48,49,50,51] and neuro-fuzzy logic [52] to analyze the reflected signals and predict the subsurface pollutant concentrations. Also, Sivavec et al. [53] developed an automated system to monitor the pollutants and control the pump and treat activities during the remediation of in situ contaminated soils. The system consisted of a sensor, to sense pollutants in the contaminated aqueous composition, and a monitor, to receive information concerning the contaminant from the sensor and to consequently control the pump and treat system during the treatment process. The monitor is situated at a location remote from the pump and treat system.
The following section highlights that integration of the IoT, AI, and blockchain technologies within geo-environmental engineering practice holds immense promise for achieving sustainable environmental management practices.

4. Decision Support Systems (DSSs)

DSSs have been used to (a) support SWM, considering criteria such as waste reduction, recycling, and disposal options [54]; (b) identify the most sustainable options for water and WWT, considering criteria such as treatment efficiency, energy consumption, and social acceptance [55,56,57,58,59]; and (c) help in selecting the most sustainable CSR technologies [60,61,62,63,64,65,66,67].
For example, in CSR applications, DSSs have been used as follows:
(a)
To predict groundwater levels (GWLs) in subsurface soils using input variables (i.e., groundwater extraction, rainfall rate, and river flow rates), Feng et al. [68] evaluated various traditional and deep machine learning (DML) algorithms that included a Convolutional Neural Network (CNN), Recurrent Neural Network (RNN), support vector machine (SVM), decision tree (DT), random forest (RF), and generative adversarial network (GAN). The analysis indicated that the CNN algorithm achieved the highest accuracy in GWL prediction and provided superior performance among all the evaluated algorithms because of its robustness against noise and variability, scalability for handling large datasets with multiple input variables, parallelization capabilities for fast processing, and above all autonomous learning capability that resulted in fewer outlier predictions. Notably, the importance of determining GWLs lies in its impact on the chemical reactions of subsurface pollutants and their potential transport mechanisms in subsurface environments, hence enabling decision making on the degree of hazards and the potential impacts on human health and the environment;
(b)
To optimize green and sustainable remediation (GSR) implementation, with alignment to the sustainability goals, a variety of DSS tools were used [65,66,67,69,70,71], and a number of issues have been included in DSSs to account for the transition towards GSR such as (a) stakeholder involvement ([72,73,74] and (b) sustainable evaluation indicators and techniques [75,76,77,78,79].
A variety of decision support system (DSS) modeling approaches have been recognized as potentially effective instruments to enhance decision making in environmental management, including the following:
(a)
Life cycle assessment (LCA), which evaluates environmental impacts over a technology or process’s entire lifespan [10,80,81,82];
(b)
Cost–Benefit Analysis (CBA), which assesses the economic feasibility of environmental management strategies, factoring in social and environmental externalities [67];
(c)
Risk-Based Decision Making (RDM), which evaluates the potential health impact via a hazard index [65,66,83] or by equating in monetary terms the cost of the damage caused by the cost of managing an affected site [66] or by incorporating the likelihood and severity of potential risks into the evaluation process [61,83,84];
(d)
Multi-Criteria Decision Analysis (MCDA), which balances multiple, sometimes conflicting, objectives using weighting systems and stakeholder input [63,85,86].
However, development of an integrated methodology that accounts for the complex decision making process will overcome the inherit limitations present in the traditional methodologies and have a robust capacity to use various types of data, available information, and disputes between relevant stakeholders.
In the following sections, examples of LCA and MCDA applications in SMW, WWT, and CSR are discussed.

4.1. Life Cycle Assessment (LCA)

LCA has become a powerful tool for geo-environmental engineers in their quest to achieve zero CFP [80,87,88]. It allows for a comprehensive evaluation of the environmental impacts of a product, service, or process throughout its entire lifespan, from cradle (raw material extraction) to grave (disposal or end-of-life). It is very detailed with numerous footprint indicators, such as the CO2, water, or energy footprint. In addition, social and economic footprints have also been developed but are still rarely used [89]. By understanding these impacts, engineers can make informed decisions about material selection, construction practices, remediation techniques, and other aspects of their projects, aiming to minimize the overall environmental burden.
The uses of LCA in SWM, WWT, and CSR practices are discussed below.

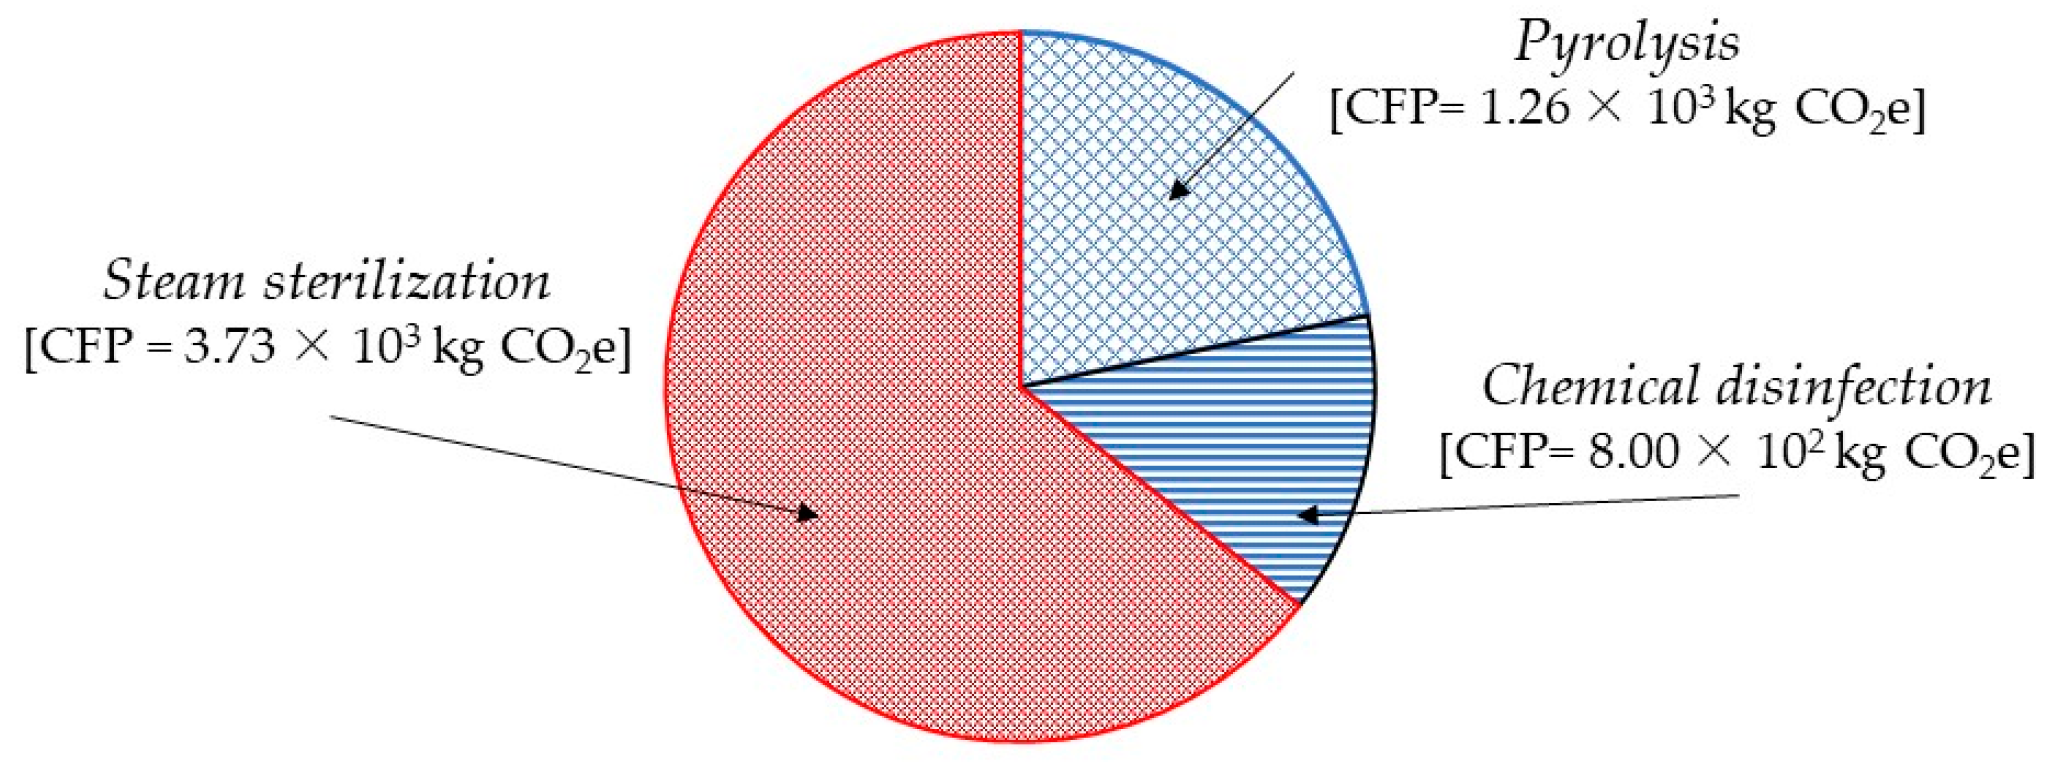
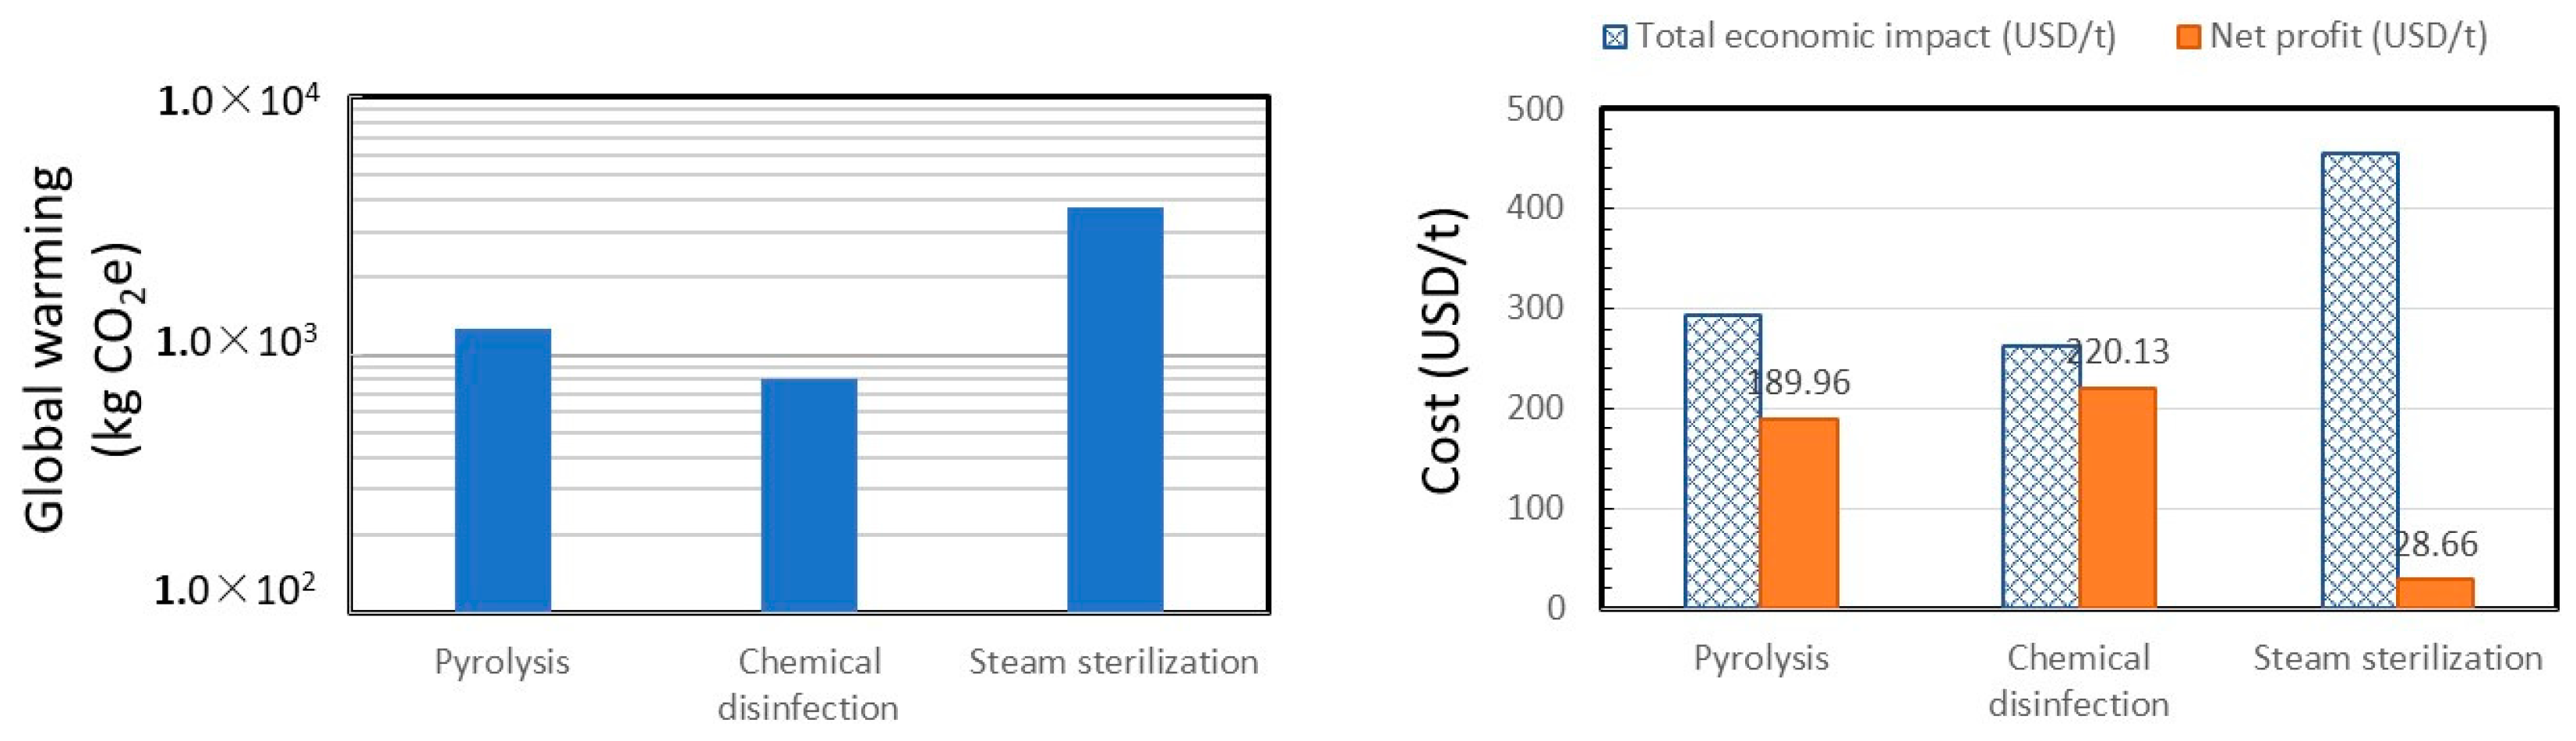
4.1.1. Solid Waste Management (SWM)

The environmental and economic impacts of three medical waste disposal scenarios (i.e., pyrolysis, chemical disinfection, and steam sterilization) were quantified via an LCA coupled with life cycle costing (LCC) [Hong et al. [1]] and the results (Figure 4 left) showed that the CFP was, in decreasing order, as follows: steam sterilization (3.73 × 10³ kg CO2e), pyrolysis (1.26 × 10³ kg CO2e) and chemical disinfection (8.00 × 10² kg CO2e), with the amount of energy consumed in each technology as follows: (a) 26.1% and 66.7% for electricity and diesel in the case of steam sterilization; (b) 23.8%, 36.1%, and 29.9% for electricity, diesel, and sodium hydroxide in the case of pyrolysis; and (c) 66% and 11% for electricity and lime in the case of chemical disinfection.
In addition, from an economic viewpoint, the contributing factors to economic burden (a) for steam sterilization are electricity and diesel (39%) and labor and human health protection (69.1%); (b) for pyrolysis are sodium hydroxide, electricity, and active carbon (43.3%) and labor, human health protection, and investment (18.4%); and (c) for chemical disinfection are electricity, chlorine, and landfill (27.5%) and investment, labor, and human health protection (66%). Chemical disinfection showed the highest net profit (220.13 USD/t), followed by pyrolysis (189.96 USD/t) and steam sterilization (28.66 USD/t) (Figure 4 right). Combining the global warming potential (GWP) and the economic costs of these three technologies, one reaches a straightforward decision that chemical disinfection technology would be the optimal solution since it has the lowest GWP and the highest net profit. However, one could face other scenarios in treating other wastes where the GWP is the minimum and the economic cost is the uppermost; hence, a balance between achieving sustainability goals (i.e., reduction in the global warming potential (GWP)) and economic benefits must be realized in choosing the best technology for the specific waste management project being considered.

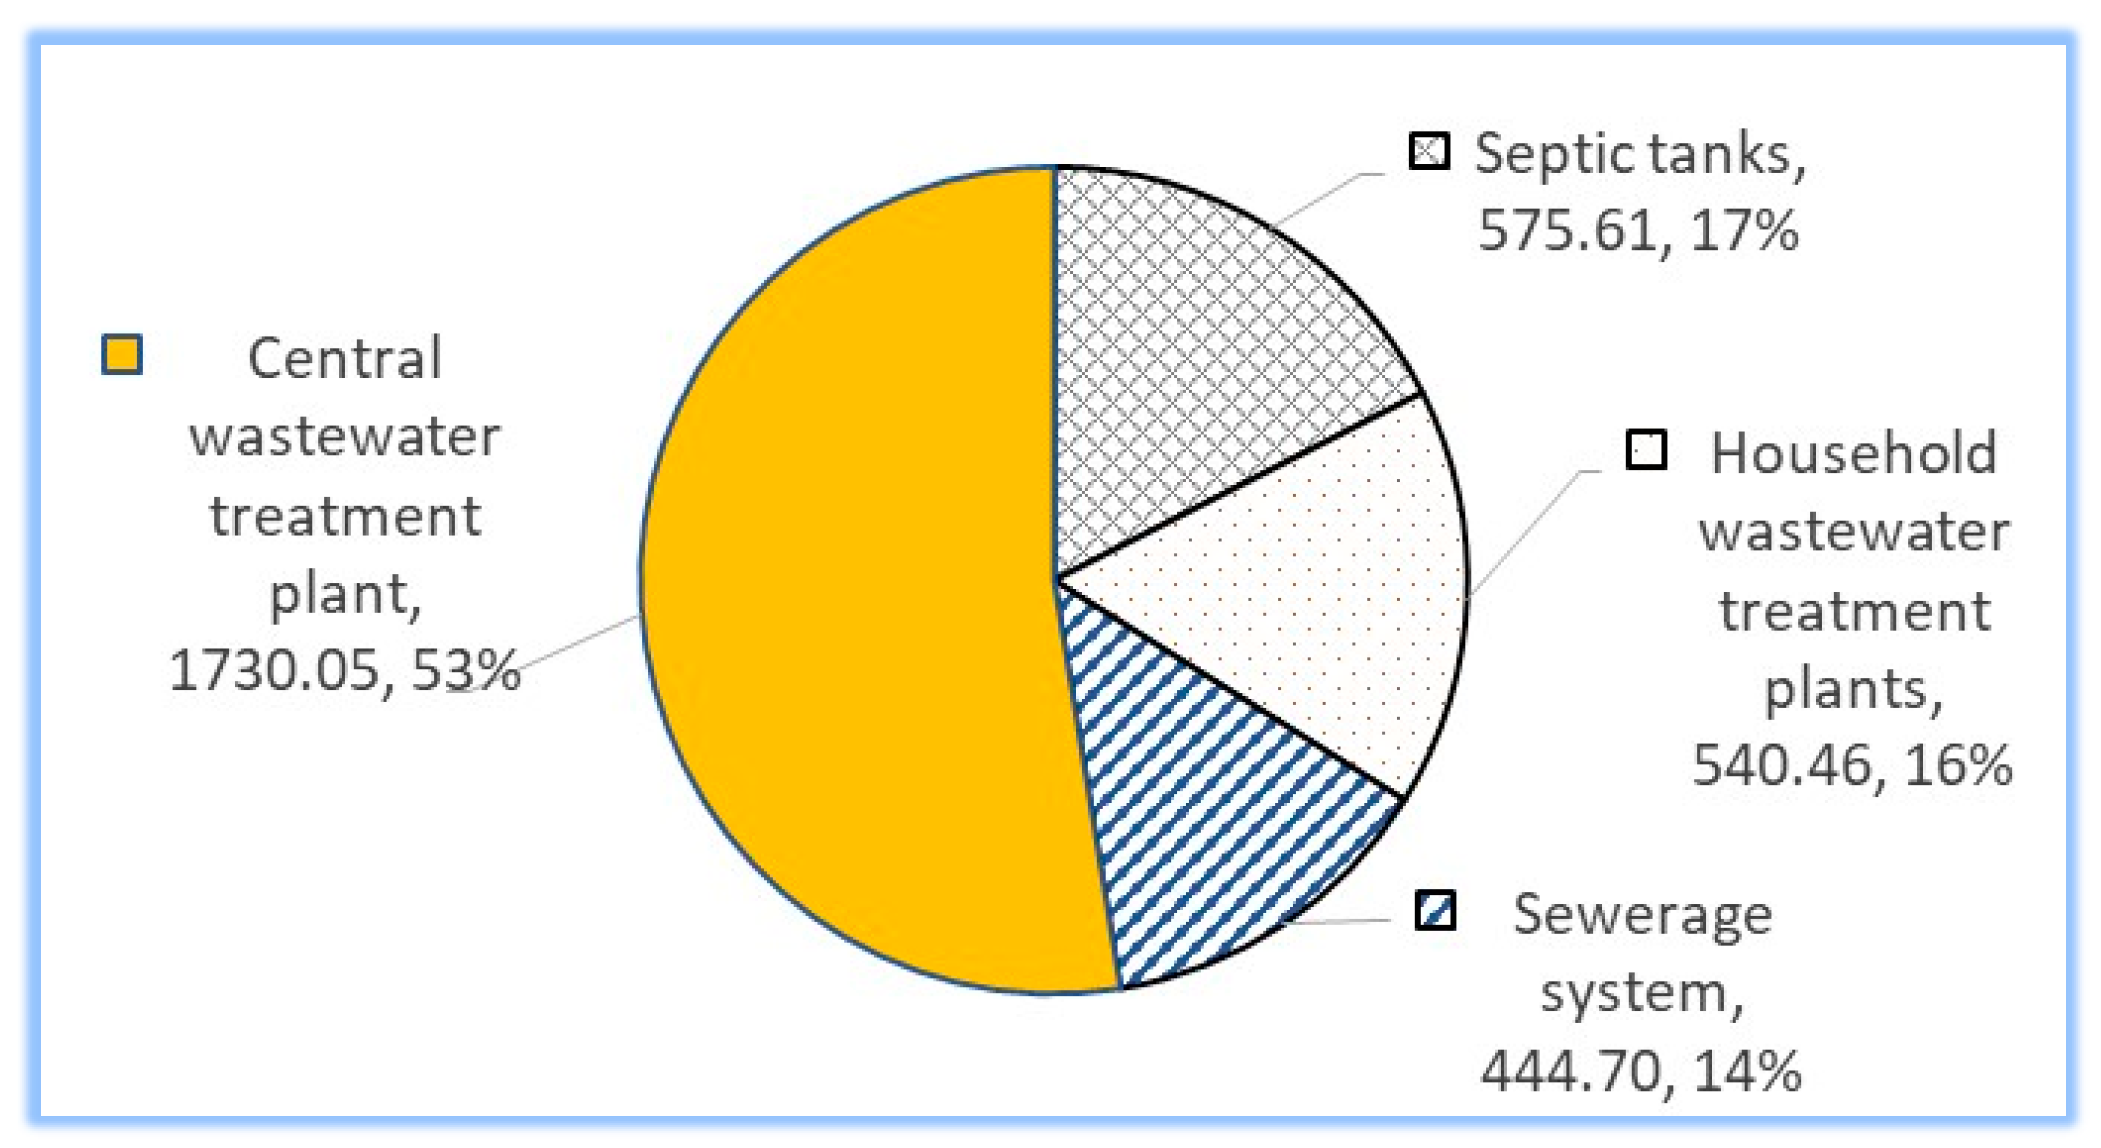
4.1.2. Wastewater Treatment (WWT)

Recently, several LCA methodologies such as IMPACT World+ [90], ReCiPe [91], and LIME 2 [92] have been applied to WWT plants [93,94,95]. For instance, LCA studies were conducted to (a) evaluate all elements of a wastewater treatment system [96,97]; (b) evaluate the negative influence of septic tanks on the soil and water environment [98,99,100,101]; (c) assess alternatives for a city’s water–wastewater service system [102]; (d) select sustainable sewerage servicing systems and technologies [103]; (e) assess the vertical and horizontal flow in constructed wetlands [104]; and (f) evaluate the system of wastewater collection, transport, and treatment [10].
The following studies [81,97,105,106,107,108,109,110,111,112,113] highlight the use of LCA as an evaluation method characterizing the environmental impacts of different treatment processes within WWT plants and aiding in deciding the best available technology, whilst [114,115,116] are for both the LCA and the LCC of the various treatment processes.
For the first set [105,106,107], studies suggest that operation-related stages, including WWT processes, sludge treatment, and sludge disposal, are the main contributors to the environmental impact (GHG emissions) of conventional WWT plants (>90%) [105,106]. Of the four processes related to conventional WWT plants (i.e., construction, operation, sludge treatment and disposal, and emissions in the air), the GHG emissions of the operational process were the most significant, being 85–97% of the total impact among all seven impact categories considered. Also, in a study by Limphitakphong et al. [107], the LCA of WWT plants in three impact categories (climate change (GWPs), eutrophication, and acidification) showed that eutrophication accounted for over 90% of the total GHG emissions. Therefore, it is important to assess effluent water quality thoroughly when comparing WWT options with different effluent qualities.
For the second study by Lorenzo-Toja et al. [97], the environmental efficiency of multiple treatment units in 47 WWT plants located in different regions of Spain and operated for 4 years was analyzed using LCA and data envelop analysis (DEA). The results showed that (a) for most of the facilities, the efficiency standards tended to remain constant through time; (b) significant differences were detected among plants with different legislation thresholds for their effluent withdrawal; (c) WWT plants discharging to non-sensitive water bodies appeared to be able to attain efficiency values near the benchmark, whereas facilities with stricter thresholds (i.e., sensitive water bodies) resisted to achieve those values, especially in the case of smaller plants; and (d) the use of a slacks-based measure of efficiency (SBM) model for one single year of operation is a good representation for the evaluation of the environmental efficiency of these systems.
For the third study by Mishima et al. [108], the environmental load from the septic systems in Japan was evaluated using LCA and the results showed that the mean GHG emissions of the effluent during the operation stage were 37.6%, and the operation stage accounts for over 99% of the involved eutrophication, biological toxicity, and toxic chemicals, which are strongly related to the quality of the effluent.
Notably, in a study by Mishima et al. [108], the following conditions were used:
(a)
The septic systems used in the LCA consisted of the sedimentation tank, anaerobic tank, aerobic tank, clarification tank, and disinfection tank.
(b)
These systems were further classified into (a) the standard-structure type (S) as per the Japanese specification and effluent water quality of BOD = 20 mg/L; and (b) certified-structure types (C1–C3) which are freely designed and manufactured by septic system manufacturers and certified with the authorized effluent water quality based on the treatment performance test. The effluent water quality standards were (i) BOD = 20 mg/L and total nitrogen (T-N) = 20 mg/L for C1; (ii) BOD = 10 mg/L and T-N 20 mg/L for C2; and (iii) BOD = 10 mg/L, T-N = 10 mg/L, and total phosphorus (T-P) = 1 mg/L for C3. The average total volumes of these septic tanks were 2.95, 2.10, 2.74, 2.89 m3 for S, C1, C2, C3, respectively.
(c)
For the LCA, the following four life cycle stages of the septic systems were considered: (i) Manufacturing, including the fabrication of the septic systems’ components. (ii) Installation, which involves transportation from the factory to the installation site. (iii) Operation, which includes operation, maintenance, sludge treatment, and effluent discharge. Items such as material consumption, electricity consumption, direct GHG emissions, and indirect GHG emissions were considered in the operational process. The COD, T-N, T-P, and ammonium nitrogen (NH4–N) in the effluent were calculated for the effluent discharge, and the quality of the gray water influent was assumed to be BOD, COD, T-N (100% as NH4–N), and T-P of 145, 65, 10, and 1.5 mg/L, respectively. The average amount of sludge generated was assumed to be 1.2 L/p/d (liter/person/day). (iv) Disposal, whereby at the end of the life cycle the septic tank components would be incinerated, and the residues would be landfilled.
(d)
The functional unit was assumed to be 1-year use of a five-population-equivalent (PE) septic system by one household, and the lifespan of the septic system was assumed to be 40 years.
(e)
Throughout the life cycle of the septic system, 10 impact categories were considered: climate change (GHG emissions), eutrophication, biological toxicity, toxic chemicals, urban area air pollution, acidification, ozone layer destruction, photochemical oxidant, resources depletion, and waste.
(f)
The unit GHG emissions from the septic systems were assumed to be (i) 2477 (for S), 1984 (for C1), and 1044 (for C2 and C3) g-CH4/person/year; and (ii) 71.7 (for S), 54.5 (for C1), 123.2 (for C2 and C3) g-N2O/person/year.
(g)
The LCA was estimated using the impact assessment model LIME2 [92] and the ecotoxicity estimation model [108].
The LCA results (Figure 5) indicated that the total GHG emissions during operation of the standard structure are the highest (744 Kg-CO2e/year/household), followed by the certified structures C3 (722), C2 (667), and C1 (655), respectively. For the standard structure, the GHG emissions were distributed (Figure 5B), from the highest to the lowest, as electricity (40.1%), direct emissions (CH4 and N2O) (34%), sludge treatment (21%), maintenance (2.9%), and indirect (2%). The GHG contributions due to sludge treatment were in deceasing order of C1 (24%), C2 (23.3%), C3 (21.5%), and Standard (21%). However, for the direct emissions, the GHG emissions were 34, 29, 28, and 26.4% for standard, C1, C2, and C3, respectively. The GHG emissions due to electricity were 48, 44, 41, and 40.1% for C3, C2, C1, and standard, respectively.
Therefore, the contribution of electricity consumption was the highest among all types of septic systems, followed by the direct emissions of the systems (CH4 and N2O) and the sludge treatment process; hence, optimal control during operation is needed to reduce GHG emissions as well as the potential use of renewable energy technologies to reduce GHG emissions.
Moreover, for the LCA of the 10 analyzed impact categories by Mishima et al. [108], the major contributors to the environmental impact were GHG emissions, eutrophication, biological toxicity, and air pollution. Specifically, for the standard structure, the LCA impact categories were as follows, in decreasing order: GHG emissions (35%), eutrophication (23%), biological toxicity (17%), and air pollution (12%), whilst for the certified structure C3 they were GHGs emissions (41%), eutrophication (29%), biological toxicity (8%), and air pollution (16%). The LCA also indicated that both the operation (about 30%) and disposal, due to landfill space requirement (60–65%), stages have major impacts. These results would alter decision making to reduce the impact of landfill disposal by implementing a nature-based solution (NbS) (i.e., biodegradation, phytoextraction, phytovolatilization, or revegetation) [109,110,111,112,113].
For the fourth study by Khan et al. [81], an LCA was employed to compare the CFP of three treatment processes, incineration, mechanical recycling, and chemical recycling, of a functional unit of 1 ton of re-pulping waste reject. Using biomass-based heat sources, the generated CFPs were 560, 740, and 1900 kg CO2e/t of waste for the chemical recycling, mechanical recycling, and incineration scenarios, respectively. However, using natural gas-based heat sources, the generated CFPs were 290, 430, and 960 kg CO2e/t of waste for chemical recycling, mechanical recycling, and incineration, respectively. Therefore, the results would indicate that chemical recycling is the best option, using natural gas as the energy source. It is to be noted that it is useful to conduct uncertainty analysis to evaluate the impact of the assumptions used in the LCA.
The fifth group of studies [114,115,116] has been used to highlight the importance of including a trade-off analysis, in terms of cost and environmental impact, in combination with the standard LCA. For example, in a study by Meneses et al. [115], the technologies adopted for more stringent effluent standards from WWT plants (i.e., 10–15 mg N/L (nitrogen per liter) and 1–2 mg P/L (phosphorus per liter) by the EU Urban Waste Water Directive) could improve effluent quality; however, it may require additional energy consumption, utilization of more chemical reagents, and production of more sludge. In another study by Hauck et al. [116], a 16% reduction in marine eutrophication was obtained; however, the GHG impacts increased by 9% from the traditional operation of the Dokhaven WWT plant, The Netherlands, because of the increasing use of electricity. The results also indicated that the trade-off between effluent quality and other environmental impacts should not be neglected when applying advanced technologies for the treatment processes.

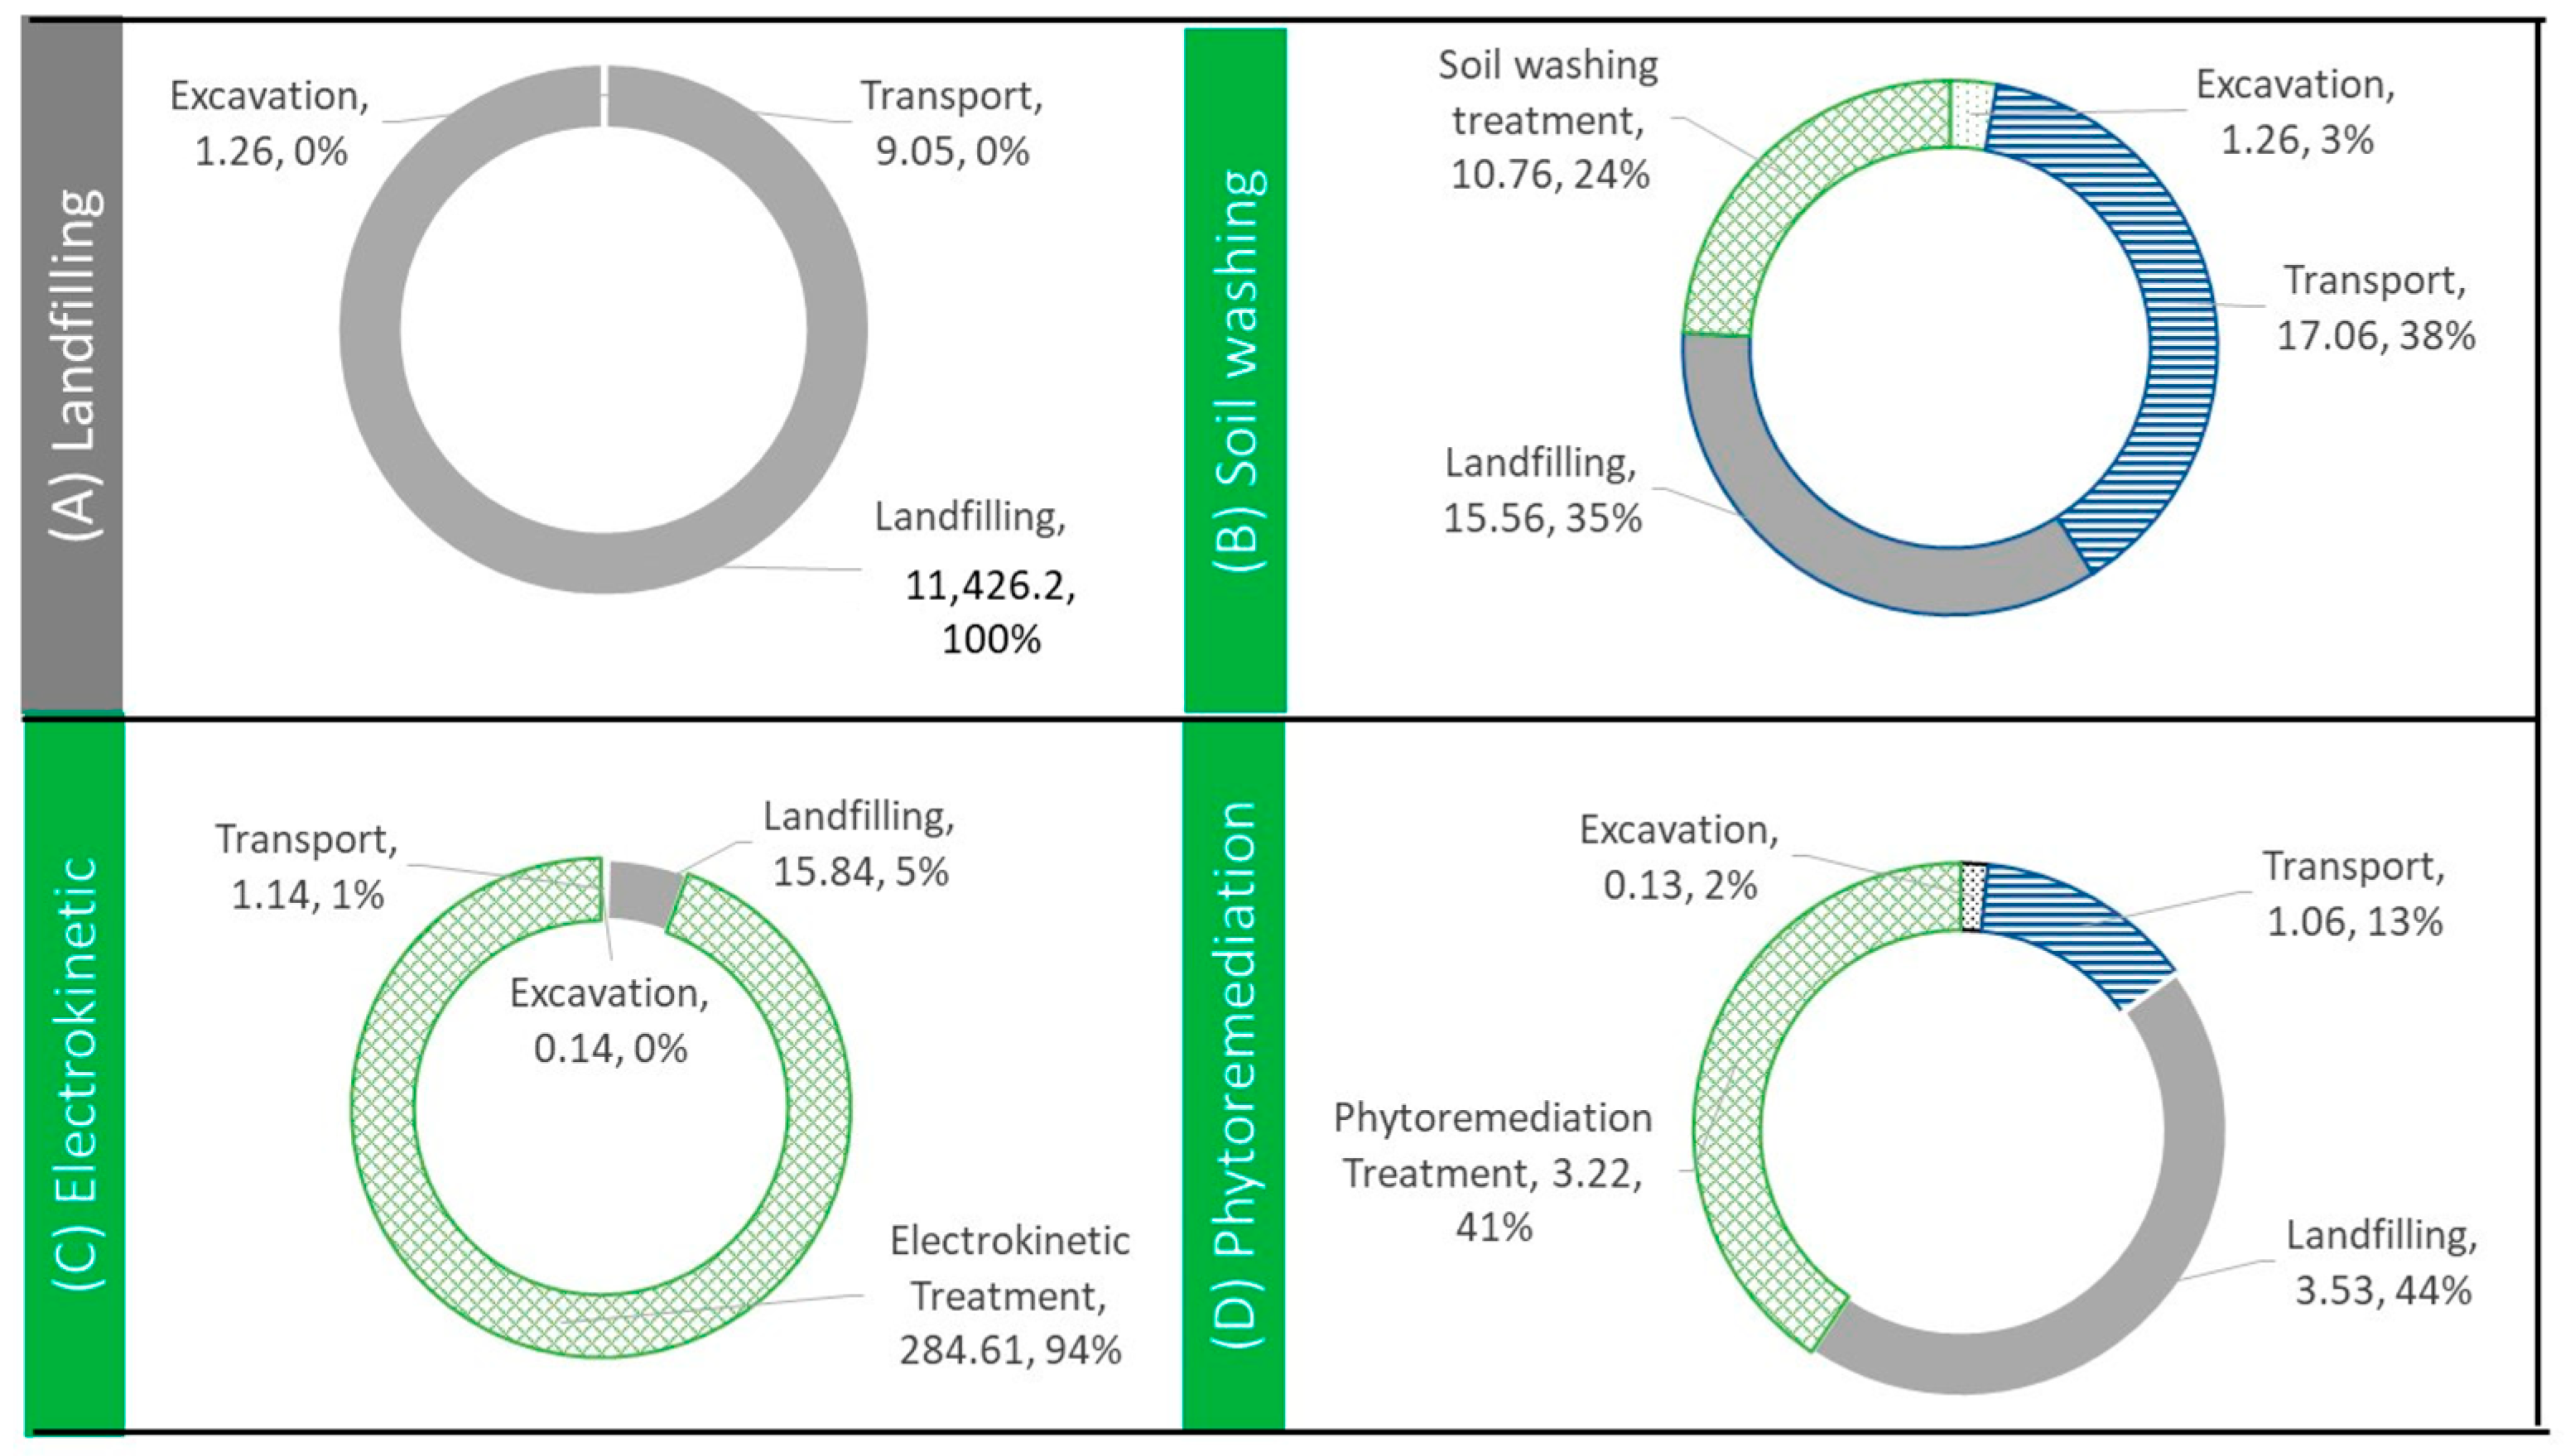
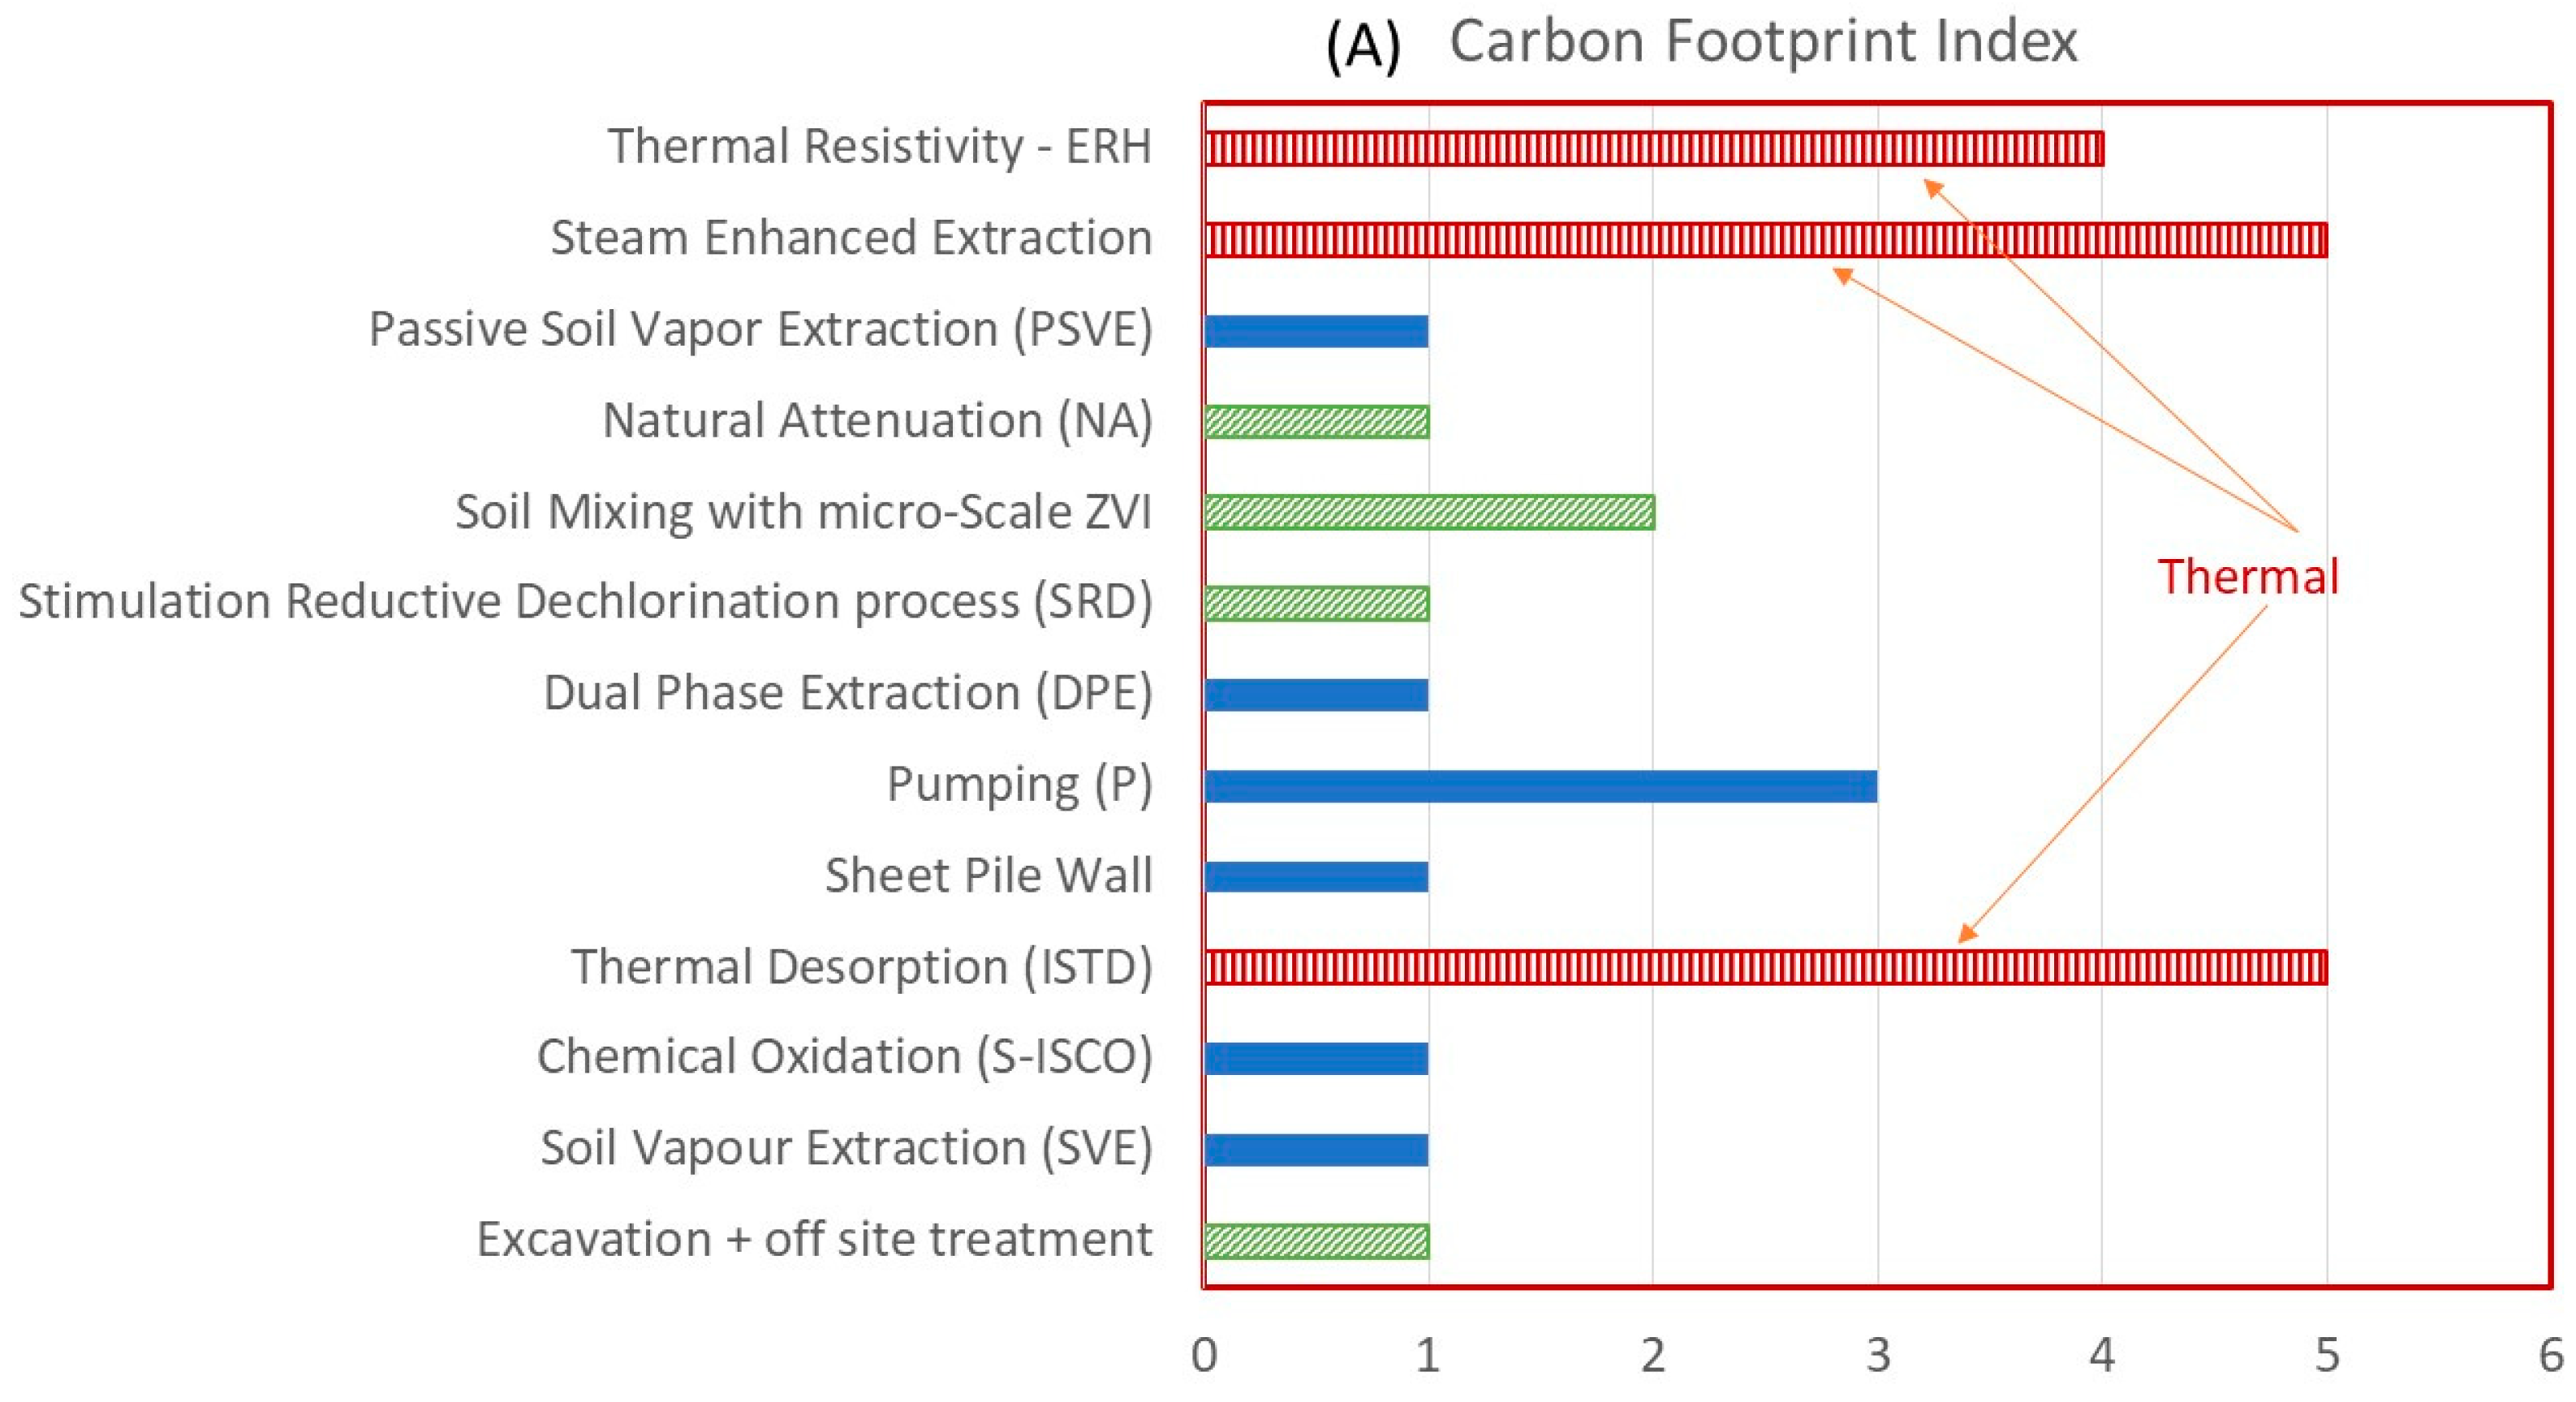
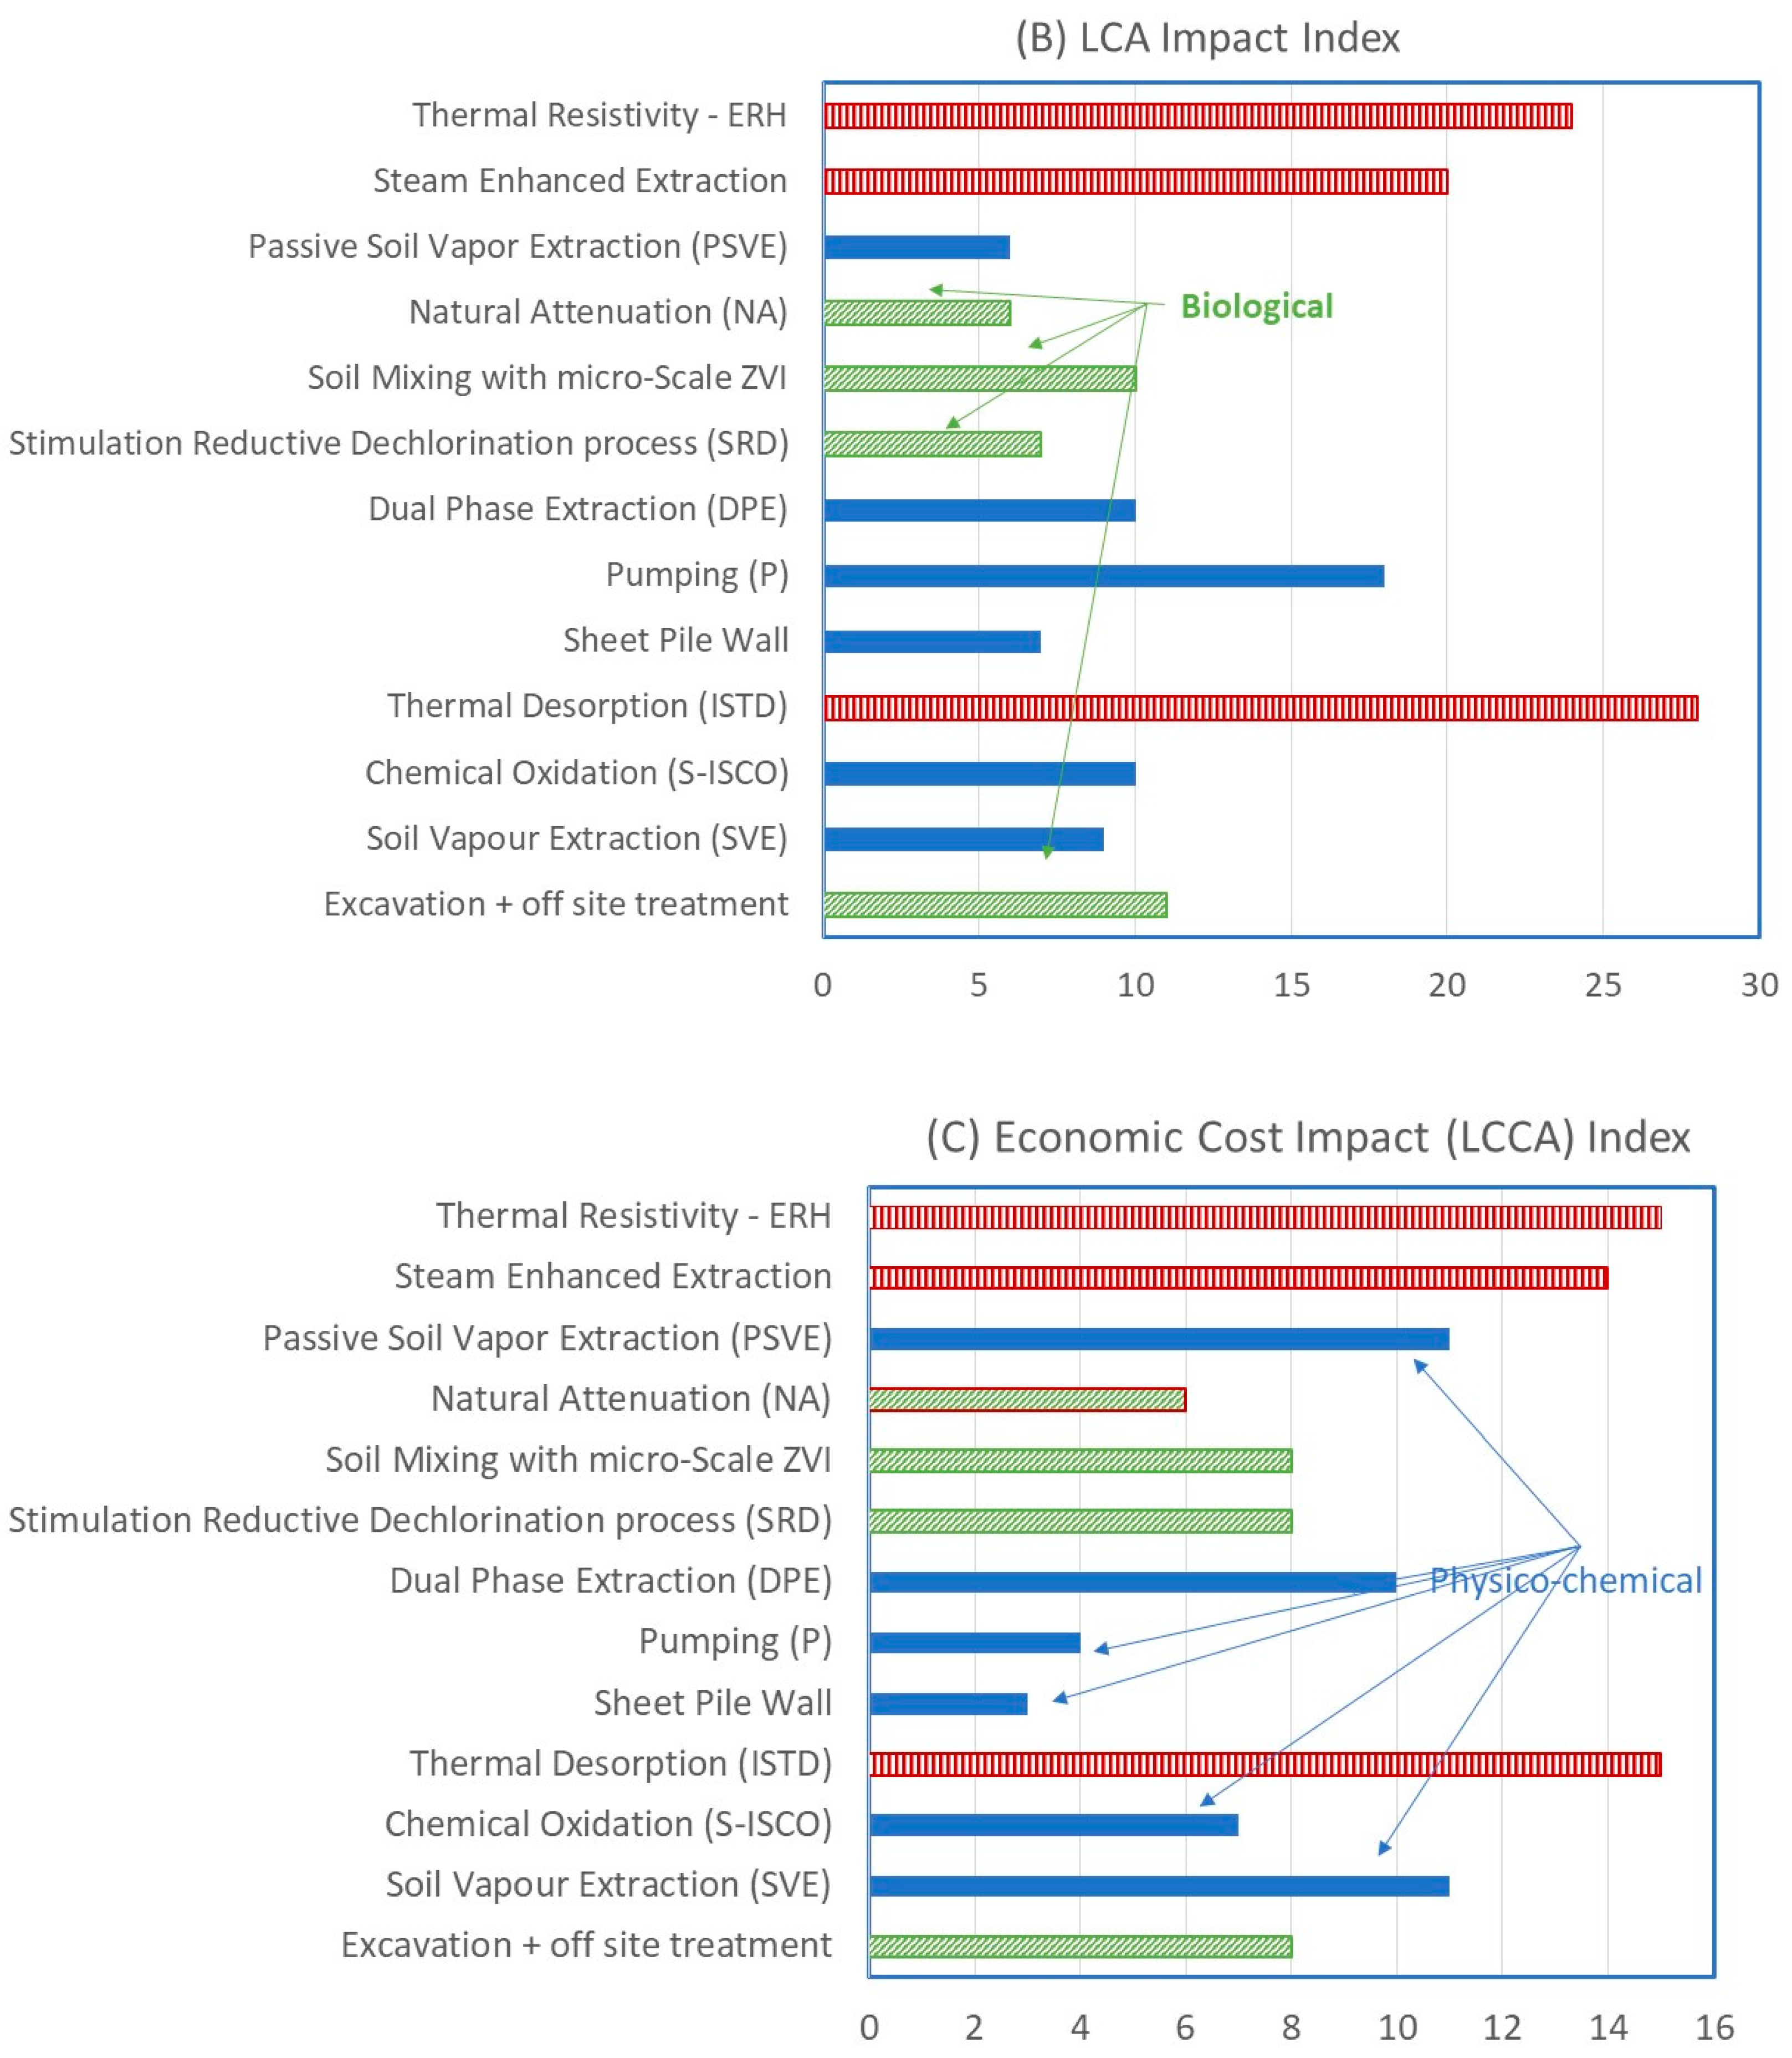
4.1.3. Contaminated Soil Remediation (CSR)

To highlight the use of LCA in CSR, four (4) studies have been identified: (i) in situ and ex situ treatment of contaminated soils by organic chemicals [117,118,119,120,121]; (ii) six (6) different treatment technologies for contaminated soils by organic chemicals [122]; (iii) LCA combined with Cost–Benefit Analysis (CBA) to assess two remedial options (excavation of contaminated soils and off-site thermal treatment) of contaminated soils by polyaromatic hydrocarbons (PAHs) and cyanide [77]; and (iv) thirteen (13) different remediation technologies for heavy PAH-contaminated soils [123].
In the first study by Cappuyns [117], the environmental impacts of two contaminated sites by mineral oil, and one site by mineral oil and BTEX (Benzene, Toluene, Ethylbenzene, and Xylene), were quantified by means of the BATNEEC (Best Available Technology Not Entailing Excessive Costs) methodology, which uses a multicriteria analysis considering environmental, technical, and financial aspects. The CFPs were calculated by a methodology based on the principles of LCA (REC; risk reduction, environmental merit and costs), and an environmental merit index (E) was determined based on interviewing a panel of environmental experts.
The CFPs were calculated using three methods:
(a)
The Soil Remediation Tool (SRT) [118], which allows users to estimate sustainability metrics for various CSR technologies such as excavation, soil vapor extraction, pump and treat, enhanced in situ biodegradation, thermal treatment, in situ chemical oxidation, permeable reactive barrier, long-term monitoring, and monitored natural attenuation;
(b)
The SiteWise tool [119], which considers a variety of remedial actions such as site investigation, construction, operation, and monitoring;
(c)
The Tauw CO2 calculator [120,121], which considers different CSR options (in situ and ex situ) and the possibility of using renewable energy sources to decrease the overall environmental impacts of a CSR operation.
The CSR option reported by Cappuyns [117] showed that the CFP of soil excavation, as a CSR option, was mainly attributed to the transport of soil (30.1–55.4%), while the excavation activities themselves (6.1–10.6%) and the in situ treatment of the groundwater (1.6–3.7%) were of secondary importance, and the pumping of the groundwater had a negligible (0.2–0.3%) contribution. Transport of the equipment and personnel to the site only had a marginal contribution to the total CO2 emissions.
Therefore, optimization of these tools, taking into account new developments in the field of CSR, such as the use of more accurate screening tools to delineate the extent of the contamination, the use of innovative (sustainable) CSR technologies, or the use renewable energy sources, will further improve the environmental impact assessment of CSR activities [11,117].
In the second study by Amponsah et al. [122], the GHG emissions (CO2e) from six (6) ex situ CSR technologies, including excavation and land disposal, excavation and incineration, thermal desorption, soil vapor extraction, bioremediation, and soil washing were evaluated. The results showed (i) a large variation in the GHG emissions of treated soil varying from 3.1 × 10⁻⁷ t to 8.2 t CO2e/m3; (ii) incineration had the highest mean GHG emissions (0.7 t CO2e/m3) and thermal desorption had the lowest (0.07 t CO2e/m3); and (iii) a large range of GHG emissions from the excavation and disposal and excavation and incineration technologies, varying from 3.1 × 10⁻⁷ t to 8.2 t CO2e/m3 of treated soil. Therefore, this kind of information provides decision makers with new prospects for choosing the most sustainable CSR technology via green practices throughout the remedial stages (investigation, design, construction, operation, and monitoring).
In the third study by Huysegoms et al. [77], LCA, to assess the impacts linked to the remediation works, and Cost–Benefit Analysis (CBA) were used to assess CSR technologies (excavation of contaminated soils and off-site thermal treatment). Both the soil and the groundwater at the site were contaminated by polyaromatic hydrocarbons (PAHs) and cyanide. The results from the LCA were monetized using a Stepwise 2006 technique—which can be fully implemented in the LCA-SimaPro software to provide users with values on three overall safeguarded subjects (human well-being, biodiversity, and resource productivity), which are linked to the three sustainability pillars (people, planet, profit)—and the Ecovalue 08 technique, that is used to monetize endpoint impact based on market valuations of resource depletion and individual Willingness To Pay (WTP) estimates for environmental quality. The results from the Stepwise 2006 technique are expressed in terms of Quality-Adjusted Life Years (QALYs) for human well-being, Biodiversity-Adjusted Hectare Years (BAHYs) for biodiversity, and euros for resource productivity. The use of such monetization analysis is not a routine process for site remediation evaluation [87].
The LCA reported by Huysegoms et al. [77] showed that the impact categories that mostly contribute to the environmental impact of the adopted CSR technologies are energy consumption, climate change, and formation of particulate matter (PM), where off-site treatment and transportation contributed about 70% and 10%, respectively, of the total impact. The minimum and maximum monetized values of the environmental impact parameters for the proposed remedial method were EUR 17,758 and 259,996 in 2015, respectively, with impact category contributions, in decreasing order, of abiotic depletion (44.6%), global warming (26.64%), human toxicity (19.91%), eutrophication (5.44%), acidification (3.26%), and photochemical oxidation (0.13%). Based on the CBA, the net present value (NPV) contribution of the remedial work, externality, and site restoration to the total NPV were estimated at 63.54%, 29.72%, and 6.73%, respectively. However, since the pollution source has been removed, the NPV of the positive health impact was estimated at 48.28% of the total NPV, indicating that the project is not socially profitable in the short term (30 years) because of the limited health benefits of the remediation and the large cost of transport of soil to off-site treatment facilities (39.74% of the total NPV).
From the preceding analysis, it can be seen that the social CBA is a method that can be used to address all negative and positive impacts of a remediation, whilst the LCA provides an in-depth, extensive, and substantiated view on the environmental impacts, negative and positive, of the remediation project. Therefore, combining both methods would be an important step; however, the LCA needs to be monetized. The analysis showed that the resultant costs of CO2/t are EUR 44 for the CBA, EUR 83 for the LCA with the Stepwise 2006 technique, and EUR 11 to 222 for the LCA with the Ecovalue 08 technique. It is worth noting that such differences are attributed to the type of impacts covered in each method. The LCA with monetization gives a more extensive view on the environmental effects, including eutrophication and acidification, whilst social CBA addresses air pollutants from the remediation works, monitoring, and transportation, meaning that the use of a monetized LCA is a more appropriate and comprehensive method due to the inclusion of a variety of environmental impacts.
In the fourth study by Ashkanani et al. [123], the LCA of thirteen (13) distinct CSR technologies for heavy polyaromatic hydrocarbon (PAH)-contaminated soils was evaluated based on nine (9) well-defined LCA criteria, each assigned an LCA score ranging from 1 (indicating the lowest environmental impact, very low category, VL) to 5 (the highest impact, very high category, VH). And to rank these technologies, sub-categories were assigned as low (L), medium (M), and high (H) for scores of 2, 3, and 4, respectively. The thirteen (13) CSR technologies were grouped into (i) physico-chemical (sheet pile wall, pumping (P), dual phase extraction (DPE), soil vapor extraction (SVE), chemical oxidation (S-ISCO), passive soil vapor extraction (PSVE)); (ii) thermal (thermal desorption (ISTD), steam enhanced extraction, thermal resistivity—ERH); and (iii) biological (stimulation reductive dechlorination process (SRD), excavation plus off site treatment, soil mixing with micro-scale (ZVI), natural attenuation (NA)). The nine (9) environmental criteria considered in the LCA were resource consumption, CO2 emissions, toxicity, waste, energy consumption, carbon footprint (CFP), cost planning and construction, initial capital cost, and ongoing operating cost.
The results shown in Figure 6 indicate that thermal technologies have the highest CFPs, total LCA, and life cycle cost analysis (LCCA) impacts. The biological treatments have low to moderate LCA impact (Figure 6B) but have higher economic costs in comparison with the physico-chemical treatments (Figure 6C). The rankings of these technologies are shown in Table 2, with specific rankings for each criterion considered in the LCA. Therefore, such results clearly indicate that, when choosing the appropriate technology, a balance must be made between the economic cost and achieving sustainability goals.
It is worth noting that for CSR projects, researchers have suggested a two-step process for any remedial measures, which are as follows: [117] (i) An initial ranking of soil remediation techniques based on more qualitative site-specific criteria. The ranking can be achieved using a BATNEEC analysis [76], which is based on the principles of a multicriteria analysis. (ii) A quantitative assessment using LCA and related techniques may be of value for an in-depth analysis.
The preceding examination clearly indicates the significant benefits of using LCA, which are (i) pinpointing specific phases or activities with the highest CFP, allowing for targeted reduction efforts; (ii) evaluating the environmental impact of different material choices, construction methods, or remediation techniques to inform sustainable decision making; (iii) transparent communication of LCA results can demonstrate commitment to sustainability and build trust with stakeholders; and (iv) LCA can help in meeting environmental regulations and standards related to GHG emissions and resource use.

4.2. Multi-Criteria Decision Analysis (MCDA)

Researchers used MCDA in the area of sustainable SWM applications [124], as an example, to (i) investigate optimal decision making among various alternative SWM strategies (e.g., landfill disposal, incineration, recycling, reuse, etc.); (ii) explore other possible technologies (e.g., mass incineration, pyrolysis, gasification, plasma incineration in cement kilns, etc.); and (iii) determine the optimal location of a SWM facility (e.g., landfill, waste treatment facility, recycling facility, etc.). Also, MCDA has been used to integrate multi-attributive and multi-dimensional indices in a holistic manner [63,85,86]. In the following sections, examples for the use of MCDA in SWM and CSR are discussed.

4.2.1. Solid Waste Management (SWM)

In a study by Demircan and Yetilmezsoy [57], four different smart and sustainable SWM strategies were evaluated using a hybrid fuzzy AHP-TOPSIS approach that can support local authorities in smart cities. The four smart and sustainable SWM strategies were as follows: (i) integrating informal recyclable waste collection into a formal smart system (SWM1); (ii) a pay as you throw application leveraging blockchain technology (SWM2); (iii) Internet of Things (IoT)-based community composting (SWM3); and (iv) preventing illegal sewage discharge by utilizing the IoT (SWM4).
The four main criteria used in the hybrid fuzzy AHP-TOPSIS analysis were (Figure 7) as follows: (i) environmental criteria (with five (5) sub-criteria: less atmospheric emissions, less soil pollution, less surface water pollution, energy recovery, and natural resources recovery); (ii) technical criteria (with three (3) sub-criteria: operational feasibility, innovativeness, and need for qualified personnel); (iii) economic criteria (with four (4) sub-criteria: maintenance costs, transportation costs, operational costs, and initial investment costs); and (iv) social criteria (with three (3) sub-criteria: increased awareness of sustainable cities, increased quality of life in the city, and new employment opportunities).
The results showed that the composite weight vector for the environmental criteria was WEnviro = (0.42, 0.27, 0.27, 0.04, 0.00), meaning that the order of importance of the five sub-criteria was determined to be less atmospheric emissions > less soil pollution/less surface water pollution > energy recovery > natural resources recovery. Therefore, less atmospheric emissions is more important than soil and surface water pollution, which came second. Energy recovery and recovery of natural resources were not important within the environmental criterion. The composite weight vector for the technical criteria was found to be WTech = (0.64, 0.36, 0.00), meaning that the order of importance of the three sub-criteria was determined as operational feasibility > innovativeness > need for qualified personnel. Therefore, operational feasibility was the most important criterion among the technical criteria and the need for qualified personnel was unimportant.
The composite weight vector for the economic criteria was WEcon = (0.56, 0.30, 0.14, 0.00), meaning that the order of importance of the four sub-criteria was determined to be initial investment costs > operational costs > maintenance costs > transportation costs. Therefore, the initial investment cost criterion is very important compared to other economic criteria and the transportation cost is unmeaningful. The composite weight vector for the social criteria was calculated as WSocial = (0.53, 0.46, 0.01), meaning that the ranking of the three sub-criteria was increased awareness on sustainable cities > increased quality of life in the city > new employment opportunities. Therefore, the new employment opportunities criterion was rather insignificant compared to the other two criteria.
Therefore, the overall ranking of the proposed smart and sustainable SWM strategy alternatives according to the closeness coefficients (values are given in the respective parentheses) was SWM2 (0.458) > SWM3 (0.453) > SWM4 (0.452) > SWM1 (0.440). This means that the pay as you throw application (SWM2), which uses blockchain technology, had the best performance among the proposed smart sustainable SWM. Among the two strategies with very close closeness coefficients, IoT-based community composting (SWM3) was slightly ahead of IoT-based illegal sewage discharge prevention (SWM4), by only 0.001. The strategy of integrating illegal waste collection workers into a formal smart system (SWM1) came in last as the least favorite. In addition, the analysis of the sub-criteria revealed that authorities should give due consideration to operational feasibility (0.64), initial investment costs (0.56), and increased awareness (0.53) before implementing such strategies.

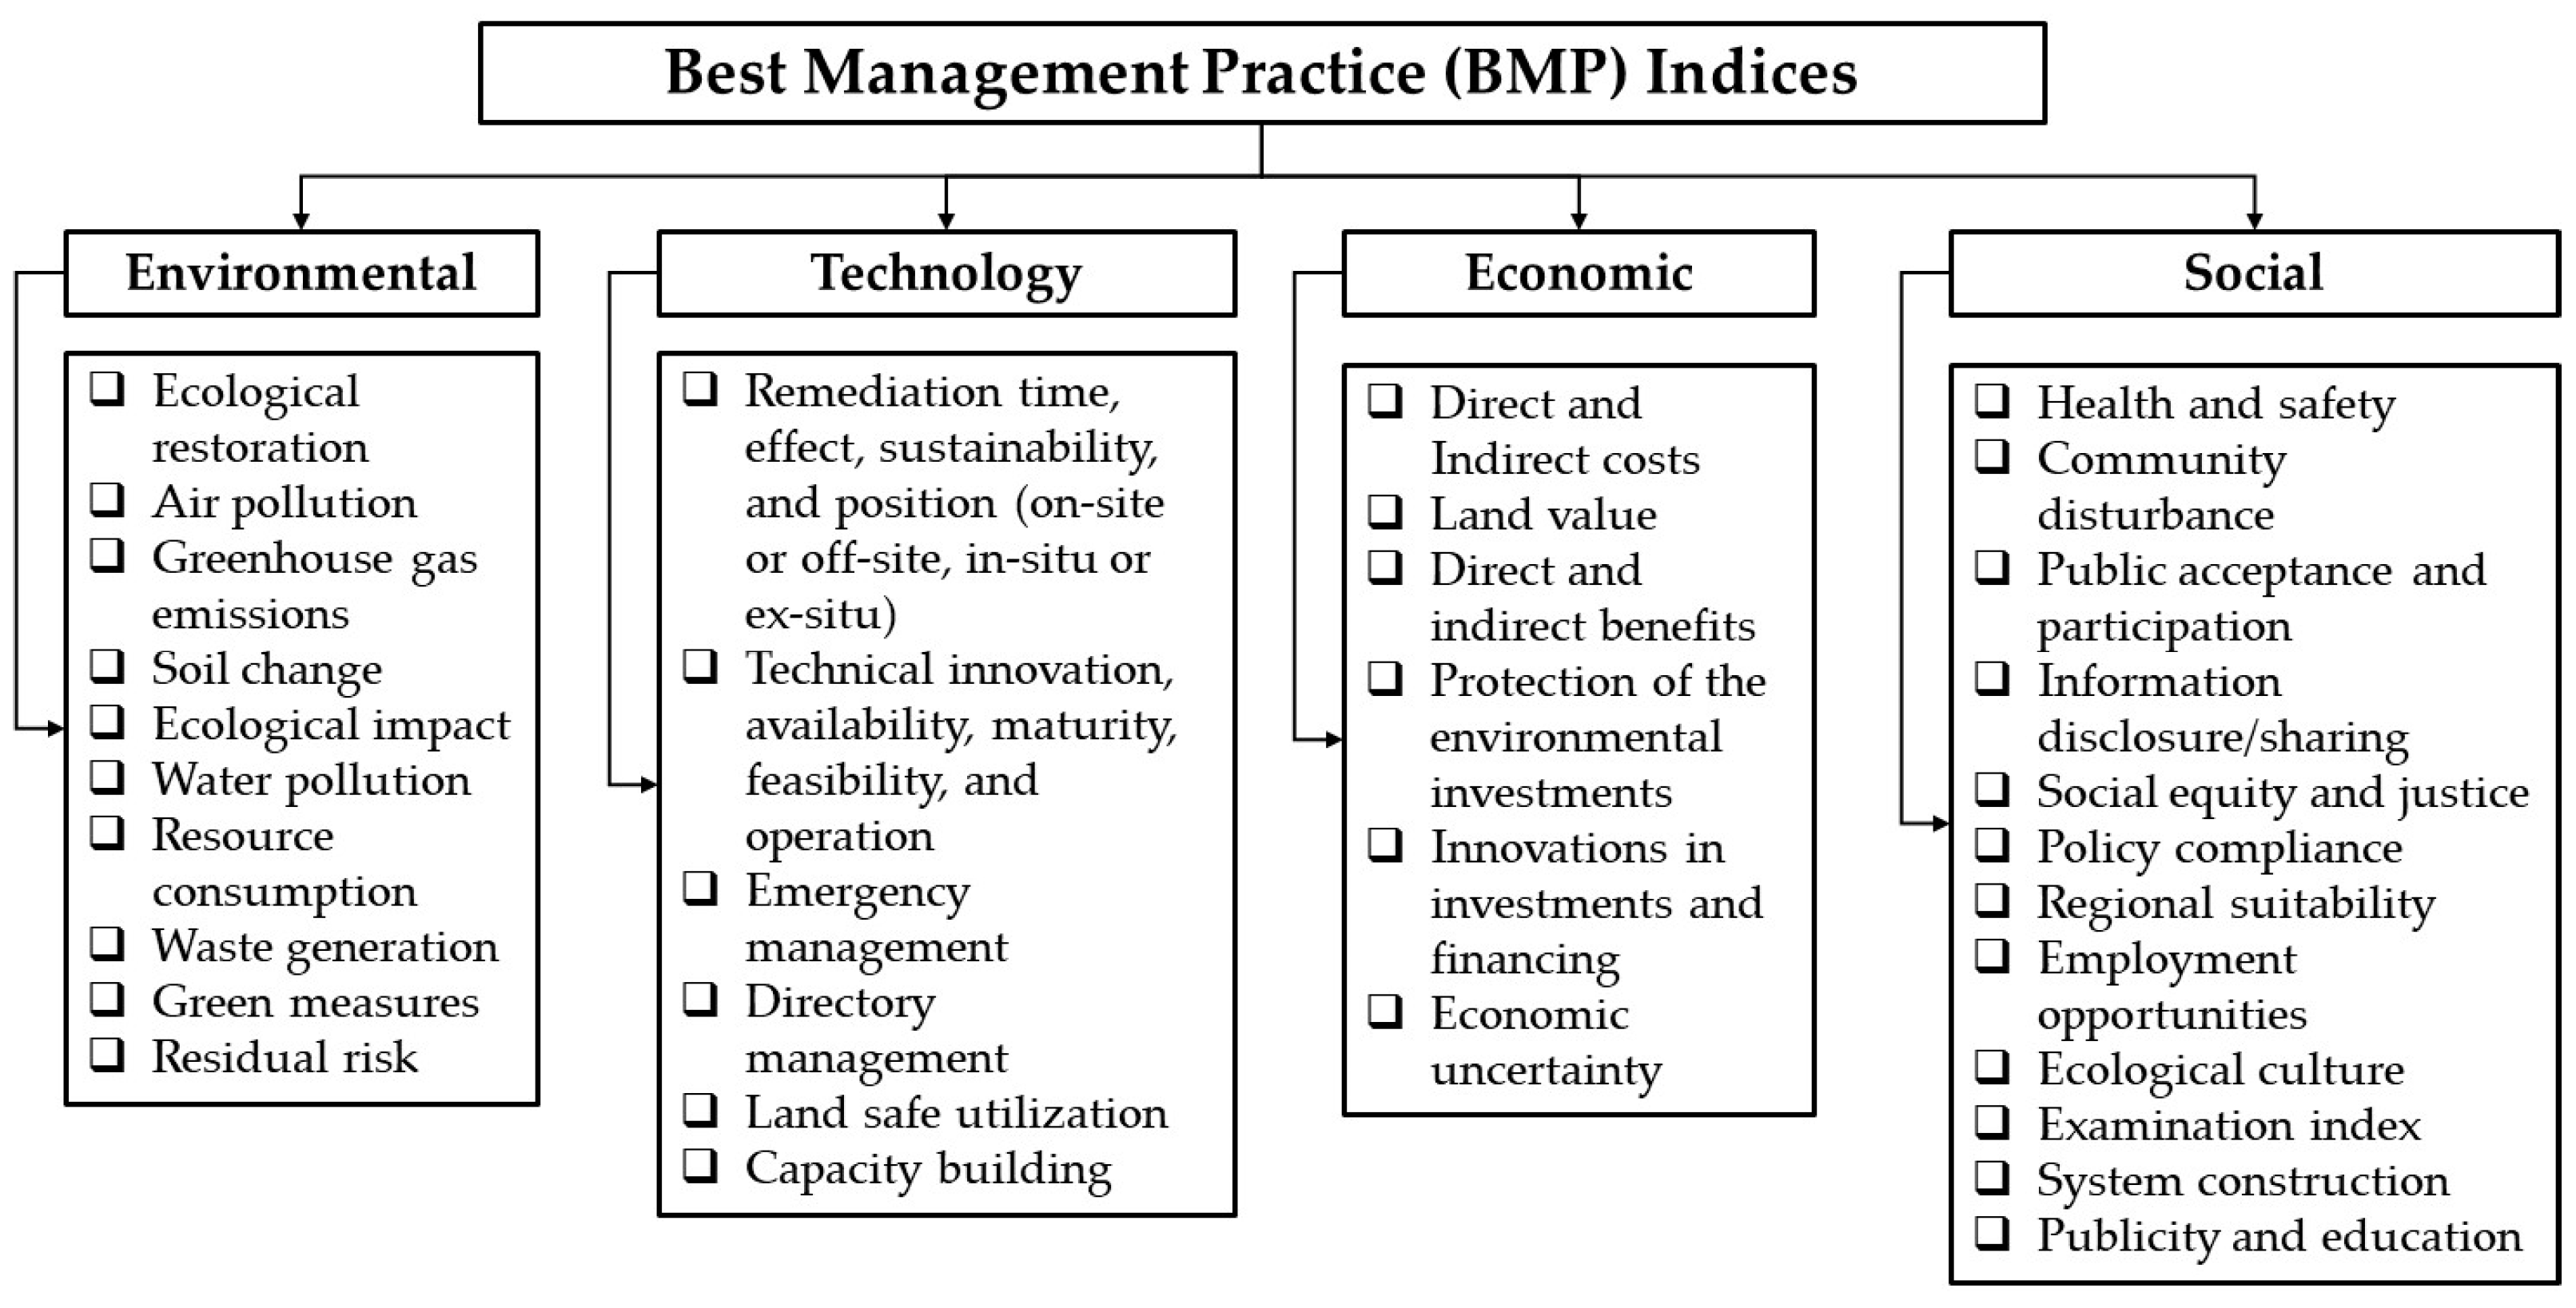
4.2.2. Contaminated Soil Remediation (CSR)

Recently, new MCDA approaches based on health risk assessment (HRA), GIS, fuzzy set theory, and Technique for Order Preference by Similarity to Ideal Solution (TOPSIS) have been used to evaluate the optimal CSR technologies [60,65,66,67,125,126,127,128,129,130,131,132,133,134].
In a study by Li et al. [135], a combination of a weight-based TOPSIS model, following a MCDA approach, was used to evaluate both the measures and indices over the entire life cycle of the management of a contaminated site from site investigation to land reuse in China. Generally, projects would have several Best Management Practice (BMP) indices, which are defined by the ASTM as strategies incorporating GSR principles into remediation or management at a specific site to balance the key elements of sustainability [136]. In this case study, the project had 44 BMP indices (10 for environmental, 12 social, 8 economics, and 14 technology) (Figure 8) and 108 BMPs incorporated in the five processes (site investigation, strategy design, remediation implementation, efficacy validation, and land reuse).
The 44 BMPs indices were as follows:
(a)
The 10 environment indices included ecological restoration; air pollution; greenhouse gas emissions; soil change; ecological impact; water pollution; resource consumption; waste generation; green measures; and residual risk;
(b)
The 8 economic indices comprised direct and indirect costs; land value; direct and indirect benefits; protection of the environmental investments; innovations in investments and financing; and economic uncertainty;
(c)
The 12 societal indices consisted of health and safety; community disturbance; public acceptance and participation; information disclosure/sharing; social equity and justice; policy compliance; regional suitability; employment opportunities; ecological culture; examine index (performance appraisal by the government on site and project managers); system construction; and publicity and education;
(d)
The 14 technology indices covered remediation time, effect, sustainability, and position (on-site or off-site, in situ or ex situ); technical innovation, availability, maturity, feasibility, and operation; emergency management; directory management; land safe utilization; and capacity building.
The results reported by Li et al. [135] showed that the proposed sustainable CSR of the different sites varies widely due to the applications of different BMPs. Notably, the BMPs affect sustainability throughout the site management processes (site investigation with quality assurance sampling, strategy design with resilience to climate change, implementation of remedial measures for treatment and reuse of cleaned soils and water, efficacy validation for reduction in residual risks, and land reuse with implementation of sustainable capping/covering systems). The results also showed that when considering the whole life cycle management, the environmental dimensions were found to be the controlling parameters over the social dimensions in both the strategy design and the remedial implementation processes.
Furthermore, the results indicated that the level of importance of the four categories during the whole life cycle management of a contaminated site was as follows, in descending order: environmental (0.3866) > economics (0.2427) > technology (0.2139) > social (0.1568). This outcome is not surprising because of the mandatory regulations on secondary pollution prevention in China. The social aspects showed the lowest impact on sustainability performance because public engagement in the decision making process of CSR in China is frequently disregarded [135]. Both the economics and technology categories had almost equal importance in view of nurturing sustainable management decisions.
Notably, while the choice of a practicable technology is principally determined by the economic factors, it will directly affect the CFP as well as other environmental impacts of a remediation project. More importantly, (i) the sensitivity analysis of the TOPSIS method showed that the random variations in indices’ weights did not result in significant changes in the sustainable remedial measures of the evaluated sites, indicating that the method could provide a robust outcome that would help the decision makers in reaching a sustainable decision; and (ii) the MCDA would enable stakeholders to adopt optimal BMPs for risk control to enhance the expected sustainable remedial measures for the management of the contaminated site as well as future redevelopments of the sites.
The specific evaluations of the environment, social, economic, and technology categories are detailed below.
In the environmental category, residual risk, GHG emissions, ecological impact, water pollution, and resource consumption indices had the highest impact on the environmental sustainability (more than 50%). It is worth noting that (i) the residual risk index showed the highest influence on the environmental sustainability with a 12.96% contribution, indicating that remedial measures to remove the existing pollutants from contaminated soils had more important weights than those for air, ecology, water, and resource caused by implementation of the remediation process; and (ii) soil change index, with 9.5% contribution to the environmental sustainability, is a significant parameter that needs to be considered in the choice of a specific remedial measure (i.e., limiting any adverse impacts on the properties (physical, chemical, biological, and overall quality) of the treated soils.
Within the social category, the main contributing indices to the social sustainability were health and safety (22.45%), public participation (12%), and public acceptance (9.5%), indicating the importance of public perceptions and feedback as well as conflict resolutions among different stakeholders during the whole decision making process. Also, it is to be noted that (i) the performance appraisal index strongly contributed, at 8.1%, to the social sustainability, indicating the positive role of regulatory agencies in including social aspects in the government performance appraisal of remedial projects; and (ii) information disclosure/knowledge sharing showed the lowest contribution, of 1.66%, indicating the current inefficiency that needs to be mitigated with more focus on developing future management approaches to enhance public information disclosure and dissemination of information.
Within the economic category, direct cost contributed to economic sustainability by 18.95%. Also, direct cost together with environmental protection investments, investment and financing innovation, land value, and economic uncertainty contributed to the economic sustainability at a rate of 72.22%. However, indirect costs contributed at a rate of 7.87%, which is the lowest in the economic category and could be attributed to the difficulty in quantifying it in monetary terms (e.g., calculating the health damage costs caused by exposure to pollutants).
Within the technical category, remediation time and remediation effect contributed to the technological sustainability by about 11.40%, which is the highest, because of the implicit specification in any remedial project. Other indices such as technical innovation, technical availability, technical maturity, and technical operability had a combined contribution of 29.09% to the technical sustainability. In addition, based on regional policies, new indices including directory management, capacity building, land safe utilization, and system construction had contributions ranging from 5.53 to 8.05%, indicating the clear potential in enhancing the technical sustainability. It is worth noting that the remediation location (i.e., in situ or ex situ) had the lowest contribution (3.46%), which is less than the average (7.15%), to the technical sustainability. However, in situ remediation would be preferable over ex situ because the latter may pose secondary pollution risks and additional economic costs.
Furthermore, the sustainability of the risk management approaches applied to the eleven sites in China varies widely (Figure 9). Based on this analysis, capping plus natural attenuation plus institutional control scored the highest values (0.9345 and 0.8219) because of the adopted risk management measures (i.e., elimination of secondary pollution, reduction in treatment costs, and no direct treatment), which is basically a containment method that is not feasible in the long term due to potential leakage and pollution of the surroundings. However, other remedial technologies that used different treatment techniques showed low sustainability scores ranging from 0.3534 to 0.6559. The authors (Li et al. [135]) have attributed lower scores to (i) cleanup projects implemented prior to the introduction of GSR policies; (ii) implemented treatment technologies that imposed a level of disturbance to the local environment and the presence of sensitive receptors in the area; and (iii) the high level of social concerns, resulting in lower-than-expected scores in environmental, social, economic, and technical sustainability.
These results could be due to limitations in this method of analysis, which include (i) the subjective nature of the links between BMPs and the evaluation indices, which depend on feedback from site stakeholders (e.g., managers, experts and technicians); (ii) the fact that health and environmental risks to pollution generally expand over years to decades, which would require more data that are difficult to track and collect over such a sustained period; and (iii) the specific nature of the indicators used in the model is specifically based on Chinese culture.
Therefore, more research is needed to overcome the subjectivity of the links between BMPs and the evaluation indices, to improve the long-term reliability of data for evaluating the health and environmental risks, and to develop a universal set of indicators that are independent of the culture sensitivities.

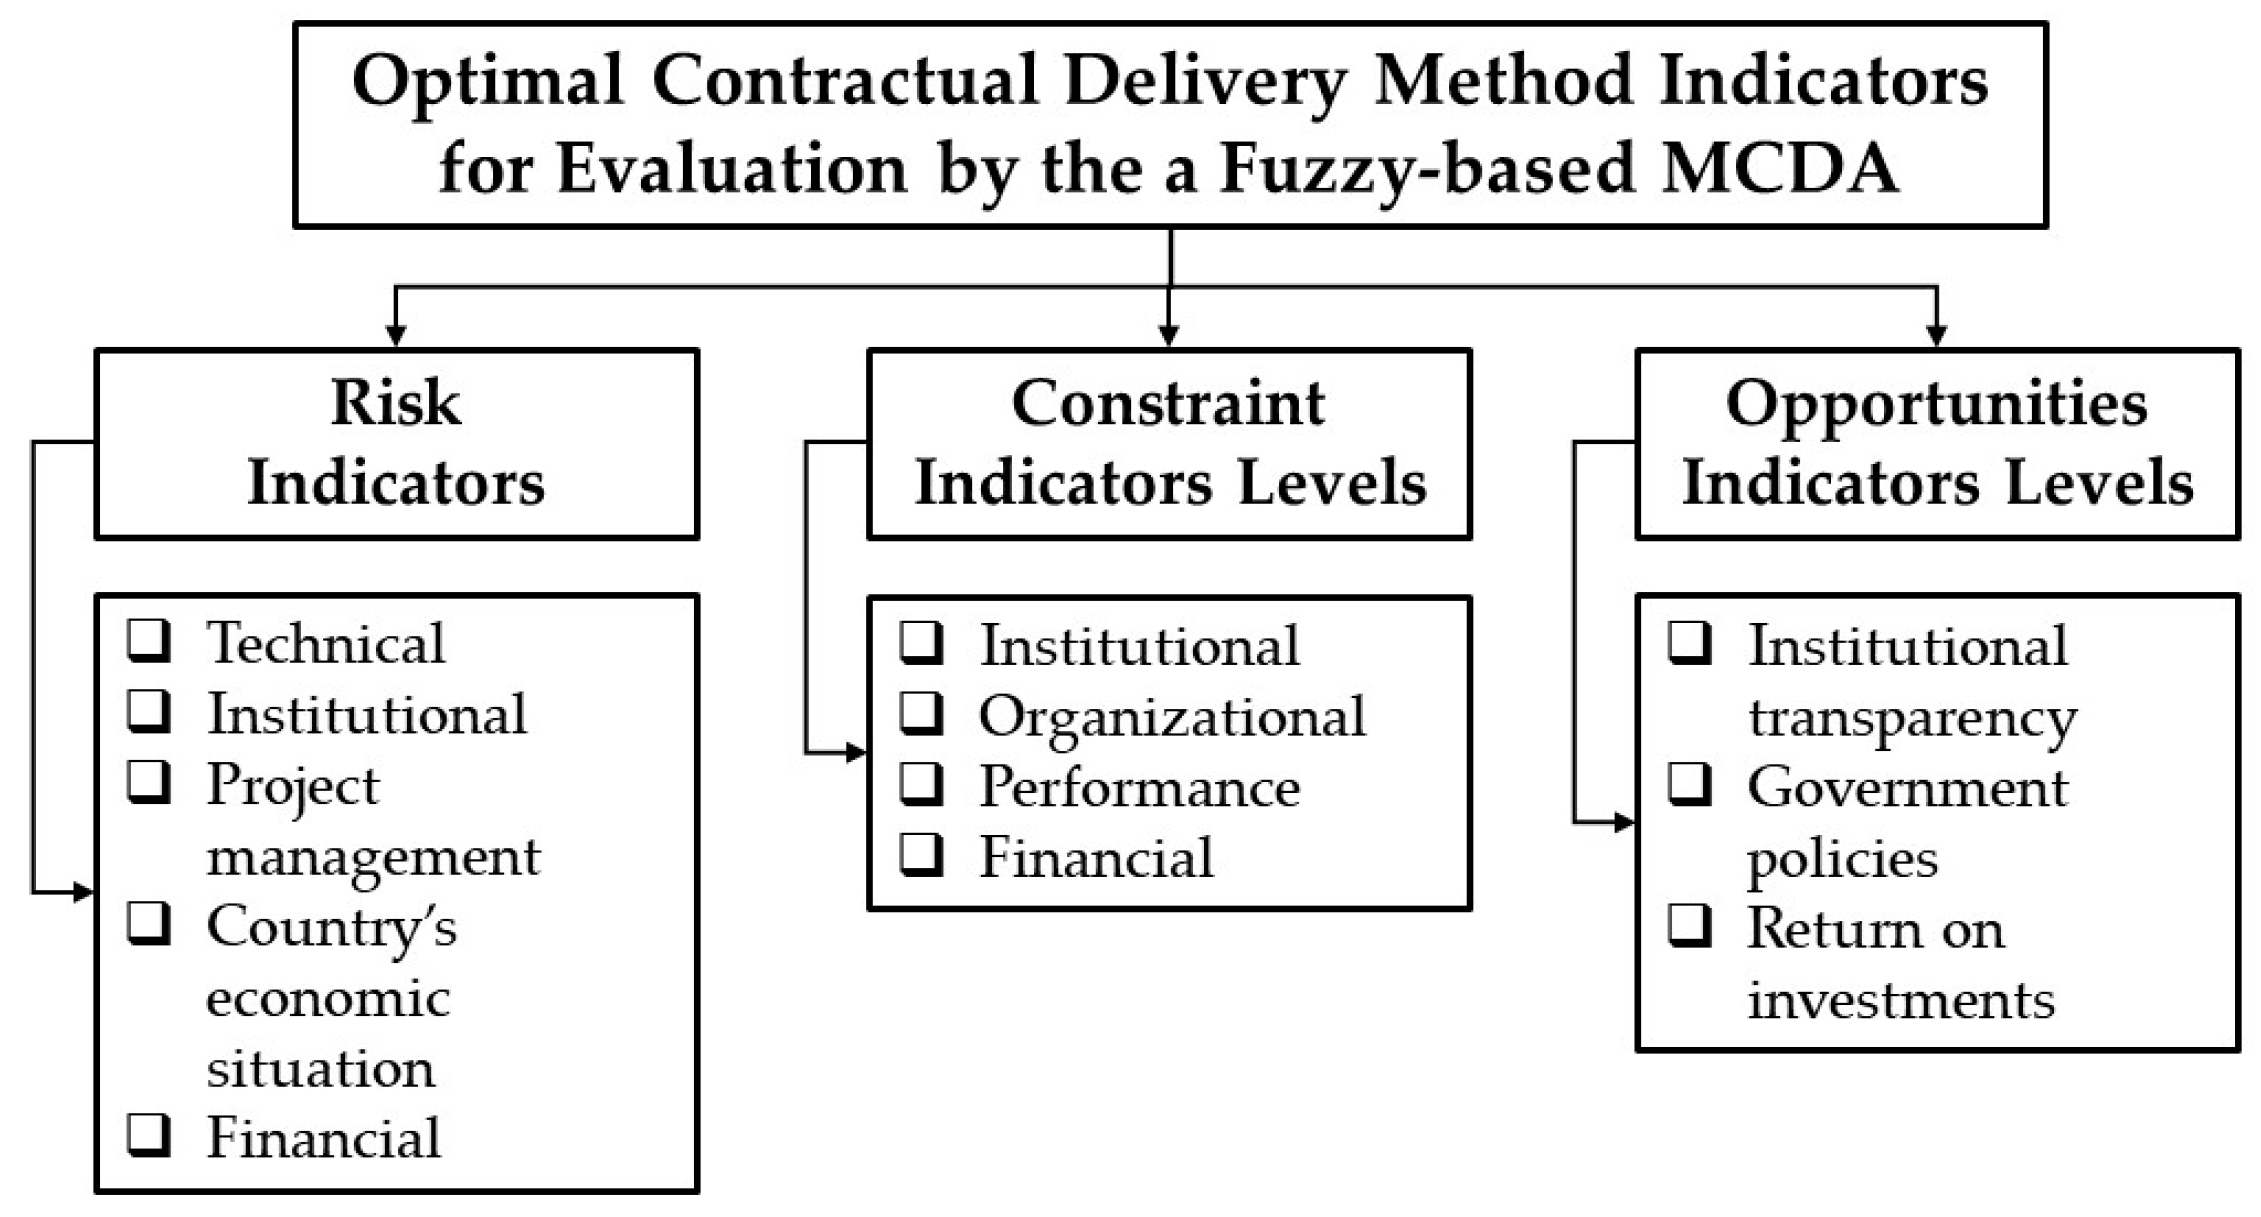
4.2.3. Optimal Contractual Delivery Method

The process of sustainability integration into project portfolio management (PPM) has been challenging and complex [137,138] due to [139] the following reasons: (i) environmental and social sustainability goals are multifaceted, complex, and lack clear solutions [140]; and (ii) project management sustainability goals, as well as longer-term corporate goals, may extend beyond the delivery horizons of individual projects or shorter-term portfolios [141]. These complications hinder the ability of both project and portfolio managers to align the project portfolio’s short-term goals (e.g., multiple projects’ time, budget, and scope objectives) with longer-term project portfolio and corporate business goals [142].
In a study by Al Nahyan et al. [143], a fuzzy-based multi-criterion decision making model was used to develop a DSS to assist the client in reaching a knowledge-based decision to choose the optimal contractual delivery method (CDM), considering the stakeholders (client or sponsor, government agency, project manager, consultant, and contractor), project requirements, potential elements of risks, investment opportunities, and constraints during the five stages of project delivery (planning, scoping, design, tendering, scheduling, and construction). The study used 11 CDMs, which were Design Bid Build (DBB), Design Build (DB), Performance-Based Maintenance Contracts (PBMCs), Construction Management at Risk (CMR), Design Build with Warranty (DBW), Design Build Operate Maintain (DBOM), Design Build Finance Operate (DBFO), Build Operate Transfer (BOT), Design Build Finance Operate Maintain (DBFOM), Alliance Contracting (AC), and Build Own Operate (BOO).
The elements and indicators used in the MCDA-based DSS and assessed by the decision makers were (Figure 10) (i) risk indicators (technical, institutional, project management, country’s economic situation, and financial); (ii) constraint indicators (institutional, organizational, performance, and financial); and (iii) opportunity indicators (institutional transparency, government policies, and return on investments).
The model results indicated that most of the delivery methods were equally valid when the project risk was minimal. In addition, it was recommended to select DBOM and DB methods of project delivery as the project risk increases beyond 50 percent. However, the conventional delivery method (DBB) was the least recommended if the project’s risk weight exceeds 30%. With equal considerations to the identified factors, the AHP model recommended DB as the most suitable delivery method as compared to DBB and CMR. With such an intricate system, the client can investigate the specifics of various project stages and study the effects of enhancements or deficiencies in the stakeholder entities’ capabilities.

5. Summary, Challenges, Considerations, and the Way Forward

5.1. Summary

In this review paper, the uses of various digital technologies and decision support systems (DSSs) are discussed in view of their contributions to optimize operation processes, reduce GHG emissions, lower global warming potential (GWP), reduce health and environmental impacts, and reduce energy consumption. Also, the paper highlights how digital technologies can revolutionize environmental management processes through providing real-time and accurate insights that enhance decision making for (i) the choice of an optimal sustainable waste management strategy that has a lower carbon footprint; (ii) the best smart waste management treatment technologies that are socially acceptable with minimal impact on the environment and economic feasibility; and (iii) the optimal location of a waste management facility. In doing so, GHG emissions; global warming potentials (GWPs); energy consumption; and air, water, and land pollution will be reduced, hence lowering human health and environmental impacts and contributing to the achievement of a ZERONET initiative (decarbonization) in environmental management practices.
Specifically, in solid waste management (SWM) professions, the Internet of Things (IoT), blockchain, and decision support systems (DSSs) play a crucial role in optimizing the collection, transportation, and processing of solid waste. Automated systems use real-time data from sensors and global positioning system (GPS) technology to optimize waste collection routes, minimizing fuel consumption and reducing emissions from collection vehicles. For instance, smart bins equipped with sensors can signal when they are full, allowing for dynamic route adjustments that prevent unnecessary trips. DSSs can further enhance this process by analyzing data on waste generation patterns, helping municipalities plan more efficient collection schedules and implement targeted recycling programs. By predicting waste volumes and types, DSSs can also assist in optimizing the operations of waste processing facilities, such as recycling centers and incinerators, to ensure they run at maximum efficiency, thereby reducing energy consumption, associated emissions, and the overall carbon footprint (CFP).
In wastewater treatment (WWT) professions, the IoT, data automation, and DSSs contribute to energy efficiency and reduced carbon footprints (CFPs) by optimizing treatment processes. Automated monitoring systems track key parameters such as flow rates, chemical concentrations, and microbial activity in real-time. These data enable precise control of treatment processes, reducing the need for excessive chemical use and minimizing energy consumption. DSSs can analyze historical and real-time data to predict system performance and identify areas for improvement. For example, these systems can recommend operational adjustments to aeration processes, which are typically energy-intensive, to ensure they are running efficiently. By predicting inflow patterns, DSSs can also help in managing peak loads, thereby preventing overloading of the system and reducing the risk of untreated wastewater discharge. Moreover, DSSs can support the integration of renewable energy sources, such as biogas produced from sludge digestion, into the energy supply of WWT plants. This not only reduces reliance on fossil fuels but also promotes a circular economy approach, where waste products are converted into valuable resources.
In contaminated soil remediation (CSR) professions, data automation and DSSs are essential for the effective remediation of contaminated soils, as they facilitate accurate site assessment and optimized remediation strategies. Automated systems collect data from soil samples, monitoring wells, and other sources to assess contamination levels and distribution. These data are then fed into DSSs, which use advanced modeling techniques to predict the spread of contaminants and evaluate the effectiveness of different remediation methods. DSSs can recommend the most suitable remediation techniques based on site-specific conditions, such as soil type, contamination level, and local environmental regulations. This ensures that the chosen method is not only effective in removing contaminants but also energy-efficient and low in carbon emissions. For instance, bioremediation techniques, which use microorganisms to degrade pollutants, can be optimized to enhance their efficiency and reduce the need for energy-intensive mechanical interventions. Furthermore, DSSs can facilitate the monitoring and management of remediation projects by providing real-time updates and predictive analytics. This allows for proactive adjustments to the remediation strategy, minimizing delays and reducing the overall environmental impact of the remediation activities.
Therefore, on the basis of the limited number of research papers that have been reviewed, it can be stated clearly that the adoption of digital technologies (data automation systems and DSS) in SWM, WWT, and CSR holds significant potential for enhancing decision making and decarbonization in environmental management practices.

5.2. Challenges and Considerations

5.2.1. Data Automation

The challenges and considerations that need to be addressed for successful implementation of data-based automation systems include the following:
(1)
The vast amount of data collected by IoT devices raises concerns about security and privacy. Robust data governance frameworks are needed to ensure data protection and prevent misuse;
(2)
Implementing these technologies requires significant investment in sensor networks, AI software, and blockchain infrastructure. Public–private partnerships and innovative financing models are crucial for wider adoption;
(3)
Integrating these complex technologies necessitates a skilled workforce capable of managing, analyzing, and maintaining the systems. Training programs and capacity building are essential;
(4)
Ensuring compatibility between different IoT devices, AI platforms, and blockchain systems is vital for seamless data exchange and system integration;
(5)
AI algorithms need to be designed with fairness and transparency in mind to avoid bias in waste management decisions.

5.2.2. Decision Support Systems (DSSs)

The vital challenges of using life cycle assessment (LCA) include the following: (i) consistent and reliable data on material production, energy consumption, and emissions across different regions and sectors can be challenging to find; (ii) modeling complex systems and accurately assessing indirect impacts can require specialized expertise and software; and (iii) life cycle inventory data and impact assessment methods may carry uncertainties, requiring careful interpretation and sensitivity analysis.
The crucial considerations of using LCA include the following: (i) clearly define the specific processes and activities included in the assessment, whether it is a single construction project, a specific remediation technique, or the entire life cycle of a piece of infrastructure; (ii) quantify the energy, materials, water, and other resources consumed at each stage of the life cycle, as well as the emissions and waste generated; (iii) assess the environmental impacts of these inputs and outputs using various categories like climate change, resource depletion, human health, and ecosystem quality; and (iv) analyze the results to identify hotspots with the highest environmental impact and explore alternative materials, design strategies, or management practices to reduce those impacts.
For DSSs to effectively support the environmental management objectives, they must address the following:
(a)
Sustainability metrics by defining and quantifying indicators representing environmental (e.g., resource depletion, biodiversity impacts), social (e.g., community well-being, equity considerations), economic (e.g., lifecycle costs, long-term value), and technical (e.g., effectiveness, resilience) factors;
(b)
Trade-offs by acknowledging and explicitly handling the potential trade-offs between sustainability dimensions. For example, a highly effective environmental management technology might be very energy intensive;
(c)
Uncertainty by accounting for uncertainties in data, model parameters, and long-term outcomes, particularly those related to climate change impacts;
(d)
Stakeholder involvement by facilitating transparency and incorporating diverse perspectives from regulators, communities, developers, and technical experts throughout the modeling process.

5.2.3. Sustainability of the Environmental Projects

The challenges when applying multi-criteria decision analysis (MCDA) to evaluate the sustainability of environmental management projects are as follows:
(1)
Sustainability itself is a multi-faceted concept. Deciding which environmental, social, and economic factors to include, and how to measure them, can be a significant challenge;
(2)
Reliable and comprehensive data on the potential impacts of different remediation options across various sustainability criteria may be limited, especially for social and long-term environmental effects;
(3)
Assigning weights to different criteria in MCDA inevitably involves a degree of subjectivity, which can be influenced by stakeholder biases and value judgments;
(4)
Stakeholders (regulators, communities, developers, etc.) may have divergent views on the relative importance of different sustainability factors, requiring careful facilitation for consensus;
(5)
There is inherent uncertainty surrounding the long-term outcomes of remediation technologies, especially when factoring in issues like climate change and evolving regulations;
(6)
Conveying the complex trade-offs and rationale behind MCDA results to non-technical stakeholders can be challenging and requires clear presentation.
The key considerations when applying MCDA to evaluate the sustainability of the environmental management projects are as follows:
(1)
Involving stakeholders in the process of identifying and selecting the most relevant sustainability criteria from the outset is crucial. This should include environmental, social, economic, and technical aspects tailored to site-specific concerns;
(2)
Defining quantifiable metrics (where possible) for each criterion is essential to ensure objective comparisons. This may involve both qualitative and quantitative indicators;
(3)
Choosing a weighting method that reflects stakeholder preferences while maintaining transparency. Common methods include ranking, pairwise comparisons, and the Analytic Hierarchy Process (AHP);
(4)
Performing sensitivity analysis to understand how changes in weights or input data might affect the overall ranking of remediation options. This adds robustness to the decision process;
(5)
Using techniques like Monte Carlo simulations to explicitly incorporate uncertainty into the analysis, providing a range of potential outcomes rather than single point estimates;
(6)
Facilitating ongoing communication with stakeholders throughout the MCDA process to build trust, address concerns, and ensure that diverse perspectives are considered.
Despite these challenges, MCDA is a valuable tool for guiding sustainable decision making for environmental management projects. By carefully considering these factors, practitioners can increase the likelihood of successful, sustainable outcomes that align with the needs and values of all stakeholders. Here is how to address some of the issues: (i) developing standardized sustainability metrics and data collection protocols can improve consistency across contaminated site assessments; (ii) consulting specialized experts in areas like LCA, social impact assessment, and risk modeling can help ensure the quality of the analysis; and (iii) clearly documenting all assumptions, methodologies, and data sources used in the MCDA process increases its defensibility and acceptance.

5.3. The Way Forward

Moving towards zero CFP, geo-environmental engineers must consider the following key areas:
(1)
The integration of data automation and DSSs into environmental management processes can significantly enhance decision making and aid in decarbonizing SWM, WWT, and CSR. Continued research and development are needed to improve data availability and quality, modeling tools, and methodologies. Collaboration between engineers, sensor developers, DSS experts, and AI software developers is crucial for advancing the integration process in the industry.
(2)
Achieving a zero CFP in SWM requires a comprehensive approach. Hence, collaborating across the industry, implementing best practices, and continuously seeking innovative solutions are key aspects.
(3)
Achieving carbon neutrality in CSR necessitates a multifaceted approach. Hence, embracing innovative low-energy techniques, optimizing existing methods, exploring sustainable materials and waste management practices, and continuously seeking further advancements are all crucial steps. Additionally, collaboration between engineers, scientists, policymakers, and the public is essential to develop and implement effective solutions for a cleaner and more sustainable future.
(4)
Transitioning towards energy-efficient operations requires a multi-pronged approach that involves investment in new technologies, adoption of best practices, and collaboration across the industry. Also, data collection and analysis are crucial for accurately measuring energy consumption and identifying areas for improvement. Hence, by continuously seeking innovative solutions and embracing a sustainability mindset, the geo-environmental engineering profession can move towards a zero-carbon future.
(5)
Achieving economic feasibility alongside sustainable environmental goals requires a multifaceted approach. This can be achieved by employing careful LCA and life cycle costing (LCC), fostering innovation, exploring alternative financing methods, and demonstrating the economic advantages of sustainable practices.

Author Contributions

Conceptualization, A.-M.O.M.; methodology, A.-M.O.M., D.M., A.F. and M.T.A.N.; formal analysis, A.F. and M.T.A.N.; writing—original draft, A.-M.O.M.; writing—review & editing, D.M., A.F. and M.T.A.N. All authors have read and agreed to the published version of the manuscript.

Funding

This research received no external funding.

Informed Consent Statement

Not applicable.

Data Availability Statement

The original contributions presented in the study are included in the article, further inquiries can be directed to the corresponding author.

Conflicts of Interest

Author Abdel-Mohsen O. Mohamed was a Senior Scientific Advisor to Uberbinder Limited and the General Managing Director to EX Scientific Consultants and declares that the research was conducted in the absence of any commercial or financial relationships that could be constructed as a potential conflict of interest. The remaining authors declare that the research was conducted in the absence of any commercial or financial relationships that could be construed as a potential conflict of interest.

References

  1. Hong, J.; Zhan, S.; Yu, Z.; Hong, J.; Qi, C. Life-cycle environmental and economic assessment of medical waste treatment. J. Clean. Prod. 2018, 174, 65–73. [Google Scholar] [CrossRef]
  2. Metcalf and Eddy. Wastewater Engineering: Treatment and Reuse, 4th ed.; McGraw-Hill: New York, NY, USA, 2014. [Google Scholar]
  3. Chai, C.; Zhang, D.; Yu, Y.; Feng, Y.; Wong, M.S. Carbon footprint analyses of mainstream wastewater treatment technologies under different sludge treatment scenarios in China. Water 2015, 7, 918–938. [Google Scholar] [CrossRef]
  4. Corominas, L.; Alsina, X.F.; Snip, L.; Vanrolleghem, P. Comparison of different modeling approaches to better evaluate greenhouse gas emissions from whole wastewater treatment plants. Biotechnol. Bioeng. 2012, 109, 2854–2863. [Google Scholar] [CrossRef] [PubMed]
  5. Sweetapple, C.; Fu, G.; Butler, D. Identifying sensitive sources and key control handles for the reduction of greenhouse gas emissions from wastewater treatment. Water Res. 2014, 62, 249–259. [Google Scholar] [CrossRef]
  6. Sweetapple, C.; Fu, G.; Butler, D. Identifying key sources of uncertainty in the modelling of greenhouse gas emissions from wastewater treatment. Water Res. 2013, 47, 4652–4665. [Google Scholar] [CrossRef] [PubMed]
  7. Zhang, Y.; Zhang, C.; Qiu, Y.; Li, B.; Pang, H.; Xue, Y.; Liu, Y.; Yuan, Z.; Huang, X. Wastewater treatment technology selection under various influent conditions and effluent standards based on life cycle assessment. Resour. Conserv. Recycl. 2020, 154, 104562. [Google Scholar] [CrossRef]
  8. McCarty, P.L.; Bae, J.; Kim, J. Domestic wastewater treatment as a net energy producer—Can this be achieved? Environ. Sci. Technol. 2011, 45, 7100–7106. [Google Scholar] [CrossRef]
  9. Hao, X.; Liu, R.; Huang, X. Evaluation of the potential for operating carbon neutral WWTPs in China. Water Res. 2015, 87, 424–431. [Google Scholar] [CrossRef]
  10. Zawartka, P.; Burchart-Korol, D.; Blaut, A. Model of Carbon Footprint Assessment for the Life Cycle of the System of Wastewater Collection, Transport and Treatment. Sci. Rep. 2020, 10, 5799. [Google Scholar] [CrossRef]
  11. Vocciante, M.; de D’Auris, A.F.; Franchi, E.; Petruzzelli, G.; Ferro, S. CO2 footprint analysis of consolidated and innovative technologies in remediation activities. J. Clean. Prod. 2021, 297, 126723. [Google Scholar] [CrossRef]
  12. Hannan, M.A.; Al Mamuna, M.D.A.; Hussain, A.; Basri, H.; Begum, R.A. A review on technologies and their usage in solid waste monitoring and management systems: Issues and challenges. Waste Manag. 2015, 43, 509–523. [Google Scholar] [CrossRef] [PubMed]
  13. Khoa, T.A.; Phuc, C.H.; Lam, P.D.; Nhu, L.M.B.; Trong, N.M.; Phuong, N.T.H.; Dung, N.V.; Tan-Y, N.; Nguyen, H.N.; Duc, D.N.M. Waste management system using iot-based machine learning in university. Wirel. Commun. Mob. Comput. 2020, 2020, 6138637. [Google Scholar]
  14. Kassou, M.; Bourekkadi, S.; Khoulji, S.; Slimani, K.; Chikri, H.; Kerkeb, M.L. Blockchain-based medical and water waste management conception. E3S Web Conf. 2021, 234, 00070. [Google Scholar] [CrossRef]
  15. Jiang, P.; Van Fan, Y.; Zhou, J.; Zheng, M.; Liu, X.; Klemeš, J.J. Data-driven analytical framework for waste-dumping behavior analysis to facilitate policy regulations. Waste Manag. 2020, 103, 285–295. [Google Scholar] [CrossRef]
  16. Senthilkumar, R.; Venkatakrishnan, P.; Balaji, N. Intelligent based novel embedded system based iot enabled air pollution monitoring system. Microprocess. Microsyst. 2020, 77, 103172. [Google Scholar] [CrossRef]
  17. Sheng, T.J.; Islam, M.S.; Misran, N.; Baharuddin, M.H.; Arshad, H.; Islam, M.D.R.; Chowdhury, M.E.H.; Rmili, H.; Islam, M.T. An internet of things based smart waste management system using lora and tensorflow deep learning model. IEEE Access 2020, 8, 148793–148811. [Google Scholar] [CrossRef]
  18. Kang, K.D.; Kang, H.; Ilankoon, I.M.S.K.; Chong, C.Y. Electronic waste collection systems using internet of things (IoT): Household electronic waste management in Malaysia. J. Clean. Prod. 2020, 252, 119801. [Google Scholar] [CrossRef]
  19. Seker, S. IoT based sustainable smart waste management system evaluation using MCDM model under interval-valued q-rung ortho-pair fuzzy environment. Technol. Soc. 2022, 71, 102100. [Google Scholar] [CrossRef]
  20. Zhou, H.; Yu, X.; Alhaskawi, A.; Dong, Y.; Wang, Z.; Jin, Q.; Hu, X.; Liu, Z.; Kota, V.G.; Abdulla, M.H.A.H.; et al. A deep learning approach for medical waste classification. Sci. Rep. 2022, 12, 2159. [Google Scholar] [CrossRef] [PubMed]
  21. Gopikumar, S.; Raja, S.; Robinson, Y.H.; Shanmuganathan, V.; Rho, S. A method of landfill leachate management using internet of things for sustainable smart city development. Sustain. Cities Soc. 2020, 66, 102521. [Google Scholar] [CrossRef]
  22. Mabrouki, J.; Azrour, M.; Fattah, G.; Dhiba, D.; El Hajjaji, S. Intelligent monitoring system for biogas detection based on the Internet of Things: Mohammedia, Morocco city landfill case. Big Data Min. Anal. 2021, 4, 10–17. [Google Scholar] [CrossRef]
  23. Li, X.; Su, J.; Wang, H.; Boczkaj, G.; Mahlknecht, J.; Singh, S.V.; Wang, C. Bibliometric analysis of artificial intelligence in wastewater treatment: Current status, research progress, and future prospects. J. Environ. Chem. Eng. 2024, 12, 113152. [Google Scholar] [CrossRef]
  24. Chen, H.; Chen, A.; Xu, L.; Xie, H.; Qiao, H.; Lin, Q.; Cai, K. A deep learning CNN architecture applied in smart near-infrared analysis of water pollution for agricultural irrigation resources. Agric. Water Manag. 2020, 240, 106303. [Google Scholar] [CrossRef]
  25. Geng, J.; Yang, C.; Lan, L.; Li, Y.; Han, J.; Zhou, C. A novel total nitrogen prediction method based on recurrent neural networks utilizing cross-coupling attention and selective attention. Neurocomputing 2023, 527, 48–59. [Google Scholar] [CrossRef]
  26. Yaqub, M.; Asif, H.; Kim, S.; Lee, W. Modeling of a full-scale sewage treatment plant to predict the nutrient removal efficiency using a long short-term memory (LSTM) neural network. J. Water Process Eng. 2020, 37, 101388. [Google Scholar] [CrossRef]
  27. Xu, B.; Pooi, C.K.; Tan, K.M.; Huang, S.; Shi, X.; Ng, H.Y. A novel long short-term memory artificial neural network (LSTM)-based soft-sensor to monitor and forecast wastewater treatment performance. J. Water Process Eng. 2023, 54, 104041. [Google Scholar] [CrossRef]
  28. Zhang, Y.; Li, C.; Duan, H.; Yan, K.; Wang, J.; Wang, W. Deep learning-based data driven model for detecting time-delay water quality indicators of wastewater treatment plant influent. Chem. Eng. J. 2023, 467, 143483. [Google Scholar] [CrossRef]
  29. Galarza, A.; Ayesa, E.; Linaza, M.T.; Rivas, A.; Salterain, A. Application of mathematical tools to improve the design and operation of activated sludge plants. Case study: The new WWTP of Galindo-Bilbao Part II: Operational strategies and automatic controllers. Water Sci. Technol. 2001, 43, 167–174. [Google Scholar] [CrossRef]
  30. Ayesa, E.; De la Sota, A.; Grau, P.; Sagarna, J.M.; Salterain, A.; Suescun, J. Supervisory control strategies for the new WWTP of Galindo-Bilbao: The long run from the conceptual design to the full-scale experimental validation. Water Sci. Technol. 2006, 53, 193–201. [Google Scholar] [CrossRef]
  31. Maiza, M.; Bengoechea, A.; Grau, P.; De Keyser, W.; Nopens, I.; Brockmann, D.; Steyer, J.P.; Claeys, F.; Urchegui, G.; Fernandez, O.; et al. Add control: Plant virtualization for control solutions in WWTP. Water Sci. Technol. 2013, 68, 296–302. [Google Scholar] [CrossRef] [PubMed]
  32. Vieira, A.; Marques, R.; Raposo, R.; Martins, M.; Alves, R.; Povoa, P.; Irizar, I.; Beltran, S.; Craamer, P.; Urchegui, G.; et al. The impact of the art-ICA control technology on the performance, energy consumption and greenhouse gas emissions of full-scale wastewater treatment plants. J. Clean. Prod. 2019, 213, 680–687. [Google Scholar] [CrossRef]
  33. Moldovan, A.; Nuca, I. Automation of wastewater treatment plant. In Proceedings of the 2019 International Conference on Electromechanical and Energy Systems (SIELMEN), Craiova, Romania, 9–11 October 2019. [Google Scholar] [CrossRef]
  34. Oduah, U.I.; Ogunye, E.B. A smart solution for preventing environmental pollution caused by overflowing onsite sewage septic tank. Heliyon 2023, 9, e14925. [Google Scholar] [CrossRef] [PubMed]
  35. Porro, J. Using AI to Reduce Process Emissions from Water Utilities. 2021. Available online: https://iwa-network.org/using-ai-to-reduce-process-emissions-from-water-utilities/ (accessed on 15 July 2024).
  36. Khan, M.d.S.I.; Rahman, A.; Islam, S.; Nasir, M.K.; Band, S.S.; Mosavi, A. IoT and wireless sensor networking-based effluent treatment plant monitoring system. Acta Polytech. Hung. 2021, 18, 205–224. [Google Scholar] [CrossRef]
  37. Soleimani, R.; Shoushtari, N.A.; Mirza, B.; Salahi, A. Experimental investigation, modeling and optimization of membrane separation using artificial neural network and multi-objective optimization using genetic algorithm. Chem. Eng. Res. Des. 2013, 91, 883–903. [Google Scholar] [CrossRef]
  38. Wang, J.; Wan, K.; Gao, X.; Cheng, X.; Shen, Y.; Wen, Z.; Piran, M.J. Energy and materials-saving management via deep learning for wastewater treatment plants. IEEE Access 2020, 8, 191694–191705. [Google Scholar] [CrossRef]
  39. Adibimanesh, B.; Polesek-Karczewska, S.; Bagherzadeh, F.; Szczuko, P.; Shafighfard, T. Energy consumption optimization in wastewater treatment plants: Machine learning for monitoring incineration of sewage sludge, Sustain. Energy Technol. Assess 2023, 56, 103040. [Google Scholar] [CrossRef]
  40. Wang, Y.Q.; Wang, H.C.; Song, Y.P.; Zhou, S.Q.; Li, Q.N.; Liang, B.; Wang, A.J. Machine learning framework for intelligent aeration control in wastewater treatment plants: Automatic feature engineering based on variation sliding layer. Water Res. 2023, 246, 120676. [Google Scholar] [CrossRef]
  41. Popescu, S.M.; Mansoor, S.; Wani, O.A.; Kumar, S.S.; Sharma, V.; Sharma, A.; Arya, V.M.; Kirkham, M.B.; Hou, D.; Bolan, N.; et al. Artificial intelligence and IoT driven technologies for environmental pollution monitoring and management. Front. Environ. Sci. 2024, 12, 1336088. [Google Scholar] [CrossRef]
  42. Davis, G.B.; Rayner, J.L.; Donn, M.J. Advancing Autonomous sensing and prediction of the subsurface environment: A review and exploration of the challenges for soil and groundwater contamination. Environ. Sci. Pollut. Res. Int. 2023, 30, 19520–19535. [Google Scholar] [CrossRef]
  43. Sookhak Lari, K.; Davis, G.B.; Rayner, J.L. Towards a digital twin for characterizing natural source zone depletion: A feasibility study based on the Bemidji site. Water Res. 2022, 208, 117853. [Google Scholar] [CrossRef]
  44. Vasudevan, S.K.; Baskaran, B. An improved real-time water quality monitoring embedded system with IoT on unmanned surface vehicle. Ecol. Inf. 2021, 65, 101421. [Google Scholar] [CrossRef]
  45. Mohamed, A.M.O. Principles and Applications of Time Domain Electrometry in Geo-Environmental Engineering; Taylor & Francis Publishers: Abingdon, UK, 2006; 603p, ISBN 0415411297. [Google Scholar]
  46. Mohamed, A.M.O.; Said, R.A.; Al Shawawreh, N.K. A TDR system for subsurface pollutants detection (II): Application & analysis. In Proceedings of the Symposium TDR2001: Innovative Applications of TDR Technology, Infrastructure Technology Institute, Northwestern, Evanston, IL, USA, 5–7 September 2001. [Google Scholar]
  47. Mohamed, A.M.O.; Said, R.; AlShawawreh, N.K. Development of a methodology for evaluating subsurface concentrations of pollutants using electrical polarization technique. Geotech. Test. J. 2002, 25, 157–167. [Google Scholar] [CrossRef]
  48. Mohamed, A.M.O.; Said, R.A.; AlShawawreh, N.K.; El-Bassouni, M.Y. Evaluation of water content and ionic concentrations of soils via frequency domain analysis of TDR waveforms. Int. J. Subsurf. Sens. Technol. Appl. 2003, 4, 159–186. [Google Scholar] [CrossRef]
  49. Mohamed, A.M.O.; Said, R.A.; El-Bassiouni, M.Y. Eigen-decomposition of TDR waveforms: A novel method to determine water content and pore fluid concentration of sandy soils. Environ. Geol. 2003, 45, 132–143. [Google Scholar] [CrossRef]
  50. Mohamed, A.M.O.; Said, R.A. TDR detection of nonaqueous phase liquids in sandy soils using the eigen-decomposition method. Environ. Geol. J. 2004, 47, 30–37. [Google Scholar] [CrossRef]
  51. Mohamed, A.M.O.; Said, R.A. Detection of organic pollutants in sandy soils via TDR and eigen-decomposition. J. Contam. Hydrol. 2005, 76, 235–249. [Google Scholar] [CrossRef]
  52. Mohamed, A.M.O.; Hawas, Y. Neuro-fuzzy logic model for evaluating water content of sandy soils. Int. J. Comput.-Aided Civ. Infrastruct. Eng. 2004, 19, 343–356. [Google Scholar] [CrossRef]
  53. Sivavec, T.M.; Mackenzie, P.D.; Baghel, S.S.; Salvo, J.J. Method and System to Remotely Monitor Groundwater Treatment. U.S. Patent US6491828B1, 10 December 2002. [Google Scholar]
  54. Van Thanh, N. Optimal waste-to-energy strategy assisted by fuzzy mcdm model for sustainable solid waste management. Sustainability 2022, 14, 6565. [Google Scholar] [CrossRef]
  55. Chaisar, M.; Garg, S.K. Selection of sewage treatment technology using analytic hierarchy process. Mater. Today Proc. 2021, 56, 3433–3440. [Google Scholar] [CrossRef]
  56. Dewalkar, S.V.; Shastri, S.S. Integrated life cycle assessment and life cycle cost assessment based fuzzy multi-criteria decision-making approach for selection of appropriate wastewater treatment system. J. Water Process Eng. 2022, 45, 102476. [Google Scholar] [CrossRef]
  57. Garcia-Garcia, G. Using multi-criteria decision-making to optimize solid waste management. Curr. Opin. Green Sustain. Chem. 2022, 37, 100650. [Google Scholar] [CrossRef]
  58. Demircan, B.G.; Yetilmezsoy, K. A Hybrid Fuzzy AHP-TOPSIS Approach for Implementation of Smart Sustainable Waste Management Strategies. Sustainability 2023, 15, 6526. [Google Scholar] [CrossRef]
  59. Kabirifar, K.; Ashour, M.; Yazdani, M.; Mahdiyar, A.; Malekjafarian, M. Cybernetic-parsimonious MCDM modeling with application to the adoption of Circular Economy in waste management. Appl. Soft Comput. 2023, 139, 110186. [Google Scholar] [CrossRef]
  60. Mohamed, A.M.O.; Cote, K. Decision analysis of polluted sites—A fuzzy set approach. Int. J. Waste Manag. 1999, 19, 519–533. [Google Scholar] [CrossRef]
  61. Marcomini, A.; Suter, G.W., II; Critto, A. Decision Support Systems for Risk-Based Management of Contaminated Sites; Springer Sciences Business Media: New York, NY, USA, 2009. [Google Scholar]
  62. Onwubuya, K.; Cundy, A.B.; Puschenreiter, M.; Kumpiene, J.; Bone, B.; Greaves, J.; Teasdale, P.; Mench, M.; Tlusto, P.; Mikhalovsky, S.; et al. Developing decision support tools for the selection of “gentle” remediation approaches. Sci. Total Environ. 2009, 407, 6132–6142. [Google Scholar] [CrossRef] [PubMed]
  63. Rosen, L.; Back, P.E.; Soderqvis, T.; Norrman, J.; Brinkhoff, P.; Norberg, T.; Volchko, Y.; Norin, M.; Bergknut, M.; Doberl, D. SCORE: A novel multi-criteria decision analysis approach to assessing the sustainability of contaminated land remediation. Sci. Total Environ. 2015, 511, 621–638. [Google Scholar] [CrossRef] [PubMed]
  64. Huysegoms, L.; Cappuyns, V. Critical review of decision support tools for sustainability assessment of site remediation options. J. Environ. Manag. 2017, 196, 278–296. [Google Scholar] [CrossRef] [PubMed]
  65. Mohamed, A.M.O.; Paleologos, E.; Howari, F. Pollution Assessment for Sustainable Practices in Applied Sciences and Engineering; Elsevier: Amsterdam, The Netherlands, 2021; 1138p, ISBN 978-0-12-809582-9. [Google Scholar]
  66. Mohamed, A.M.O.; Paleologos, E.K. Sustainable pollution assessment practices. Chapter 1. In Pollution Assessment for Sustainable Practices in Applied Sciences and Engineering; Mohamed, A.M.O., Paleologos, E., Howari, F., Eds.; Elsevier: Amsterdam, The Netherlands, 2021. [Google Scholar] [CrossRef]
  67. Paleologos, E.K.; Mohamed, A.M.O. Risk Analysis and Management. Chapter 2. In Pollution Assessment for Sustainable Practices in Applied Sciences and Engineering; Mohamed, A.M.O., Paleologos, E., Howari, F., Eds.; Elsevier: Amsterdam, The Netherlands, 2021. [Google Scholar] [CrossRef]
  68. Feng, F.; Ghorbani, H.; Radwan, A.E. Predicting groundwater level using traditional and deep machine learning algorithms. Environ. Sci. 2024, 12, 1291327. [Google Scholar] [CrossRef]
  69. Kiker, G.A.; Bridges, T.S.; Varghese, A.; Seager, P.T.P.; Linkov, I. Application of multicriteria decision analysis in environmental decision making. Integr. Environ. Assess. Manag. 2005, 1, 95–108. [Google Scholar] [CrossRef] [PubMed]
  70. Cundy, A.B.; Bardos, R.P.; Church, A.; Puschenreiter, M.; Friesl-Hanl, W.; Müller, I.; Neu, S.; Mench, M.; Witters, N.; Vangronsveld, J. Developing principles of sustainability and stakeholder engagement for “gentle” remediation approaches: The European context. J. Environ. Manag. 2013, 129, 283–291. [Google Scholar] [CrossRef]
  71. Naseri-Rad, M.; Berndtsson, R.; Aminifar, A.; McKnight, U.S.; O’Connor, D.; Persson, K.M. DynSus: Dynamic sustainability assessment in groundwater remediation practice. Sci. Total Environ. 2022, 832, 154992. [Google Scholar] [CrossRef]
  72. Stezar, I.C.; Ozunu, A.; Barry, D.L. The role of stakeholder attitudes in managing contaminated sites: Survey of Romanian stakeholder awareness. Environ. Sci. Pollut. Res. 2014, 21, 787–800. [Google Scholar] [CrossRef]
  73. Braun, A.B.; Trentin, A.W.S.; Visentin, C.; Thome, A. Sustainable remediation through the risk management perspective and stakeholder involvement: A systematic and bibliometric view of the literature. Environ. Pollut. 2019, 255, 113221. [Google Scholar] [CrossRef]
  74. Prior, J.; Rai, T. Engaging with residents’ perceived risks and benefits about technologies as a way of resolving remediation dilemmas. Sci. Total Environ. 2017, 601–602, 1649–1669. [Google Scholar] [CrossRef]
  75. Ibanez-Fores, V.; Bovea, M.D.; Perez-Belis, V. A holistic review of applied methodologies for assessing and selecting the optimal technological alternative from a sustainability perspective. J. Clean. Prod. 2014, 70, 259–281. [Google Scholar] [CrossRef]
  76. Cappuyns, V. Inclusion of social indicators in decision support tools for the selection of sustainable site remediation options. J. Environ. Manag. 2016, 184, 45–56. [Google Scholar] [CrossRef] [PubMed]
  77. Huysegoms, L.; Rousseau, S.; Cappuyns, V. Friends or foes? Monetized life cycle assessment and cost-benefit analysis of the site remediation of a former gas plant. Sci. Total Environ. 2018, 619, 258–271. [Google Scholar] [CrossRef] [PubMed]
  78. Søndergaard, G.L.; Binning, P.J.; Bondgaard, M.; Bjerg, P.L. Multi-criteria assessment tool for sustainability appraisal of remediation alternatives for a contaminated site. J. Soils Sediments 2018, 18, 3334–3348. [Google Scholar] [CrossRef]
  79. Braun, A.B.; Visentin, C.; da Silva Trentin, A.W.; Thome, A. List of relevant sustainability indicators in remediation processes and their validation by stakeholders. J. Clean. Prod. 2021, 317, 128440. [Google Scholar] [CrossRef]
  80. Visentin, C.; da Silva Trentin, A.W.; Braun, A.B.; Thome, A. Application of life cycle assessment as a tool for evaluating the sustainability of contaminated sites remediation: A systematic and bibliographic analysis. Sci. Total Environ. 2019, 672, 893–905. [Google Scholar] [CrossRef]
  81. Khan, M.H.; Laitinen, V.; Havukainen, J.; Horttanainen, M. Carbon footprint of different recovery options for the re-pulping reject from liquid packaging board waste treatment process. Waste Manag. 2021, 136, 93–103. [Google Scholar] [CrossRef] [PubMed]
  82. Chen, C.; Zhang, X.M.; Chen, J.A.; Chen, F.; Li, J.; Chen, Y.; Hou, H. Assessment of site contaminated soil remediation based on an input output life cycle assessment. J. Clean. Prod. 2020, 263, 121422. [Google Scholar] [CrossRef]
  83. Mohamed, A.M.O.; Antia, H. Geo-Environmental Engineering; Elsevier: Amsterdam, The Netherlands, 1998; 707p, ISBN 0-444-89847-6. [Google Scholar]
  84. Song, Y.; Hou, D.; Zhang, J.; O’Connor, D.; Li, G.; Gu, G.; Li, S.; Liu, P. Environmental and socio-economic sustainability appraisal of contaminated land remediation strategies: A case study at a mega-site in China. Sci. Total Environ. 2018, 610–611, 391–401. [Google Scholar] [CrossRef] [PubMed]
  85. Villanueva, V.; Carreno, M.; Gil-Nagel, A.; Serrano-Castro, P.J.; Serratosa, J.M.; Toledo, M.; Alvarez-Baron, E.; Gil, A.; Subías-Labazuy, S. Identifying key unmet needs and value drivers in the treatment of focal-onset seizures (FOS) in patients with drug-resistant epilepsy (DRE) in Spain through multi-criteria decision analysis (MCDA). Epilepsy Behav. 2021, 22, 108222. [Google Scholar] [CrossRef]
  86. Murcia, N.N.S.; Ferreira, F.A.F.; Ferreira, J.J.M. Enhancing strategic management using a “quantified VRIO”: Adding value with the MCDA approach. Technol. Forecast. Soc. Change 2022, 174, 121251. [Google Scholar] [CrossRef]
  87. Lemming, G.; Hauschild, M.Z.; Bjerg, P.L. Life cycle assessment of soil and groundwater remediation technologies: Literature review. Int. J. LCA 2012, 15, 115–127. [Google Scholar] [CrossRef]
  88. Favara, P.; Skance, O. Overview of LCAs as applied to remediation projects. Encyclop. Sustain. Technol. 2017, 1, 329–337. [Google Scholar] [CrossRef]
  89. Cucek, L.; Klemes, J.J.; Kravanja, Z. A review of footprint analysis tools for monitoring impacts on sustainability. J. Clean. Prod. 2012, 34, 9–20. [Google Scholar] [CrossRef]
  90. Bulle, C.; Margni, M.; Patouillard, L.; Boulay, A.M.; Bourgault, G.; de Bruille, V.; Cao, V.; Hauschild, M.; Henderson, A.; Humbert, S.; et al. IMPACT world þ: A globally regionalized life cycle impact assessment method. Int. J. Life Cycle Assess. 2019, 24, 1653–1674. [Google Scholar] [CrossRef]
  91. Huijbregts, M.A.J.; Steinmann, Z.J.N.; Elshout, P.M.F.; Stam, G.; Verones, F.; Vieira, M.; Zijp, M.; Hollander, A.; van Zelm, R. Recipe2016: A harmonised life cycle impact assessment method at midpoint and endpoint level. Int. J. Life Cycle Assess. 2017, 22, 138–147. [Google Scholar] [CrossRef]
  92. Itsubo, N.; Sakagami, M.; Kuriyama, K.; Inaba, A. Statistical analysis for the development of national average weighting factors—Visualization of the variability between each individual’s environmental thoughts. Int. J. Life Cycle Assess. 2012, 17, 488–498. [Google Scholar] [CrossRef]
  93. Corominas, L.; Foley, J.; Guest, J.S.; Hospido, A.; Larsen, H.F.; Morera, S.; Shaw, A. Life cycle assessment applied to wastewater treatment: State of the art. Water Res. 2013, 47, 5480–5492. [Google Scholar] [CrossRef] [PubMed]
  94. Sabeen, A.H.; Noor, Z.Z.; Ngadi, N.; Almuraisy, S.; Raheem, A.B. Quantification of environmental impacts of domestic wastewater treatment using life cycle assessment: A review. J. Clean. Prod. 2018, 190, 221–233. [Google Scholar] [CrossRef]
  95. Gallego-Schmid, A.; Tarpani, R.R.Z. Life cycle assessment of wastewater treatment in developing countries: A review. Water Res. 2019, 153, 63–79. [Google Scholar] [CrossRef]
  96. Lorenzo-Toja, Y.; Vázquez-Rowe, I.; Amores, M.J.; Termes-Rifé, M.; Marín-Navarro, D.; Moreira, M.T.; Feijoo, G. Benchmarking wastewater treatment plants under an eco-efficiency perspective. Sci. Total Environ. 2016, 567, 468–479. [Google Scholar] [CrossRef]
  97. Lorenzo-Toja, Y.; Vázquez-Rowe, I.; Marín-Navarro, D.; Crujeiras, R.M.; Moreira, M.T.; Feijoo, G. Dynamic environmental efficiency assessment for wastewater treatment plants. Int. J. Life Cycle Assess. 2018, 23, 357–367. [Google Scholar] [CrossRef]
  98. Meile, C.; Porubsky, W.P.; Walker, R.L.; Payne, K. Natural attenuation of nitrogen loading from septic efuents: Spatial and environmental controls. Water Res. 2010, 44, 1399–1408. [Google Scholar] [CrossRef] [PubMed]
  99. Wilcox, J.D.; Gotkowitz, M.B.; Bradbury, K.R. Using groundwater model to evaluate strategies for drinking-water protection in rural subdivisions. J. Am. Plan. Assoc. 2010, 76, 295–304. [Google Scholar] [CrossRef]
  100. Richards, S.; Paterson, E.; Withers, P.J.A.; Stutter, M. Septic tanks discharges as multi-pollutant hotspot in catchments. Sci. Total Environ. 2016, 542, 854–863. [Google Scholar] [CrossRef]
  101. Schaider, L.A.; Ackerman, J.M.; Rudel, R.A. Septic systems as sources of organic wastewater compounds in domestic drinking water wells in a shallow sand and gravel aquifer. Sci. Total Environ. 2016, 547, 470–481. [Google Scholar] [CrossRef]
  102. Opher, T.; Friedler, E. Comparative LCA of decentralized wastewater treatment alternatives for non-potable urban reuse. J. Environ. Manag. 2016, 182, 464–476. [Google Scholar] [CrossRef] [PubMed]
  103. Sharma, A.K.; Tjandraatmadja, G.; Grant, A.L.; Grant, T.; Pamminger, F. Sustainable sewerage servicing options for peri-urban areas with failing septic systems. Water Sci. Technol. 2010, 62, 570–585. [Google Scholar] [CrossRef]
  104. Fuchs, V.J.; Mihelcic, J.R.; Gierke, J.S. Life cycle assessment of vertical and horizontal fow constructed wetlands for wastewater treatment considering nitrogen and carbon greenhouse gas emissions. Water Res. 2011, 45, 2073–2081. [Google Scholar] [CrossRef]
  105. Garfi, M.; Flores, L.; Ferrer, I. Life Cycle Assessment of wastewater treatment systems for small communities: Activated sludge, constructed wetlands and high rate algal ponds. J. Clean. Prod. 2017, 161, 211–219. [Google Scholar] [CrossRef]
  106. Morera, S.; Corominas, L.; Rigola, M.; Poch, M.; Comas, J. Using a detailed inventory of a large wastewater treatment plant to estimate the relative importance of construction to the overall environmental impacts. Water Res. 2017, 122, 614–623. [Google Scholar] [CrossRef] [PubMed]
  107. Limphitakphong, N.; Pharino, C.; Kanchanapiya, P. Environmental impact assessment of centralized municipal wastewater management in Thailand. Int. J. Life Cycle Assess. 2016, 21, 1789–1798. [Google Scholar] [CrossRef]
  108. Mishima, I.; Yoshikawa, N.; Asakawa, S.; Noguchi, Y.; Amano, K. Life-cycle analysis of environmental loads from household septic systems in Japan focusing on effluent water discharge. Water Sci. Technol. 2023, 88, 2719–2732. [Google Scholar] [CrossRef] [PubMed]
  109. Song, Y.; Kirkwood, N.; Maksimovic, C.; Zheng, X.; O’Connor, D.; Jin, Y.; Hou, D. Nature based solutions for contaminated land remediation and brownfield redevelopment in cities: A review. Sci. Total Environ. 2019, 663, 568–579. [Google Scholar] [CrossRef] [PubMed]
  110. Ghosh, D.; Maiti, S.K. Biochar assisted phytoremediation and biomass disposal in heavy metal contaminated mine soils: A review. Int. J. Phytoremediation 2021, 23, 559–576. [Google Scholar] [CrossRef]
  111. Alshehri, K.; Gao, Z.; Harbottle, M.; Sapsford, D.; Cleall, P. Life cycle assessment and cost-benefit analysis of nature-based solutions for contaminated land remediation: A mini-review. Heliyon 2023, 10, 20632. [Google Scholar] [CrossRef]
  112. Alshehri, K.; Harbottle, M.; Sapsford, D.; Beames, A.; Cleall, P. Integration of ecosystem services and life cycle assessment allows improved accounting of sustainability benefits of nature-based solutions for brownfield redevelopment. J. Clean. Prod. 2023, 143, 137352. [Google Scholar] [CrossRef]
  113. Hou, D.; Al-Tabbaa, A.; O’Connor, D.; Hu, Q.; Zhu, Y.-G.; Wang, L.; Kirkwood, N.; Ok, Y.S.; Tsang, D.C.W.; Bolan, N.S.; et al. Sustainable remediation and redevelopment of brownfield sites. Nat. Rev. Earth Environ. 2023, 4, 271–286. [Google Scholar] [CrossRef]
  114. Mayer, B.K.; Baker, L.A.; Boyer, T.H.; Drechsel, P.; Gifford, M.; Hanjra, M.A.; Parameswaran, P.; Stoltzfus, J.; Westerhoff, P.; Rittmann, B.E. Total Value of Phosphorus Recovery. Environ. Sci. Technol. 2015, 50, 6606–6620. [Google Scholar] [CrossRef] [PubMed]
  115. Meneses, M.; Concepción, H.; Vrecko, D.; Vilanova, R. Life Cycle Assessment as an environmental evaluation tool for control strategies in wastewater treatment plants. J. Clean. Prod. 2015, 107, 653–661. [Google Scholar] [CrossRef]
  116. Hauck, M.; Maalcke-Luesken, F.A.; Jetten, M.S.; Huijbregts, M.A. Removing nitrogen from wastewater with side stream anammox: What are the trade-offs between environmental impacts? Resour. Conserv. Recycl. 2016, 107, 212–219. [Google Scholar] [CrossRef]
  117. Cappuyns, V. LCA based evaluation of site remediation: Opportunities and limitations. Chem. Today 2013, 31, 18–21. [Google Scholar]
  118. AF Center for Engineering and the Environment Sustainable Remediation Tool. Version 2.2 User Guide. September 2011. Available online: https://www.enviro.wiki/images/5/5a/AFCEE-2011.SRTUserGuide.pdf (accessed on 15 July 2024).
  119. ESTCP. Quantifying Life-Cycle Environmental Footprints of Soil and Groundwater Remedies Estcp Project# ER-201127 July 2013. Prepared by Naval Facilities Engineering and Expeditionary Warfare Center and Tetra Tech. Available online: https://sepub-prod-0001-124733793621-us-gov-west-1.s3.us-gov-west-1.amazonaws.com/s3fs-public/project_documents/ER-201127-FR.pdf?VersionId=_g06YLpwX0p_HRZ2TjfvWAPTG8mwvXkR (accessed on 15 July 2024).
  120. Mohan, D. Screening with LNAPL-Weathering Code RT3D-OW and CO2 Tauw Rekentool. Master of Science Final Thesis, Utrecht University, Utrecht, The Netherlands, 2009. [Google Scholar]
  121. Praamstra, T. Carbon footprint of soil remediation. In Proceedings of the Green Remediation Conference, Copenhagen, Denmark, 9–10 November 2009; Available online: http://www.eugris.info/newsdownloads/GreenRemediation/proc_decision_support.htm (accessed on 15 July 2024).
  122. Amponsah, N.Y.; Wang, J.; Zhao, L. A review of life cycle greenhouse gas (GHG) emissions of commonly used ex-situ soil treatment technologies. J. Clean. Prod. 2018, 186, 514–525. [Google Scholar] [CrossRef]
  123. Ashkanani, Z.; Mohtar, R.; Al-Enezi, S.; Smith, P.K.; Calabrese, S.; Ma, X.; Abdullah, M. AI-assisted systematic review on remediation of contaminated soils with PAHs and heavy metals. J. Hazard. Mater. 2024, 468, 133813. [Google Scholar] [CrossRef]
  124. Achillas, C.; Moussiopoulos, N.; Karagiannidis, A.; Banias, G.; Perkoulidis, G. The use of multi-criteria decision analysis to tackle waste management problems: A literature review. Waste Manag. Res. 2013, 31, 115–129. [Google Scholar] [CrossRef]
  125. Guo, S.; Zhao, H.R. Optimal site selection of electric vehicle charging station by using fuzzy TOPSIS based on sustainability perspective. Appl. Energy 2015, 158, 390–402. [Google Scholar] [CrossRef]
  126. Zheng, H.Z. Design and Implementation of Web GIS-Based Decision-Making Assistance System for Remediation of Contaminated Sites; Yantai Institute of Coastal Zone Research Chinese Academy of Sciences: Yantai, China, 2018. [Google Scholar]
  127. Zheng, Z.J.; Lin, M.Y.; Chiueh, P.T.; Lo, S.L. Framework for determining optimal strategy for sustainable remediation of contaminated sediment: A case study in northern Taiwan. Sci. Total Environ. 2019, 654, 822–831. [Google Scholar] [CrossRef] [PubMed]
  128. Fan, L.H.; Hong, L.; Jiang, C.Y.; Li, Y. Assessment system of POPs contaminated site remediation technology based on PROMETHEE II. Environ. Eng. 2014, 32, 172–176. [Google Scholar]
  129. Chen, R.H.; Teng, Y.G.; Chen, H.Y.; Yue, W.; Su, X.; Liu, Y.; Zhang, Q. A coupled optimization of groundwater remediation alternatives screening under health risk assessment: An application to a petroleum-contaminated site in a typical cold industrial region in northeastern China. J. Hazard. Mater. 2021, 407, 124796. [Google Scholar] [CrossRef]
  130. Fernandes, A.C.P.; Terencio, D.P.S.; Pacheco, F.A.L.; Fernandes, L.F.S. A combined GIS-MCDA approach to prioritize stream water quality interventions, based on the contamination risk and intervention complexity. Sci. Total Environ. 2021, 798, 149322. [Google Scholar] [CrossRef] [PubMed]
  131. Yang, A.L.; Huang, G.H.; Qin, X.S.; Fan, Y.R. Evaluation of remedial options for a benzene-contaminated site through a simulation-based fuzzy-MCDA approach. J. Hazard. Mater. 2012, 213–214, 421–433. [Google Scholar] [CrossRef] [PubMed]
  132. Xia, L.; Wei, J.; Gao, S.; Ma, B. Promoting corporate sustainability through sustainable resource management: A hybrid decision-making approach incorporating social media data. Environ. Impact Assess. Rev. 2020, 85, 106459. [Google Scholar] [CrossRef]
  133. Balenzentis, T.; Streimikiene, D.; Siksnelyte-Butkiene, I. Energy storage selection for sustainable energy development: The multi-criteria utility analysis based on the ideal solutions and integer geometric programming for coordination degree. Environ. Impact Assess. Rev. 2021, 91, 106675. [Google Scholar] [CrossRef]
  134. Hooshangi, N.; Gharakhanlou, N.M.; Razin, S.R.G. Evaluation of potential sites in Iran to localize solar farms using a GIS-based Fermatean fuzzy TOPSIS. J. Clean. Prod. 2023, 384, 135481. [Google Scholar] [CrossRef]
  135. Li, X.; Yi, S.; Chen, W.; Cundy, A.B. Application of a novel multi-criteria decision analysis approach for evaluating the sustainability of contaminated site management: An example from China. Environ. Impact Assess. Rev. 2024, 104, 107327. [Google Scholar] [CrossRef]
  136. E2893—16-1; ASTM Standard Guide for Greener Cleanups. ASTM: Montgomery, PA, USA, 2016.
  137. Sánchez, M.A. Integrating sustainability issues into project management. J. Clean. Prod. 2015, 96, 319–330. [Google Scholar] [CrossRef]
  138. Silvius, A.J.G.; Marnewick, C. Interlinking sustainability in organizational strategy, project portfolio management and project management: A conceptual framework. Procedia Comput. Sci. 2022, 196, 938–947. [Google Scholar] [CrossRef]
  139. Aghajani, M.; Ruge, G.; Jugdev, K. An integrative review of project portfolio management literature: Thematic findings on sustainability mindset, assessment, and integration. Proj. Manag. J. 2023, 54, 629–650. [Google Scholar] [CrossRef]
  140. Schipper, R.P.J.; Silvius, A.J.G. Towards a conceptual framework for sustainable project portfolio management. Int. J. Proj. Organ. Manag. 2018, 10, 191–221. [Google Scholar] [CrossRef]
  141. Martinsuo, M.; Geraldi, J. Management of project portfolios: Relationships of project portfolios with their contexts. Int. J. Proj. Manag. 2020, 38, 441–453. [Google Scholar] [CrossRef]
  142. Sabini, L.; Muzio, D.; Alderman, N. 25 years of ‘sustainable projects:’ What we know and what the literature says. Int. J. Proj. Manag. 2019, 37, 820–838. [Google Scholar] [CrossRef]
  143. Al Nahyan, M.T.; Hawas, Y.E.; Sherif, M.; Basheerudeen, B. A fuzzy-based decision-support system for the analysis of suitability of megaproject delivery methods. J. Mod. Proj. Manag. 2019, 7, 121–137. [Google Scholar]
Figure 1. Carbon footprint (CFP) (kg CO2e) of different solid waste management (SWM) treatment technologies (data from Hong et al. [1]).
Sustainability 16 07156 g001
Figure 2. Carbon footprint (CFP) (kg CO2e/functional unit) of the system of wastewater treatment (WWT) in a city with over 50,000 inhabitants (data from Zawartka et al. [10]).
Sustainability 16 07156 g002
Figure 3. Carbon footprint (CFP) (kg CO2e) of different contaminated soil remediation (CSR) technologies (data from Vocciante et al. [11]).
Sustainability 16 07156 g003
Figure 4. Carbon footprint (CFP) and economic costs of different medical waste disposal scenarios (data from Hong et al. [1]).
Sustainability 16 07156 g004
Figure 5. Environmental impact of greenhouse gas (GHG) emissions in the operation stage for four septic tanks: (A) total emissions; (B) total emissions distribution for the standard structure; (C) GHG % during sludge treatments; (D) GHG % of direct emissions; and (E) GHG % due to electricity (data from Mishima et al. [108]).
Sustainability 16 07156 g005
Figure 6. (A) Carbon footprint (CFP) Index, (B) Life Cycle Assessment (LCA) Impact Index, and (C) Economic Cost Impact Analysisi (LCCA) of thirteen (13) distinct soil remediation technologies for heavy polyaromatic hydrocarbon (PAH)-contaminated soils (data from Ashkanani et al. [123]).
Sustainability 16 07156 g006aSustainability 16 07156 g006b
Figure 7. Evaluation criteria for smart and sustainable SWM strategies in a smart city.
Sustainability 16 07156 g007
Figure 8. Best Management Practice (BMP) indices.
Sustainability 16 07156 g008
Figure 9. Sustainability score of remedial sites in China (data from Li et al. [135]).
Sustainability 16 07156 g009
Figure 10. Optimal contractual delivery method indicators.
Sustainability 16 07156 g010
Table 1. Examples of the use of digital technologies to help decision making and decarbonization in environmental management.
Digital TechnologyPurposeContribution to Decision Making and/or Decarbonation (Global Warming Potential Calculations)References
Solid Waste Management (SWM)
IoT and AIReview of the available digital technologies for applications in municipal waste management; assisting in the separation, collection, transportation, and disposal of waste. Decision making; optimizing waste collection routes; providing efficient collection schedules; estimating waste volumesHannan et al. [12]
IoT, AIEstimate the amount of waste collected in waste bins; system design. Decision making; optimizing the distance between bins to enhance waste collection efficiencyKhoa et al. [13]
IoT, blockchain Create a framework for improving the management of hospital waste and wastewater; system design.Decision making; optimizing operations in waste processingKassou et al. [14]
IoTDesign a data-driven analytical framework to analyze household waste-dumping behavior.Decision making; facilitating policy regulations by using the IoT and data mining technologiesJiang et al. [15]
Computing system based IoTSystem design for air quality monitoring system, using fog computing-based IoT. Decision making; evaluating the effectiveness of the air monitoring systemSenthilkumar et al. [16]
AIDesign a smart waste management system using LoRa communication protocol (transmitting the sensor’s data) and TensorFlow-based deep learning model (performing real-time object detection and classification).Decision making; detection and classification of wastes in smart collection binsSheng et al. [17]
IoT, mobile applications, GPSSystem design for smart management of e-waste. Decision making; optimizing e-waste collection routingKang et al. [18]
IoT, RFID, GIS, GPSDesign of a smart waste collection and transportation system based on IoT and multi-criteria decision making.Decision making; smart waste collection systemSeker [19]
IoT, Convolutional Neural Network (CNN)System design; deep learning for detection and classification of medical waste. Decision making; enhancing the ease, accuracy, and efficiency of medical waste sorting and recycling processes; reducing the risk of occupational exposure for workers in medical waste facilitiesZhou et al. [20]
IoT, DSSSystem design for management of landfill leachate. Decision making; optimization of landfill leachate monitoring Gopikumar et al. [21]
IoT, DSSSystem design for landfill biogas monitoring.Decision making; enhancing the decision to remediate once the level of biogases exceeded the environmental normsMabrouki et al. [22]
Wastewater Treatment (WWT)
ML, CNN, LSTMPredicting process parameters; enhancing material performance; optimizing energy utilization.Optimize operations in waste treatment facilities
Decision making process
Li et al. [23]
CNN, Near IRSystem design for monitoring of water quality.Decision making; providing smart technical support in dealing with the issues of water recycling and conservation for agricultural cultivationChen et al. [24]
CCA-RNNSystem design; monitoring of nitrogen in WWT plants. Decision making; predicting the changes in total nitrogen to enhance remedial strategies in WWT processesGeng et al. [25]
LSTM-NNPredicting the rate of removal of total phosphorus, ammonia nitrogen, and total nitrogen in a membrane bioreactor.Decision making; predicting the nutrient removal efficiency of the anaerobic–anoxic–oxic membrane bioreactor system in real-time; aiding in establishing process control strategiesYaqub et al. [26]
IoT based on LSTMSystem design; monitoring key performance parameters of the two-stage anaerobic–oxic processes.Decision making; predicting key performance parameters of two-stage anaerobic–oxic processesXu et al. [27]
LSTM-NNSystem design; developing deep learning models based on Long Short-Term Memory (LSTM) neural networks (NNs) to detect time-delayed water quality indexes (WQIs) in WWT plants’ intake.Decision making; achieving fast feedback regulation of WWT plants that enables its energy-efficient operation and high tolerance towards shock sewage loadsZhang et al. [28]
Art-ICA controllersSystem design; operation control; performance evaluation; energy consumption; GHG emission monitoring.Decision making; facilitating the selection of the appropriate operational strategy and the design of automatic controllers, saving up to 20% of energy consumption and hence reducing the GWPs[29,30,31,32]
Art-ICA controllersSystem design; implementing SCADA (Supervisory Control and Data Acquisition) system and automation system; monitoring biological nutrient removal.Decision making; reducing the costs of maintenance, increasing energy efficiency; improving the quality of discharged wastewater[29,33]
SCADASystem design; reducing maintenance cost; increasing energy efficiency.Decision making; compliance with reject water quality standardsMoldovan and Nuca [33]
IoT, GSM, SMSSystem design; remote sensing device for the detection and monitoring of sewage levels in underground onsite septic tank. Decision making; prevention of sewage overflowOduah and Ogunye [34]
N2ORisk-DSS, AL, MLSystem design; using AI, expert knowledge on N2O, and ML to diagnose the WWT process and N2O emissions.Decision making; proposing mitigation actions, ultimately eliminating N2O; reducing the overall GHG emissions by about 57%Porro [35]
IoT, GSMSystem design; water quality monitoring system using IoT and GSM; calculating the water quality index. Decision making; alerting system in case of an emergency; enhancing system efficiency; regulatory complianceKhan et al. [36]
IoT, ANNSystem design; predicting the permeation flux and fouling resistance using IoT and ANN.Decision making; optimizing the operating and processing conditionsSoleimani et al. [37]
AI System design; energy and material-saving management system using deep learning of real-world business data resulting in a total cost and energy saving of 10–15%.Decision making; efficient optimal management and decision mechanism to reasonably configure resource of energy and materials, optimizing energy consumption and associated costsWang et al. [38]
MLSystem design; an ML model for incinerating sewerage sludge, resulting in about 6% savings in the total amount of energy required for incineration unit of sewerage sludge disposal plant.Decision making; system optimizationAdibimanesh et al. [39]
VSL control systemSystem design; aeration intelligent control in WWT plants, resulting in an increase in system efficiency of about 16.12% compared to conventional aeration system.Decision making; controlling air demand in aeration tanks; improving efficiency; reducing energy consumptionWang et al. [40]
Contaminated Soil Remediation (CSR)
IoT, AISystem design; monitoring of pollutants in any environmental settings, providing real-time, on-ground detection of potentially dangerous substances and the location of the incident sites.Decision making; improving monitoring and detection of pollutants; allowing for proactive mitigation measures; protecting public health and the environmentPopescu et al. [41]
IoT, AISystem design; mapping of subsurface pollutants; pollutant site management.Decision making; sensing of subsurface soil and groundwater pollutants to satisfy relevant regulatory criteria; mapping subsurface processes spatially and temporally; providing continuous estimates of degradation rates for management decisionsDavis et al. [42,43]
unmanned surface vehicle (USV), IoT System design; a well-structured technique to collect the quality parameters, especially chemical indicators, and generate characteristic maps for each parameter about the particular water body under survey.Decision making; pollution prevention; improving water quality monitoring efficiency; minimizing water pollutionVasudevan and Baskaran [44]
TDR, MLSystem design; monitoring subsurface pollutants and moisture.Decision making; pollution prevention; minimizing environmental pollution hazards; pollution site managementMohamed [45,46,47,48,49,50,51,52]
IoT, MLSystem design; monitoring of pollutants during pump and treat remediationDecision making; pollution prevention; pollution mitigation measures Sivavec et al. [53]
Table 2. Ranking of the thirteen (13) distinct soil remediation technologies for heavy polyaromatic hydrocarbon (PAH)-contaminated soils; [L = low; VL = very low; M = medium; H = high; VH = very high] (data from Ashkanani et al. [123]).
Remediation ApproachResource ConsumptionCO2 EmissionsToxicityWasteEnergy ConsumptionCarbon FootprintCost Planning & ConstructionInitial Capital CostOngoing Operating CostOverall Impact
Excavation + off site treatmentVLVLVLVHLVLLLHVL-L
Soil Vapour Extraction (SVE)LVLLVLLVlVLVHVHL
Chemical Oxidation (S-ISCO)LVLLLLVLLMLL
Thermal Desorption (ISTD)VHHVHHVHVHVHVHVHH-VH
Sheet Pile WallLVLVLVLVLVLVLVLVLVL-L
Pumping (P)LMMMHMVLVLLL-M
Dual Phase Extraction (DPE)LVLLLLVLVLVHHL
Stimulation Reductive Dechlorination process (SRD)VLVLVLVLLVLLVLVHVL-L
Soil Mixing with micro-Scale ZVIVLLLVLLLLHLVL-L
Natural Attenuation (NA)VLVLVLVLVLVLVLVLHVL-L
Passive Soil Vapor Extraction (PSVE)VLVLVLVLVLVLVLVHVHVL-L
Steam Enhanced ExtractionHVHVLHVLVHHVHVHM-H
Thermal Resistivity—ERHHHHHHHVHVHVHM-H
Disclaimer/Publisher’s Note: The statements, opinions and data contained in all publications are solely those of the individual author(s) and contributor(s) and not of MDPI and/or the editor(s). MDPI and/or the editor(s) disclaim responsibility for any injury to people or property resulting from any ideas, methods, instructions or products referred to in the content.

