Article

Assessing the Effectiveness of Large-Scale Ecological Restoration Measures in the Liaohe Estuary Using a Landscape Pattern Perspective

by
Xiuzhong Li
1,*,
Baocun Ji
2,
Na Li
2,
Qiuying Chen
1,
Christopher J. Anderson
3 and
Yuexuan Wang
1
1
School of Chemical Safety, North China Institute of Science and Technology, Langfang 065201, China
2
Beijing Ougeng Ecological Agriculture and Forestry Technology Co., Ltd., Beijing 101101, China
3
College of Forestry, Wildlife and Environment, Auburn University, Auburn, AL 36830, USA
*
Author to whom correspondence should be addressed.
Sustainability 2024, 16(16), 7151; https://doi.org/10.3390/su16167151
Submission received: 26 June 2024 / Revised: 14 August 2024 / Accepted: 16 August 2024 / Published: 20 August 2024
(This article belongs to the Section Sustainable Management)

Abstract

:
In recent years, the Chinese government implemented many policies and actions to restore coastal wetlands. This study focused on assessing how these projects have influenced the landscape patterns of the Liaohe Estuary, an area of critical importance. By analyzing remote sensing images from 2009 to 2022, we determined the spatiotemporal changes in landscape pattern, fragmentation, and conversion. Results showed that (1) Reed (Phragmites australis) fields were the dominant landscape feature and covered 46.3–48.2% of the area; however, road was the serious factor in fragmenting these wetlands. Seepweed (Suaeda salsa) marshes, an iconic and characteristic wetland of the region, gradually expanded towards the estuary and coast over the study years. (2) Landscape fragmentation increased and seasonally changed during the study period and restoration measures actually resulted in more fragmentation of the landscape. (3) Ponds replaced 14.28 km2 natural landscape in the development stage and 40.93 km2 were restored to natural landscape during restoration and maintenance. (4) Active restoration projects caused landscape fragmentation to sharply increase initially, but then fragmentation declined as passive restoration continued in the maintenance stage. This study suggests that road construction should be carefully deliberated in ecologically sensitive areas and that ecological restoration (a combination of active and passive restoration) in the Liaohe Estuary region showed evidence of temporal lag and hysteresis that may be important for research in the future.

1. Introduction

Coastal wetlands are among the most valuable ecosystem types on Earth for a number of reasons [1], including areas of concentrated biodiversity and productivity, maintaining the carbon cycle, and attenuating damage from storms, cyclones, and other natural disasters [2]. Furthermore, coastal wetlands and associated estuaries play an important role in the ecological system to connect land and ocean while providing abundant food, habitats, and nutrients/sediments for animals and associated communities [3,4]. Estuaries are located at places where fresh water and seawater interact. As a result, they usually show significant salinity gradients and deposit substantial loads of sediment to form large delta wetlands. In particular, ecosystem productivity is often very high, due to tidal subsidies received [5]. Coastal areas are under threat, however, with more than one-third of the global population occupying the coastal zone, and intense human activities resulting in coastal ecological lesions, such as erosion, subsidence, salinization, invasive species, and over-exploitation of natural resources. Natural coastal lands have been increasingly and severely lost and degraded by land-use changes, including reclamation, urbanization, and related fragmentation [6]. Estuarine and coastal ecosystems have become some of the most heavily used and threatened natural systems globally [7,8,9]. Since the 1960s, coastal wetland functions and services have been increasingly recognized [2]. Some countries have developed legal and institutional systems for wetland preservation, mitigation, and restoration, to manage and conserve these areas for wise and sustainable use in conformity with international standards such as the Ramsar Convention and others [10].
The coastal zone of China comprises an area of more than three million square kilometers and 18,000 km of coastline stretching across tropical, subtropical, and temperate zones [11]. It is reported that more than 70% of large Chinese cities are located in the coastal zone, and coastal development plays a leading role in the national economy, accounting for 55% of its gross domestic product [12]. In the past decades, the continuing increase in population coupled with economic growth, rapid urbanization, and infrastructure development in Chinese coastal zones have resulted in the degradation of coastal wetlands [13]. The importance of coastal wetlands conservation was not formally recognized by the Chinese government until 1980. Later, China officially joined the Ramsar Convention on Wetlands in 1992. More recently, the National Wetland Conservation Program (2002–2030) was approved by the Chinese government in 2003 and promulgated intensive management and policies that were intended to protect and restore wetlands. Important actions for coastal wetland conservation entered the implementation stage in 2011 [14]. This included establishing 35 national reserves, 16 wetlands of international importance, and 2 UNESCO World Heritage sites along the Chinese coastline by 2022 [15]. A series of measures and policies for the conservation and restoration of coastal wetlands, such as “Blue Bay Renovation Initiative in 2015”, “Southern Mangrove and Northern Chinese Tamarisk in 2016”, “Ecological Islands and Reefs in 2017”, and “Green Shield Action in 2017” were conducted in the thirteenth Five-Year Plan, and achieved some significant restoration benefits during the implementation stage from 2016 to 2020 [16,17]. However, the overall effectiveness of these measures and policies and their spatial reach have not been well documented.
Landscape pattern is one of the best indices that can be used to evaluate environmental quality [18,19,20]. Temporal and spatial changes in landscape patterns can be used to indicate the ecological health before and after restoration in coastal wetlands. The Liaohe Estuary, which is located near Panjin City and the northernmost end of the Chinese coastline, was the first phase of Blue Bay Initiative projects approved by the National Finance Ministry and the National Oceanic Administration [21]. Prior to this effort, this area was experiencing human disturbances such as agricultural expansion, tourism development, aquaculture, and the development of roads and infrastructure. For over a decade, the Blue Bay Initiative included measures such as returning aquaculture to wetlands, restoring ecological islands and reefs, restoring seepweed (Suaeda salsa) marshes, restoring hydrodynamic conditions, and measures to expand benthic animal populations. With the increasing awareness of natural protection in recent years, multiple ecological restoration measures have been implemented in the Liaohe Estuary. However, previous studies paid little attention to the interaction between landscape pattern change and ecological restoration, and even less attention was paid to ecological restoration countermeasures. This study used the Liaohe Estuary region to assess the efficacy of the various measures and policies implemented for Chinese coastal wetlands in recent years before and after restoration (between 2009 and 2022). This period covers the duration of the landscape development and impact, subsequent restoration, and restoration maintenance. We sought to systematically understand the driving factors of land use change, determine the trends and causes leading to the formulation of ecological policies from small regions to large states, and fill the gap in landscape measures that may be created by the government, for determining and advancing more effective ecological restoration. Specifically, the objectives of this study were to (1) examine the temporal and spatial changes in the pattern of the Liaohe Estuary landscape during the development and subsequent restoration and conservation, (2) analyze the change in environmental quality by measuring shifts in landscape fragmentation over time, (3) explore the trajectory of important land covers in the region, and (4) assess the general effectiveness of government policies on the ecological recovery of coastal wetlands in the Liaohe Estuary.

2. Materials and Methods

2.1. Study Area

This study area (121°32′01.32″–122°58′59.76″ E, 40°47′20.68″–41°05′58.33″ N) is located in the Liaohe Estuary National and State Reserve (LENSR) which occupies the northernmost point of Liaodong Bay, abutting the right side of Bohai Bay, in Panjin City, Liaoning Province, Northeast China (Figure 1) [covers approximately 727 km2]. The climatic characteristics are a continental, semi-humid, and monsoon climate with four distinctive seasons, including hot and rainy summer (July and August) and cold and dry winter (January and February). The annual mean temperature is 8.6 °C, annual mean precipitation 631 mm, and estimated annual evapotranspiration is 1548 mm [22,23]. The area experiences semi-diurnal tides with two high and low events per day and seawater freezing in the winter [24]. Many rivers flow into the Liaohe Estuary, with the three largest being the Dalinghe, Liaohe, and Daliaohe, which drain into Liaodong Bay [25,26].
Abundant water resources, flat terrain, and the interaction of seawater and freshwater make for a complex and diverse landscape, including vast and magnificent wetlands covered by monotypic and dominant vegetation species of reeds (Phragmites australis), and seepweed (Suaeda salsa). These communities support abundant fish, shrimp, waterbirds, marine products, and other wildlife [27,28]. Various types of wetlands, coastal environments, and human-dominated land covers occur here, including reed marshes, inter-tidal zones with seepweed, bare inter-tide flats, coastal uplands, shallow embayments, freshwater marshes, swamps, aquaculture ponds, reservoirs, artificial channels, and paddy fields, which provide a diverse mosaic of habitats available to various kinds of biota and constitute a complex coastal ecosystem (Liaohe Estuary National Reserve waterbirds monitoring report for Liaoning Province, 2022).
Over the last two decades, the Liaohe Estuary ecosystem has been seriously degraded, with reed fields being reduced from a pre-disturbed 1000 km2 to 800 km2 in 2014 [27]. The red beach formed by vast seepweed marshes has attracted millions of tourists; however, the deposition of increased sediment and altered hydrodynamic conditions, coupled with the construction of aquaculture ponds, has displaced natural wetlands and disrupted their hydrological connectivity [29]. Further, soil salinity increased in the intertidal zones because of freshwater decreases and increased elevation of intertidal flats [30]. Finally, large amounts of waste and oil sewage from nearby oil exploitation platforms led to further environmental deterioration [31]. Cumulatively, 85% of the natural wetlands in Liaodong Bay were eventually transformed into aquaculture ponds, cultivated land, and urban areas over the past 40 years [32].
With the improving awareness of environmental conservation, the thirteenth Five-Year Plan for National Economic and Social Development of China included the construction of Marine Ecological Civilization in 2015 [33]. Liaohe Estuary, as an important estuary ecological reserve in the north of China, became an important site for central and local governments to implement a series of conservation measures and policies. For instance, the Blue Bay Initiative stipulated aquaculture ponds being returned to natural wetlands from 2015 to 2019, seepweed revegetation projects occurred from 2015 to 2017, tidal creek dredging occurred from 2016 to 2018, and various efforts for benthic animal proliferation were made in 2019. The Green Shield Action created mandates for natural coastal land protection by removing illegal facilities between 2019 and 2020 [34,35,36]. Collectively, the coastal zone of the Liaohe Estuary experienced three important phases: degradation from urban and aquaculture development (2009–2015), first-phase restoration (2016–2018), second-phase restoration (2019–2020), and environmental maintenance (2021–2022) over a 14-year period.

2.2. Remote-Sensing Image Acquisition and Pretreatment

We downloaded the 30 m resolution remote sensing images from the official website of the United States Geological Survey (USGS, https://www.usgs.gov, accessed on 25 September 2023) for the Liaohe Estuary study area (Figure 1). Remote sensing images represented a total of 28 seasons (14 springs and 14 autumns) with less than 5% cloud cover in every spring (15 May–15 June) and autumn (5 September–5 October) during 2009–2022. Images were selected to clearly identify different types of land-use and land cover. Imagery sources included Landsat-7 for 2009–2012, Landsat-8 for 2013–2020, and Landsat-9 for 2021–2022. We used the masking and statistical functions to repair the bad tracks for each Landsat-7 image in ArcGIS 10.8 software [37] and corrected the atmosphere and radiometry for all of the images in ENVI 5.3 software [38].

2.3. Different Types of Land Use Classification

All remote sensing images were delineated and outlined by the visual interpretation method [39] based on different bands synthesized to distinguish water surface, different vegetation, bare ground, and aquaculture ponds. Some unclear and uncertain areas in the images were verified by interviewing experienced local staff and with further field surveys to correctly identify areas. Based on these analyses, we classified land cover information and identified nine landscape types including facility (urban infrastructure), road, aquaculture pond, open water, seepweed, reed field, paddy, bare mudflat, and bare intertidal zone (Table 1). Then, the vector files formed by different-colored landscape polygons were transformed to raster images and saved as TIF files in ArcGIS 10.8 for further analyses.

2.4. Statistical Analysis

2.4.1. Spatiotemporal Changes in the Landscape

To evaluate spatiotemporal changes, the areas of the nine landscape classes were summed using ArcGIS 10.8 software for the 28 seasons. Landscape metrics included percentage of landscape (PLAND) and path class area (CA). Furthermore, the change extent of every landscape class (CELC) was calculated by the area of each landscape class in the 28 seasons minus the minimum value among them, in order to more clearly show the changes in each landscape class during the study period. Next, spatial changes in the landscape pattern were examined to show the different land-use and land-cover migration and transition every spring and autumn in the key years between 2009 and 2022, particularly, 2009, 2015, 2018, 2020, and 2022, which coincided with the important phases of the Blue Bay Initiative.

2.4.2. Landscape Fragmentation Changes

The 28 raster files in TIF format were imported into the Fragstats 4.2 software, to analyze and calculate the drivers of landscape fragmentation change in landscape and class levels, separately [40]. The different landscape area variables were used to calculate Shannon’s diversity index [41]. Nine indices at the landscape level were chosen, including the number of patches (NPs), patch density (PD), edge density (ED), largest patch index (LPI), largest shape index (LSI), contagious index (CONTAG), shape standard deviation (Shape_SD), Shannon’s diversity index (SHDI), and Simpson’s diversity index (SIDI). Simple regressions were calculated (linear fit formulas and R-square values) to more clearly represent changing trends and strengths between different indices over time. Similarly, NPs, LPI, PD, ED, and LSI were also calculated at the class level.

2.4.3. Flows between the Different Landscape Patterns

Sankey diagrams are used to efficiently and elegantly present information on land cover persistence and change over multiple time intervals [42]. They are often used to analyze energy or material flows, with arrows representing flow directions and the width of the arrow representing the magnitude of the flow [43]. Thus, a Sankey diagram was made to examine the transition among the different landscape patterns between the five key years of 2009, 2015, 2018, 2020, and 2022. First, the vector diagrams in the spring and autumn of the five key years were uploaded and dissolved using ArcGIS 10.8. Second, the landscape transition data were calculated using the intersection tool between the adjacent key years in spring and autumn, separately. The changed polygons and their area were extracted and the unchanged polygons were deleted. Then, the organized data of the changed polygon’s area were imported into the Origin 2021 to create the Sankey diagram, which is useful for examining the landscape transitions.

3. Results

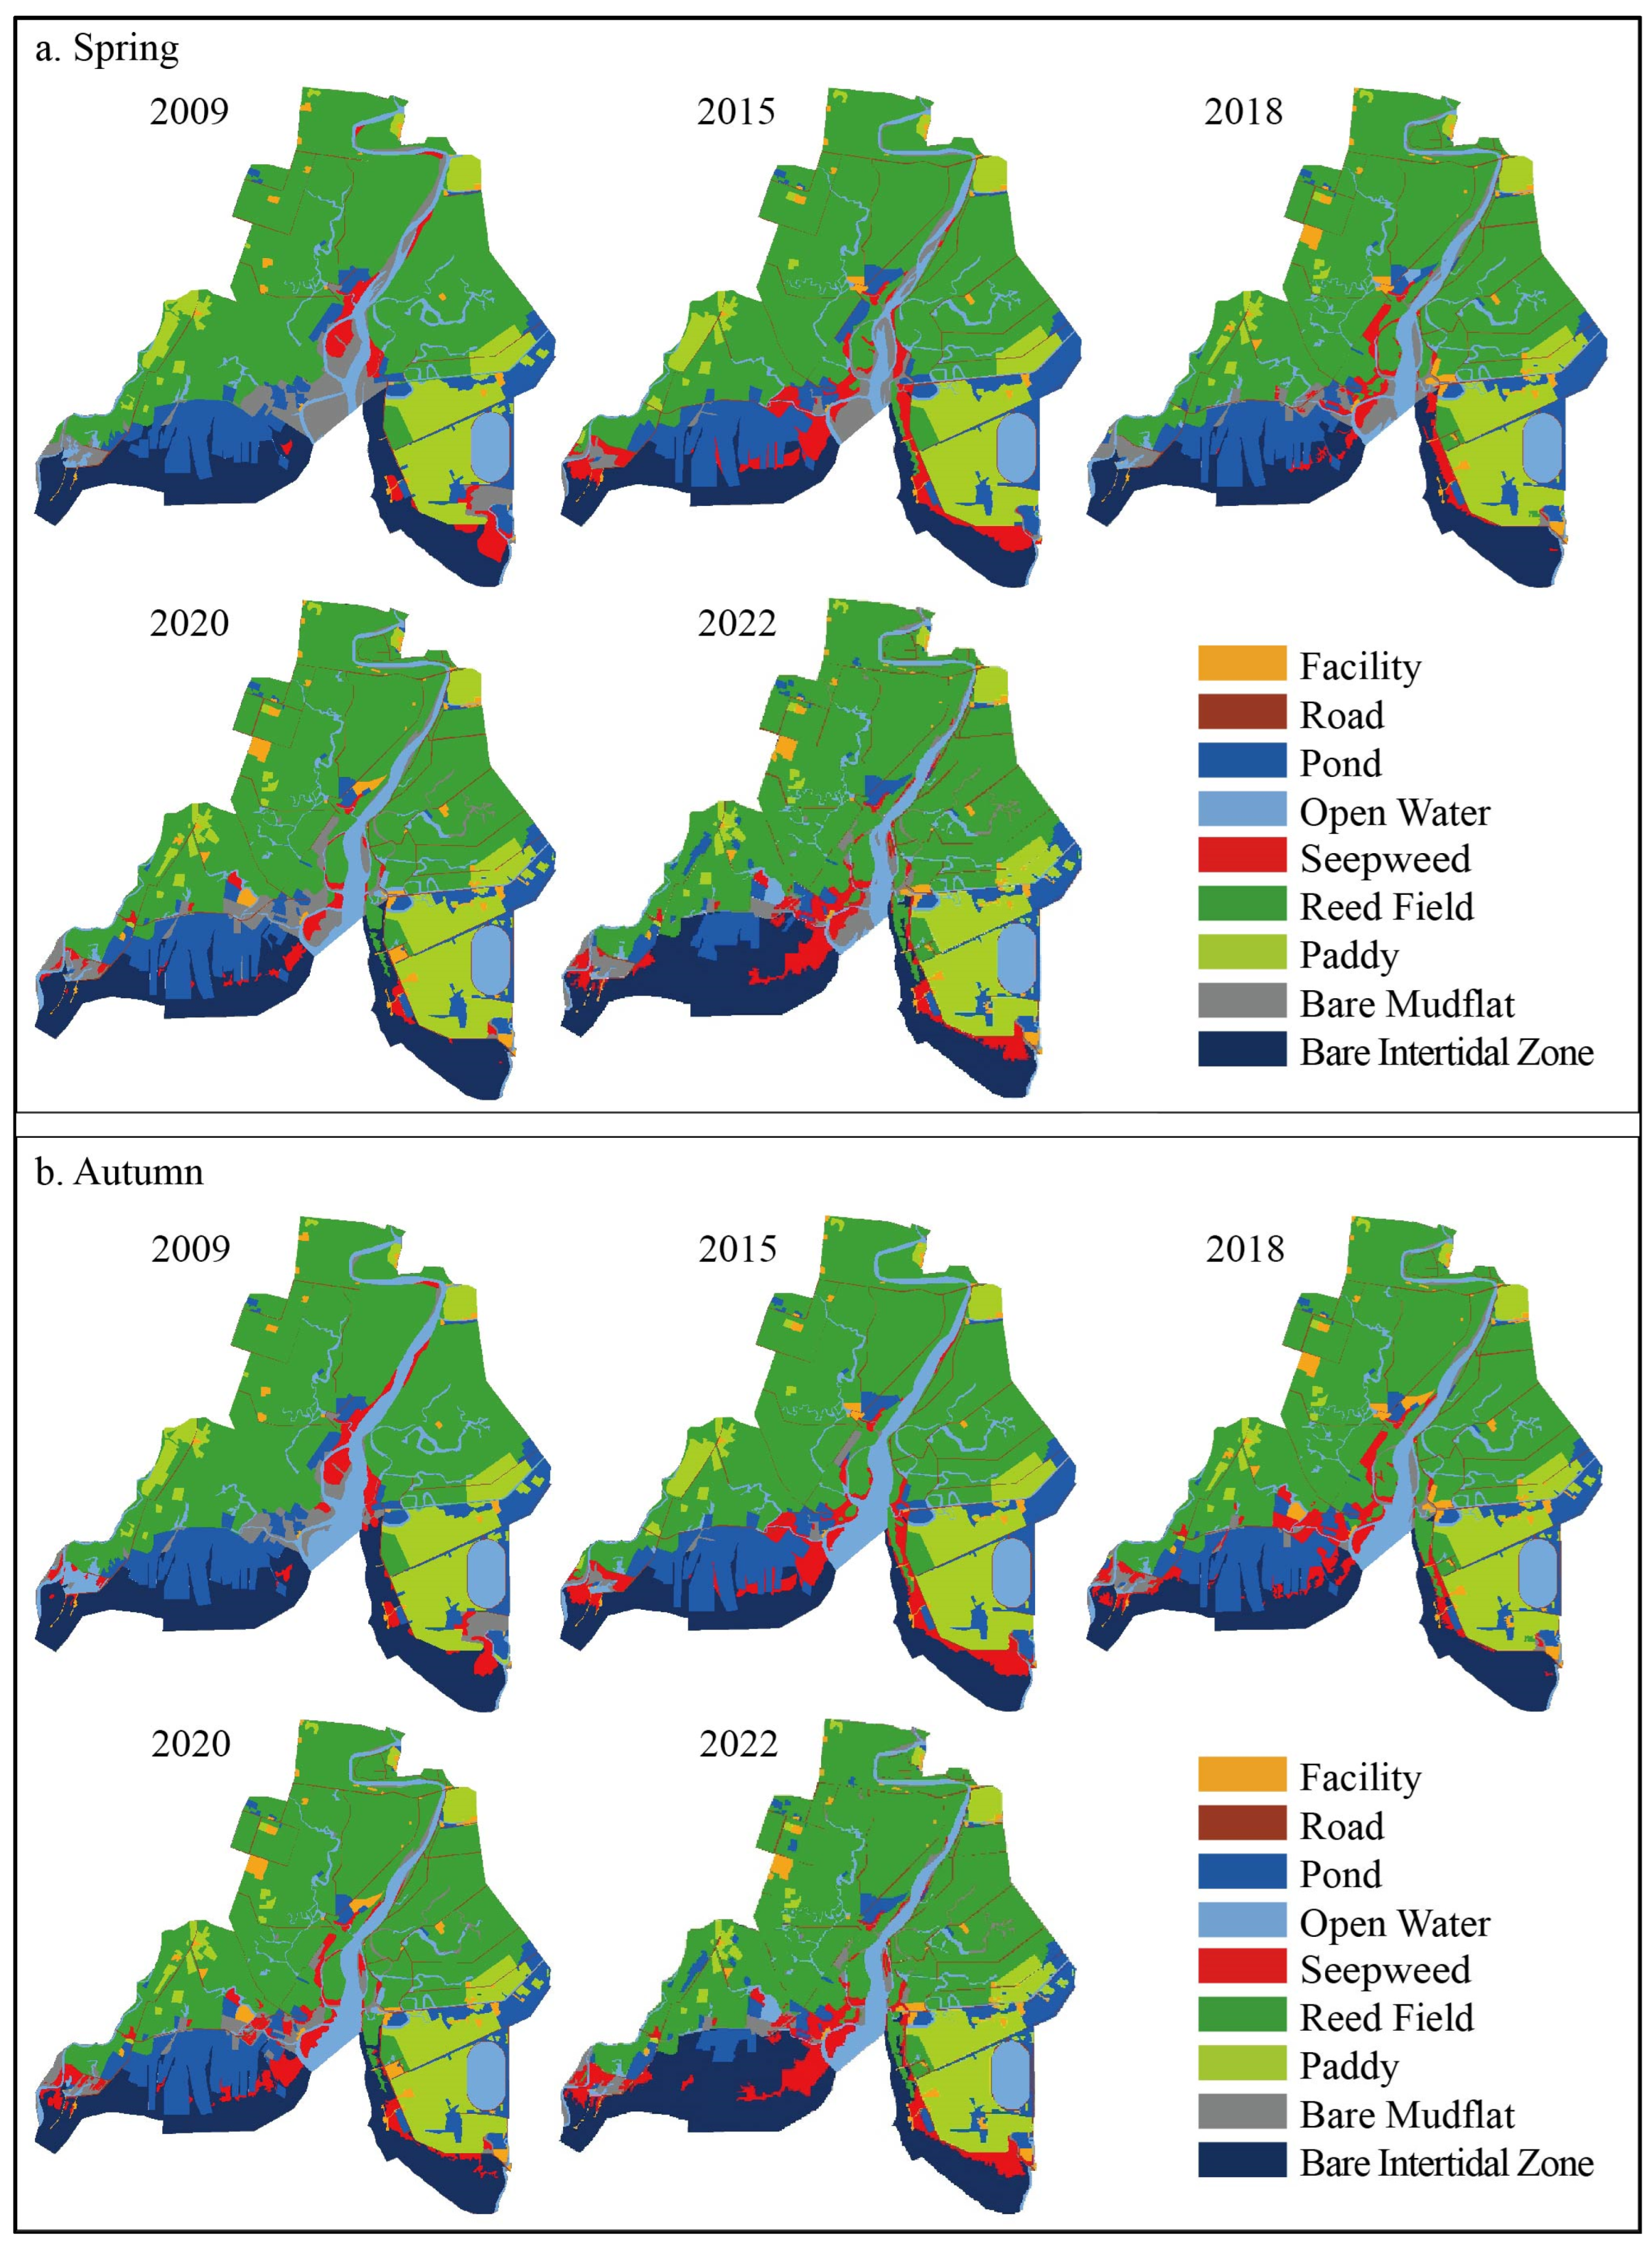
3.1. Spatiotemporal Changes in Landscape Patterns

Temporal changes to landscape patterns in spring and autumn 2009–2022 are provided in Figure 2. Reed field was the dominant land cover (46.3–48.2%) (Figure 2a), while seepweed gradually increased cover in 2009–2015 and after 2021. As shown in Figure 2a,c, facilities increased in 2016 and then decreased after 2021, while roads increased initially and then stabilized after 2016. Taking 2015 and 2019 as important policy transition years related to aquaculture ponds, there was a slight increase in ponds year by year up to 2015, and then a sharp decline in 2016, 2021, and 2022. Open water and seepweed showed fluctuating trends, while reed fields showed more minor fluctuations over time. The area of paddy was stable during the study period (Figure 2b). The area of bare mudflat and bare intertidal zone were the smallest in 2014 and 2015. Inversely, the area of seepweed was largest in 2014 and 2015 (Figure 2c).
In terms of seasonal changes, open water and seepweed usually covered more in autumn than in spring. Conversely, bare mudflat and bare intertidal zone covered less in autumn. Collectively, these results revealed that the facilities and roads mainly occupied the reed fields, while open water and seepweed mainly occupied bare mudflats and bare intertidal zones, and clearly alternated between these land covers.
Spatial changes in the landscape pattern were examined to further observe the changes among different landscape classes in the five key years (Figure 3). In the development stage (2009–2015), facilities, roads, aquaculture ponds, seepweed, and paddy increased, while aquaculture facilities increased significantly and reed storage sites gradually disappeared. The continuous construction of roads during this phase increased connectivity between human landscapes and decreased connectivity between natural landscapes. Bare mudflats and bare intertidal zones were occupied by ponds and paddies. Open water was mainly represented by the large oval reservoir and riverway, with some areas scattered in reed fields. Seepweed was distributed in riverside and intertidal zones, and moved towards the estuary and coast over time, while reed gradually replaced seepweed, bare mudflats, and intertidal zones.
During the environmental improvement stage (2016–2020), some aquaculture ponds were restored to bare mudflats and intertidal zones along the coastal road, while some of them were abandoned after their contract period and transformed into mudflat and intertidal zones or were invaded by seepweed and reed. In the east part of the Liaohe Estuary, infrastructure for tourism (Red Beach Corridor) was rapidly built during 2015–2018. In the west, seepweed gradually spread and dispersed.
During the maintenance stage (2021–2022), many of the aquaculture ponds were re-stored to natural coastal wetlands and the area of the open water decreased in both spring and autumn. Reed fields further invaded the seepweed and intertidal zone, while seepweed was gradually restored to the intertidal zone. In Figure 3, the number of open-water and seepweed patches in spring was significantly lower in area than that in autumn. Overall, although reed vitality and expansion was extensive, urbanization and development resulted in reed fields that became increasingly fragmented between 2009 and 2022.

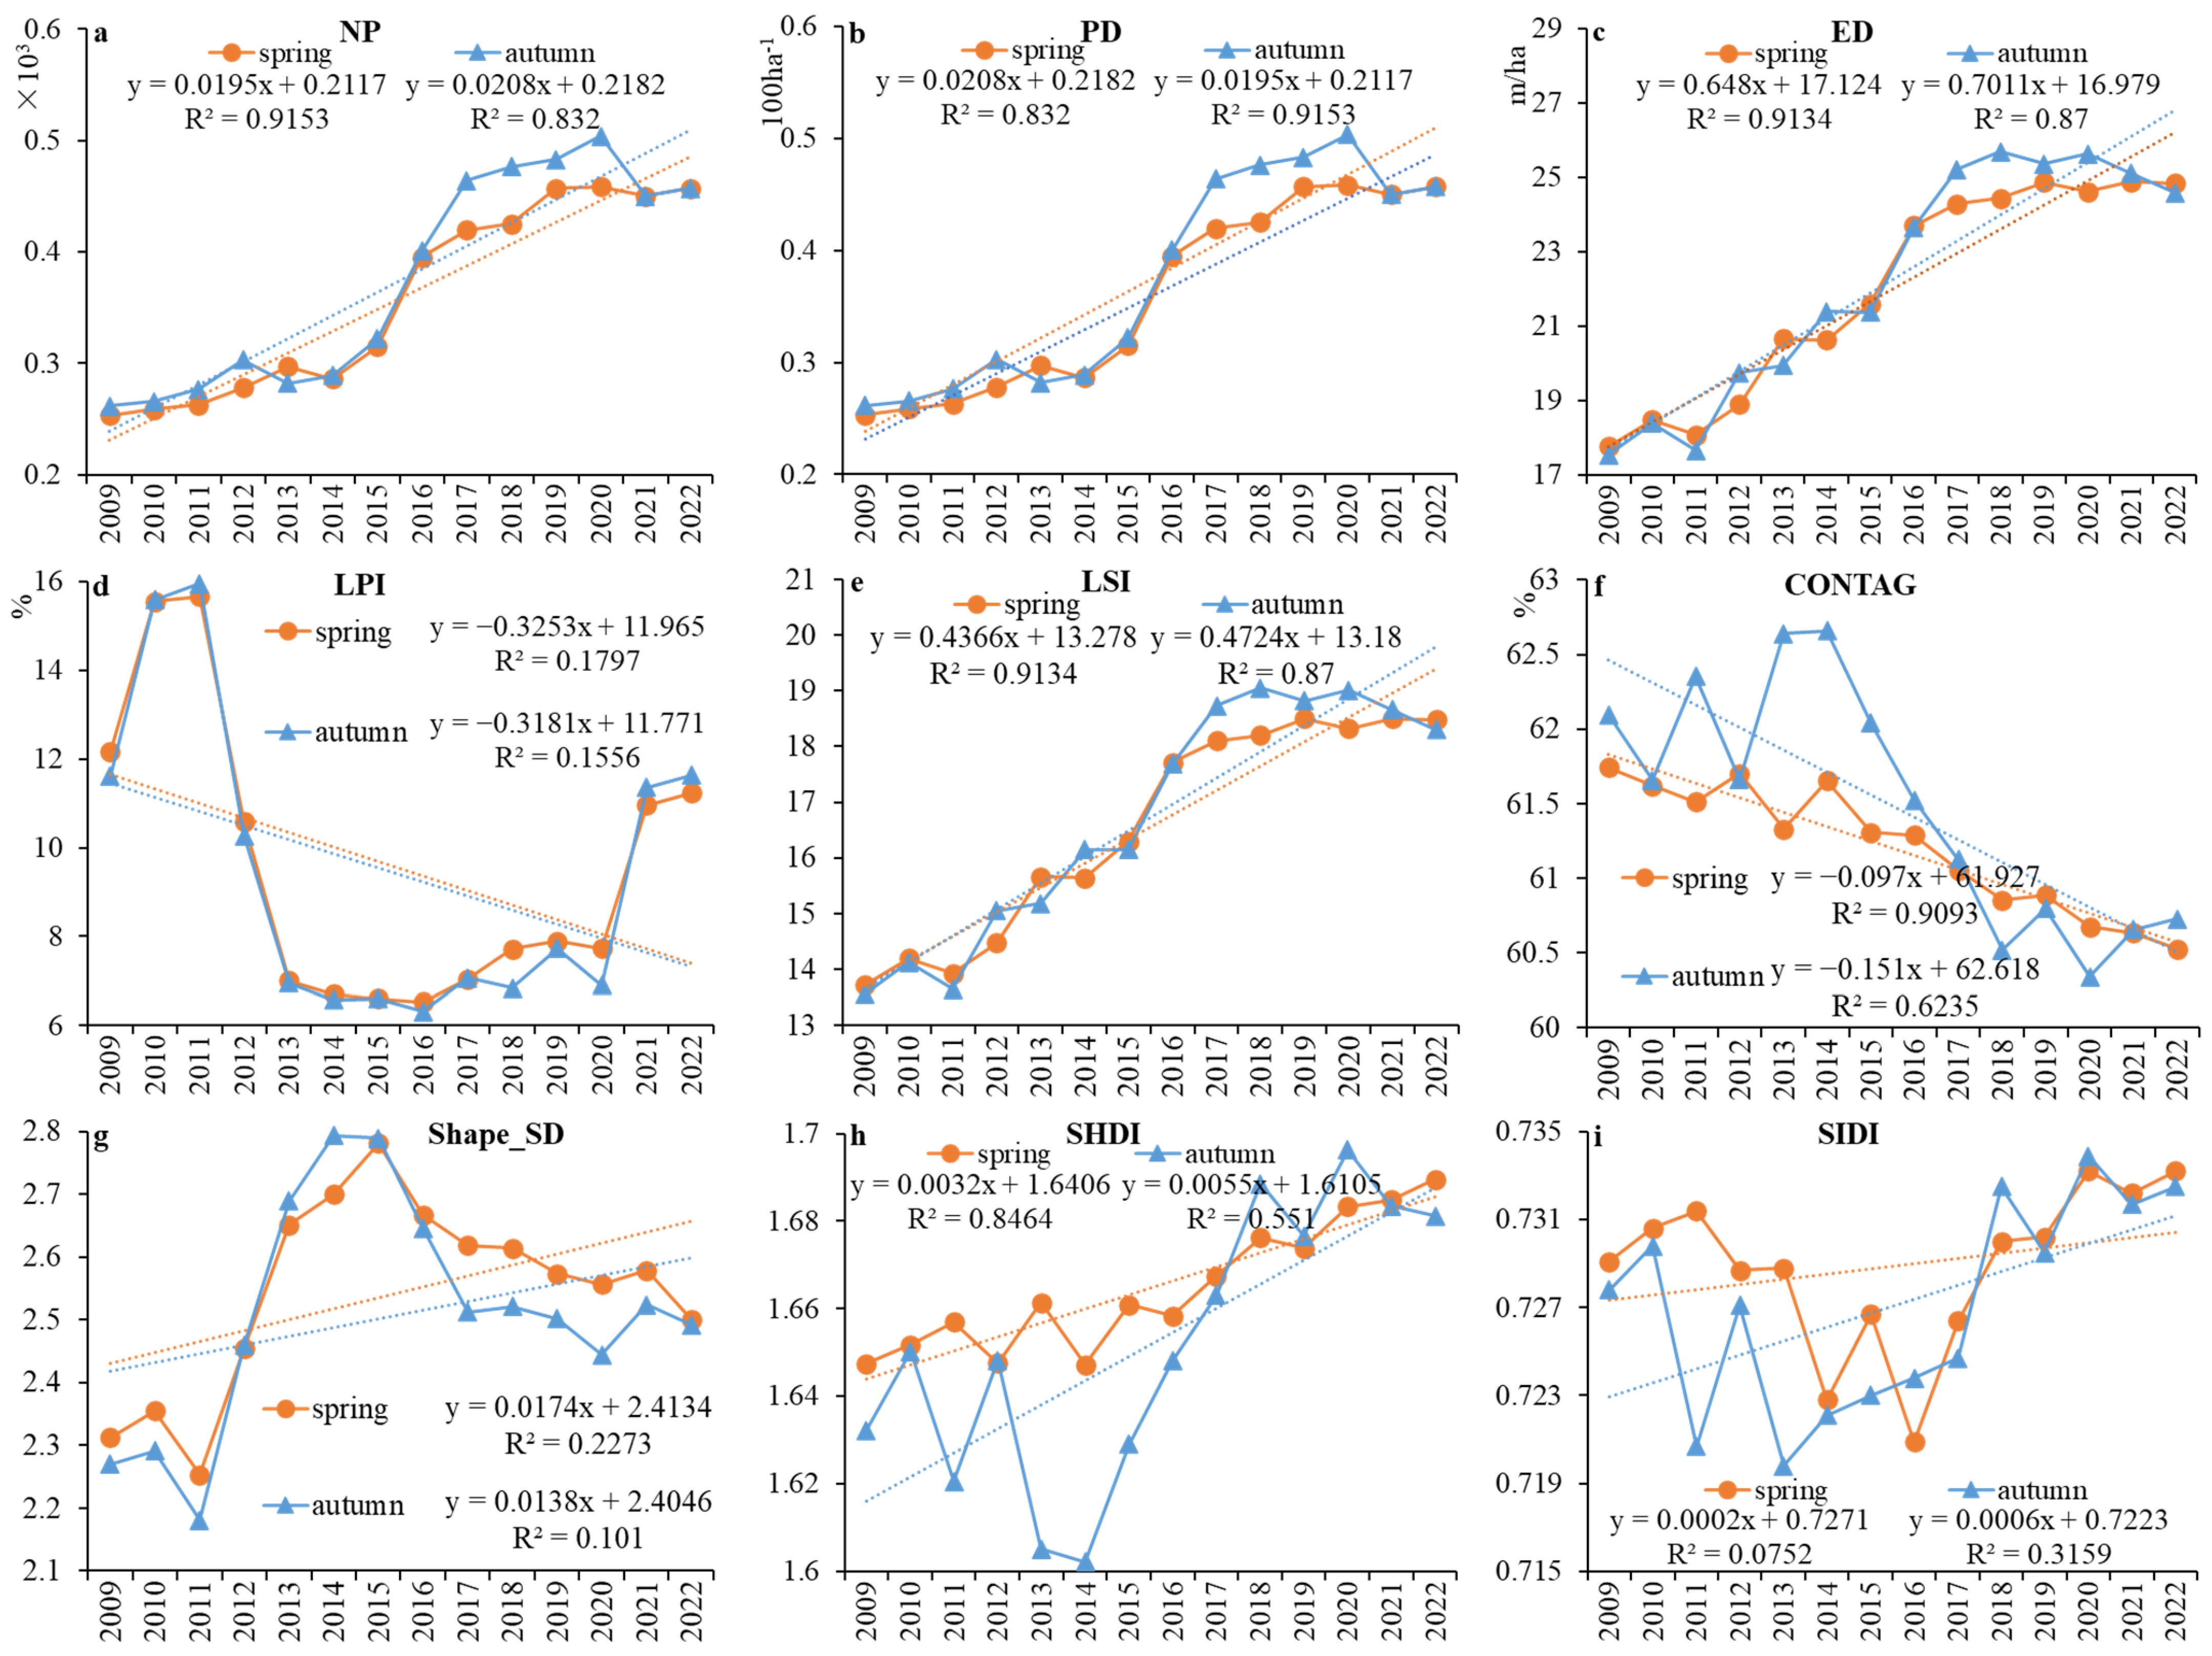
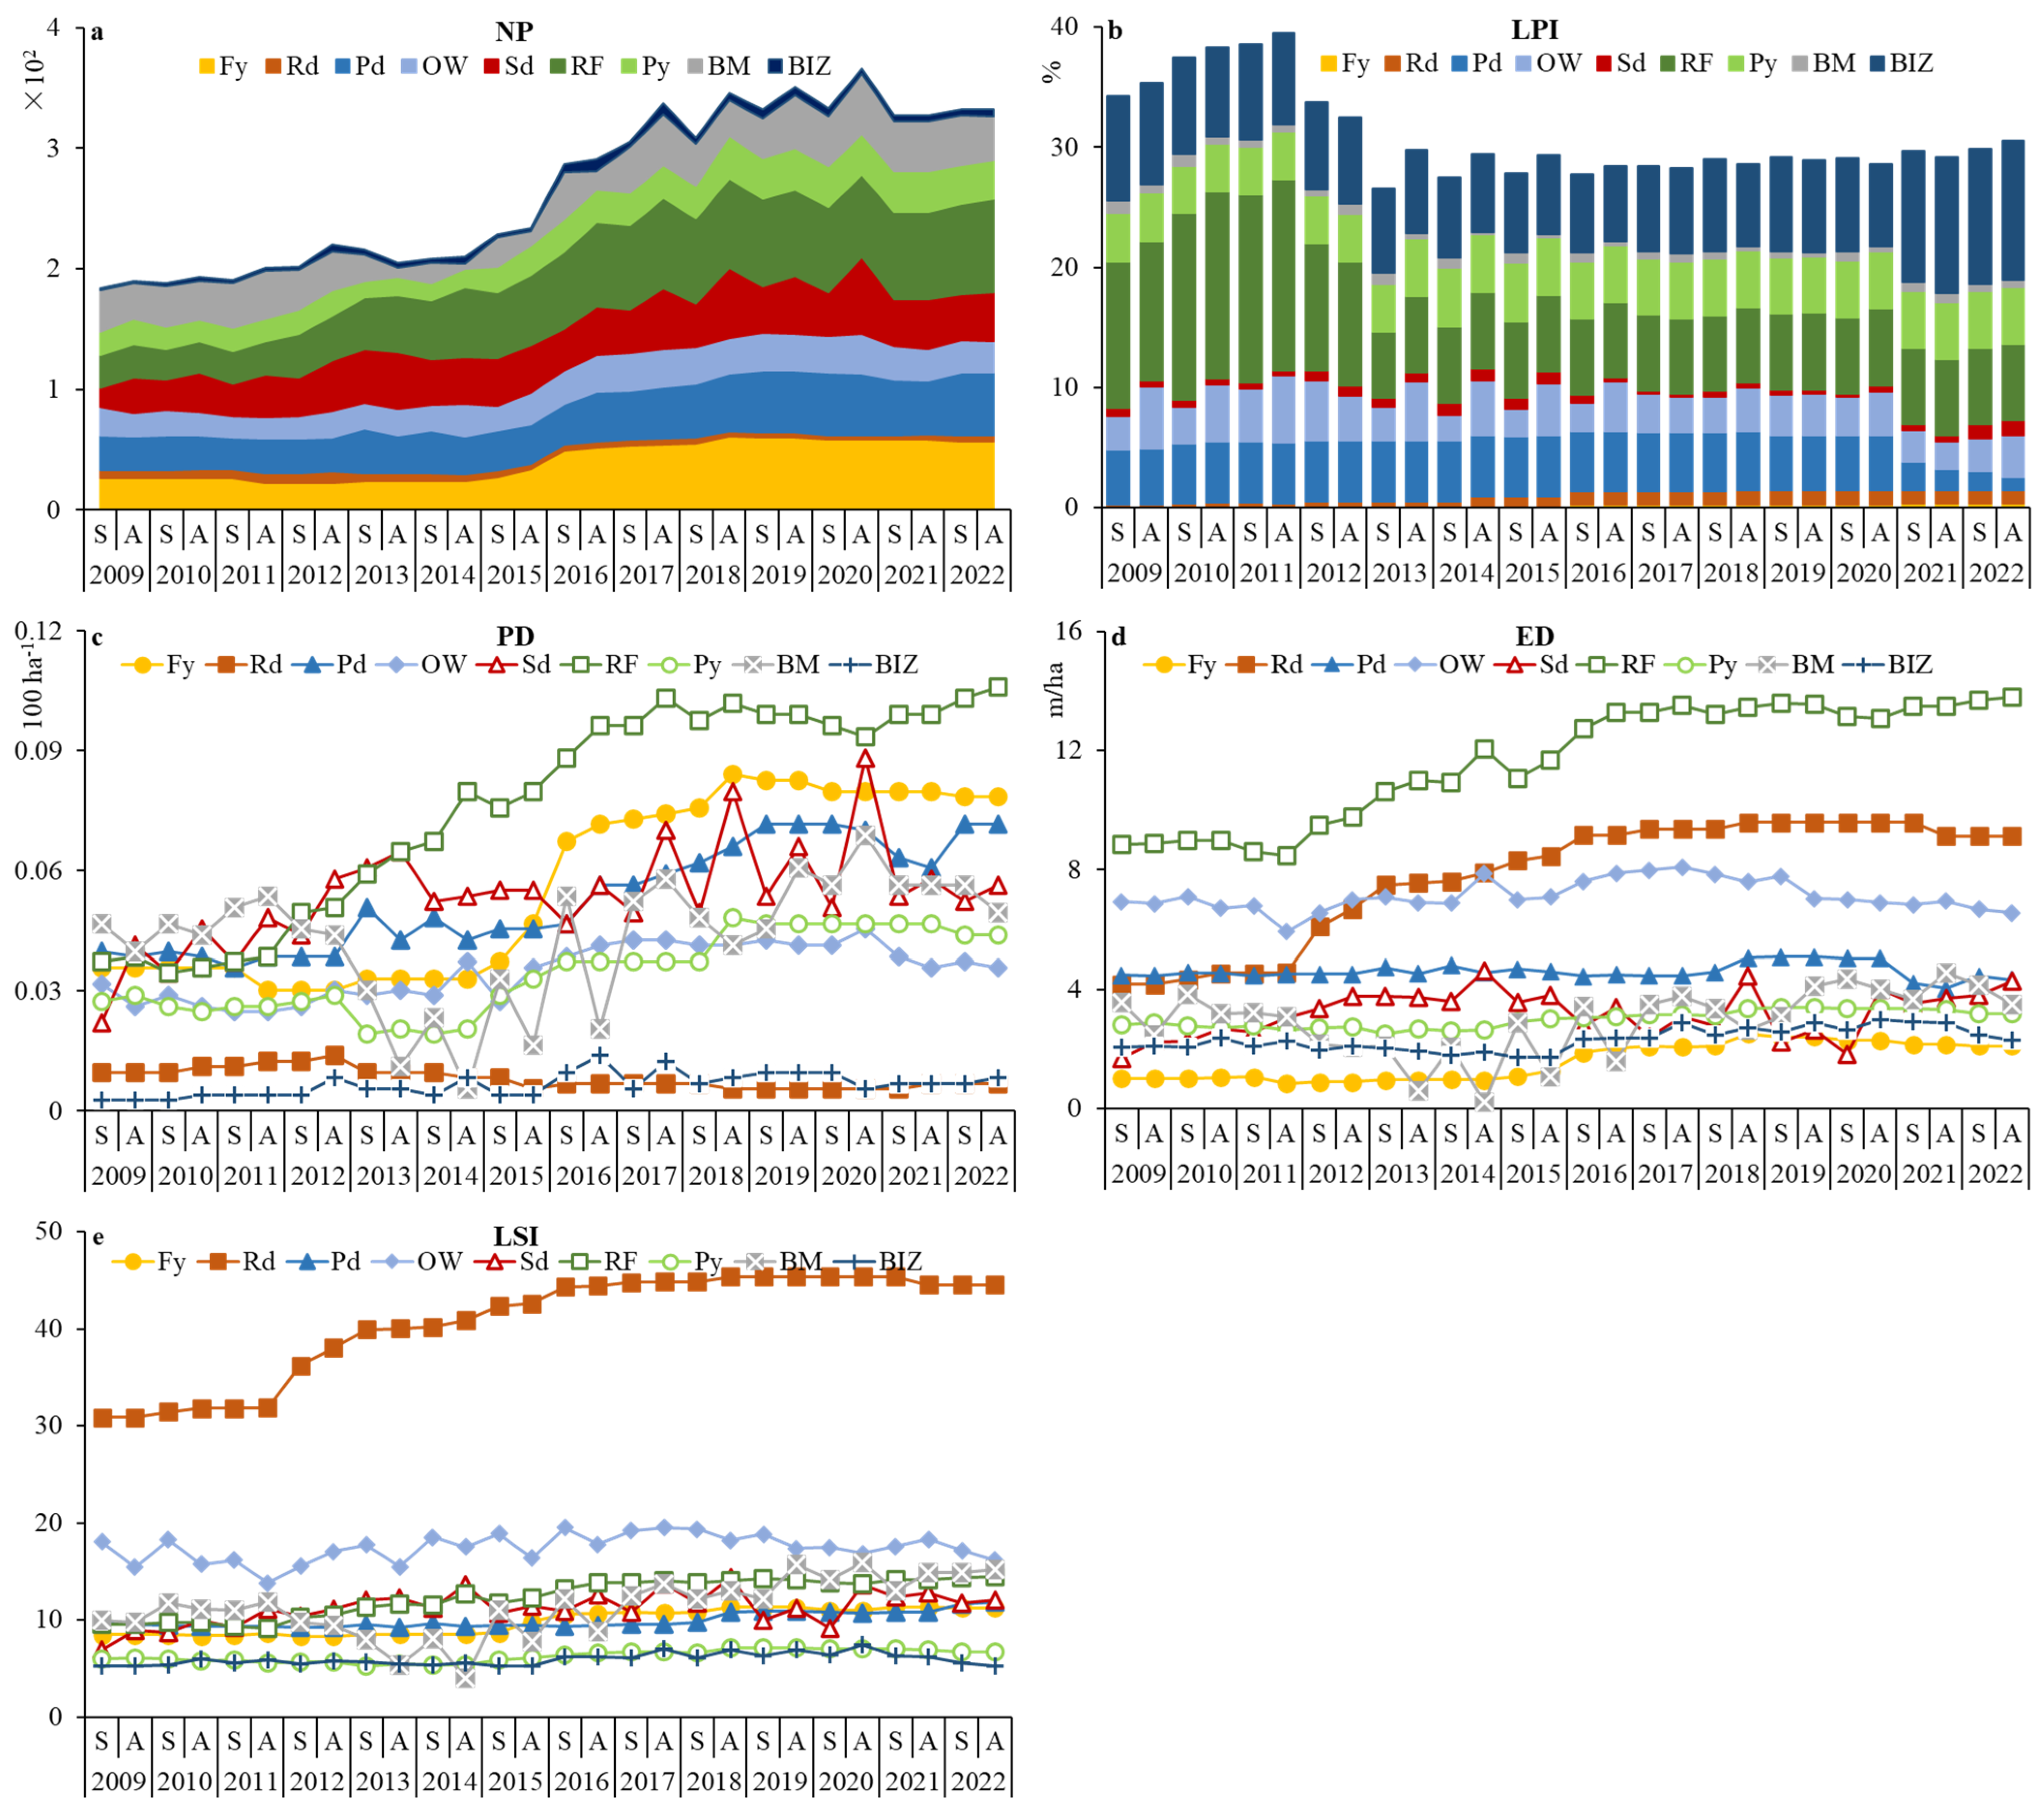
3.2. Changes in the Landscape Fragmentation

As shown in Figure 4, the number of patches (NPs), patch density (PD), edge density (ED), and largest shape index (LSI) showed similar increasing trends between 2009 and 2022 and increased sharply from 2014 to 2017. The changing trend of ED (spring slope = 0.65, autumn slope = 0.70) was stronger than that of PD (both spring and autumn slopes = 0.02) over time. Particularly, NPs increased from a minimum of 184 in 2009 to a maximum of 333 in 2020, and ED in spring was between 17.8 in 2009 and 24.9 in 2020 and in autumn between 17.5 in 2009 and 25.7 in 2018. The largest shape index (LPI) also illustrated these results and dropped sharply from 16.0% in 2011 to 6.9% in 2013; the shape standard deviation (Shape_SD) was also more discrete between 2013 and 2015, indicating substantial changes in land cover during the period.
Decreases in the Contagion index (CONTAG) and increases in Shannon’s diversity index (SHDI) represented completely opposite trends. Simpson’s diversity index (SIDI) had the same increased trends as SHDI, but with a smaller amplitude. During 2012 and 2015, CONTAG, SHDI, and SIDI showed significant changes compared to other years, demonstrating that the discontinuity of patches dominated, patch types varied, and fragmentation increased; thus, the landscape pattern had a large-scale shift between 2012 and 2015. CONTAG, SHDI, and SIDI at the landscape level can be used to assess the fragmentation and diversity of landscape patterns, but are unable to consider the change in multiple landscape types.
Measures of landscape fragmentation were also considered seasonally. NPs, ED, and LSI were lower in spring than in autumn after 2017, while SHDI and SIDI were significantly higher in spring than in autumn before 2016, lower between 2018 and 2020, and higher again from 2021 to 2022, which demonstrated that the landscape notably transformed between spring and autumn during the study period.
The landscape pattern at the class level can be further examined to consider the cause of landscape changes by human activities or natural succession. As can be seen from Figure 5a,b, the PN of facilities (26–60), seepweed (16–64), and bare mudflat (8–50) were larger and LPI (facilities = 0.07–0.31, seepweed = 0.24–1.30, and bare mudflat = 0.10–1.03) were smaller, indicating that the fragmentation of these landscape types was more severe. The NPs (5–10) and LPI (0.21–1.14) of the road were both small, while the NPs of the pond (26–52), open water (18–33), reed field (25–77), and paddy (14–34) were larger and their LPIs were also larger (pond = 1.07–5.07, open water = 2.21–5.20, reed field = 5.47–15.58, paddy = 3.94–4.89). These results illustrated dominant landscape types, especially the reed field, which had the largest NPs and LPI. The NPs of the bare intertidal zone was the smallest (2–10) but the LPI was larger (6.53–11.63), which indicated that this landscape type was more integrated.
These results were confirmed by Figure 5c,d, which showed the PD and ED values of the facilities and reed fields were higher and increasing year by year. The PD value of the road with strong connectivity was decreasing and the ED value was increasing, indicating that scattered facilities and greater road connectivity had gradually separated portions of the reed fields. The ED values of pond, open water, and paddy were stable, but their PD values grew slightly, indicating that the complexity of these landscape types was unchanged and their fragmentation was increasing. The PD values of seepweed showed an upward trend with seasonal fluctuation, and ED values showed a stable trend, indicating that cover by this species was gradually decreasing and dispersing. The PD and ED of the bare mudflat both fluctuated between spring and autumn, with low points during 2013 and 2015, indicating that the bare mudflat had strong seasonality, and freshwater levels were higher from 2013 to 2016. The PD values of the bare intertidal zone were small and the ED values were larger because of its integrity. Furthermore, as shown in Figure 5e, the LSI values of road cover were higher than others and the open water was the second highest, which was caused by the connection between the road and river system. Overall, these results showed that the area dominated by reed fields in the study area had little loss, although the increase in facilities and roads separated the reed fields more and more, leading to fragmentation increasing year by year. On the other hand, seepweed had slightly larger changes in area and fragmentation.

3.3. Transitions between the Landscape Types

As indicated in the Sankey diagrams (Figure 6), the transition and flows between the different landscape classifications were clearly observed between the five key years of 2009, 2015, 2018, 2020, and 2022. In spring (Figure 6a), during the development stage of 2009–2015, 7.91 km2 of seepweed were replaced by roads (0.32 km2), ponds (0.45 km2), reeds (5.66 km2), and paddy (1.48 km2). During that same time, 15.30 km2 of reeds shifted to facilities (1.00 km2), roads (5.38 km2), ponds (2.55 km2), paddy (4.87 km2), and ponds (1.80 km2). The development and construction of the ponds and roads separately occupied 14.28 km2 and 6.84 km2 of natural wetland, including open water, seepweed, reed field, bare mudflat, and bare intertidal zone. In the first restoration stage (2015–2018), 12.11 km2 of ponds were restored to 2.77 km2 of seepweed, 1.45 km2 of reeds, and 2.93 km2 of bare mudflat. In the second restoration stage (2018–2020), 12.42 km2 facilities were demolished and turned into open water (1.23 km2) and reed field (1.14 km2); 4.69 km2 ponds returned to seepweed (0.35 km2), reed field (0.15 km2), paddy (1.39 km2), bare mudflat (0.53 km2), and bare intertidal zone (1.04 km2). In the maintenance stage (2020–2022), 30.61 km2 of ponds were returned to bare intertidal flat, and 9.54 km2 of bare mudflat and 13.30 km2 of bare intertidal zone were converted to seepweed.
In autumn (Figure 6b), during the development stage (2009–2015), 11.89 km2 of seepweed converted to open water (1.93 km2), reed field (8.46 km2), and paddy (1.09 km2). During that time, 15.27 km2 of reed field was altered to road (5.60 km2), ponds (2.31 km2), and paddy (4.55 km2). A total of 21.42 km2 bare mudflat converted to ponds (1.58 km2) and paddy (5.29 km2). A total of 24.20 km2 of bare intertidal zone was converted to ponds (4.15 km2) and others. In the first restoration stage (2015–2018), 11.16 km2 of ponds were returned to seepweed (2.29 km2), paddy (1.39 km2), and bare mudflat (1.50 km2). In the second restoration stage (2018–2020), 2.79 km2 of facilities were demolished and changed to 1.58 km2 reed field and tiny ponds and open water. A total of 1.84 km2 of ponds were returned to 0.43 km2 of bare mudflat, 1.10 km2 of bare intertidal zone, and small patches of seepweed and reed field. During the maintenance stage (2020–2022), 4.45 km2 of facilities were demolished and turned into ponds (1.64 km2), open water (1.29 km2), and reed fields (1.40 km2). A total of 0.84 km2 of roads were returned to 0.71 km2 of bare mudflats and others. A total of 36.79 km2 of ponds were restored to 34.76 km2 of bare intertidal zones and a little vegetation of seepweed and reeds.
In summary, during the development stage (2009–2015), a large area of ponds and roads replaced the natural landscape. In the first and second restoration stages (2015–2020), some facilities, ponds, and roads were demolished and changed into open water, seepweed, bare mudflats, and bare intertidal zones. During the maintenance stage (2020–2022), most of the ponds were returned to bare mudflat and bare intertidal zones, and some bare mudflat and bare intertidal zones were covered by a large area of seepweed, indicating successful conversion in the two restoration stages and short maintenance period.

4. Discussion

4.1. Driving Factors of Landscape Pattern Change in the Different Stages

Reed fields were the dominant land cover, accounting for 46.5–48.2% of the study area. This area was divided or occupied by facilities, roads, and other land development, and it spread into open water, seepweed, bare mudflat, and bare intertidal zone, due to its broad habitat requirements, competitiveness, and high reproductive capacity in coastal areas [44]. The seepweed area and its patch numbers became larger in 2012, 2013, 2014, 2015, and 2022, compared to other years (Figure 2c), and its spatial distribution moved inland toward the coast, which was probably caused by reed spreading coastward, and sediment deposit raising the elevation [45] of the tidal flat to break the water–salt balance, making new suitable habitat [46] on the coast. The patches of bare mudflat and open water were seasonal trade-offs; the open water area in spring was significantly less than that in autumn, due to the rainy season being between July and August in the study area (China Gulf Records Codification Committee, 1998).
During the development stage (2009–2015), the area of facilities, roads, ponds, and paddies expanded (Figure 2c), and scattered reed storages disappeared because the reed recycling industry decreased in 2011 and 2012 [47], but some ancillary facilities of aquaculture were constructed with ponds in the intertidal zone between 2013 and 2015 (Figure 2c and Figure 3). Roads, including the esplanade that ran across the entire reserve from east to west and other traffic outlets, were rapidly built to increase their connectivity and effectively divided the reed fields as urbanization continued from 2009 to 2015 [48]. Paddy was reclaimed to occupy the reed field and intertidal zone [49]. During the restoration stage (2016–2020), the facilities rapidly increased in 2016 and decreased twice at the end of 2018 and 2020 (Figure 2c) because the tourist facilities were built as part of the Red Beach Corridor development [50]. Ponds scattered in reed fields and near the coastal road disappeared from 2015 to 2020. In place of these ponds, seepweed recolonized there but then degraded (Figure 3), which was mainly due to the Blue Bay Initiative and restoration efforts to dismantle the ponds and sow seepweed seed during 2015 and 2020 [51], although hand-seeded seepage grasses do not self-propagate well under artificially restored conditions. As part of “Green Shield in 2017”, illegal facilities for tourists and aquaculture were dismantled by the Central Environmental Inspector between 2018 and 2020 [52]. The reason for the decrease in seepweed during this time was that spring precipitation (55.2 mm in 2017, 92.2 mm in 2018, and 83.5 in 2019) was well below normal (126.1–302.4 mm) for this stage [53] and seepweed only germinates under suitable salinity occurring in late April [54]. The appropriate precipitation in spring can regulate the salinity of the intertidal flat surface, which can affect the seepweed germination rate. In the maintenance stage (2021–2022), many ponds returned to the intertidal zone after 2020, which was probably caused by efforts to open dams between ponds, improve hydrological connectivity, and restore tidal movement gradually to the intertidal flats after several years of separation. Meanwhile, the improved hydrologic connectivity provided a beneficial salinity regime, which resulted in the seepweed receiving suitable growing conditions here again [55].

4.2. Reasons for the Landscape Fragmentation Changes

Fragmentation of the area increased gradually between 2009 and 2013, sharply during 2014 and 2018, gradually again from 2019 to 2020, and then declined in 2021 and 2022 (Figure 4a–c). Landscape complexity also suddenly increased during 2011 and 2014 (Figure 4d,g) and landscape diversity showed an upward trend (Figure 4h,i). This situation was probably caused by the construction of roads, including the esplanade and oilfield roads built around 2013 [48] and the start of the tourist facilities construction for Red Beach Corridor in 2015 [50]. Numerous roads were built that encroached into the reed fields (Figure 5b and Figure 6) and segmented these areas into multiple pieces (Figure 5c). Many of the aquaculture ponds and paddies occupied the intertidal zone and bare mudflat, exacerbating the partition of hydrological connectivity (Figure 6), which seriously disrupted the balance between freshwater and seawater, changed the salinity in the soil, weakened tidal hydrodynamic conditions, and accelerated sediment deposition [56]. Moreover, aquaculture ponds were gradually returned to wetlands under the “Blue Bay Initiative” policy, causing the contiguous ponds to fragment from 2015 to 2020 (Figure 5c), so that landscape fragmentation peaked during this period. Subsequently, the un-bulldozed dams among ponds were flattened by daily tides and returned space for reeds and seepweed during 2021 and 2022. This effect was unexpected, and demonstrated that passive restoration and self-restoration can contribute to ecological restoration after active restoration measures are completed. This additional restoration measure contributed to the pattern of hysteresis often noted in ecological succession [57].
Although reeds were displaced from human activities including facilities, road building, and pond development, they spread into some seepweed and bare mudflats as well. As a result, fragmentation of the reed fields increased, but the area (46.3–48.2%) stayed consistent within the study area. The growing space of the seepweed was initially occupied by reeds and development, but it spread into the bare mudflat and bare intertidal zone between 2009 and 2015 (Figure 6) in response to changes in hydrological connectivity and soil salinity [58]. Seepweed seeds were gathered in many corners by the flow of tidal currents, and because it is an annual plant species, the landscape often changed between seepweed, bare mudflat, and bare intertidal zone from year to year [59]. As the intensity and direction of human activities changed in the development, restoration, and maintenance stages, the area of seepweed gradually recovered from decline and fragmentation to rapidly increase and re-establish (Figure 3), and is expected to gradually continue spreading over time into other restored spaces and suitable habitats.

4.3. Effects of the Conservation Measures and Policies on Coastal Wetlands

Before 2015, the central and local governments always encouraged the economic development of the Liaohe Estuary. Activities on the coast, including urbanization, aquaculture, industry, traffic, tourism, and so on, resulted in coastal cities gaining economic benefits but likely to the detriment of the local environment [60]. According to Figure 2, the percentage of landscape (PLAND) that were ponds (10.8–12.6%) and paddy (10.6–11.8%) replaced many natural coastal wetlands between 2009 and 2015 in this study area, and reeds (7.4 km2), seepweed (1.9 km2), bare mudflat (6.9 km2), and bare intertidal zone (5.6 km2) were developed and changed to ponds and paddy (Figure 6).
From 2015 to 2018 and in 2020, the policies of “Blue Bay Initiative” and “Green Shield 2017” were conducted by the central government and with the promulgation of the Notice of The State Council on Strengthening the Protection of Coastal Wetlands and Strictly Controlling Reclamation (State Council issued, No. 24, 2018). As a result, ponds were no longer developed, and existing ponds were retired in an orderly manner, which resulted in significant return of natural cover to the study area. Illegal facilities and roads were also dismantled by the local government. Seepweed, reeds, bare mudflat, and bare intertidal zone were effectively protected and not exploited, or utilized on a large scale, as in the development stage (Figure 3 and Figure 6), but these project measures still resulted in some additional landscape fragmentation (Figure 4).
During 2021 and 2022, the state continued to advocate for environmental protection policies such as marine ecological protections and ecological civilization construction to be implemented by the central government. The local government continued to strictly control and manage the coastal development, to maintain the coastal wetlands. A series of projects had been conducted in the previous years, but since the response of ecological systems can lag and responses have a hysteresis nature [57], a large area of ponds (34.76 km2) continued to be gradually converted back to the intertidal zone by tidal hydrodynamic scour in this period [61], which significantly enhanced hydrological connectivity and hydrodynamic conditions (Figure 6) that were conducive to the spread and growth of seepweed [62]. The pattern of hysteresis associated with ecological restoration has been demonstrated by many previous studies, which reported that ecological restoration trajectories displayed hysteresis due to varied corresponding rates of the degradation and recovery often detected in coastal and estuarine ecosystems [63].
Obviously, a great turn in landscape pattern from development to conservation occurred before and after these restoration measures were implemented by the central and local governments during the timeline of this study. In particular, there was the conversion of numerous aquaculture ponds located in intertidal zones that had been transformed back into natural wetlands.

5. Conclusions

The Liaohe Estuary is an important cultural and ecological region, and its history of development is typical of many other coastal regions in China. Changes and fragmentation of landscape patterns in the study area were common, mainly caused by human activities and economic development at the beginning of the study period. The development of facilities, aquaculture, agriculture, and especially roads, led to severe landscape fragmentation. Active restoration was the most important factor resulting in more fragmentation of landscape in the short-term, during restoration implementation. However, with the end of the active restoration, the fragmentation of landscape patterns gradually decreased after the self-restoration of landscapes dominated. From a spatial perspective, this study comprehensively measured the landscape changes and effective measures caused by human activities in the Liaohe Estuary. Examining landscape responses to policies and the time of widespread, active restoration measures around the Liaohe Estuary provided an opportunity to better document landscape pattern change and fragmentation with respect to the effectiveness of these measures. Restoration conducted by the governments and documented here and elsewhere can help to guide other coastal efforts in the future. With greater environmental awareness and the implementation of a large number of environmental protection policies, the impact of human activities has been reduced, and natural landscapes such as seepweed and reed fields have been protected, and restored. While active restoration projects are very effective, more passive and unintended effects can contribute to restoration goals. The response of the ecosystem and its landscape patterns to restoration measures may vary and may demonstrate a hysteresis quality. The effects of increased landscape fragmentation in the short term and how to effectively plan for the hysteresis of active and passive restoration, are important directions for future research.
In the future, we suggest that the government continue to protect and restore the ecological environmental features of the Liaohe Estuary area. This should continue to gradually improve landscape connectivity through the active and passive restoration of the ecosystem. Meanwhile, we should continue to pay attention to these lessons: (1) the construction and connectivity of roads was the most serious driving factor in landscape fragmentation, so the placement of future roads should be carefully deliberated and minimized as much as possible in natural reserves and other ecologically sensitive areas. (2) Special attention should be paid to the impact of the rapid landscape fragmentation caused by project measures on the ecosystem during large-scale active restoration projects. (3) The ecosystem may gradually adapt to active ecological restoration measures, so the effects of the active measures show some hysteresis. Restoration efforts should seek effective combinations of natural self-restoration and active restoration measures in their large-scale projects.

Author Contributions

Conceptualization, theorization, investigation, and data curation: X.L., B.J. and C.J.A.; methodology, software, writing, visualization: X.L. and N.L.; reviewing and editing: X.L., Q.C., C.J.A. and Y.W. All authors have read and agreed to the published version of the manuscript.

Funding

This work was supported by the central government guide local funds for science and technology development (Hebei Department of Science and Technology, 236Z3304G) and the North China Institution of Science and Technology Class A fund in 2023 (The Ministry of Education of the People’s Republic of China, 3142023028).

Institutional Review Board Statement

Not applicable.

Informed Consent Statement

Not applicable.

Data Availability Statement

Dataset available on request from the authors. The raw data supporting the conclusions of this article will be made available by the authors on request.

Acknowledgments

The authors also acknowledge the staff of Panjin City People’s Government, who provided the development and conservation information for Liaohe Estuary. Thanks to Xianzhao Wang and Yulai Sun, who participated in extracting and delineating the remote sensing images, thanks to Qingwei Zeng, who provided technical guidance for the ArcGIS software, thanks to Kurtis Fisher who corrected the language and grammar, and thanks to the Panjing Natural Resources Bureau and Liaohe Estuary Nature Conservation for their support of this study.

Conflicts of Interest

The authors declare that they have no known competing financial interests or personal relationships that could have appeared to influence the work reported in this paper. Authors Baocun Ji and Na Li were employed by the Beijing Ougeng Ecological Agriculture and Forestry Technology Co., Ltd. The remaining authors declare that the research was conducted in the absence of any commercial or financial relationships that could be construed as a potential conflict of interest.

References

  1. Costanza, R.; D’Arge, R.; Groot, R.D.; Farber, S.; Grasso, M.; Hannon, B.; Limburg, K.; Naeem, S.; O’Neill, R.V.; Paruelo, J.; et al. The value of the world’s ecosystem services and natural capital. Nature 1997, 387, 253–260. [Google Scholar] [CrossRef]
  2. Mitsch, W.J.; Jiang, B.B.; Miller, S.K.; Boutin, K.D.; Zhang, L.; Wilson, A.; Bakshi, B.R. Wetlaculture: Solving Harmful Algal Blooms with a Sustainable Wetland/Agricultural Landscape. In Engineering and Ecosystem; Bakshi, R.B., Ed.; Springer: Cham, Switzerland, 2023; pp. 333–354. [Google Scholar]
  3. Barbier, E.B.; Hacker, S.D.; Kennedy, C.; Koch, E.W.; Stier, A.C.; Silliman, B.R. The value of estuaries and coastal ecosystem services. Ecol. Monogr. 2011, 81, 169–193. [Google Scholar] [CrossRef]
  4. Barbier, E.B. Valuing ecosystem services for coastal wetland protection and restoration: Progress and challenges. Resources 2013, 2, 213–230. [Google Scholar] [CrossRef]
  5. Day, J.W.; Crump, B.C.; Kemp, W.M.; Arancibia, A.Y. Estuarine Ecology, 3rd ed.; John Wiley & Sons Inc.: Hoboken, NJ, USA, 2013; pp. 537–550. [Google Scholar]
  6. Newton, A.; Carruthers, T.J.B.; Icely, J. The coastal syndromes and hotspots on the coast. Estuar. Coast. Shelf Sci. 2012, 96, 39–47. [Google Scholar] [CrossRef]
  7. Halpern, B.S.; Walbridge, S.; Selkoe, K.A.; Kappel, C.V.; Micheli, F.; D’Agrosa, C.; Bruno, J.F.; Casey, K.S.; Ebert, C.; Fox, H.E.; et al. A global map of human impact on marine ecosystems. Science 2008, 319, 948–952. [Google Scholar] [CrossRef]
  8. Lotze, H.K.; Bruce, H.S.L.; Lenihan, H.S.; Bourque, B.J.; Bradbury, R.H.; Cooke, R.G.; Kay, M.C.; Kidwell, S.M.; Kirby, M.X.; Peterson, C.H.; et al. Depletion, degradation, and recovery potential of estuaries and coastal seas. Science 2006, 312, 1806–1809. [Google Scholar] [CrossRef]
  9. Worm, B.; Barbier, E.B.; Beaumont, N.; Duffy, J.E.; Folke, C.; Halpern, B.S.; Jackson, J.B.C.; Lotze, H.K.; Micheli, F.; Palumbi, S.R.; et al. Impacts of biodiversity loss on ocean ecosystem services. Science 2006, 314, 787–790. [Google Scholar] [CrossRef]
  10. Kim, S.G. The evolution of coastal wetland policy in developed countries and Korea. Ocean Coast Manag. 2010, 53, 562–569. [Google Scholar] [CrossRef]
  11. Cao, W.Z.; Wong, M.H. Current status of coastal zone issues and management in China: A review. Environ. Int. 2007, 33, 985–992. [Google Scholar] [CrossRef] [PubMed]
  12. Wang, Y. Coastal management in China. In Ocean Management in Global Change; Fabbri, P., Ed.; Elsevier Applied Science: London, UK, 1992; pp. 471–488. [Google Scholar]
  13. Sun, W.L. Evaluation on Spatial-Temporal Pattern of Carbon Emission and Carbon Budget in Tidal Marsh Ecosystem of the Yellow River Delta. Master’s Thesis, University of the Chinese Academy of Sciences (Yantai Institute of Coastal Zone Research), Beijing, China, 2014. [Google Scholar]
  14. Sun, Z.G.; Sun, W.G.; Tong, C.; Zeng, C.S.; Yu, X.; Mou, X.J. China’s coastal wetlands: Conservation history, implementation efforts, existing issues and strategies for future improvement. Environ. Int. 2015, 79, 25–41. [Google Scholar] [CrossRef] [PubMed]
  15. Ma, Z.J.; Choi, C.Y.; Gan, X.J.; Li, J.; Liu, Y.; Melville, D.S.; Mu, T.; Piersma, T.; Zhang, Z.W. Achievements, challenges, and recommendations for waterbird conservation in China’s coastal wetlands. Avian Res. 2023, 14, 100123. [Google Scholar] [CrossRef]
  16. The Xinhua News Agency. China Will Conduct the “Blue Bay” and Other Projects to Restore the Ocean’s Ecological Environment. 2016. Available online: https://www.gov.cn/xinwen/2016-01/22/content_5035381.htm (accessed on 1 September 2023).
  17. Sun, J.W.; Fang, H.C.; Yu, Y.H.; Wang, P.; Ying, J.; Dong, X.K.; Tang, C. Comprehensive treatment of coastal area in China based on the construction of marine ecological civilization. Mar. Dev. Manag. 2019, 36, 29–32. [Google Scholar]
  18. O’Neill, R.V.; Hunsaker, C.T.; Jones, K.B.; Riitters, K.H.; Wickham, J.D.; Schwartz, P.M.; Goodman, I.A.; Jackson, B.L.; Baillargeon, W.S. Monitoring environmental quality at the landscape scale. Bioscience 1997, 47, 513–519. [Google Scholar] [CrossRef]
  19. O’Neill, R.V.; Riitters, K.H.; Wickham, J.D.; Jones, K.B. Landscape pattern metrics and regional assessment. Ecosyst. Health 1999, 5, 225–233. [Google Scholar] [CrossRef]
  20. Zhu, C.M.; Zhang, X.L.; Zhou, M.M.; He, S.; Gan, M.Y.; Yang, L.X.; Wang, K. Impacts of urbanization and landscape pattern on habitat quality using OLS and GWR models in Hangzhou, China. Ecol. Indic. 2020, 117, 106654. [Google Scholar] [CrossRef]
  21. Sun, X.C. Liaoning Blue Bay Renovation Action Project Was Approved 300 Million RMB by the Central Government Investment. 2016. Available online: https://www.sohu.com/a/110148119_114984 (accessed on 1 September 2023).
  22. Du, J.; Song, K.S. Validation of global evapotranspiration product (mod16) using flux tower data from Panjin coastal wetland, northeast China. Chin. Geogr. Sci. 2018, 28, 420–429. [Google Scholar] [CrossRef]
  23. Li, H.F.; Li, L.F.; Su, F.L.; Wang, T.L.; Gao, P. The periodic response of tidal flat sediments to runoff variation of upstream main river: A case study in the Liaohe estuary wetland, China. Water 2020, 12, 61. [Google Scholar] [CrossRef]
  24. Wang, C.; Wang, G.; Dai, L.J.; Liu, H.Y.; Li, Y.F.; Zhou, Y.; Chen, H.; Dong, B.; Lv, S.C.; Zhao, Y.Q. Diverse usage of waterbird habitats and spatial management in Yancheng coastal wetlands. Ecol. Indic. 2020, 117, 106583. [Google Scholar] [CrossRef]
  25. Ge, M.; Wu, F.P.; Chen, X.P. A coupled allocation for regional initial water rights in Dalinghe basin, China. Sustainability 2017, 9, 428. [Google Scholar] [CrossRef]
  26. Ke, X.; Gui, S.F.; Huang, H.; Zhang, H.J.; Wang, C.Y.; Guo, W. Ecological risk assessment and source identification for heavy metals in surface sediment from the Liaohe River protected area, China. Chemosphere 2017, 175, 473–481. [Google Scholar] [CrossRef]
  27. Brix, H.; Ye, S.Y.; Laws, E.A.; Sun, D.C.; Li, G.S.; Ding, X.G.; Yuan, H.M.; Zhao, G.M.; Wang, J.; Pei, S.F. Large-scale management of common reed, Phragmites australis, for paper production: A case study from the Liaohe Delta, China. Ecol. Eng. 2014, 73, 760–769. [Google Scholar] [CrossRef]
  28. Ji, Y.H.; Zhou, G.S.; New, T. Abiotic factors influencing the distribution of vegetation in coastal estuary of the Liaohe Delta, Northeast China. Estuaries Coast 2009, 32, 937–942. [Google Scholar] [CrossRef]
  29. Sun, J.; Yang, D.M.; Li, J.G. Study on spatio-temporal change and forecast of land use in Liaohe river delta. J. Huazhong Agric. Univ. Soc. Sci. Ed. 2006, 1, 28–32. [Google Scholar]
  30. Zhang, Y.N.; Liu, B.Y.; Dong, L.; Jiang, H.X.; Wang, X.; Wang, X.M.; Song, C.Z.; Li, X.M.; Li, S.H. High genetic diversity and absence of phylogeographic structure in breeding populations of vulnerable Saundersilarus saundersi (Charadriiformes: Laridae) in Bohai Bay, China. Conserv. Genet. 2017, 18, 495–500. [Google Scholar] [CrossRef]
  31. Guo, C.L.; Dai, Y.J.; Cui, J.; Sun, X.B.; Ma, Y.X.; Ai, C.F. Wide forest abundant grass, colorful water and beautiful mountain—The revitalization of the Daling River estuary wetland. Sci. Pop. Cult. Land Resour. 2020, 02, 34–37. [Google Scholar]
  32. Yan, X.L.; Hu, Y.M.; Chang, Y.; Zhang, D.H.; Liu, M.; Guo, J.T.; Ren, B.H. Monitoring wetland changes both outside and inside reclamation areas for coastal management of the northern Liaodong Bay, China. Wetlands 2017, 37, 885–897. [Google Scholar] [CrossRef]
  33. Zhang, W. The CPC Central Committee’s Proposal on the Formulation of the Thirteenth Five-Years Plan Released—The Ocean as a New Space for Exploration and Development. 2015. Available online: https://www.gov.cn/xinwen/2015-11/05/content_5005020.htm (accessed on 2 September 2023).
  34. Ministry of Ecology and Environment. The Ministry of Ecology and Environment Interviewed Eight Municipal (Prefecture, District) Governments and Relevant Departments on the Problem of Encroachment and Destruction of Nature Reserves. 2018. Available online: https://www.mee.gov.cn/xxgk2018/xxgk/xxgk15/201809/t20180926_661929_wh.html (accessed on 28 November 2023).
  35. Hu, H.L. The Ecological Restoration Project of Bohai Bay in Liaoning Comprehensive Treatment Has Been Accepted. 2021. Available online: https://www.sohu.com/a/480549018_726570 (accessed on 28 November 2023).
  36. Li, J.Y.; Tang, L. Panjin: Retire Aquaculture Still Wetlands Guard Blue Bay. 2020. Available online: http://ln.people.com.cn/n2/2020/0928/c378489-34324364.html (accessed on 28 November 2023).
  37. Zheng, Y.P. Research on Landsat-7 SLC-Off Bad Track Repair Method Based on Image Classification Assisted by HJ-1A/1B. Master’s Thesis, Huazhong Normal University, Wuhan, China, 2016. [Google Scholar]
  38. Kawata, Y.; Ueno, S.; Kusaka, T. Radiometric correction for atmospheric and topographic effects on Landsat MSS images. Int. J. Remote Sens. 1988, 9, 729–748. [Google Scholar] [CrossRef]
  39. Svatonova, H. Analysis of visual interpretation of satellite data. Int. Arch. Photogramm. Remote Sens. Spat. Inf. Sci. 2016, XLI-B2, 675–681. [Google Scholar]
  40. Mcgarigal, K.; Cushman, S.A.; Ene, E. Fragstats v4: Spatial Pattern Analysis Program for Categorical and Continuous Maps; Computer Software Program Produced by the Authors at the University of Massachusetts: Amherst, MA, USA, 2012; Available online: https://www.scirp.org/reference/referencespapers?referenceid=1892846 (accessed on 10 November 2023).
  41. Mccune, B.; Mefford, M.J. Pc-ord: Multivariate Analysis of Ecological Data, Version 7.0 for Windows; Wild Blueberry Media: Corvallis, OR, USA, 2016; Available online: https://www.wildblueberrymedia.net/pcord-booklet (accessed on 10 November 2023).
  42. Cuba, N. Research note: Sankey diagrams for visualizing land cover dynamics. Landsc. Urban Plan 2015, 139, 163–167. [Google Scholar] [CrossRef]
  43. Schmidt, M. The Sankey diagram in energy and material flow management. J. Ind. Ecol. 2008, 12, 82–94. [Google Scholar] [CrossRef]
  44. Wang, J.; Liu, X.Y.; Zhang, X.Y.; Liang, X.; Zhang, W.J. Growth response and phytoremediation ability of reed for diesel contaminant. Procedia Environ. Sci. 2011, 8, 68–74. [Google Scholar] [CrossRef]
  45. Wang, G.D.; Wang, M.; Lu, X.G.; Jiang, M. Surface elevation change and susceptibility of coastal wetlands to sea level rise in Liaohe Delta, China. Estuar. Coast. Shelf Sci. 2016, 180, 204–211. [Google Scholar] [CrossRef]
  46. Qiao, H.T.; Zhang, M.L.; Jiang, H.Z.; Xu, T.P.; Zhang, H.X. Numerical study of hydrodynamic and salinity transport processes in the pink beach wetlands of the Liao River estuary, China. Ocean Sci. 2018, 14, 437–451. [Google Scholar] [CrossRef]
  47. Ling, H.Y. Study on the Development Strategy of Liaohe Estuary Paper Products Industrial Park. Master’s Thesis, Guangxi University, Guangxi, China, 2018. [Google Scholar]
  48. Yi County People’s Government. The Daling River Bridge of Fujin Section in Yi County Was Officially Opened to Traffic. 2016. Available online: http://www.lnyx.gov.cn/info/1038/6823.htm (accessed on 28 November 2023).
  49. Xu, Q.; Wang, X.L.; Xiao, B.; Hu, K.L. Rice-crab coculture to sustain cleaner food production in Liaohe River Basin, China: An economic and environmental assessment. J. Clean. Prod. 2019, 208, 188–198. [Google Scholar] [CrossRef]
  50. Xie, P.C. Study on Countermeasures of Ecotourism Development for Red Beach in Panjin. Master’s Thesis, Beihua University, Jilin, China, 2021. [Google Scholar]
  51. People’s Information. Panjin: “Returning Aquaculture to Wetland” Guard the Blue Bay. 2020. Available online: https://baijiahao.baidu.com/s?id=1679271906263227127&wfr=spider&for=pc (accessed on 28 November 2023).
  52. Panjing Ecology and Environment Bureau. The Provincial Government Inspection Office Checked the Rectification for Natural Conservation. 2018. Available online: https://sthjj.panjin.gov.cn/2018_10/19_09/content-223898.html (accessed on 28 November 2023).
  53. Li, X.Z.; Anderson, C.J.; Wang, Y.Y.; Lei, G.C. Waterbird diversity and abundance in response to variations in climate in the Liaohe Estuary, China. Ecol. Indic. 2021, 132, 108286. [Google Scholar] [CrossRef]
  54. Song, J.; Fan, H.; Zhao, Y.Y.; Jia, Y.H.; Du, X.H.; Wang, B.S. Effect of salinity on germination, seedling emergence, seedling growth and ion accumulation of a euhalophyte Suaeda salsa in an intertidal zone and on saline inland. Aquat. Bot. 2008, 88, 331–337. [Google Scholar] [CrossRef]
  55. Zhou, S.W.; Wang, C.; Li, Y.F.; Huang, W.C.; Jia, Y.; Wang, Y.Q.; Xu, W.; Qiu, C.Q.; Liu, H.Y. Study on spatio-temporal variation and hydrological connectivity of tidal creek evolution in Yancheng coastal wetlands. Environ. Sci. Pollut. Res. Int. 2023, 30, 37143–37156. [Google Scholar] [CrossRef] [PubMed]
  56. Luo, M.; Wang, Q.; Qiu, D.D.; Shi, W.; Ning, Z.H.; Cai, Y.Z.; Song, Z.F.; Cui, B.S. Characteristics of hydrological connectivity and its ecological effects in a typical tidal channel system of the Yellow River Delta. J. Beijing Norm. Univ. Nat. Sci. 2018, 54, 17–24. [Google Scholar]
  57. Borja, Á.; Dauer, D.M.; Elliott, M.; Simentstad, C. Medium- and Long-term Recovery of Estuarine and Coastal Ecosystems: Patterns, Rates and Restoration Effectiveness. Estuar. Coasts 2010, 33, 1249–1260. [Google Scholar] [CrossRef]
  58. Yu, Z.B.; Huang, L.B.; Bai, J.H.; Zhang, G.L.; Wang, W.; Wang, D.W.; Wang, C.; Wang, Y.Q.; Chen, G.Z.; Liu, Z. Seasonal response of Suaeda salsa to hydrological connectivity in intertidal salt marshes through changing trait networks. Catena 2023, 222, 106857. [Google Scholar] [CrossRef]
  59. Han, N.; Shao, Q.; Lu, C.M.; Wang, B.S. The leaf tonoplast V-H+-ATPase activity of a C3 halophyte Suaeda salsa is enhanced by salt stress in a Ca-dependent mode. J. Plant Physiol. 2005, 162, 267–274. [Google Scholar] [CrossRef]
  60. Jiang, S.; Xu, N.; Li, Z.C.; Huang, C.H. Satellite derived coastal reclamation expansion in China since the 21st century. Glob. Ecol. Conserv. 2021, 30, e01797. [Google Scholar] [CrossRef]
  61. Jia, Y.G.; Zheng, J.W.; Yue, Z.Q.; Liu, X.L.; Shan, H.X. Tidal flat erosion of the Huanghe River Delta due to local changes in hydrodynamic conditions. Acta Oceanol. Sin. 2014, 33, 116–124. [Google Scholar] [CrossRef]
  62. Zheng, G.H.; Wang, Y.; Zhao, C.Y.; Dai, W.; Kattel, G.R.; Zhou, D. Quantitative analysis of tidal creek evolution and vegetation variation in silting muddy flats on the Yellow Sea. Remote Sens. 2023, 15, 5107. [Google Scholar] [CrossRef]
  63. Duarte, C.M.; Borja, A.; Carstensen, J.; Elliott, M.; Krause-Jensen, D.; Marbà, N. Paradigms in the Recovery of Estuarine and Coastal Ecosystems. Estuaries Coasts 2013, 38, 1202–1212. [Google Scholar] [CrossRef]
Figure 1. Location of the study area in Liaohe Estuary, Panjin, China. The red line is the boundary of the study area.
Sustainability 16 07151 g001
Figure 2. Changes in the various landscape classifications in spring and autumn during 2009–2022. “S” for spring and “A” for autumn. (a) Percentage of landscape (PLAND); (b) Class area (CA); (c) Change extent of every landscape class (CELC).
Sustainability 16 07151 g002
Figure 3. Spatial change in landscape pattern between spring (a) and autumn (b) in the five key years of 2009, 2015, 2018, 2020, and 2022.
Sustainability 16 07151 g003
Figure 4. Fragmentation changes in the land level in spring and autumn 2009–2022. (a) The number of patches (NPs); (b) Patches density (PD); (c) Edge density; (d) Largest patch index (LPI); (e) Largest shape index (LSI); (f) Contagion index (CONTAG); (g) Shape standard deviation (Shape_SD); (h) Shannon’s diversity index (SHDI); (i) Simpson’s diversity index (SIDI).
Sustainability 16 07151 g004
Figure 5. Fragmentation changes in class level in spring and autumn 2009–2022. (a) The number of patches (NPs); (b) Largest patch index (LPI); (c) Patch density (PD); (d) Edge density (ED); (e) Largest shape index (LSI).
Sustainability 16 07151 g005
Figure 6. Landscape transition in spring (a) and autumn (b) in the five key years of 2009, 2015, 2018, 2020, and 2022.
Sustainability 16 07151 g006
Table 1. Landscape classification-system interpretation mark in Liaohe Estuary.
Landscape TypesSample ImageDescription
Facility (Fy)Sustainability 16 07151 i001
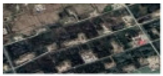
Taupe connection with punctiform, linear, and punctiform
Road (Rd)Sustainability 16 07151 i002
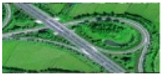
Grey and connected zone images
Pond (Pd)Sustainability 16 07151 i003
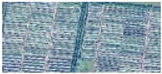
Continuous ponds with regular shapes
Open water (OP)Sustainability 16 07151 i004Wide freshwater surface with curved shape, and reservoir
Seepweed (Sd)Sustainability 16 07151 i005Scattered red patches between reed fields and intertidal zones
Reed field (RF)Sustainability 16 07151 i006Large green patches with irregular shapes
Paddy (Py)Sustainability 16 07151 i007Green–yellow and serried rectangle with regular shapes
Bare mudflat (BM)Sustainability 16 07151 i008Bare mudbank without any vegetation cover around freshwater area
Bare intertidal zone (BIM)Sustainability 16 07151 i009Intertidal flat without any vegetation cover
Disclaimer/Publisher’s Note: The statements, opinions and data contained in all publications are solely those of the individual author(s) and contributor(s) and not of MDPI and/or the editor(s). MDPI and/or the editor(s) disclaim responsibility for any injury to people or property resulting from any ideas, methods, instructions or products referred to in the content.

