Article

Does the Inter-Provincial Floating Population Affect Regional Economic Development in China? An Empirical Analysis

1
School of Public Administration, Hohai University, Nanjing 211100, China
2
Center for Chinese Migration, Hohai University, Nanjing 211100, China
*
Authors to whom correspondence should be addressed.
Sustainability 2024, 16(16), 7142; https://doi.org/10.3390/su16167142
Submission received: 14 June 2024 / Revised: 11 August 2024 / Accepted: 16 August 2024 / Published: 20 August 2024
(This article belongs to the Special Issue Sustainable Development Goals: A Pragmatic Approach)

Abstract

:
In recent decades, significant changes in the urban–rural structure of population mobility have profoundly impacted provincial development, urbanization, and population redistribution in China. Based on China’s fifth, sixth, and seventh national population census datasets, this study explores the effects of the inter-provincial floating population on regional economic development through statistical and empirical analysis, identifying both the scale and structural impacts of the floating population on regional economic development. The results found that while the scale of China’s floating population has been continuously increasing, the spatial distribution pattern remains relatively unchanged, and the pattern is summed up as low in the middle and high on both sides. The floating population exerts both scale and structural effects on the economic development of both inflow and outflow regions, altering regional populations and production efficiency, and thereby influencing regional economic outcomes. Specifically, this study finds that the inflow population has no significant differential impact on high- and low-density regions. In contrast, the outflow population exhibits a significant differential impact, with the negative impact of the outflow population on low-density regions being more substantial than that on high-density regions. Inter-provincial migration supports achieving sustainable development goals (SDG-8 and 11) by shaping regional economic development. To address these dynamics, the high-density regions of China should transform and upgrade the industrial and population structure by promoting the trend of population return to low-density regions. This can be achieved by transferring low-end industries and low-skilled labor, thereby alleviating the pressure of overcrowding. Meanwhile, low-density regions should seize the opportunities for population return and industrial transfer, implement talent introduction, and accurately undertake industrial transfer. This approach can foster the in-depth development of new urbanization and rural revitalization initiatives, promoting balanced regional growth and sustainability.

1. Introduction

Since China’s reform and opening up, large-scale cross-regional population migration has not only triggered the reshaping of the spatial distribution of the population but also promoted the reshaping of the regional economic development pattern [1,2,3]. Population mobility is an activity that optimizes the spatial allocation of labor factors based on the economic development pattern [4]. The floating population pattern and the economic development pattern interact and promote each other [5]. Meanwhile, the spatial agglomeration and dispersion of population mobility are affected by socioeconomic development patterns. Similarly, the floating population pattern also affects the socioeconomic development pattern through the spatial optimal allocation of labor factors [6,7]. According to the National Bureau of Statistics and data from the “China Health and Family Planning Statistical Yearbook”, the size of the floating population in China has stabilized at over 200 million people since 2010, reaching a peak of 253 million in 2014, which accounted for 18.5% of the national population. Additionally, data from the seventh national census show that from 2010 to 2020, the floating population grew at an average annual rate of 5.46%, rising to 370 million people by 2020, representing 26.5% of the national population. These figures provide material for examining the issues of population mobility and economic convergence in the new era [8]. This indicates that the population mobility model, in a significant period of transformation, is reshaping the current spatial pattern of population mobility in China and will significantly impact population redistribution, urbanization, and regional development [9,10]. On the one hand, a large population inflow has caused tension in infrastructure services and disrupted social and economic life in the cities to which these people moved [11]. The economic gap between high- and low-density regions has gradually widened [12].
In recent years, along with the restructuring of the global industrial chain and the industrial transformation and upgrading of China’s coastal areas, the return of population from coastal areas to the central and western regions has become a new trend, and the spatial pattern of economic development has also shown an inland trend [13]. Under the major trend changes in population development and the new development pattern, the report of the 20th National Congress of the Communist Party of China and the “Population Development Plan” (2016–2023) pointed out that there is an urgent need to optimize the spatial distribution of the population, promote the adaptation of population distribution to the national regional development strategy, and actively guide the population’s orderly flow and rational distribution. Straightening out the relationship between China’s floating population and economic development is the premise and basis for realizing the coordinated development of the population and regions and promoting the national urbanization and rural revitalization strategy [14]. The movement of people from less developed to more developed regions can help to alleviate poverty [15]. By migrating to areas with better economic opportunities, individuals from poorer provinces can increase their incomes, reducing poverty levels (SDG-1). Empirical analyses have shown that inter-provincial migration can lead to better employment opportunities and higher migrant wages, contributing to poverty reduction [16]. The floating population often fills labor shortages in more economically developed regions, contributing to sustained economic growth (SDG-8). This workforce mobility supports industries in high-demand areas, leading to increased productivity and economic expansion. Studies indicate that the influx of labor from other provinces can boost regional economic growth by enhancing labor market flexibility and efficiency. Regions with a high influx of the floating population tend to invest more in infrastructure and innovation (SDG-9) to support economic activities. This investment can lead to improved transportation networks, communication systems, and technological advancements, fostering overall economic development. The empirical evidence suggests that inter-provincial migration encourages regions to enhance their industrial capacities and infrastructural facilities. The floating population influences urbanization patterns and urban development. Cities that attract large numbers of migrants often need to improve infrastructure, housing, and services to accommodate the growing population [17,18]. This urbanization process can drive sustainable urban development if appropriately managed, leading to more inclusive and resilient cities (SDG-11). Inter-provincial migration can help to reduce economic disparities between regions. Migrants often send remittances back to their home provinces, which can improve living standards and stimulate economic activity in less developed areas. This financial flow helps to balance regional inequalities (SDG-10) and promotes inclusive economic development [19].
So, what is the relationship between the floating population and economic development? Existing studies can be roughly divided into two categories. First, economic factors are the primary factors driving population migration [20]. In classical theory, the main motivation for population mobility decisions is economic motivation; that is, a low level of economic development in the outflow area is conducive to population outflow, while a high level of economic development in the inflow area is conducive to population inflow. This conclusion has been repeatedly proven. Economic development differences are also considered important factors affecting population mobility [21,22]. The cost–benefit theory analyzes this phenomenon from the perspective of the benefits and costs of labor transfer, and states that the decision-making of population mobility is related to the income gap between regions. Meanwhile, the “push–pull” theory analyzes this issue from the perspective of kinematics and argues that population migration is affected by the economic factors of the place of origin [23]. The dominant push (pull) and the immigration-dominated pull (push) are jointly affected by economic factors [24]. When the push of emigration is greater than the pull, and the pull of emigration is greater than the push simultaneously, population migration will occur [25]. A new economic migration theory was developed based on the “push-pull” theory, which argues that population mobility is affected by the expected income level of the place of emigration. The second category includes the research on the coordinated development between the floating population and economic development. Yang [26] believes that population agglomeration has significant economic growth benefits, and at the same time, economic growth can further exert the population agglomeration effect. As a bridge, the flow of labor factors first acts on the industry and then promotes economic development [27].
The existing literature reveals that researchers have conducted in-depth research on the relationship between the floating population and economic development, laying a solid foundation for further research in this paper. However, still, there are some shortcomings coming into the picture. First, little attention has been paid to quantitative research considering the structural differences in the impact of the migrant population on economic growth. Second, there is a lack of research that completely separates the migrant population from other variables that affect economic growth through theoretical models. This study considers both the shortcomings and the structural effects of the floating population on economic growth through empirical models. At the same time, due to the influence of China’s household registration system, the population transfer includes the population flow along with and without the change in household registration. The floating population specifically refers to the second type of temporary population flow when households are separated. This type of population has a strong connection with both (outflow and inflow) places when they enter the system to work and do not completely consume and save in the system decision-making, but transfer capital accumulation back into the economic system from which it originated. This study examines the socio-economic effects of cross-provincial migration, highlighting its significant influence on regional economic development [28]. The findings aim to support the advancement of Sustainable Development Goal 8 (Decent Work and Economic Growth) and Sustainable Development Goal 11 (Sustainable Cities and Communities).

2. Materials and Methods

2.1. Data Collection and Sources

In this study, the 31 provincial-level administrative units in mainland China were targeted, except for Hong Kong, Macao, and Taiwan. This study utilizes the data from the fifth, sixth, and seventh national censuses to subdivide net population flow into population inflow and outflow, incorporating them into a unified analytical framework. Mathematical formulas are used to deduce trends in population flow. We examined the temporal and spatial characteristics of the inter-provincial floating population from 2000 to 2020 and their differential impact on the economic development of different regions in China. Since the inter-provincial outflow population data of the seventh census have not yet been released, this study calculated the inter-provincial outflow population data based on the “China Census Yearbook 2020” and calculated the inter-provincial outflow rate in 2020 [27,28]. The statistical yearbook was compiled by the National Bureau of Statistics and the statistical bureaus of each province and an autonomous region, from which data such as GDP, per capita GDP, regional average wage level, and the proportion of the tertiary industry were obtained. Qiao [29] and others [27,30] proposed that the floating population can be obtained from the difference between the resident population and the registered population. This study adopted a net flow rate (registered population of permanent residents). The method of the registered population was used to obtain the inter-provincial net flow rate [29,30], and the outflow rate, inflow rate, net flow rate, and the inter-provincial population outflow rate in the region in the year 2020 were obtained.

2.2. Theoretical Models

The neoclassical economic growth model states that technological progress, capital, and effective labor are the three main factors that affect economic output. Here, the Douglas production function was extended, and the model introduced the variable of the floating population to study the impact of the national inter-provincial population inflow and outflow on regional economies.

2.2.1. Impact of Inter-Provincial Net Floating Population on Regional Economic Development

Assumption 1. 
The Douglas production function is a Haro-neutral production function with constant returns to scale [29].
Y ( t ) = K ( t ) α [ A ( t ) L ( t ) ] 1 α ,   0 < α < 1
where  Y ( t )  represents output,  K ( t )  represents the capital required for production,  A ( t )  represents technological progress,  L ( t )  represents the effective labor of the system,  t  represents time, and  α  is a parameter of the production function.
Assumption 2. 
Technological progress is endogenous  A ( t ) and capital stock is exogenous  K ( t ) , consistent with the hypothesis of Lu Fenggang [31].
A ( t ) = λ K ( t ) φ ,   λ > 0 ,   0 < φ < 1
where  λ  is the transformation parameter, representing the impact of increased capital on knowledge, and  φ  is the return-to-scale property of the knowledge production function.  φ < 1  which means that the returns to scale of the knowledge production function is diminishing because with the continuous accumulation of knowledge, the new knowledge generated from the newly added capital will be more and more difficult to obtain.
Assumption 3. 
Assume that there is a floating population in the economic system where  l  is the net mobility rate.
L ( t ) = ( 1 + l ) P ( t )
The P t represents the total population within the economic system
Substituting Formulas (2) and (3) into Formula (1) to obtain the following formula:
Y ( t ) = K ( t ) α [ A ( t ) L ( t ) ] 1 α = λ 1 α K ( t ) α + φ ( 1 α ) L ( t ) ( 1 α ) = λ 1 α K t α + φ 1 α ( 1 + l ) 1 α P ( t ) 1 α
Dividing both sides of Formula (5) by the total population P t to obtain the Formula (6) corresponding to per capita output y t :
y ( t ) = Y ( t ) P ( t ) = λ 1 α K ( t ) α + φ ( 1 α ) ( 1 + l ) 1 α P ( t ) α
Take the natural logarithm of both sides of Formulas (4) and (5) at the same time to obtain the equations below:
ln Y t = α + φ 1 α ln K t + 1 α ln λ + 1 α ln 1 + l + 1 α ln P t
ln y t = α + φ 1 α ln K t + 1 α ln λ + 1 α ln 1 + l α P ( t )
In order to more clearly examine the influencing factors of total economic output and per capita economic output, the terms in Formulas (6) and (7) are expanded ln 1 + l by the third-order Taylor series, and Formulas (8) and (9) are obtained.
ln Y t = α + φ 1 α ln K t + 1 α ln λ + 1 α ln P t + 1 α 1 + l 1 α 2 ( 1 + l ) 2 + o ( 1 + l ) 3
ln y t = α + φ 1 α ln K t + 1 α ln λ 1 α P t + 1 α 1 + l 1 α 2 ( 1 + l ) 2 + o ( 1 + l ) 3
By organizing Formulas (8) and (9), expanding and merging the quadratic terms, and removing the infinitesimal quantities, Formulas (10) and (11) can be obtained.
ln Y t = α + φ 1 α ln K t + 1 α ln λ + 1 α ln P t + ( 1 α ) l + ( 1 α )
ln y t = α + φ 1 α ln K t + 1 α ln λ 1 α P t + ( 1 α ) l + ( 1 α )
It can be found that changes in regional total output K t  and per capita output  Y t not only depend on asset investment y t , but also the total population P t and net floating population l . From 0 < α < 1 , showing that 1 α > 0 , it is found that (i) the net inflow of population has a positive impact on regional total output and per capita output; (ii) asset investment has a certain positive impact on regional total output and per capita output; and (iii) the total population has a positive impact on regional total output and a negative impact on per capita output.

2.2.2. Impact of Inter-Provincial Inflows and Outflows on Regional Economic Development

In order to explore the impact of the out-migration population and the in-migration population on the regional economy, this study further sub-divided the net migrant population and used the Douglas production function to understand the impact of the national inter-provincial in-migration population and the out-migration population on the regional economy.
Assumption 4. 
The net floating population in this economic system is equal to the incoming population minus the outgoing population, that is,
l = l 1 l 2 ,   0 < l 1 < 1 , 0 < l 2 < 1
L ( t ) = ( 1 + l ) P ( t ) = ( 1 + l 1 l 2 ) P ( t )
where  P t  represents the total population within the economic system,  l  is the net mobility rate,  l 1  is the inflow rate, and  l 2  is the outflow rate. The inflow rate  l 1  and the outflow rate  l 2  are, respectively, obtained by using the ratio of the inter-provincial inflow population and the inter-province outflow population to the registered population. Substitute Formula (13)’s values into Formulas (8) and (9) to obtain the following equations:
ln Y t = α + φ 1 α ln K t + 1 α ln λ + 1 α ln P t + 1 α 1 + l 1 l 2 1 α 2 ( 1 + l 1 l 2 ) 2 + o ( 1 + l 1 l 2 ) 3
ln y t = α + φ 1 α ln K t + 1 α ln λ 1 α P t + 1 α 1 + l 1 l 2 1 α 2 ( 1 + l 1 l 2 ) 2 + o ( 1 + l 1 l 2 ) 3
It is found from Formulas (14) and (15) that changes in regional total output and per capita output not only depend on asset investment K t , but also on total population P t , inflow rate l 1 , and outflow rate l 2 . Further, by sorting out Formulas (14) and (15), we obtain the following equations.
ln Y t = α + φ 1 α ln K t + 1 α ln λ + 1 α ln P t + 1 α l 1 1 α l 2 + 1 α
ln y t = α + φ 1 α ln K t + 1 α ln λ α ln P t + 1 α l 1 1 α l 2 + 1 α
In Formulas (16) and (17), if 0 < α < 1 can be 1 α > 0 , it can be found that (i) the inflow rate has a positive promoting effect on the regional total output and per capita output, and (ii) the outflow rate has a positive effect on the regional total output and per capita output and further acts as a negative inhibitory effect. This study will verify these influencing relationships from an empirical perspective.

2.3. Empirical Analysis Model

2.3.1. Regression Analysis

According to the above theoretical derivation process, especially Formulas (10) and (11), taking into account the endogeneity problems caused by omitted variables and the inertial effect of economic growth, the first-order lagged explained variable is introduced into the explanatory variables to construct a dynamic panel of data models (Formulas (18) and (19)).
ln Y i t = β 0 + β 1 ln Y i t 1 + β 2 l i t + β 3 ln K i t + β 4 ln P i t + ε i t
ln y i t = γ 0 + γ 1 ln y i t 1 + γ 2 l i t + γ 3 ln K i t + γ 4 ln P i t + ε i t
The empirical model studies the net floating population to identify and measure the scale effect and structural effect of the floating population on regional economic growth. The net mobility parameter β 2 in Formula (18) reflects the scale effect of the floating population on economic development, and the net mobility parameter γ 2 in Formula (19) is used to identify its structural effect on economic development. When β 2 > 0 , it is explained that the net floating population leads to an increase in the regional population and increases the total regional output, as a scale effect. When γ 2 > 0 , it is explained that the net floating population increases the population base, and the per capita output is due to the increase in the production efficiency of the inflowing population, reflected as a structural effect.
According to the above theoretical derivation process, especially Formulas (16) and (17), taking into account the endogeneity problems caused by omitted variables and the inertial effect of economic growth, the first-order lagged explained variable is introduced into the explanatory variables to construct a dynamic panel of data models (Formulas (18) and (19)).
ln Y i t = β 0 + β 1 ln Y i t 1 + β 2 l 1 i t + β 3 l 2 i t + β 4 ln K i t + β 5 ln P i t + ε i t
ln y i t = γ 0 + γ 1 ln y i t 1 + γ 2 l 1 i t + γ 3 l 2 i t + γ 4 ln K i t + γ 5 ln P i t + ε i t
The empirical model studies the variables of the in-migration population and out-migration population to identify and measure the scale effect and structural effect of the floating population on regional economic growth. The inflow rate ( β 2 ) and outflow rate ( β 3 ) in Formula (20) reflect the scale effect of the floating population on economic development. Similarly, the inflow rate ( γ 2 ) and outflow rate ( γ 3 ) in Formula (21) are also used to identify its structural effect on economic development. Taking the inter-provincial population inflow rate as an example, if β 2 > 0 , it is explained that the population inflow leads to an increase in the regional population and a further increase in the total regional output, revealing a scale effect. If γ 2 > 0 , it is explained that the population inflow increases the population base, and the per capita output will be due to the inflow of people. Due to the increase in production efficiency, this reflects a structural effect.

2.3.2. Analysis of Variance

In order to further examine whether the floating population has a differential impact on targeted areas with different levels of urban density, this study introduces the intersectional terms of floating population and urban density for analysis. Urban density refers to the density characteristics and configuration intensity of various urban elements in spatial distribution. To a certain extent, it not only measures the coordination of land resource supply and demand, but is also an important indicator of the level of urbanization to comprehensively evaluate the development trend of a city [32]. This study divided 31 provinces and cities into two types of areas based on measurement indicators such as population density, economic density, and building density, namely high-density urban areas and low-density urban areas [33,34]. At the same time, dummy variables were introduced, meaning that that if the province was a high-density area, the value was 1, and otherwise it was 0. Unbalanced panel data were constructed, and the above empirical models (Formulas (20) and (21)) were expanded to obtain the following four empirical models (Formulas (22)–(25)).
ln Y i t = β 0 + β 1 l 1 i t + β 2 l 1 d e n s i t y i t + β 3 d e n s i t y + β 4 ln K i t + β 5 ln P i t + ε i t
ln Y i t = λ 0 + λ 1 l 2 i t + λ 2 l 2 d e n s i t y i t + λ 3 d e n s i t y + λ 4 ln K i t + λ 5 ln P i t + ε i t
ln y i t = β 0 + β 1 l 1 i t + β 2 l 1 d e n s i t y i t + β 3 d e n s i t y + β 4 ln K i t + β 5 ln P i t + ε i t
ln y i t = λ 0 + λ 1 l 2 i t + λ 2 l 2 d e n s i t y i t + λ 3 d e n s i t y + λ 4 ln K i t + λ 5 ln P i t + ε i t
where ln Y i t represents the total regional output, ln y i t represents the per capita output, K i t represents asset investment, P i t represents the total regional population, l 1 d e n s i t y i t represents the intersection of population outflow rate and urban density, abd l 2 d e n s i t y i t  represents the intersection of population outflow rate and urban density, among which Formulas (22) and (23) introduce the inflow model and empirical model while Formulas (24) and (25) introduce the outflow rate and the cross term between the outflow rate and the development level.

2.4. Statistics and Tools Used

In this study, Figure 1, Figure 2 and Figure 3 were produced on the Arc-GIS platform. All data were analyzed using Stata 17 software and Microsoft Office 2010.

3. Results and Discussion

3.1. Calculation of Inter-Provincial Floating Population Data

The three-year cross-provincial population net flow, inflow, and outflow distribution maps were drawn using Arc-GIS 10.8 software. In order to facilitate the comparison of the temporal and spatial change characteristics of the floating population between 2000 and 2020, the same scale was used for classification, and the inter-provincial net migration rate, inflow rate, and outflow rate of the three years were classified. The net population flow rate revealed the indicators of population loss and the net increase in the process of population migration in each province. Figure 1 presents the net population flow of each province separately and provides an overview of the spatial distribution of the inter-provincial net population flow rate across the country. The 31 provinces are divided into 6 levels. From 2000 to 2020, China’s inter-provincial population flow increased from 42.41 million to 124.83 million, indicating that the scale of China’s floating population is constantly increasing [35]. During this period, the spatial pattern of China’s population flow did not change significantly, and the overall situation was “low in the middle and high at both ends”. The net inflow of inter-provincial floating population is mainly concentrated in two regions: one is the high-density southeast coastal areas, including Shanghai, Beijing, Zhejiang, Guangdong, Tianjin, Jiangsu, and Fujian, because population mobility has obvious cohesion, and the attractiveness of the eastern region to migrant populations still has an absolute advantage [36]; and second is Xinjiang and Tibet, located in the west. With 2008 as the time node, the implementation of the Western development policy accelerated the economic growth of the Western region and triggered a large population inflow [37].
Notably, most of the central regions and provinces show varying degrees of persistent net population outflow losses, such as Anhui, Jiangxi, and Hunan. The main reason for this phenomenon is that since the reform and opening up of China, the economic development gap between regions in China has gradually widened, and the rapid economic development of the eastern coastal areas has created more employment opportunities and higher wages, thereby fostering a large population. For the economically less developed central region, the gap in employment opportunities, wages, education, and healthcare compared to the eastern region is becoming increasingly evident [14]. The phenomenon of population loss is serious, and the spatial distribution presents an obvious “central depression”. However, Xinjiang and Tibet in the west have extremely low population outflow rates and high population inflow rates, resulting in the highest inter-provincial net population migration rates in the country. This may be due to the relatively closed traffic environment that caused a low outflow of residents from Tibet and Xinjiang. At the same time, the implementation of China’s Western development strategy and the pull of rich natural and mineral resources attracted population inflows, leading to this phenomenon. At the same time, simply using the net flow rate to represent the regional population flow is not comprehensive enough to explore its relationship with economic development. Therefore, this paper divides the net turnover rate into two parts, the inflow rate and the outflow rate, to further explore the relationship between spatial patterns and regional economic development. Figure 2 depicts the inter-provincial population inflow from 2000 to 2020 and divides the 31 provinces into 6 levels.
Figure 2 reveals that Beijing, Tianjin, Zhejiang, Guangdong, and Hainan are the main choices for population inflows. However, changing trends can also be observed in Heilongjiang, Jilin, Liaoning, and other northeastern regions, as well as in Gansu, Sichuan, Guizhou, Hunan, Jiangxi, Anhui, and Shandong. The inflow rate of the population in central and western regions such as Hebei and Hebei has increased significantly, which has played a role in diversion and return. This is reflected in the seventh national population dataset. The data of the seventh national census show that China’s inter-provincial population mobility model is still mainly focused on the eastern region, but the proportion has decreased from 84.6% (2005) to 73.54% (2020), a decrease of about 11 percentage points, of which the central region (including the northeast region) and the western region have absorbed 6.5% and 3.5%, respectively [37]. This is mainly because the adjustment of the industrial structure in the eastern region has shifted resource-intensive and labor-intensive industries to the central and western regions, causing this part of the workforce to flow to the Midwest, forming the role of diversion and return, representing new characteristics of the return of labor from the eastern coastal areas to the central and western regions [38]. In addition, the calculation shows that the inter-provincial floating population concentration index dropped from 51.73% in 2000 to 46.60% in 2020, which also proves that the inter-provincial population inflows show a decentralization trend. Figure 3 displays the inter-provincial population outflow from 2000 to 2020 and divides the 31 provinces into 5 levels.
Figure 3 reveals that the population loss in inland and some western provinces is still the most serious and presents a continuous loss situation. Among them, Anhui is the province with the largest population loss, followed by Jiangxi and Guizhou, but the overall distribution pattern of the inter-provincial outflow population only changes slightly. The basic situation of the central and western regions still being the main sources of population outflow has not changed.
In addition, by comparing Figure 2 and Figure 3, it can be found that the ranges of inter-provincial inflow rates from 2000 to 2020 were 23.24%, 62.72%, and 69.91%, and the ranges of outflow rates were 8.17%, 12.99%, and 17.90%, respectively. The extreme difference between the outflow rate and the inflow rate shows a significant upward trend, indicating that the inter-provincial population outflow and inflow gap between different regions in China is increasing year by year. This gap is much larger than the population outflow, which also shows that the change in China’s net population flow rate depends to a large extent on the change in the inter-provincial population inflow rate.

3.2. Data Verification

To verify whether the calculation results are in line with the real situation of each province, this study selects the sixth census dataset and uses the above method to calculate the inter-provincial outflow population in 2010, and then calculates the difference between the calculated value and the real value. Through calculation, the total difference between the real value and the estimated value of the outflow population this year is −6.723%, the average error of each province is about −0.216%, and the estimated error range is probably controlled between −8.5% and 5.6%. It can be concluded that the test data error is generally controlled within the effective range, and the measured data are basically consistent with the real data as a whole, so the calculation method is practical and effective.

3.3. Impact of Inter-Provincial Floating Population on Regional Economic Development

3.3.1. Descriptive Statistics of Variables

This study provides descriptive statistics on the variables in the measurement model (Table 1).

3.3.2. Regression Analysis of the Net Floating Population and Economic Development

Comparing the fixed -effect and random-effect methods through the Hausman test, the p value obtained is 0.6284, which indicates that the random effects method is more effective than the fixed effects method. However, the LM test is used to differentiate between mixed regression and random effects. The p-value of the LM test is 0.3409, indicating that the null hypothesis of “there is no individual random effect” cannot be rejected, i.e., mixed effects are considered to be chosen between random effects and mixed effects. Similarly, when comparing fixed effects and mixed regression, the F test p value is 0.447, and the null hypothesis cannot be rejected, i.e., mixed regression is considered to be significantly better than fixed regression. Furthermore, using the clustering robust error LSDV method, we found that the p-values of most individual dummy variables are large, so mixed regression should be used.
In order to overcome the endogeneity problem, which leads to biased estimation, the model is further estimated using the generalized moment estimation method (GMM). The premise of using the instrumental variable method is that the instrumental variable is valid. For this purpose, an over-identification test is performed to examine whether the instrumental variable is exogenous—that is, it has nothing to do with the disturbance term. The over-identification test shows that the p-value results are 0.6795 and 0.6246, indicating that the instrumental variables are all exogenous. The specific calculation results of Stata software are shown in Table 2.
Table 2 reveals that the inter-provincial net mobility rates passed the 5% significance test and have a positive impact on regional total output. The results are the same as their theoretical derivation structures. Similarly, the inter-provincial inflow rate also passed the 5% significance test and has a positive impact on per capita output. The result also shows that the impact of fixed asset investment on regional total output and per capita output passed the 5% significance test, and all regression coefficients are significantly positive, which shows that capital investment has a significant impact on the economy. Comparing the regression coefficients of all other variables, this study finds that fixed asset investment has the greatest impact on regional GDP and per capita output. However, fixed investment has a positive effect on regional economic growth [39]. Moreover, the impact of the total regional population on regional total output and per capita output passed the 5% significance test. Likewise, the results are still consistent with the theoretical model. The total regional population has different effects on regional total output and per capita output. Analysis shows that the total regional population has a positive impact on the total regional output, while it has a significant negative impact on per capita output. The first-order lagged regional total output and per capita output both passed the 10% significance test, and the influence coefficients were both positive.

3.3.3. The Impact of Inter-Provincial Inflows and Outflows on Regional Economic Development

Based on the empirical models in Formulas (20) and (21), we employed Stata software to explore the impact of interprovincial population inflow and outflow rates on regional economic development. The specific results of Stata software are shown in Table 3.
Table 3 reveals that the inter-provincial inflow rates passed the 1% significance test, showing a positive impact on the regional total output. The inter-provincial outflow rates passed the 10% significance test, showing a negative impact on the regional total output. The results of the case analysis are consistent with the theoretical derivation structure is the same. Empirical results based on the assumed parameters of the econometric model (Formula (15)) identify the scale effect of the floating population on regional economic growth—that is, population inflow increases the population in the destination, population agglomeration improves the local labor force structure, improves the stock of human capital, and promotes the upgrading of the regional industrial structure, thus increasing the total output of the region [39], while population outflow reduces the population at the destination, causing the region’s total output to decline.
Similarly, the inter-provincial inflow rates passed the 1% significance test, showing a positive impact on per capita output. The inter-provincial outflow rates passed the 10% significance test, showing a negative impact on per capita output. The econometric model (Formula (16)) and empirical results show that population inflow and outflow have structural effects, i.e., the inflow and outflow of people change the regional population, causing the total regional output to increase or decrease. At the same time, the structural differences in the floating population are accurately identified by the example model. An increase in the inflow population will increase the production efficiency of the place of origin, resulting in an increase in per capita output, while the outflow population will reduce the population base of the place of departure, but it will not increase the per capita output. The structural difference in high production efficiency causes this part of the outflow population to have a negative impact on the per capita output of the place of departure.
Table 3 further reveals that the impact of fixed asset investment on regional total output and per capita output passed the 1% significance test, and all regression coefficients are significantly positive, which shows that capital investment will have a significant impact on the economy. Comparing the regression coefficients of all other variables, we can find that fixed asset investment has the greatest impact on regional GDP and per capita output. Moreover, the impact of the total regional population on regional total output and per capita output passed the 1% significance test. The results are still consistent with the theoretical model. The total regional population has different effects on regional total output and per capita output. The impact analysis shows that the total regional population has a positive impact on the total regional output, while it has a significant negative impact on per capita output. Furthermore, the first-order lagged regional total output and per capita output both passed the 1% significance test, and the influence coefficients were both positive. This shows that the higher the total output of the previous period, the higher the total output of the current period, which means that the inertial effect of economic growth is significant, and it also means that the more economically developed regions have inherent advantages over the economies of backward regions.
There is a certain two-way effect between regional population mobility and economic development. Population inflow has a significant promotional effect on the economic development of the place of inflow. The large-scale population inflow means the complement and enrichment of human resources in the region, driving regional economic development. At the same time, Ravenstein [21] proposed the law of population migration and mentioned that economic reasons are the main causes of population migration, and economic development brings a large number of job opportunities and makes it easier to attract population inflow. This easily creates a siphon effect where more and more people gather in these high-density urban areas. The lack of human resources caused by population outflow in the outflow area will inhibit the region’s economic development. There may be a vicious cycle between continued population outflow and economic development, where the low capital output rate leads to brain drain, further intensifying the vicious cycle [40].

3.3.4. Differential Impact of Inter-Provincial Floating Population on Regional Economic Development

In order to further examine whether the floating population has differential impacts on regions with different levels of economic development [41], this study introduces the cross-term of mobility variables and urban density for analysis. Based on empirical formulas (Formulas (22)–(25)), the calculated results using Stata software are shown in Table 4.
Equations (1) and (3) in Table 4 show the cross-term of the inter-provincial inflow rate and urban density and indicate whether it is in the model with regional total output as the explained variable or in the model with per capita output as the explained variable. Table 4 reveals that there is no significant difference in the impact of population inflow on economic development between high-density areas and low-density areas. Further, the results of Equation (2) show that the cross-term between the inter-provincial outflow rate and urban density is significant both in the model with regional total output as the explained variable and in the model with per capita output as the explained variable. However, there is a significant difference in the impact of population outflow on economic development between high-density and low-density areas. Among them, the negative impact of out-migration on low-density areas is greater than that on high-density areas. The results of Equation (4) show that the inter-provincial outflow rate has a negative impact on the per capita output level.
The above discussion shows a weak negative impact on high-density areas, and the impact on low-density areas is greater than that on high-density areas. Analysis of other variables like capital investment demonstrates that they have a positive impact on regional total output and per capita output, and an increase in capital will simultaneously promote regional economic development. The total population has a positive impact on regional total output, and per capita output has a negative effect. The lag period shows a significant positive impact on both regional total output and per capita output. Therefore, the conclusions obtained through empirical analysis in this article are consistent with the results derived from the previous theoretical model.

4. Discussion

The southeastern coastal regions of China, such as Guangdong, Jiangsu, and Zhejiang, are major population inflow areas, whereas central regions like Henan and Anhui experience high population outflow. The southeastern regions possess strong economic capabilities and efficient operations, with economic outputs and per capita GDP leading the nation. These regions have diversified economies dominated by manufacturing and services. The Pearl River Delta and Yangtze River Delta are key hubs for manufacturing and high-tech industries, creating substantial employment opportunities. According to the China Statistical Yearbook 2020, Guangdong’s tertiary industry employs 60 million people, accounting for 60% of the province’s total employment. These regions also have higher wage levels; for instance, the average salary in Guangdong is CNY 89,000, while in Henan, it is only CNY 55,000 [42]. The significant wage disparity drives the labor force to migrate to higher-paying areas for better income and living conditions. Additionally, high GDP and per capita GDP correlate with higher urbanization rates and better urban infrastructure. According to the “China Statistical Yearbook 2020”, Guangdong’s urbanization rate is 71.03%, Jiangsu’s is 72.63%, while Henan’s is only 51.66%. High urbanization rates mean better urban infrastructure and public services, such as quality education and healthcare, which attract large population inflows [43,44].
Conversely, central regions like Henan and Anhui exhibit lower per capita GDP—approximately CNY 41,000 in Henan and CNY 52,000 in Anhui—reflecting slower economic development, lower resident income, and poorer living standards. This economic performance leads to insufficient economic attractiveness, compelling the workforce in these regions to migrate to more economically developed areas in search of better opportunities. The relatively low per capita GDP and lagging economic development in these central provinces result in high population outflow rates [45]. Notably, the southeastern coastal regions of China, with their robust economic indicators, diverse industrial structures, high wage levels, and advanced urbanization, serve as significant population inflow areas. In contrast, due to their relatively low per capita GDP and slower economic growth, central provinces like Henan and Anhui experience high population outflow rates.
Interprovincial migrant populations significantly impact the supply and demand dynamics of the labor market in China [15]. Cross-provincial migration enhances productivity and economic efficiency by increasing the labor supply and labor market participation. The influx of lower-human-capital groups fills gaps in low-skilled and labor-intensive jobs in high-density urban areas, promoting regional economic growth [16]. Meanwhile, high-human-capital groups, unable to obtain high wages in low-density urban areas, proactively migrate to high-density urban areas [17]. The diverse backgrounds and advanced skills of these migrants contribute to regional technological innovation, particularly in science and engineering fields, thereby positively impacting economic growth. With favorable economic opportunities and a well-established legal system, human capital significantly boosts per capita GDP growth [46,47]. However, the influx of large numbers of cross-provincial migrants poses significant challenges to infrastructure and services in high-density urban areas. Increased demand for housing, public transportation, and basic services, coupled with environmental pollution due to high population density, can strain urban resources and lead to management crises [48,49]. The urban challenges induced by the migrant population create a “forcing mechanism” that compels local governments to implement policy interventions. The government leverages think tanks and substantial local finances to conduct forward-looking research and planning for future urban development. Through systematic and comprehensive policy measures, the sustainability of urban development can be enhanced. This includes ensuring basic housing conditions, improving public infrastructure services, promoting social inclusion and community integration, and enhancing environmental risk management. These efforts contribute effectively to the achievement of SDG-11. Given the above research findings, this paper puts forward the following policy recommendations:
(1)
For the low-density areas in the inland central and western regions, against the background of the two drivers of urbanization and rural revitalization, the government should fully seize the opportunity window of population return and industrial gradient transfer and accelerate the transformation of the economic growth mode in order to achieve the Sustainable Development Goal (SDG-8) based on improving development quality. At the same time, the government must also use policies as “gravity” to implement active and effective talent introduction policies to activate the talent engine, so that returning talents can settle down and stay stable, and eliminate the vicious cycle between continuous brain drain and economic development.
(2)
For high-density areas along the eastern coast, a two-pronged approach of “introduction” and “diversion” should be advocated for in population control, transferring mid- to low-end industries. Further guiding low-skilled labor to flow to low-density areas with higher environmental carrying capacity to balance population distribution patterns in encouraged in order to alleviate the pressure of overpopulation and strained public resources in high-density urban areas. The government should focus on improving the level of public services, improving urban environmental governance, optimizing the urban living environment, and striving to create green and livable modern low-density cities, which will be conducive to realizing SDG-11.
(3)
Household registration and social security policies significantly impact population mobility. Strict household registration systems can restrict the free movement of people between different regions, while relaxing these restrictions can facilitate population mobility. For example, China’s ongoing reforms to its household registration system are gradually easing settlement conditions in cities, especially in small and medium-sized cities, to promote population mobility and urbanization. This approach helps to encourage the return of migrant populations to low-density areas and improves the service management level for migrant populations in high-density areas. It ensures that migrants enjoy equal rights with local residents regarding employment, education, healthcare, and housing, thereby reducing institutional barriers.
(4)
In the process of policy formulation, the government should thoroughly understand and respect the regularity of population mobility, avoiding excessive intervention. By leveraging data analysis and research, the government needs to identify the economic and social factors influencing population movement and develop policies that align with these patterns to support and encourage voluntary migration. Additionally, considering that economic and social environments are dynamic and that the patterns of population mobility will evolve accordingly, policy formulation must possess dynamic adaptability. It is essential to establish a regular policy evaluation mechanism that involves data collection, analysis, and feedback to assess the actual effectiveness of policies. Based on the evaluation results, policies should be flexibly adjusted to ensure alignment with real-world conditions, thereby enhancing the sustainability of these policies.
To enhance the robustness and comprehensiveness of the analysis, future research should incorporate policy analysis to examine the impact of specific policy measures on regional migration and economic development, including both restrictive and supportive policies. Longitudinal studies are needed to assess the long-term impacts of migration on regional economies, including the integration of migrants and the sustainability of economic growth. Utilizing micro-level data to capture individual migrant experiences and regional variations would provide a more nuanced understanding of migration impacts. Additionally, exploring the long-term effects of the COVID-19 pandemic on regional migration patterns and economic recovery, considering both immediate disruptions and longer-term adaptations, is crucial [50].

5. Conclusions and Limitations

Based on the data of the fifth, sixth, and seventh national censuses, this paper studies the temporal and spatial characteristics of the inter-provincial floating population through theoretical model derivation, a GMM model, and the cross-term method for the 31 provincial-level administrative units in mainland China, except for Hong Kong, Macao, and Taiwan. Based on the empirical results, the following conclusions have been drawn:
(1)
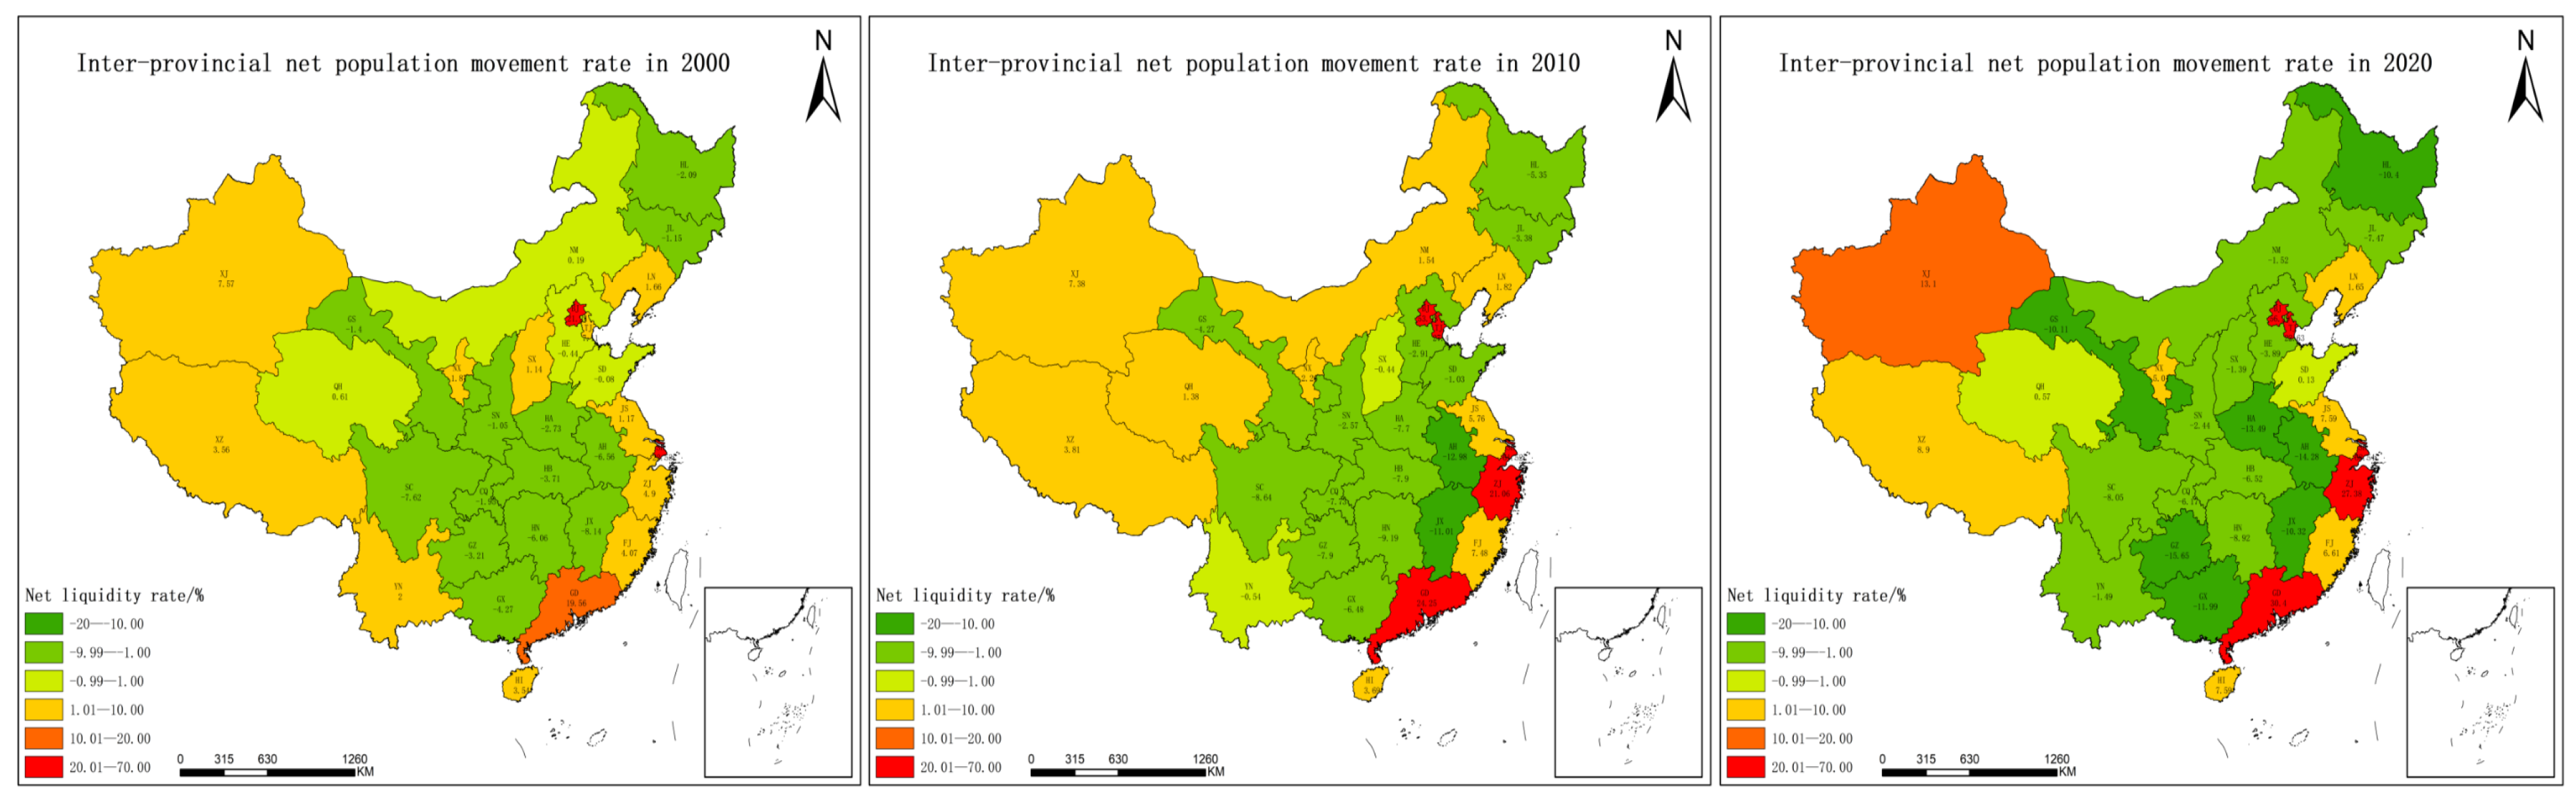
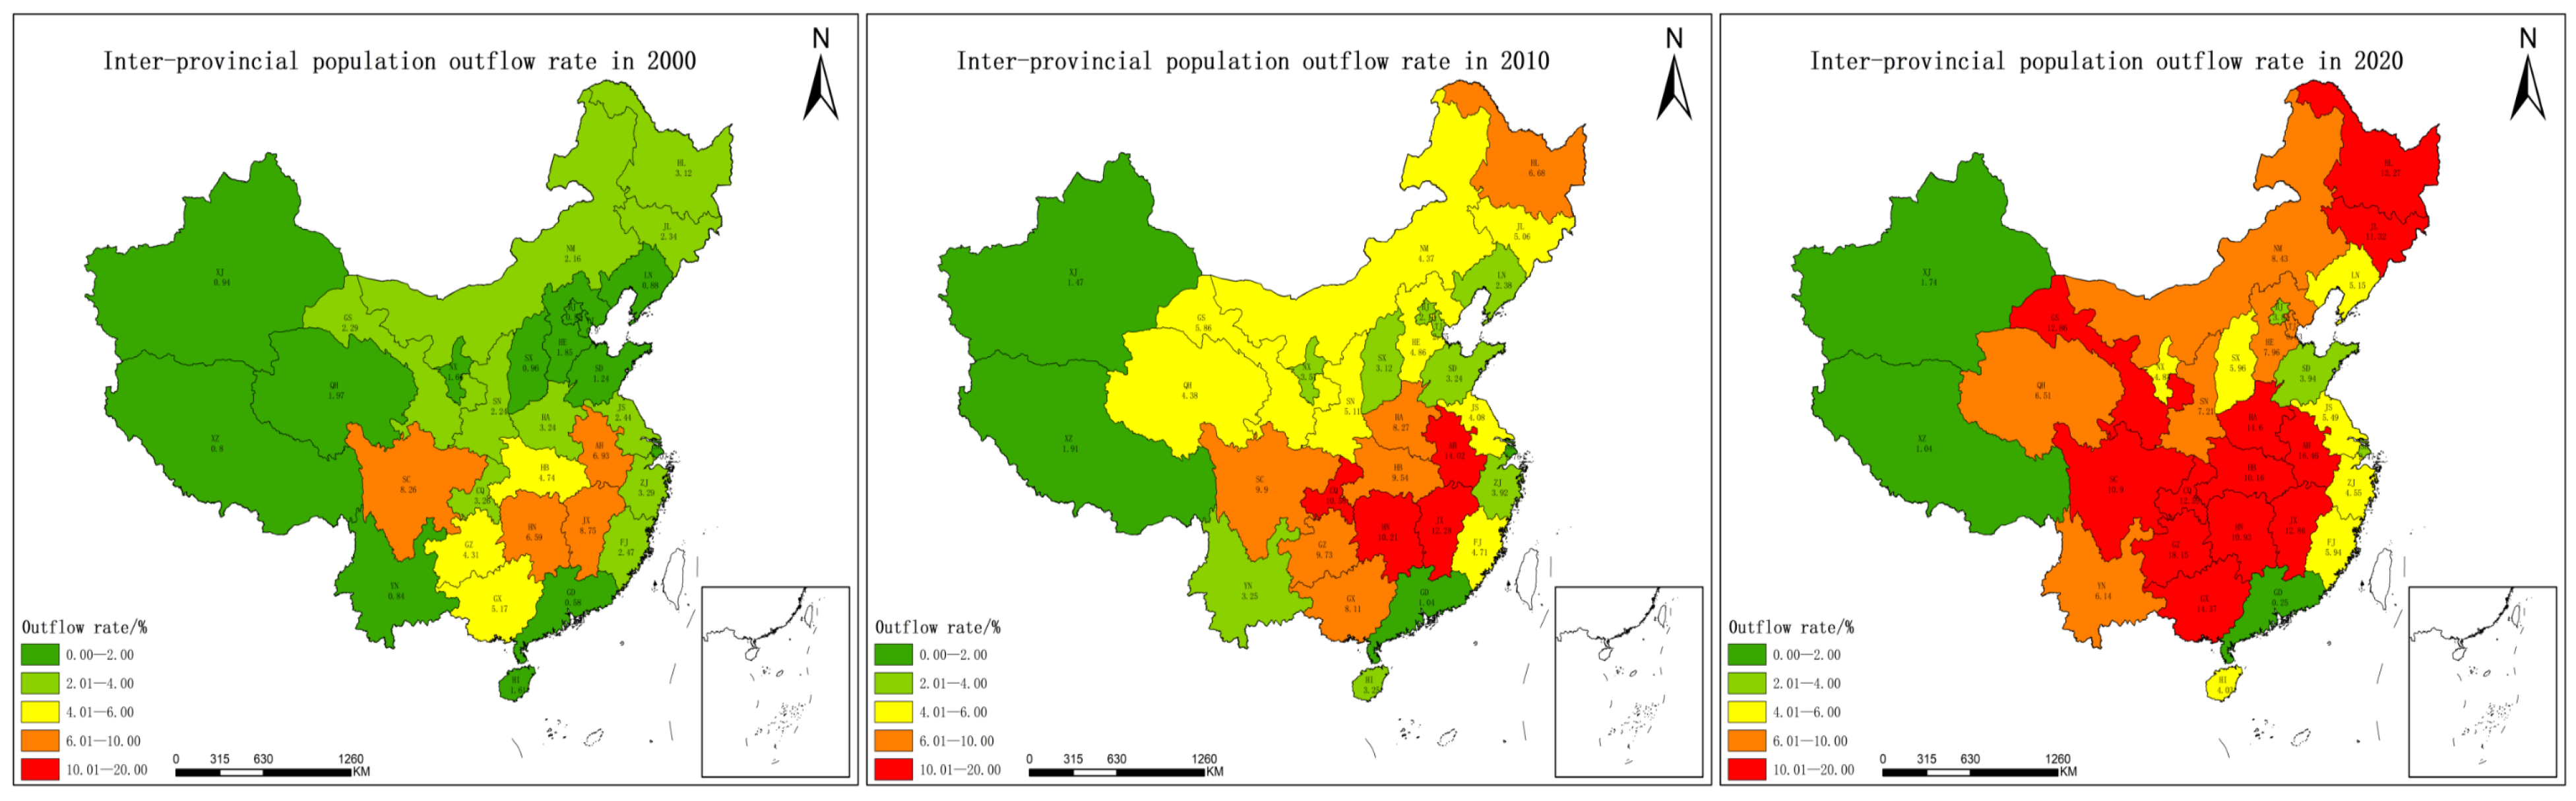
The size of the migrant population under study is constantly increasing, but the spatial pattern of population mobility has not changed significantly. The overall pattern is still “low in the middle and high at both ends”, although the central region is still the main source of population outflow.
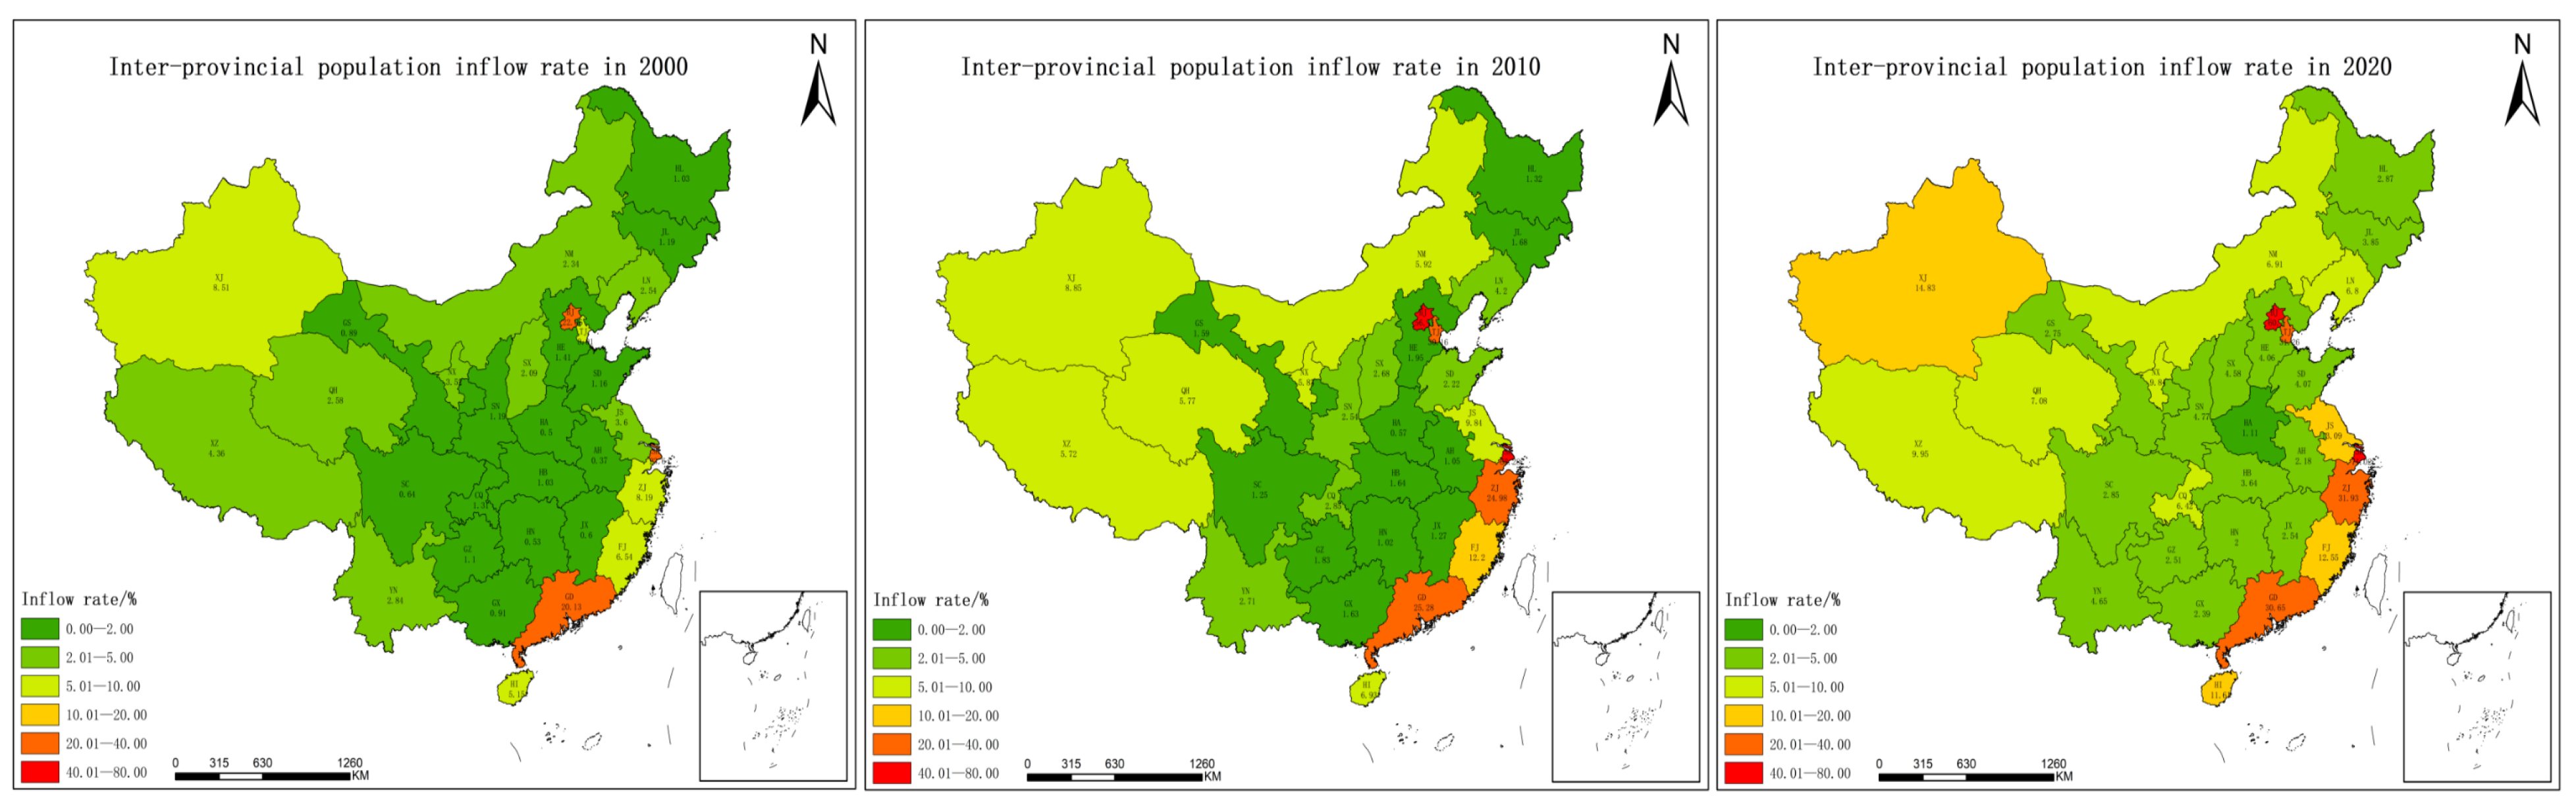
(2)
The net inflow of inter-provincial migrants is mainly concentrated in two areas—firstly, the high-density area along the southeastern coast, and secondly, the western regions such as Xinjiang and Tibet—while most central provinces show varying degrees of sustained net population outflow losses.
(3)
The net migrant population has a significant promoting effect on the total regional output and per capita output. The inflow population has a significant promoting effect on the total output and per capita output of the place of inflow.
(4)
The outflow population has a significant effect on the total output and per capita output of the place of outflow. Migration shows a significant inhibitory effect.
(5)
The floating population has scale and structural effects on regional economic development. It affects regional economic development by changing the regional population and affecting regional production efficiency.
(6)
There is a certain two-way effect between regional population mobility and economic development. The population inflow has no significant differential impact on high-density and low-density areas, while the out-migration population has a significant differential impact.
(7)
The negative impact of the out-migration population on low-density areas is greater than that on high-density areas. Due to the lack of talent attraction in low-density areas, the outflow of talent reduces human capital. For high-density areas, a small portion of the out-migration population will appropriately alleviate urban pressure and reduce local fiscal expenditures, thus causing the out-migration population to have a weak negative impact on high-density areas.
Overall, the inter-provincial floating population in the studied region of China plays a crucial role in regional economic development, directly supporting SDG-8 and 11. By facilitating labor mobility, fostering economic growth, reducing inequalities, promoting sustainable urban development, and driving infrastructural improvements, this demographic trend contributes significantly to achieving the Sustainable Development Goals. This study has several limitations. Firstly, it does not consider the impact of various policy measures on regional migration patterns and economic outcomes. Policies like the Hukou system, urban development strategies, and pandemic-related restrictions can significantly influence migration flows and regional economic dynamics. Secondly, the analysis primarily focuses on the immediate effects of inter-provincial migration on economic growth, without thoroughly examining long-term effects, including the sustainability of growth and the integration of migrants into urban economies. Thirdly, the study period does not fully capture the long-term economic and demographic consequences of the COVID-19 pandemic, which introduced unprecedented disruptions to population mobility and economic activities. Finally, using macroeconomic data may overlook micro-level variations and the individual experiences of migrants, which can provide deeper insights into migration’s economic and social implications.

Author Contributions

Z.C. and Z.L. were primarily responsible for writing the manuscript and providing the original data used in this manuscript. K.Z. provided the results of the empirical analysis for the research in this paper. All authors contributed to the article and approved the submitted version. All authors have read and agreed to the published version of the manuscript.

Funding

This work was funded by the Fundamental Research Funds for the Central Universities (B240207112&B240207032).

Institutional Review Board Statement

Not applicable.

Informed Consent Statement

Not applicable.

Data Availability Statement

The data and materials are available from the corresponding author upon reasonable request.

Conflicts of Interest

The authors declare that the research was conducted in the absence of any commercial or financial relationships that could be construed as a potential conflict of interest.

References

  1. Chen, S.; Cao, Z. An Analysis of the Concept and Types of Climate Migration. China Popul. Resour. Environ. 2012, 22, 164–169. [Google Scholar]
  2. Van der Geest, K.; de Sherbinin, A.; Gemenne, F.; Warner, K. Editorial: Climate migration research and policy connections: Progress since the foresight report. Front. Clim. 2023, 5, 1231679. [Google Scholar] [CrossRef]
  3. Jolivet, D.; Fransen, S.; Adger, W.N.; Fábos, A.; Abu, M.; Allen, C.; Boyd, E.; Carr, E.R.; Codjoe, S.N.; Gavonel, M.F.; et al. COVID-19 responses restricted abilities and aspirations for mobility and migration: Insights from diverse cities in four continents. Humanit. Soc. Sci. Commun. 2023, 10, 250. [Google Scholar] [CrossRef] [PubMed]
  4. Qing, H.; Kumar, R.; Kumar, A. Climate change and human migration: Perspectives for environmentally sustainable societies. J. Geochem. Explor. 2023, 256, 107352. [Google Scholar] [CrossRef]
  5. Haas, H.D. Migration and Development: A Theoretical Perspective1. Int. Migr. Rev. 2010, 1, 227–264. [Google Scholar] [CrossRef]
  6. Yang, C.G.; Zeng, Y.M. Spatial Imbalance, Population Flow and Regional Selection of Foreign Direct Investment—Analysis of Interprovincial Spatial Panel Data in China from 1995 to 2010. Popul. Res. 2014, 6, 25–39. [Google Scholar]
  7. Mcleman, R. International migration and climate adaptation in an era of hardening borders. Nat. Clim. Chang. 2019, 9, 911–918. [Google Scholar] [CrossRef]
  8. Jiang, M.; Lu, X. Growth in the Midst of Loss: A Study on Population Mobility and Economic Growth Convergence in Small and Medium-sized Cities. Mod. Econ. Res. 2024, 7, 17–29. [Google Scholar] [CrossRef]
  9. Duan, C.R.; Xie, D.H.; Lu, L.D. Migration and transformation of China’s population. Popul. Res. 2019, 43, 12–20. [Google Scholar]
  10. Ma, X.H.; Duan, C.R.; Guo, J. Comparative study of four types of floating population. Chin. Popul. Sci. 2014, 5, 36–46, 126–127. [Google Scholar]
  11. Ma, J.L.; Li, L. Empirical analysis of the relationship between population mobility and regional economic development—Taking Guyuan CNY City, Ningxia as an example. Northwest Popul. 2006, 19–20. [Google Scholar]
  12. Wang, S.B.; Luo, X.L. Population mobility and urbanization effects in underdeveloped areas—Taking Gansu Province as an example. Urban Probl. 2022, 324, 4–11. [Google Scholar]
  13. Lin, L.Y.; Zhu, Y.; Ke, W.Q. The spatial willingness and policy implications of the return of floating population under the background of coordinated regional development. Geogr. Res. 2021, 40, 1515–1528. [Google Scholar]
  14. Xiao, J.C.; Hong, H. The evolution trend of my country’s inter-provincial population mobility pattern and its urbanization effect. Urban Probl. 2020, 8, 22–32. [Google Scholar]
  15. Chen, J.; Fan, C.C. China’s floating population and its implications for regional development. Asian Surv. 2016, 56, 529–557. [Google Scholar]
  16. Cai, F. The growth and structural changes of China’s employment. J. Comp. Econ. 2011, 39, 42–57. [Google Scholar]
  17. Chan, K.W. China: Internal Migration. In The Encyclopedia of Global Human Migration; Ness, I., Ed.; Wiley-Blackwell: Hoboken, NJ, USA, 2013. [Google Scholar] [CrossRef]
  18. Zhao, Z. Migration and earnings differences: The case of rural China. Econ. Dev. Cult. Chang. 1999, 47, 767–782. [Google Scholar] [CrossRef]
  19. Francesco, C. Drivers of migration: Why do people move? J. Travel Med. 2018, 25, tay040. [Google Scholar] [CrossRef]
  20. D’Adamo, I.; Di Carlo, C.; Gastaldi, M.; Rossi, E.N.; Uricchio, A.F. Economic Performance, Environmental Protection and Social Progress: A Cluster Analysis Comparison towards Sustainable Development. Sustainability 2024, 16, 5049. [Google Scholar] [CrossRef]
  21. Ravenstein, E.G. The laws of migration. J. Stat. Soc. Lond. 1885, 48, 167–235. [Google Scholar] [CrossRef]
  22. Lee, E.S. A theory of migration. Demography 1966, 3, 47–57. [Google Scholar] [CrossRef]
  23. Kazlauskiene, A.; Rinkevicius, L. Lithuanian “brain drain” causes: Push and pull factors. Eng. Econ. 2006, 46, 27–37. [Google Scholar]
  24. Khan, I.; Alharthi, M.; Haque, A.; Illiyan, A. Statistical analysis of push and pull factors of migration: A case study of India. J. King Saud Univ. Sci. 2023, 35, 102859. [Google Scholar] [CrossRef]
  25. Hear, V.N.; Bakewell, O.; Long, K. Push- Pull Plus: Reconsidering the Drivers of Migration. J. Ethn. Migr. Stud. 2018, 6, 927–944. [Google Scholar] [CrossRef]
  26. Yang, D.L.; Li, P.G. The Economic Effect of Population Agglomeration: An Empirical Study Based on Instrumental Variables. Popul. Sci. J. 2019, 3, 28–37. [Google Scholar]
  27. Du, X.M.; Chen, J.B. An Empirical Analysis of the Impact of Population Migration and Flow on the Economy of Various Regions in my country. Popul. Res. 2010, 3, 77–88. [Google Scholar]
  28. Yang, L.; Feng, R.; Cai, D. Study on the Spatio-Temporal Convergence Mechanism and Effects of Population Mobility on Regional High-Quality Economic Development. China Soft Sci. 2024, S1, 172–181. [Google Scholar]
  29. Qiao, X.C.; Huang, Y.H. The Situation of Trans-provincial Floating Population in China—Analysis Based on “Six Census” Data. Popul. Dev. 2013, 1, 13–28. [Google Scholar]
  30. Sun, J.G.; Shi, T.H.; Xu, Q.Q. Population Migration, Wage Changes and Economic Growth—Spatial Econometric Analysis Based on Interprovincial Panel Data. Popul. Dev. 2021, 4, 14–23. [Google Scholar]
  31. Lu, F.G. Has Population Loss Affected Economic Growth in Northeast China?—Based on the Estimation Data of Household Population Loss in Northeast China. Popul. Dev. 2021, 5, 98–110. [Google Scholar]
  32. Wang, H.; Yang, M. Review of high-density urban research and analysis of quantitative indicators. Shandong For. Sci. Technol. 2023, 53, 116–122. [Google Scholar]
  33. Wang, J.J.; Zhang, M.H.; Wang, N.N. Spatial patterns and influencing factors of the distribution of mobile population in China: A study based on county-level census data. J. Popul. 2023, 45, 82–96. [Google Scholar] [CrossRef]
  34. Wang, G.X.; Li, M. The Spatial Interaction Between Inter-provincial Migration and Manufacturing Industry Transfer. Sci. Geogr. Sin. 2019, 39, 183–194. [Google Scholar] [CrossRef]
  35. Dou, X.; Arellano, B.; Roca, J. China’s inter-provincial population flow based on the interaction value analysis. Geogr. Res. 2018, 37, 1848–1861. [Google Scholar]
  36. Hou, Y.F.; Chen, Z.C. Population migration-economic growth convergence puzzle’in China: Based on analysis and testing of neoclassical endogenous economic growth model. China Popul. Resour. Environ. 2016, 26, 11–19. [Google Scholar]
  37. Zhou, H. Stability and Enlightenment of China’s Population Mobility Model—Reflections Based on the Data of the Seventh National Census Bulletin. China Popul. Sci. 2021, 28–41+126–127. [Google Scholar]
  38. He, X.L.; Shi, S.Y. The impact of population mobility on regional economic growth: An empirical analysis based on China’s prefecture-level city panel data. Financ. Econ. 2021, 3, 63–70. [Google Scholar] [CrossRef]
  39. Su, W.Z.; Shen, H.Y. Empirical test of population mobility on economic growth in provincial regions. Stat. Decis.-Mak. 2017, 106–110. [Google Scholar] [CrossRef]
  40. Huang, R.; Liang, Q.J.; Lu, L.C. The relationship between urban population structure and innovation ability—Based on the empirical analysis of Chinese cities. Urban Dev. Res. 2014, 21, 84–91. [Google Scholar]
  41. Cai, X.; Wang, D. The Sustainability of China’s Economic Growth and Labor Contribution. Econ. Res. J. 1999, 10, 62–68. [Google Scholar]
  42. Wang, S.J.; Wang, Z.C. Research on the spatial consistency of population agglomeration and economic agglomeration in China. Demogr. J. 2017, 39, 43–50. [Google Scholar] [CrossRef]
  43. Haider, A.; Jabeen, S.; Rankaduwa, W.; Shaheen, F. The Nexus between Employment and Economic Growth: A Cross-Country Analysis. Sustainability 2023, 15, 11955. [Google Scholar] [CrossRef]
  44. Fleuret, S.; Atkinson, S. Sustainable Cities, Quality of Life, and Mobility-Related Happiness; Springer: Cham, Switzerland, 2023. [Google Scholar] [CrossRef]
  45. Borjas, G.J.; Monras, J. Immigration and the Dynamics of Urban Labor Markets. J. Econ. Geogr. 2017, 17, 503–533. [Google Scholar] [CrossRef]
  46. Rodrik, D. Populism and the economics of globalization. J. Int. Bus. Policy 2018, 1, 12–33. [Google Scholar] [CrossRef]
  47. Ali, M.; Egbetokun, A.; Memon, M.H. Human Capital, Social Capabilities and Economic Growth. Economies 2018, 6, 2. [Google Scholar] [CrossRef]
  48. Glaeser, E.L.; Mare, D.C. Cities and Skills. J. Labor Econ. 2001, 19, 316–342. [Google Scholar] [CrossRef]
  49. Florida, R.; Mellander, C.; Rentfrow, P.J. The Happiness of Cities. Reg. Stud. 2011, 47, 613–627. [Google Scholar] [CrossRef]
  50. Yang, M.; Xie, Z.Y. Impacts of Fighting COVlD-19 on China’s Population Flows: An Empirical Study Based on Baidu Migration Big Data. Popul. Res. 2020, 44, 74–88. [Google Scholar]
Figure 1. Comparison of inter-provincial net population movement rates (%) from 2000 to 2020.
Sustainability 16 07142 g001
Figure 2. Comparison of cross-provincial population inflow rates (%) from 2000 to 2020.
Sustainability 16 07142 g002
Figure 3. Comparison of inter-provincial population outflow rates (%) from 2000 to 2020.
Sustainability 16 07142 g003
Table 1. Descriptive statistical analysis.
VariablesNameMeanStandard DeviationMinimum ValueMaximum Value
Explained variableRegional total output lnY (CNY)8.9561.4044.76611.615
Output per capita lny (CNY)10.0881.0267.94412.013
Explanatory variablesFixed asset investment lnK (100 million CNY)8.3691.5944.15910.989
Total regional population lnP (number)17.2880.89314.77818.651
Inter-provincial inflow rate 11 (%)7.1499.0890.39042.136
Inter-provincial outflow rate 12 (%)5.7414.8550.19321.521
Instrumental variablesRegional average salary lnw (CNY)10.7880.50610.23112.091
* Industrial structure lns (%)3.7310.2383.2424.429
* Industrial structure is obtained by the ratio of the output value of the tertiary industry to the total regional production industry.
Table 2. Regression analysis of net floating population and economic development.
Index ln Y ln y
l 0.016 **0.015 **
(12.549)(10.562)
ln K 0.758 **0.764 **
(33.987)(33.198)
ln P 0.383 **−0.621 **
(12.924)(−20.622)
ln Y t 1
/ ln y t 1
0.068 *0.068 *
(−2.521)(2.520)
c−4.064 **14.096 **
(−10.737)(36.410)
R20.980.964
l is the net population mobility rate, ln K  is the fixed asset investment amount, ln P  is the total regional population, c refers to the constant term, ln Y t 1  indicates the GDP, and ln y t 1  represents the GDP per capita. ** and * indicated in Table 2 represent the significant values at 5% (p < 0.005) and 10% (p < 0.01), respectively, and the t estimator is in the brackets.
Table 3. Regression analysis of floating population and economic development.
Index ln Y ln r y
l 1 0.0221 ***
(0.00361)
0.0113 ***
(0.00265)
l 2 −0.00686 *
(0.00474)
−0.0110 *
(0.00532)
ln K 0.418 ***
(0.0612)
0.401 ***
(0.0667)
ln P 0.406 ***
(0.0511)
−0.318 ***
(0.0622)
ln Y t 1
/ ln y t 1
0.263 ***
(0.0511)
0.305 ***
(0.0562)
c−3.648 ***
(0.432)
9.517 ***
(0.955)
R20.98600.9505
l 1  refers to the population inflow rate, l 2  indicates the population outflow rate, ln K  is the fixed asset investment amount, ln P  is the total regional population, and ln Y t 1 / ln y t 1  indicates the ratio of GDP/GDP per capita. *** and * indicated in Table 3 represent the significant values at 1% (p < 0.001) and 10% (p < 0.01), respectively, and the t estimator is in the brackets.
Table 4. Analysis of cross-terms between floating population and urban density.
IndexlnYlny
Equation (1)Equation (2)Equation (3)Equation (4)
lnK0.398 ***
(0.0641)
0.398 ***
(0.0798)
0.367 ***
(0.0622)
0.373 **
(0.0985)
lnP0.347 ***
(0.0476)
0.319 ***
(0.0376)
−0.327 ***
(0.0640)
−0.229 **
(0.0872)
lnYt−1/lnyt−10.301 ***
(0.0497)
0.427 ***
(0.0740)
0.328 ***
(0.0486)
0.467 ***
(0.0738)
l10.0107
(0.0701)
0.000223
(0.00660)
l2 −0.0337 ***
(0.00701)
−0.0334 ***
(0.00617)
l1density0.00715
(0.00681)
0.0113
(0.00609)
l2density 0.0189 ***
(0.00109)
0.0179 ***
(0.00458)
c−2.347 ***
(0.607)
−2.071 ***
(0.545)
9.654 ***
(0.978)
7.692 ***
(1.227)
R20.9810.9830.9390.921
lnK refers to the fixed asset investment amount, lnP is the total regional population, lnYt−1/lnyt−1 indicates the ratios of GDP/GDP per capita, l1 is the population inflow rate, l2 is the population outflow rate, l1density is the intersection of inflow population and urban density, and l2density is the intersection of outflow population and urban density. *** and ** indicated in Table 4 represent the significant values at 1% (p < 0.001) and 5% (p < 0.05), respectively, and the t estimator is in the brackets.
Disclaimer/Publisher’s Note: The statements, opinions and data contained in all publications are solely those of the individual author(s) and contributor(s) and not of MDPI and/or the editor(s). MDPI and/or the editor(s) disclaim responsibility for any injury to people or property resulting from any ideas, methods, instructions or products referred to in the content.

