
Optimal Design Alternatives of Guide Signs for Expressway Segments with Consecutive Dense Exits

Abstract
1. Introduction
2. Experimental Design
2.1. Experimental Environment
2.2. Participants
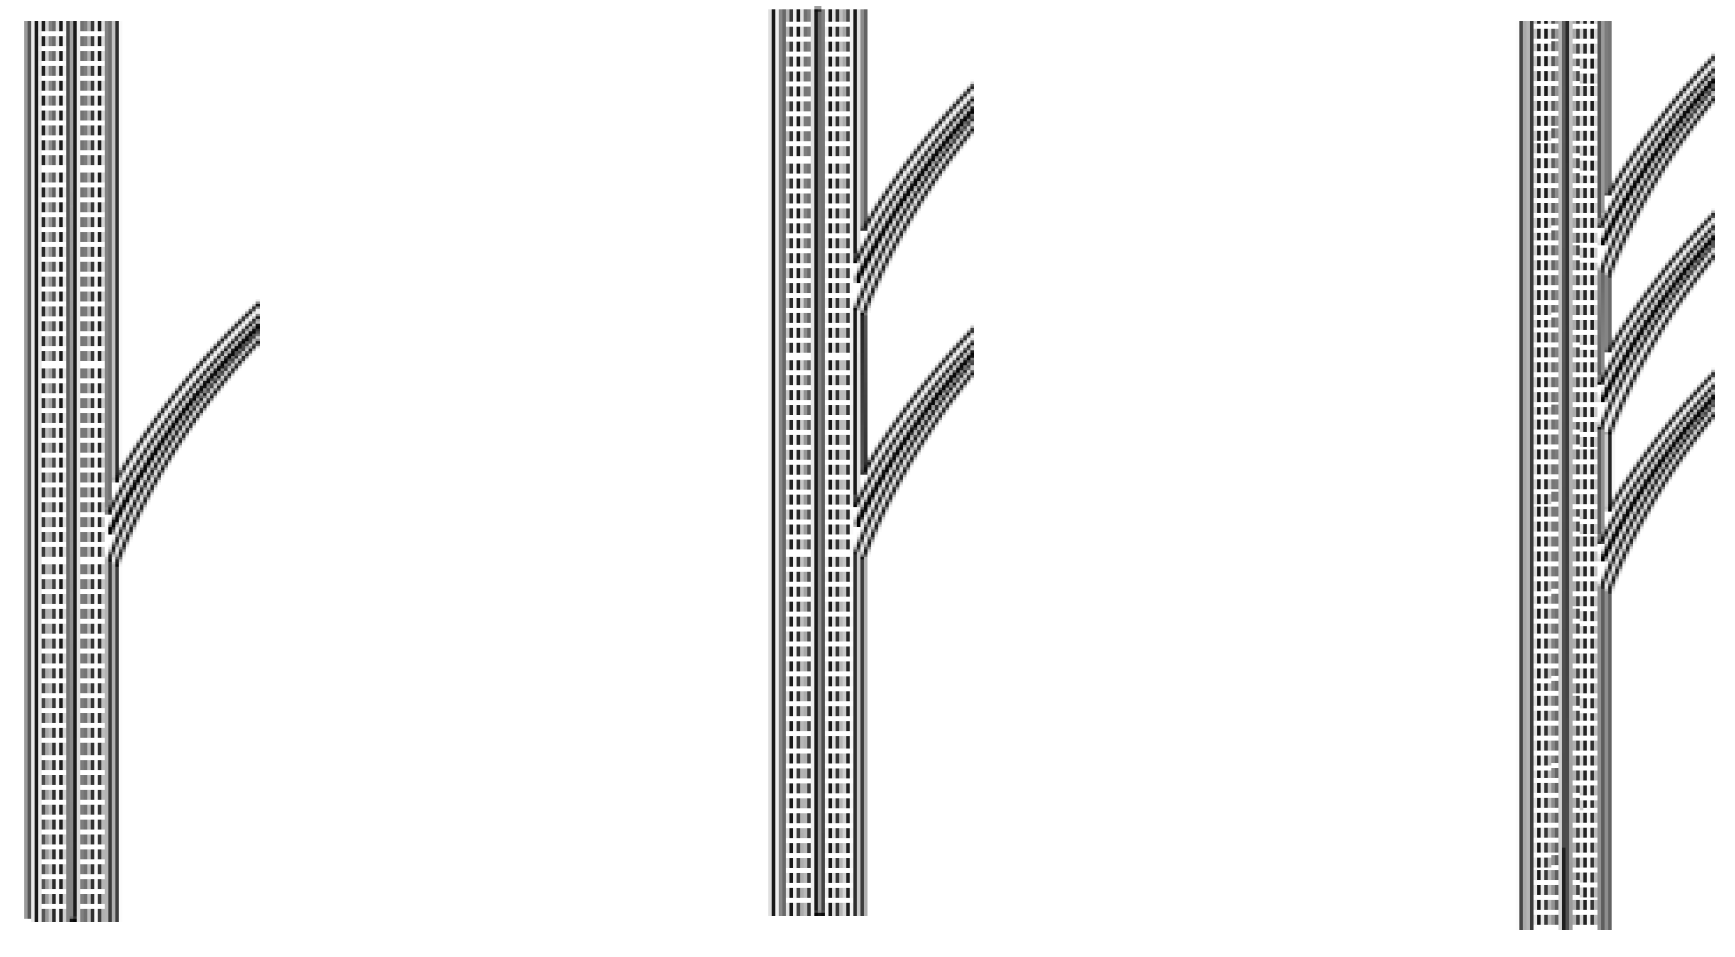
2.3. Experimental Scenarios
2.4. Experimental Method
- (1)
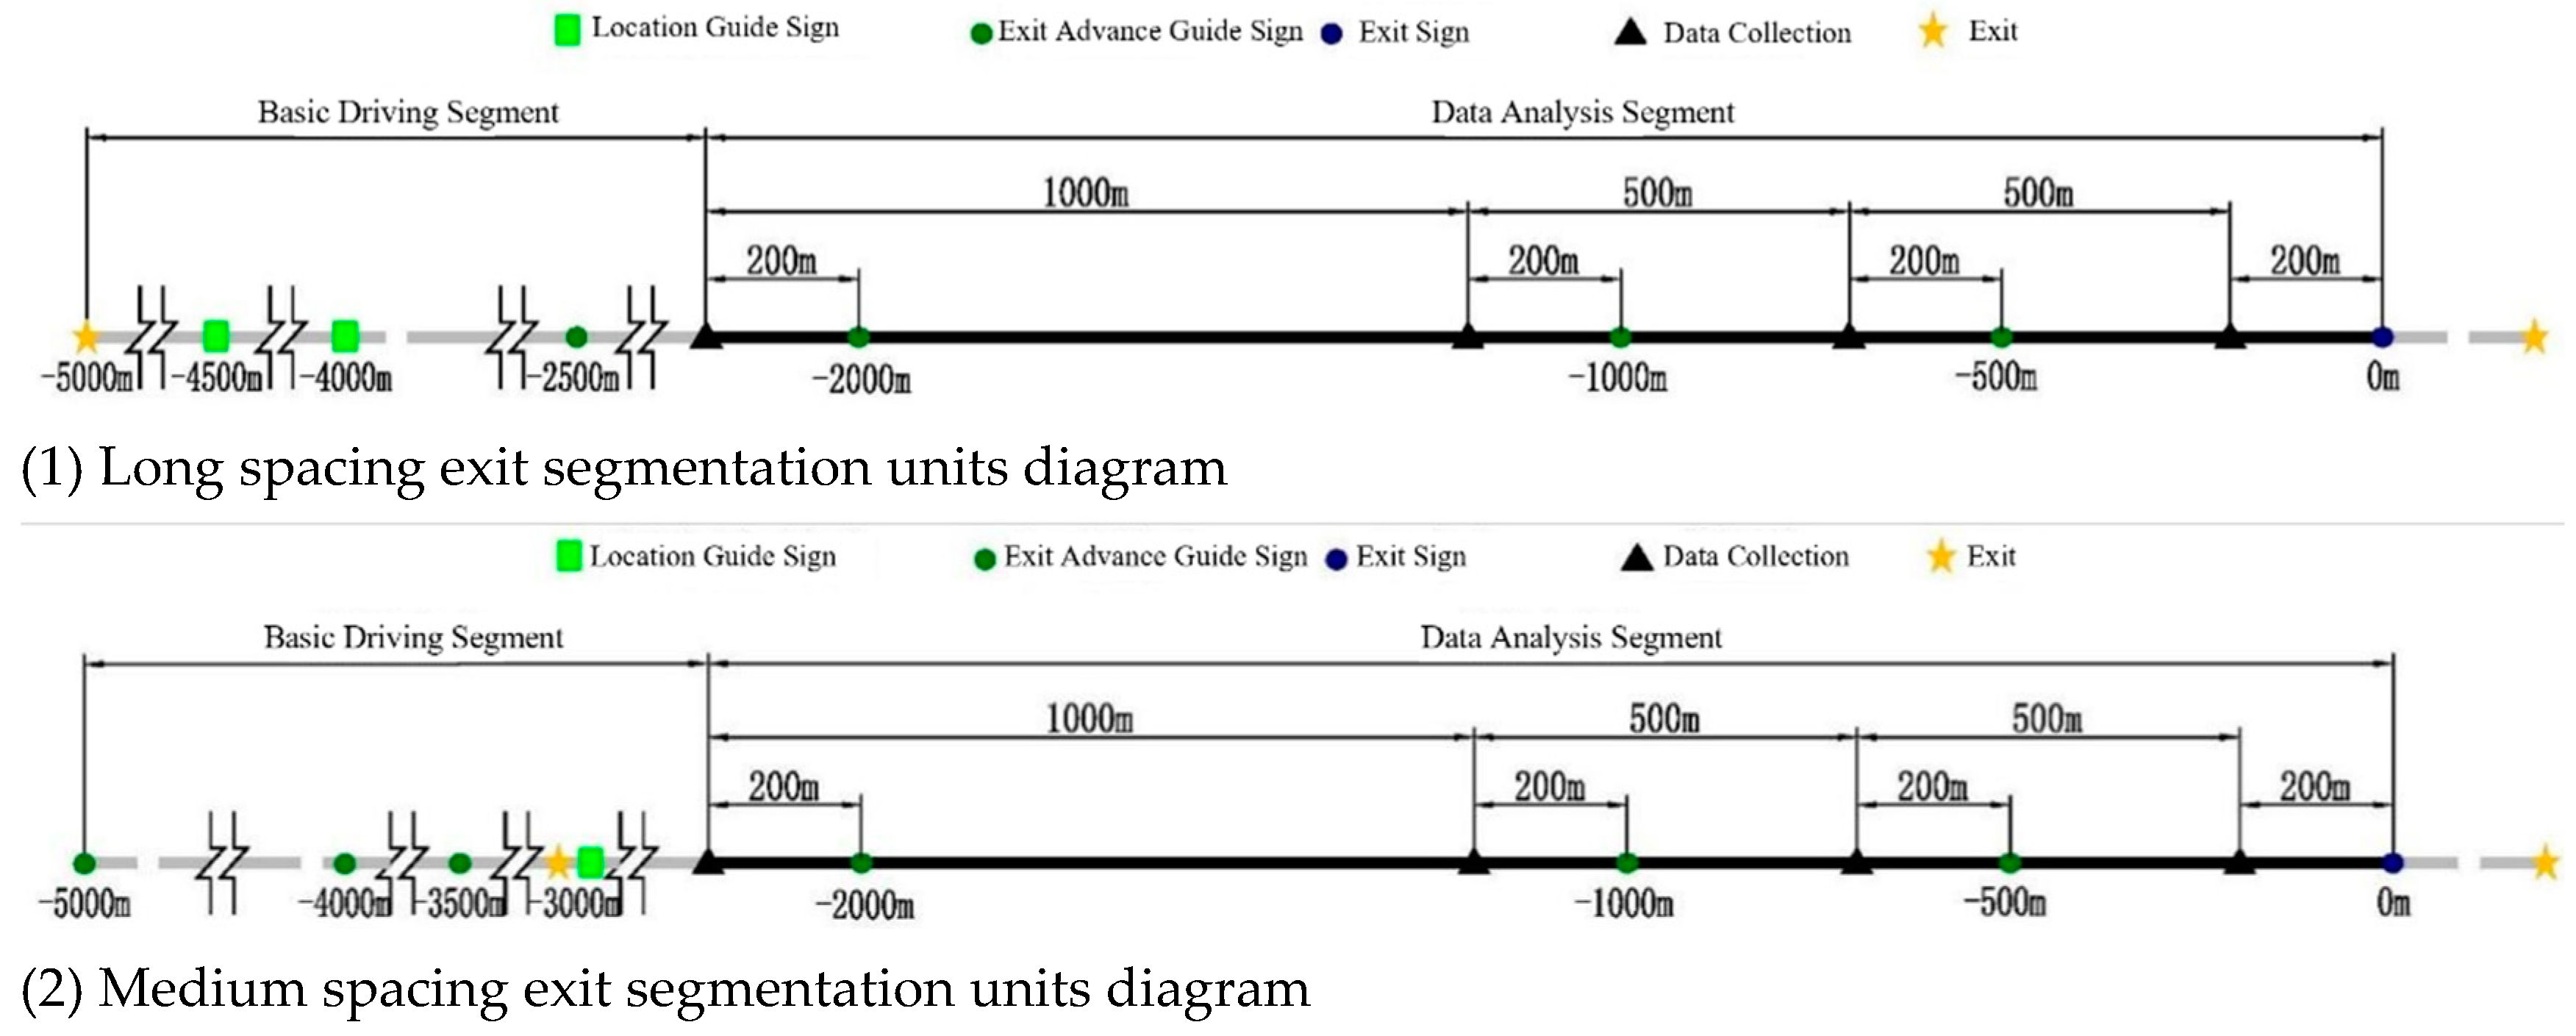
- Dense exit ramp spacing variable: This variable represents the distance between consecutive adjacent exits on the same side of the mainline. It is measured from the endpoint of the deceleration lane of one exit ramp to the starting point of the deceleration lane of the adjacent exit ramp. Based on relevant researches, the long, medium, and short spacing are defined as 5 km, 3 km, and 2 km, respectively.
- (2)
- Guide sign design scheme variable: This variable concerns the quantity, location, and combination of the “Location guide signs group + Multilevel advance signs group”. The specific considerations are as follows:
- (i)
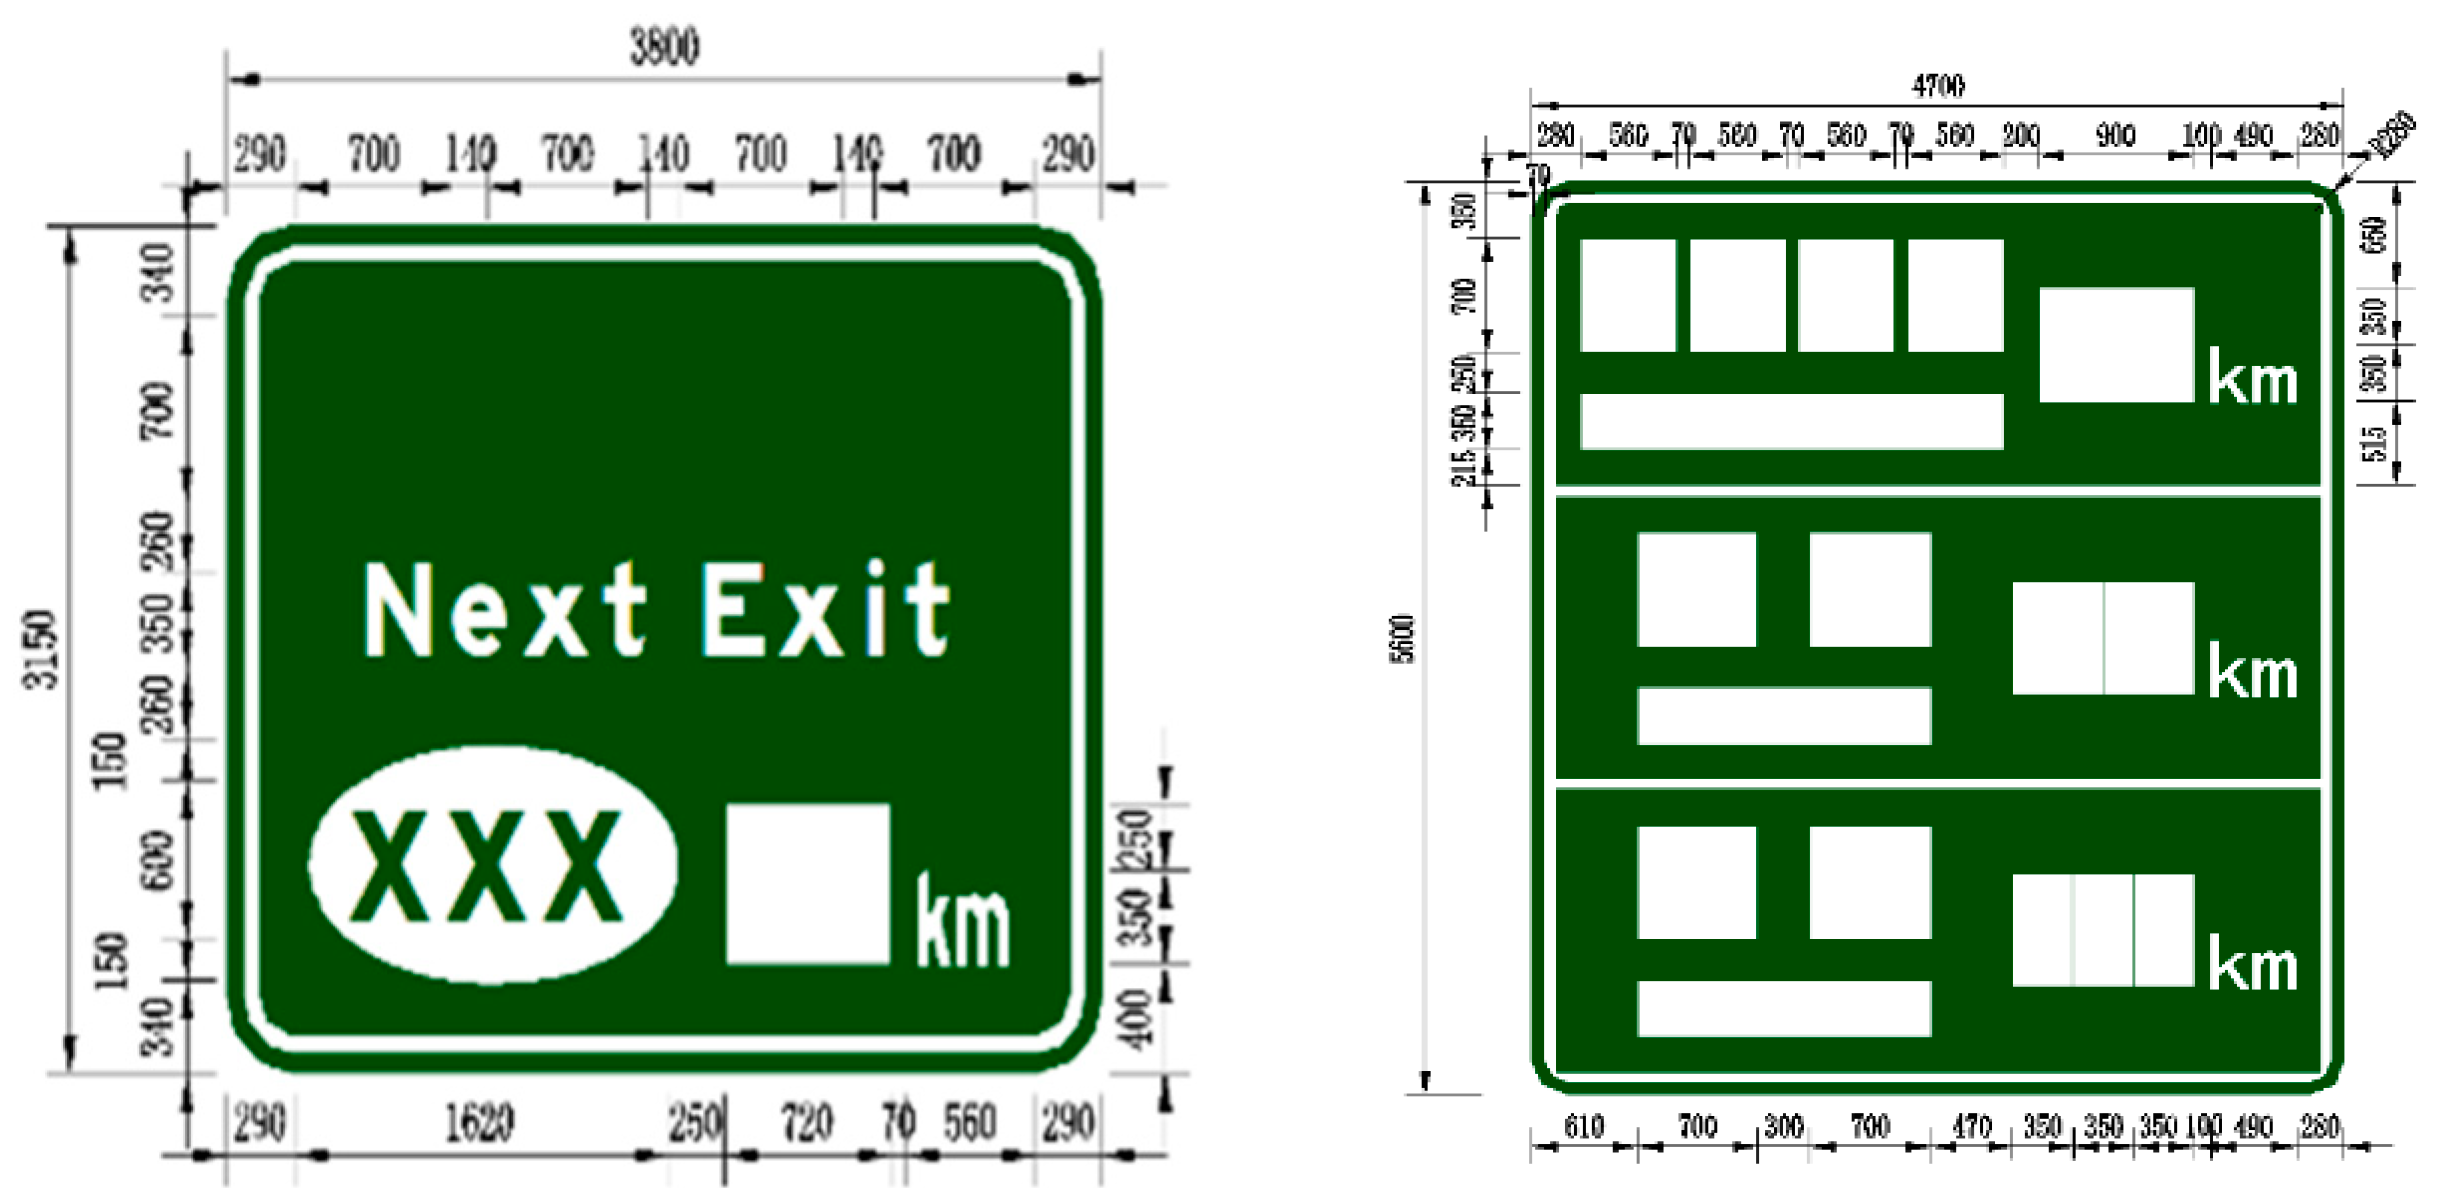
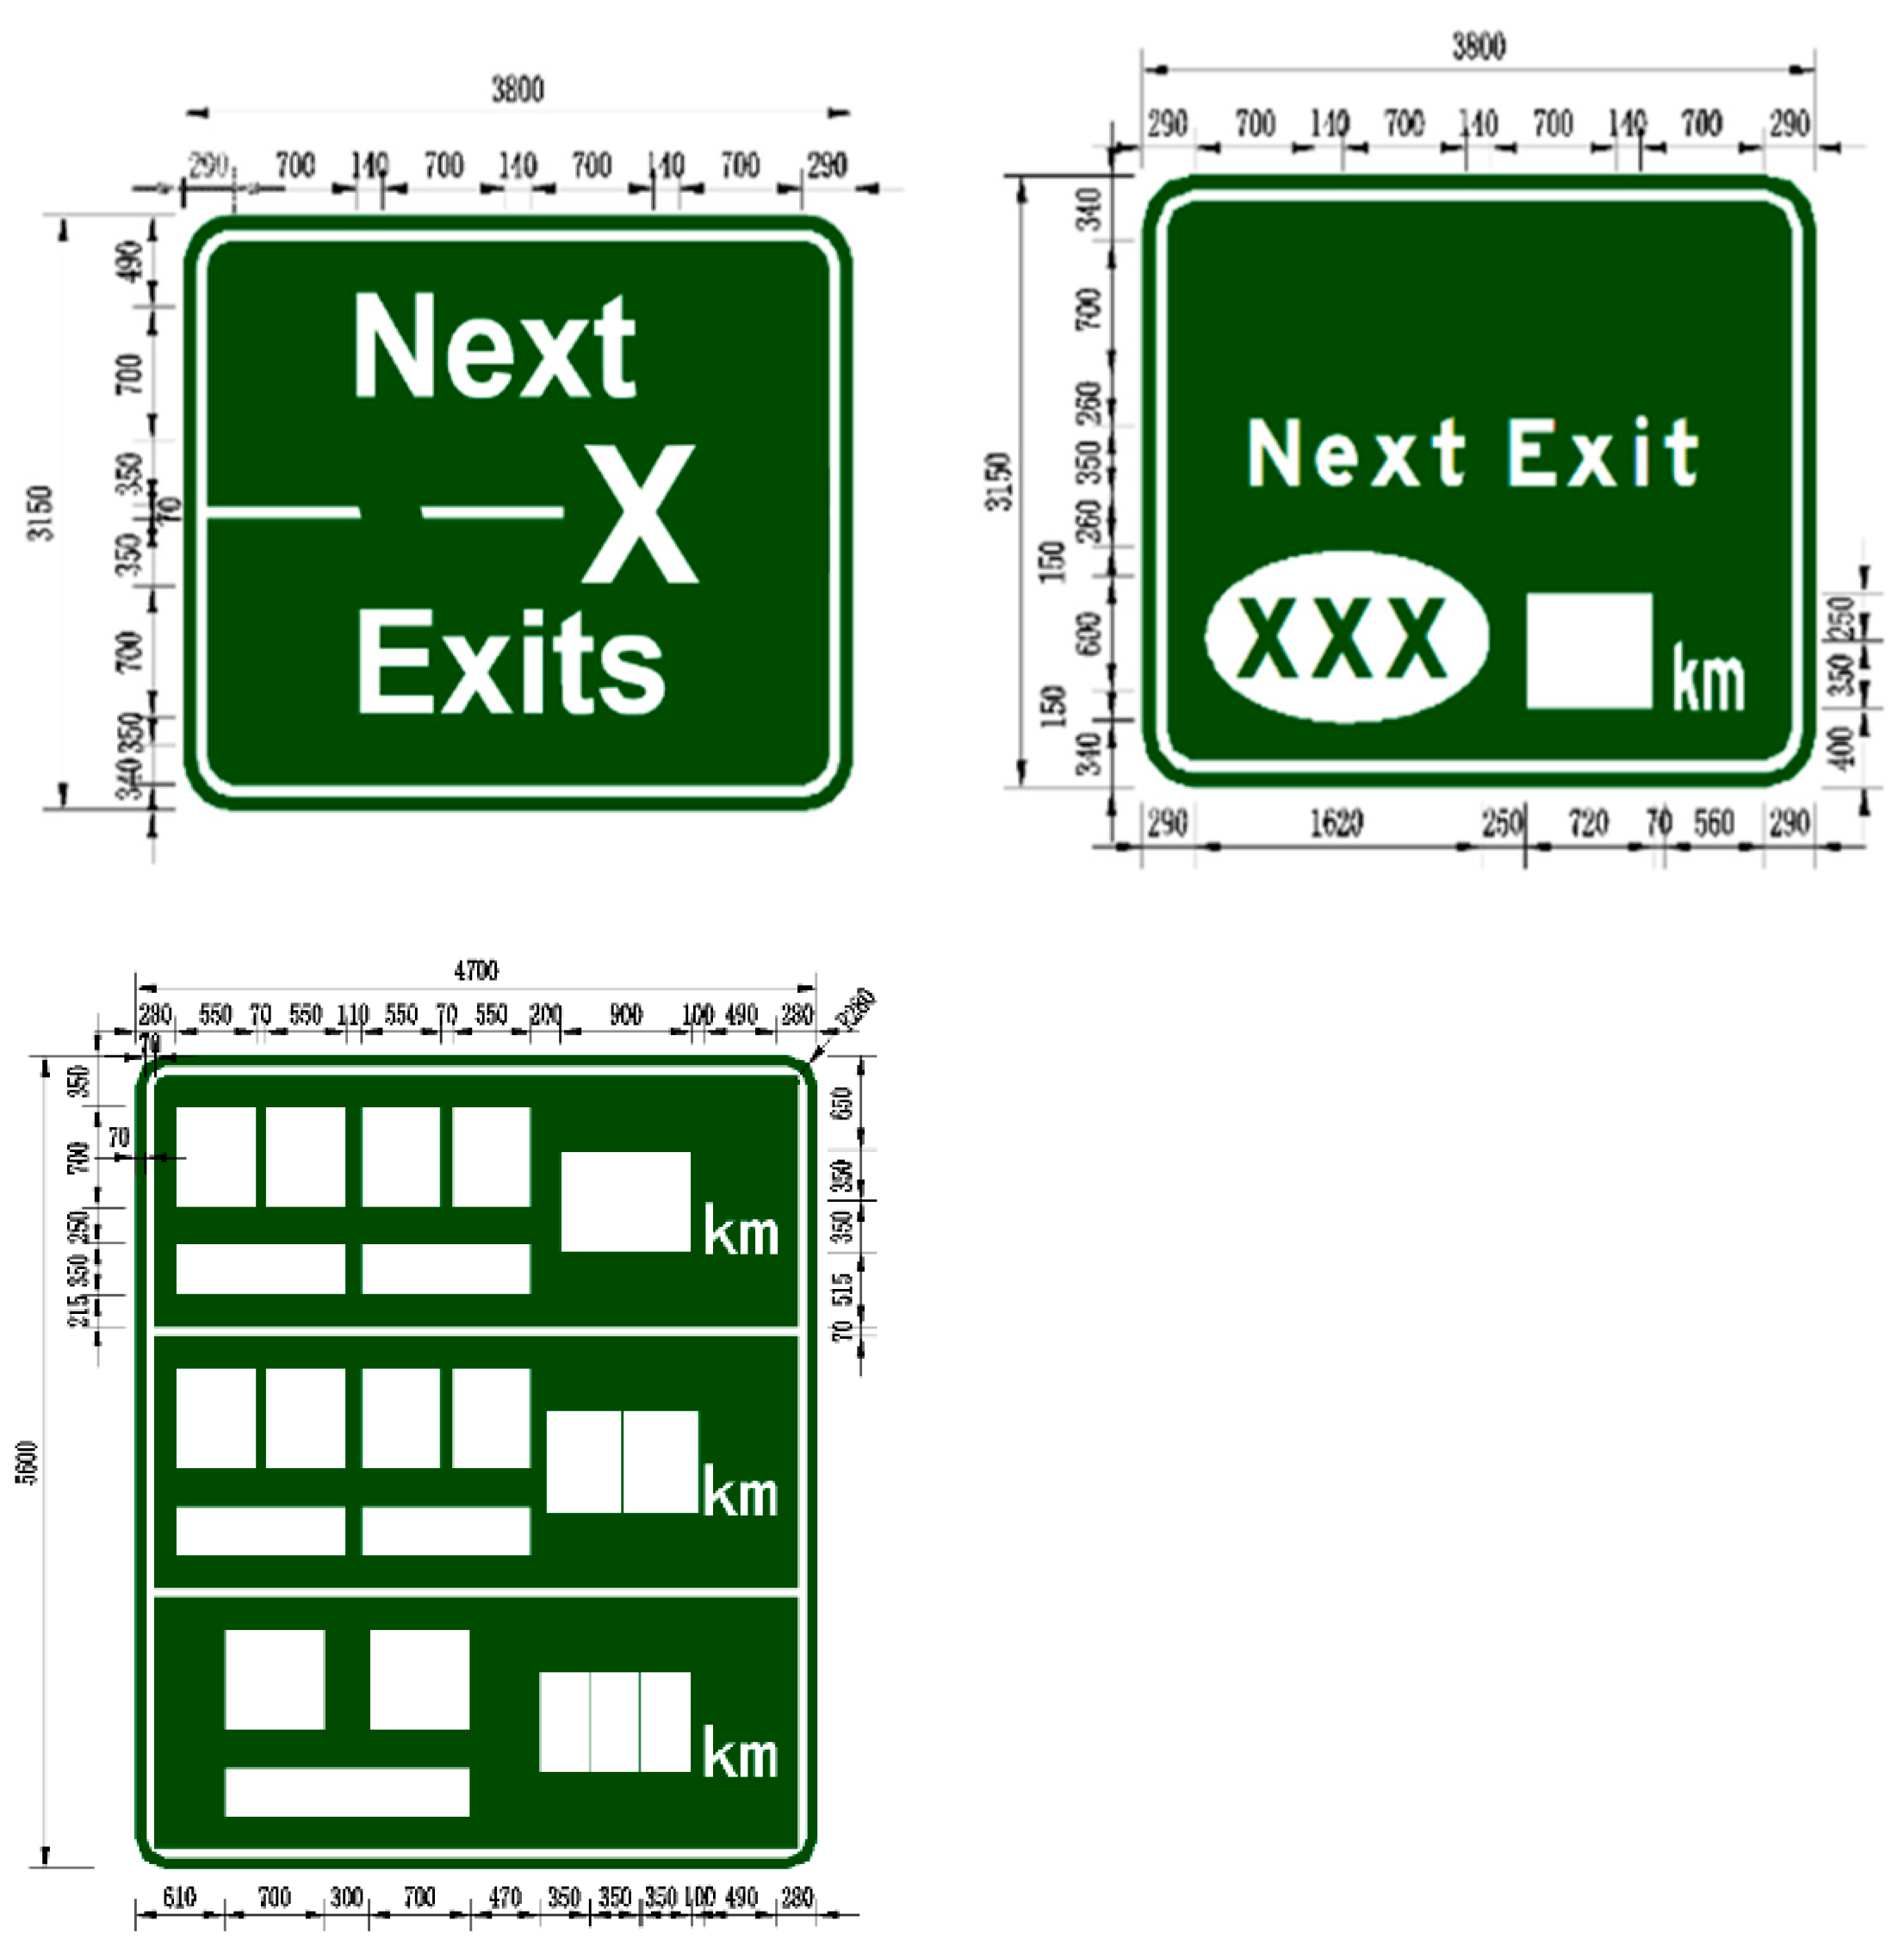
- Location guide signs group: According to China’s sign setting standards, a location distance sign must be set more than 5 km before the next exit, indicating the names and distances of multiple upcoming exits. If the distance to the next exit is between 3 to 5 km, an advance exit sign can replace the location distance sign. For three-level exit guide signs, the forward interchange quantity sign is placed 5 to 7 km before the starting point of the deceleration lane of the interchange, and the location distance sign is placed 2 km thereafter. Therefore, the first advance guide sign is set at a sufficiently long distance d before the first interchange, with variable d1 = 1 to 3 km. Similarly, the location distance signs for the second and third interchanges are placed at a sufficiently long distance d before the first advance guide signs of the second and third interchanges, with variables d2 and d3 = 1 to 3 km. Additionally, the next exit advance sign should be positioned a certain distance d’ after the starting point of the deceleration lane of the interchange, with variables d1′, d2′, and d3′ = 1 to 3 km.
- (ii)
- Advance exit signs group: According to the standards, highways typically have three-level exit guide signs set 2 km, 1 km, and 500 m before the starting point of the deceleration lane of the exit, indicating the distance to the exit (y1 = 2 km, 1 km, 0.5 km). Due to the wide road width of bidirectional eight-lane highways and the need for early lane changing to leave the mainline, along with the dense exit sections requiring early warning, a four-level exit guide sign can be set (y2 = 2.5 km, 2 km, 1 km, 0.5 km). For sections with short ramp spacing in dense exit areas, two-level exit guide signs can be set (y3 = 1 km, 0.5 km). The positions of the advance signs for the three interchange exits are named D1, D2, and D3, respectively. The specific setting schemes are shown in Table 1.
3. Data Collection and Preprocessing
3.1. Experimental Data
- (1)
- Subjective data: The participants’ subjective perceptions of different setting schemes are collected through questionnaires. This includes the effectiveness of the driving simulator and the participants’ subjective feelings about the driving scenarios.
- (2)
- Driving data: During the experiment, the driving platform collects data every 0.01 s, including instantaneous acceleration, speed, position, and other motion parameters. It also records vehicle operation data such as turn signals, brake pedal usage, throttle position, steering wheel angle, etc. Additionally, road data such as the time of state changes, road numbers, lane numbers, lane types are recorded, and so on.
- (3)
- Eye movement data: Eye-tracking equipment collects data every 0.001 ms during the driving simulation. This includes eye-tracking data such as gaze points, gaze direction, pupil position, pupil diameter, etc. Eye movement event data include event types (e.g., fixation, saccade), event duration, and the area of interest (AOI) of the eye movement events.
3.2. Evaluation Metrics
- (1)
- Subjective perception metrics: These indicators are mainly used to evaluate the real feelings of experimental participants towards simulated driving systems and driving environment scenes. The detailed evaluation content is shown in Table 2 and Table 3, and the evaluation data was obtained through questionnaires. In this study, the effective perception of the driving simulator (Ef) and subjective perception of the driving scenario (Su) are selected.
- (2)
- Driving safety metrics: From the perspective of vehicle operation safety, four parameters are selected as evaluation indicators: speed, speed standard deviation, acceleration, and acceleration standard deviation, reflecting the safety state of vehicle operation. The closer the vehicle’s average speed () is to the speed limit, the higher the safety. A smaller the speed standard deviation (SV) indicates smoother and safer vehicle operation. Influenced by road speed limits, the closer the acceleration (a) is to 0, the better the driving state. A smaller the acceleration standard deviation (Sa) indicates a more stable psychological state for the driver and higher safety.
- (3)
- Driving operation smoothness metrics: From the perspective of driving behavior smoothness, four indicators are considered: braking frequency (Q), braking effectiveness (P), lane-changing frequency (N), and the distance between lane-changing points and the exits (D). Braking effectiveness (P) is defined as the sum of the effects of releasing the throttle and applying the brake. A larger P indicates better speed control and smoother driving. It is calculated as:where, A is the throttle release depth, Δt is the data collection interval, and B is the brake pedal depth.Fewer braking frequency (Q) indicate better speed control and smoother driving. Fewer lane-changing frequency (N) within the critical influence range indicate safer and smoother driving behavior.
- (4)
- Eye movement comfort metrics: From the perspective of eye movement comfort, global eye movement data such as pupil diameter, fixation duration, fixation frequency, saccade duration, and saccade frequency are considered as cumulative comfort indicators for the driver’s information processing. Changes in pupil diameter (D) are mainly induced by variations in dense exit ramp guide signs. Ignoring other factors, the normal range of D is 1.3–4 mm, and the larger the deviation from this range, the poorer the comfort. Fixation refers to the activity of focusing the eyes on a sign, with fixation duration being the time the gaze remains fixed. The value of global average fixation duration (Fd) is normally between 100–20,000 ms, and the larger the deviation, the poorer the comfort. The global average fixation frequency (Fi) is the total number of fixations within the critical influence range. The global average saccade frequency (Si) is the total number of saccades within the critical influence range, and a higher Si indicates poorer comfort. The global average saccade duration (Sd) is the average duration of all saccade events, where saccades refer to the process of the eyes searching for targets in the traffic environment. The larger the Sd, the poorer the comfort.
3.3. Data Preprocessing
- (1)
- Outlier removal
- (2)
- Video data extraction
- (3)
- Data synchronization
- (4)
- Segmentation of data units
4. Experimental Results Analysis
4.1. Analysis of Subjective Perception Impact
4.2. Analysis of the Impact of Guide Signs on Single Exit
- (1)
- Driving safety: As shown in Figure 8(1) to Figure 8(4), the “Optimized group” participants were more conscious of controlling their speed in advance. A noticeable deceleration begins 700 m before the exit, with speeds successfully reduced to 60 km/h before reaching the exit. Within the 700-500 m range before the exit, acceleration is lower. This range corresponds to the placement of multilevel advance exit signs at 500 and 1000 m before the exit, indicating that the optimized setting of sign effectively guides drivers in adjusting their speed. Additionally, the standard deviation of speed and acceleration in the optimized group is lower, suggesting more stable driving and higher overall safety.
- (2)
- Smoothness of driving operation: Figure 8(5) to Figure 8(7) show that the braking effectiveness in both schemes is within the 1.42–1.43 s% range. However, the “Optimized group” has slightly fewer instances of braking and lane changes compared to the “Standard group”. In “Optimized group”, lane changes occur earlier upstream of the exit ramp, demonstrating that the optimized signs better guide drivers to change lanes earlier and enter the deceleration lane sooner. This results in smoother operations and higher driving efficiency.
- (3)
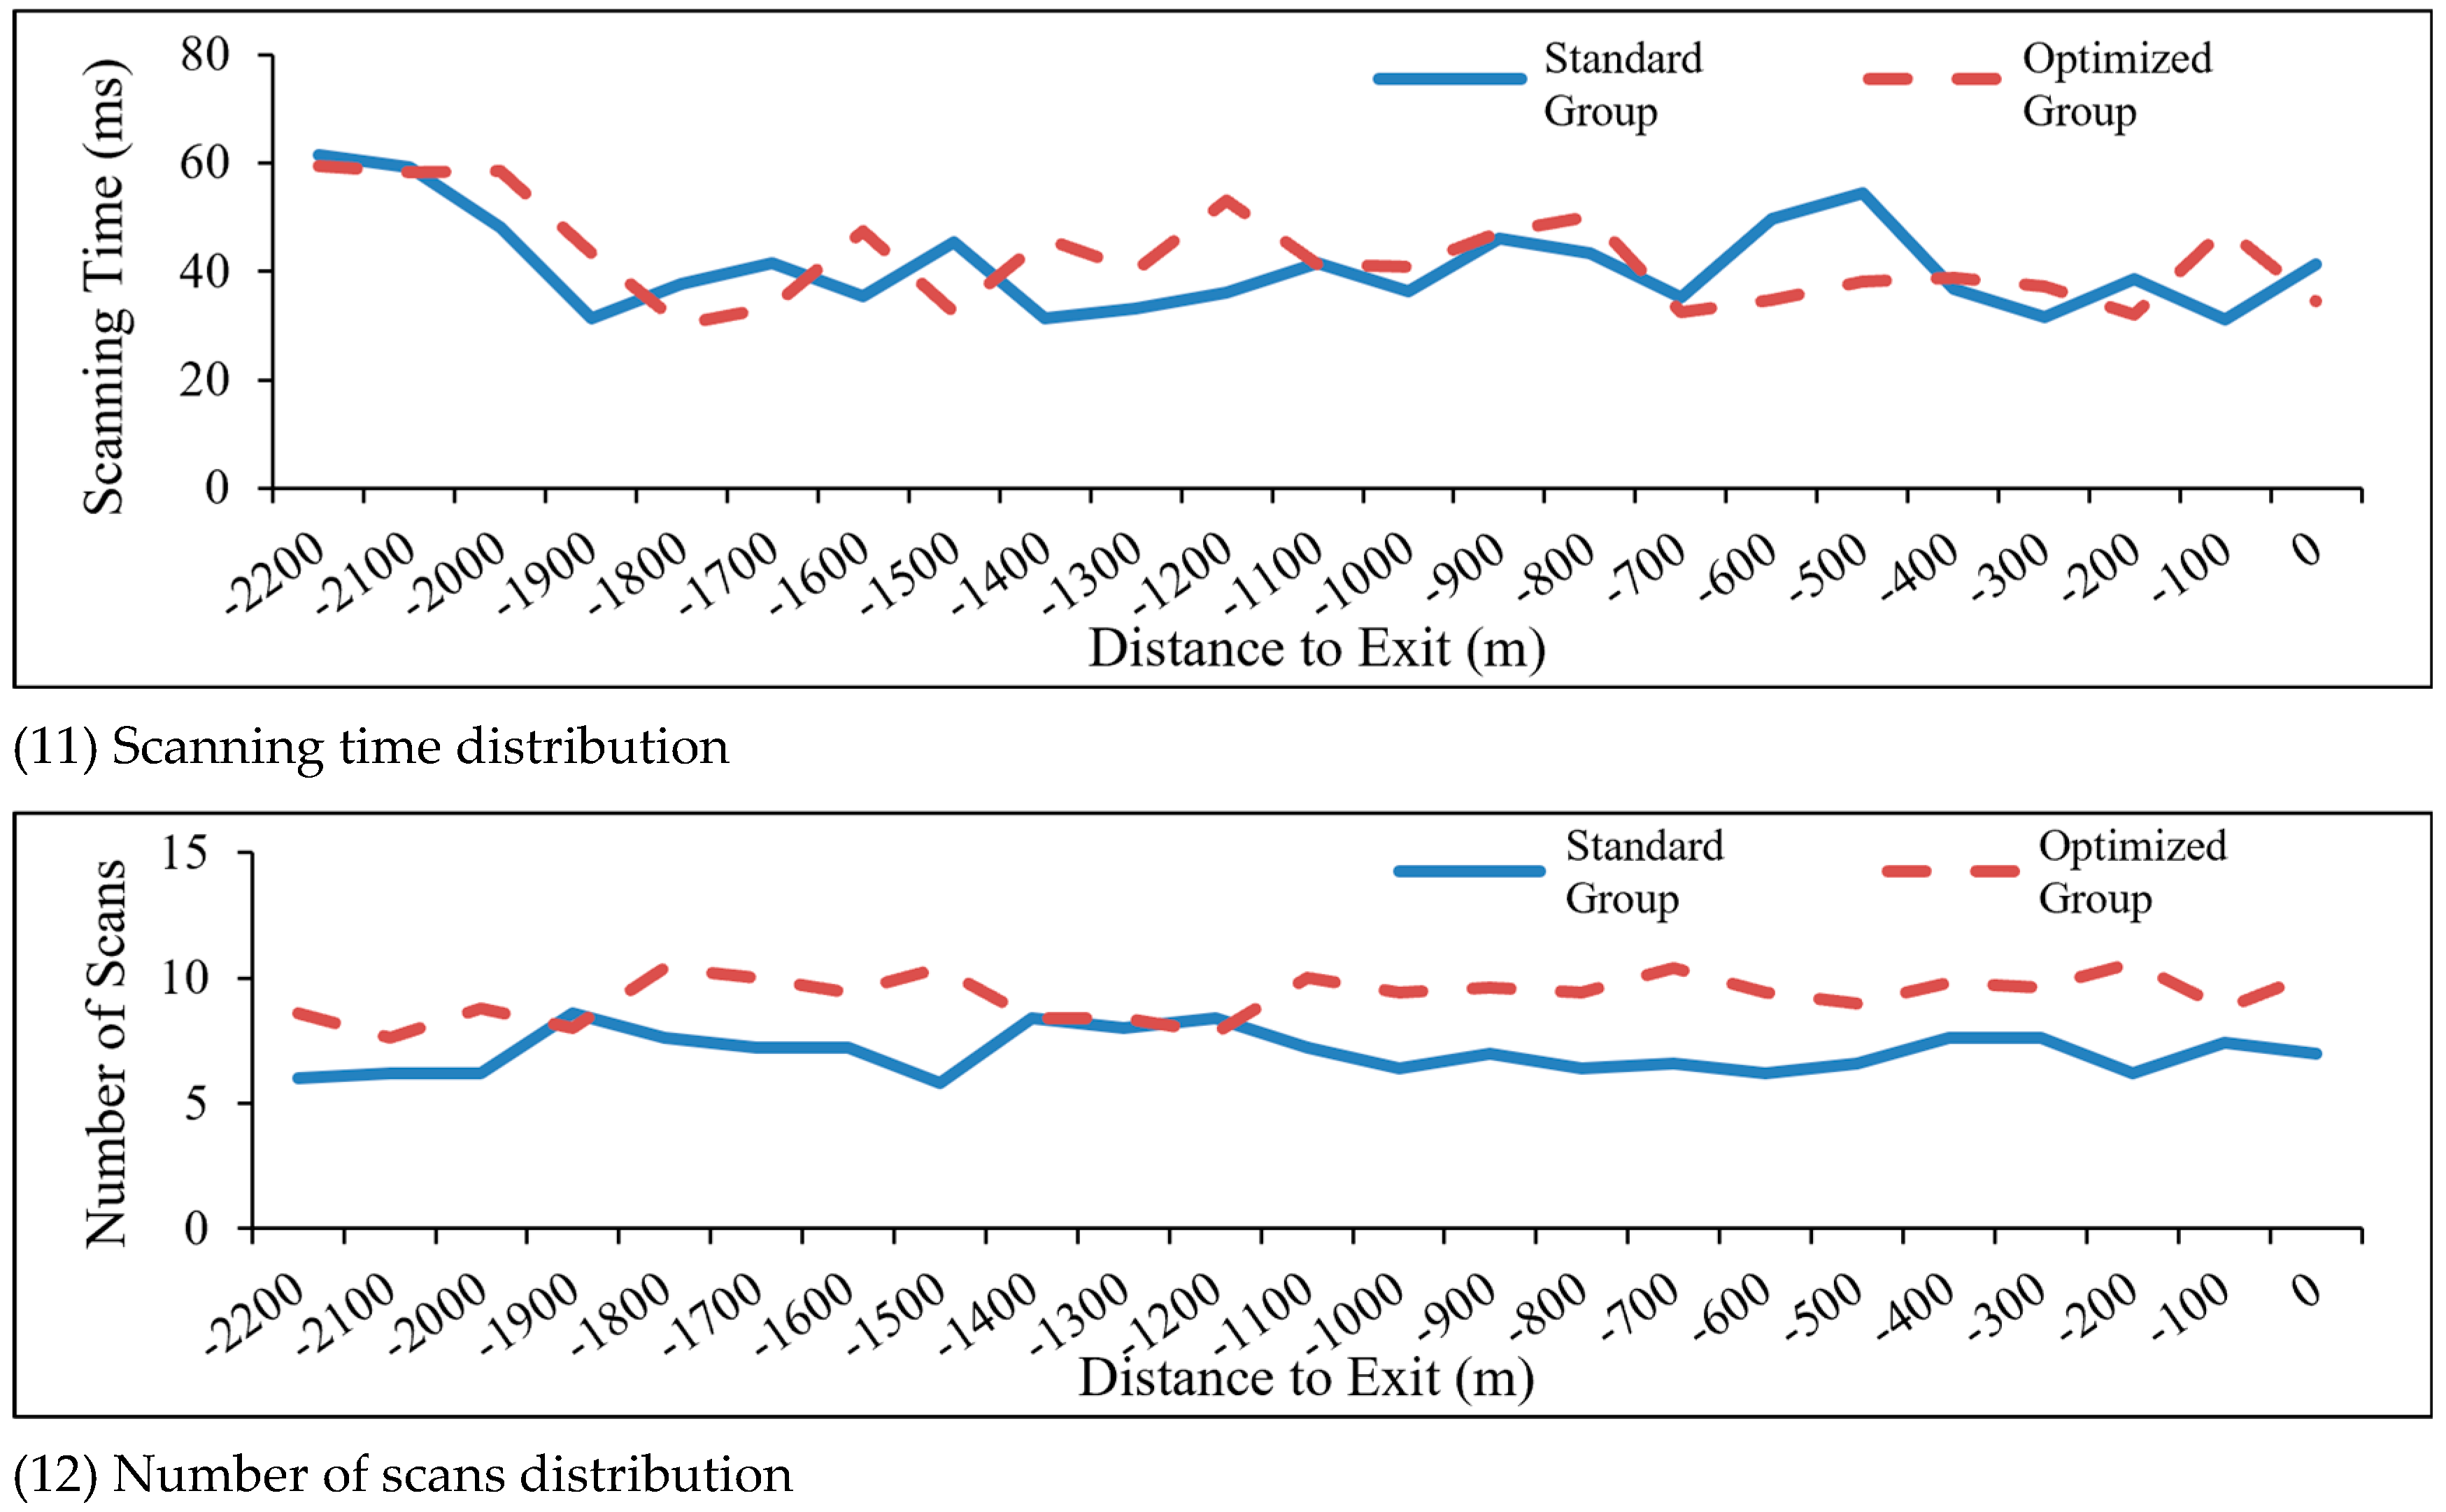
- Eye movement comfort: Figure 8(8) to Figure 8(12) indicate that in the “Optimized group” participants’ pupil diameters remain within the normal range (1.3−4 mm), whereas the “Standard group” shows instances exceeding this range. This suggests an improved psychological state for participants in the “Optimized group” during the simulation. The fixation duration in the “Optimized group” is 1462.27 ms, which is within the normal range (100–2000 ms). Longer fixation durations occur around 1400 m and 300 m before the exit (near lane change and exit points). Longer saccade durations occur around 2200 m, 1200 m, and 700 m (all near multilevel advance exit signs), indicating that participants in the “Optimized group” predominantly maintain a forward gaze and quickly acquire necessary information from signs with brief glances, leading to a generally comfortable state.
4.3. Analysis of the Impact of Guide Signs on Consecutive Double Exits
- (1)
- Driving safety: As illustrated in Figure 9(1) to Figure 9(4), the comparative results among the four schemes are as follows. Regarding average speed, the optimized group (long spacing) at 98.68 km/h is less than the standard group at 101.03 km/h, which in turn is less than the optimized group (medium spacing) at 102.08 km/h, and the shortest spacing in the optimized group (short spacing) achieves the highest speed of 105.91 km/h. In terms of acceleration, the standard group and optimized group (long spacing) both exhibit −0.16 m/s2, followed by the optimized group (medium spacing) at −0.17 m/s2 and the optimized group (short spacing) at −0.18 m/s2. The standard deviation of speed is relatively similar across all four groups, but the standard group experiences greater fluctuations after the secondary exit advance sign. Regarding the standard deviation of acceleration, the three optimized schemes are close to each other and all smaller than the standard group, indicating a significant improvement in safety with the optimized schemes, where shorter exit distance necessitate higher safety requirements.
- (2)
- Smoothness of driving operation: As depicted in Figure 9(5) to Figure 9(7), the braking effectiveness of all four schemes falls within the range of 1.1–1.2 s%. In terms of braking frequency, the standard group exceeds the three optimized groups with varying exit spacings, and a shorter exit spacing results in fewer braking instances. Regarding lane-changing frequency, the standard group is higher than the optimized group (long spacing), but as the exit spacing decreases, the number of lane changes increases. Collectively, these findings suggest that participants experience better maneuver fluency upstream of exits with the optimized schemes.
- (3)
- Eye movement comfort: As shown in Figure 9(8) to Figure 9(12), the comparison among the four schemes reveals the following. With respect to pupil diameter, the standard group registers 3.64 mm, exceeding the three optimized groups with long (3.54 mm), medium (3.58 mm), and short (3.62 mm) spacings, indicating that participants feel more comfortable on roads with three “optimized groups”. In terms of fixation and saccade durations, the standard group is shorter than the three optimized groups with varying spacings. However, the standard group records more fixation and saccade counts than the optimized groups, suggesting that in complex situations, the optimized signs provide more comprehensive guide information, requiring participants to maintain longer fixation durations to process the information. The more accurate information, in turn, reduces the number of visual recognitions, facilitating better attention retention and cumulative eye movement comfort during driving.
4.4. Analysis of the Impact of Guide Signs on Consecutive Triple Exits
- (1)
- Driving safety: As depicted in Figure 10(1) to Figure 10(4), the comparative results among the four schemes are as follows. Regarding average speed, the standard group achieves 100.58 km/h in three-exit scenarios, slightly lower than 101.03 km/h in two-exit scenarios. The optimized group, on the other hand, exhibits an increasing trend in average speed across its three schemes in three-exit scenarios, with long spacing at 101.27 km/h < medium spacing at 102.38 km/h < short spacing at 108.75 km/h. Although the optimized schemes show a similar pattern in average speed, they all register an increase compared to two-exit scenarios. In terms of acceleration, all four schemes follow a consistent pattern across three-exit scenarios but exhibit lower values than in two-exit scenarios, indicating that while overall speed increases, it remains within a reasonable range with smoother speed variations, conducive to driving safety.
- (2)
- Smoothness of driving operation: As illustrated in Figure 10(5) to Figure 10(7), the comparison among the four schemes reveals the following. In terms of braking effectiveness, both the standard and optimized group (long spacing) show lower braking effectiveness in long-spacing exit scenarios under three consecutive exits compared to two exits, while the opposite is true for optimized groups (medium and short spacing). Higher braking effectiveness suggests better speed control awareness among drivers. Regarding braking frequency, under three consecutive exits, braking occurs less frequently in long and medium spacing exits compared to two exits, but more frequently in short spacing exits. In terms of lane-changing frequency, all four schemes exhibit higher lane-changing counts under three consecutive exits than in two-exit scenarios, with shorter exit distance leading to more frequent lane changes. This indicates that participants experience better maneuver fluency in optimized long-spacing exits.
- (3)
- Eye movement comfort: As shown in Figure 10(8) to Figure 10(12), the comparative results among the four schemes are as follows. In terms of pupil diameter, the three optimized schemes show smaller pupil diameters under three consecutive exits compared to two exits, suggesting that reasonable optimization of signs does not increase driving burden in three consecutive dense exits. Across all four schemes, fixation durations and fixation counts decrease, while saccade counts decrease and saccade durations increase under three consecutive exits. This indicates that as the number of consecutive dense exits increases, participants shift from a fixation state to a saccade state, seeking better comfort to accurately respond to travel demands.
5. Conclusions
- (1)
- For a expressway section with a single exit, where the location guide sign placement (d1 = 1 km) and advance exit sign placements (D1 = 2 km, 1 km, 0.5 km) are the same, the optimized groups conveyed road information more efficiently through the optimization design of the combination signs for the next exit and location guide signs. The optimized schemes, which included an advance location guide sign, allowed participants to quickly acquire target information from the signs, ensuring good eye movement comfort while significantly improving driving safety, smoothness, and comfort within the critical influence range of the exit ramp.
- (2)
- For a expressway section with two consecutive exits, the experimental results showed that as the distance between exit ramps decreased, the vehicle speed fluctuation increased and lane change operations became more frequent within the critical influence range. The closer the interfering exit was to the target exit, the greater the impact on participants’ ability to find and correctly judge the exit. By optimizing the setting spacing of guide signs, the safety of vehicle operation and smoothness of driving behavior improved significantly in the simulation, allowing participants to proactively adjust their speed and successfully locate the target exit in advance.
- (3)
- For a expressway section with three consecutive exits, the results indicated that as the number of exit ramps increased and the spacing between them decreased, the interference with driving behavior grew, negatively affecting drivers’ ability to safely leave the mainline. Therefore, the placement of guide signs in special sections should consider the number and spacing of exits, with targeted advance placement of location guide signs and advance exit signs. Data analysis from the simulation experiments showed that in the optimized schemes, participants exhibited smoother driving behavior and greater comfort. More participants were able to quickly and accurately locate the target exit and take early lane-change actions after scanning the guide sign information.
Author Contributions
Funding
Institutional Review Board Statement
Informed Consent Statement
Data Availability Statement
Acknowledgments
Conflicts of Interest
References
- Zhu, J.; Ma, Y.; Lou, Y. Multi-vehicle interaction safety of connected automated vehicles in merging area: A real-time risk assessment approach. Accid. Anal. Prev. 2022, 166, 106546. [Google Scholar] [CrossRef] [PubMed]
- Dong, C.Y.; Wang, H.; Li, Y.; Wang, W.; Zhang, Z. Route control strategy for autonomous vehicles exiting to off-ramps. IEEE Trans. Intell. Transp. Syst. 2020, 21, 3104–3116. [Google Scholar] [CrossRef]
- Chen, X.Q.; Wei, C.X.; Yang, Y.; Luo, L.J.; Biancardo, S.A.; Mei, X.J. Personnel trajectory extraction from port-like videos under varied rainy inferences. IEEE Trans. Intell. Transp. Syst. 2024, 25, 6567–6579. [Google Scholar] [CrossRef]
- Dong, C.Y.; Xing, L.; Wang, H.; Yu, X.L.; Liu, Y.J.; Ni, D.H. Iterative learning control for lane-changing trajectories upstream off-ramp bottlenecks and safety evaluation. Accid. Anal. Prev. 2023, 183, 106970. [Google Scholar] [CrossRef] [PubMed]
- Guo, T.Y.; Deng, W.; Hou, J.S.; Lu, J. Placement distance of freeway exit advance guide sign and its safety impacts. J. Southeast Univ. 2010, 26, 622–627. [Google Scholar]
- Wang, L.; Zhang, H.; Shi, L.; He, Q.; Xu, H. Optimization model of regional traffic signs for inducement at road works. Sustainability 2021, 13, 6996. [Google Scholar] [CrossRef]
- Hawkins, H.G.; Brimley, B.K.; Carlson, P.J. Updated model for advance placement of turn and curve warning signs. Transp. Res. Rec. 2016, 2555, 111–119. [Google Scholar] [CrossRef]
- Niu, Z.M.; Huang, M.; Yuan, Y.; Li, M. Research of visualization of road guide sign panel based on combination of guiding information. J. Syst. Simul. 2016, 28, 914–919. [Google Scholar]
- Pan, B.H.; Huo, Y.F.; Liu, B.; Zhou, H.Y.; Wu, S.Q. Study on advance distance of expressway exit guide sign based on UCWin /Road simulation. J. Highw. Transp. Res. Dev. 2017, 34, 130–137. [Google Scholar]
- Liu, W.M.; Deng, R.F.; Zhang, Y.; Zhuang, Y.H. Safety distance setting model for advance guide signs at expressway exits. J. South China Univ. Technol. 2013, 41, 37–43. [Google Scholar] [CrossRef]
- Guo, Z.; Wei, Z.; Wang, H. The expressway traffic sign information volume threshold and AGS position based on driving behavior. Transp. Res. Procedia 2016, 14, 3801–3810. [Google Scholar] [CrossRef]
- Cui, H.J.; Ma, X.W.; Li, X.; Li, L.; Li, H.N. Safety distance calculation model for advance guide signs at expressway exits. J. Highw. Transp. Res. Dev. 2016, 33, 120–126. [Google Scholar]
- Zhu, Z.B.; Guo, T.Y.; Pan, S. Safety distance setting model for advance guide signs at expressway exits. Transp. Res. 2018, 4, 44–50+62. [Google Scholar]
- Yang, F.; Wang, J.J.; Ma, C.C.; Wang, S.; Wang, Z.G. Study on the information volume threshold of guide signs at ring expressway entrances and exits. China J. Highw. Transp. 2021, 34, 251–260. [Google Scholar]
- Shang, T.; Wu, Y.F.; Wu, P.; He, H.C.; You, B. Setting method of exit advance guide signs in mountainous expressway tunnel based on information quantization theory. PLoS ONE 2023, 18, e0281842. [Google Scholar] [CrossRef] [PubMed]
- Zhao, N.N.; Zhao, X.H.; Lin, Z.Z. Research on the form of expressway exit signs based on driving behavior. China J. Highw. Transp. 2020, 33, 137–145. [Google Scholar]
- Huang, L.H.; Zhao, X.H.; Li, Y.; Rong, J. Driving simulator-based study to quantify typical diagrammatic guide sign efficiency along urban expressway interchanges. J. Transp. Saf. Secur. 2020, 12, 839–862. [Google Scholar] [CrossRef]
- Chen, X.Q.; Dou, S.T.; Song, T.Q.; Wu, H.F.; Sun, Y.; Xian, J.F. Spatial-temporal ship pollution distribution exploitation and harbor environmental impact analysis via large-scale AIS data. J. Mar. Sci. Eng. 2024, 12, 960. [Google Scholar] [CrossRef]
- Dong, C.Y.; Chen, Y.J.; Wang, H.; Ni, D.H.; Shi, X.M.; Lyu, K.Y. An evolutionary learning framework of lane-changing control for autonomous vehicles at freeway off-ramps. IEEE Trans. Veh. Technol. 2023, 72, 1611–1628. [Google Scholar] [CrossRef]
- Chen, Y.N. Optimization Research on the Expressway Guide Sign System under the Condition of Multi-Factor Coupling. Master’s Thesis, Shandong Jianzhu University, Shandong, China, 2022. [Google Scholar]
- Wynne, R.A.; Beanland, V.; Salmon, P.M. Systematic review of driving simulator validation studies. Saf. Sci. 2019, 117, 138–151. [Google Scholar] [CrossRef]
- Ding, S. Research into the visual saliency of guide signs in an underground commercial street based on an eye-movement experiment. Sustainability 2022, 14, 16062. [Google Scholar] [CrossRef]
- Wang, H.C.; Zhao, Y.; Zhao, Y. Study on the position setting of advance guide signs on multi-lane expressways based on driving simulation. Transp. Technol. 2015, 3, 162–165. [Google Scholar]
- Yang, Y.Q.; Chen, J.Y.; Easa, S.M.; Zheng, X.Y.; Lin, W.; Peng, Y.C. Driving simulator study of the comparative effectiveness of monolingual and bilingual guide signs on Chinese highways. Transp. Res. Part F Traffic Psychol. Behav. 2019, 68, 67–78. [Google Scholar] [CrossRef]
- Huang, L.; Zhao, X.H.; Li, Y.; Ma, J.; Wang, Y. Optimal design alternatives of advance guide signs of closely spaced exit ramps on urban expressways. Accid. Anal. Prev. 2020, 138, 105465. [Google Scholar] [CrossRef] [PubMed]
- Wan, H.; Chen, X.; Du, Z. Improving safety and efficiency of roundabouts through an integrated system of guide signs. Sustainability 2019, 11, 5202. [Google Scholar] [CrossRef]


| No | Scheme | Exit Spacing L (km) | Sign Position D (km) | Sign Panel | |
|---|---|---|---|---|---|
| 1 | 1 | L = 3 | d1 = 1 | D1 = y1 | Standard group |
| 2 | Optimized group | ||||
| 2 | 1 | L1 = 3, L2 = 5 | d2 = 2.5 | D1 = y1, D2 = y2 | Standard group |
| 2 | Optimized group | ||||
| 3 | L1 = 3, L2 = 3 | d1 = 1, d2′ = 1 | D1 = D2 = y1 | Optimized group | |
| 4 | L1 = 3, L2 = 2 | d1 = 1, d2′ = 1 | D1 = y1, D2 = y3 | Optimized group | |
| 3 | 1 | L1 = 3, L2 = 3, L3 = 5 | d3 = 2.5 | D1 = D2 = y1, D3 = y2 | Standard group |
| 2 | Optimized group | ||||
| 3 | L1 = 3, L2 = 3, L3 = 3 | d1 = 1, d2′ = d3′ = 1 | D1 = D2 = D3 = y1 | Optimized group | |
| 4 | L1 = 3, L2 = 3, L3 = 2 | d1 = 1, d2′ = d3′ = 1 | D1 = D2 = y1, D3 = y3 | Optimized group | |
| Question 1 | Is the test experience of accelerator and brake real? | Scores | Final scores 80.63 | ||||
| Degree | A. Very Realistic | B. Quite Realistic | C. Generally Realistic | D. Somewhat Unrealistic | E. Completely Unrealistic | 76.25 | |
| Quantity | 4 | 20 | 6 | 2 | 0 | ||
| Percentage | 12.5% | 62.5% | 18.75% | 6.25% | 0 | ||
| Question 2 | Is speed perception real in the experiment? | Scores | |||||
| Degree | A. Very Realistic | B. Quite Realistic | C. Generally Realistic | D. Somewhat Unrealistic | E. Completely Unrealistic | 78.75 | |
| Quantity | 8 | 15 | 8 | 1 | 0 | ||
| Percentage | 25% | 46.88% | 25% | 3.13% | 0 | ||
| Question 3 | Is the experience of the test scenarios feel? | Scores | |||||
| Degree | A. Very Realistic | B. Quite Realistic | C. Generally Realistic | D. Somewhat Unrealistic | E. Completely Unrealistic | 83.13 | |
| Quantity | 11 | 16 | 4 | 1 | 0 | ||
| Percentage | 34.38% | 50.00% | 12.50% | 3.13% | 0 | ||
| Question 4 | Is the experience of guide sign settings at interchange locations feel? | Scores | |||||
| Degree | A. Very Realistic | B. Quite Realistic | C. Generally Realistic | D. Somewhat Unrealistic | E. Completely Unrealistic | 81.25 | |
| Quantity | 11 | 16 | 3 | 1 | 1 | ||
| Percentage | 34.38% | 50.00% | 9.38% | 3.13% | 3.13% | ||
| Question 5 | Is the experience of multi-level exit advance guide sign settings feel? | Scores | |||||
| Degree | A. Very Realistic | B. Quite Realistic | C. Generally Realistic | D. Somewhat Unrealistic | E. Completely Unrealistic | 83.75 | |
| Quantity | 13 | 14 | 3 | 2 | 0 | ||
| Percentage | 40.63% | 43.75% | 9.38% | 6.25% | 0 | ||
| Question 1 | Have you ever unable to clearly read a sign in time? | Scores | Final Scores 77.88 | ||||
| Degree | A. Never | B. Rarely | C. Sometimes | D. Occasionally | E. Frequently | 79.38 | |
| Quantity | 13 | 11 | 2 | 6 | 0 | ||
| Percentage | 40.63% | 34.38% | 6.25% | 18.75% | 0 | ||
| Question 2 | Have you ever unable to react in time after seeing a sign? | Scores | |||||
| Degree | A. Never | B. Rarely | C. Sometimes | D. Occasionally | E. Frequently | 80 | |
| Quantity | 12 | 14 | 0 | 6 | 0 | ||
| Percentage | 37.50% | 43.75% | 0.00% | 18.75% | 0 | ||
| Question 3 | Have you ever noticed the guide sign information being discontinuous? | Scores | |||||
| Degree | A. Never | B. Rarely | C. Sometimes | D. Occasionally | E. Frequently | 78.75 | |
| Quantity | 13 | 10 | 5 | 3 | 1 | ||
| Percentage | 40.63% | 31.25% | 15.63% | 9.38% | 3.13% | ||
| Question 4 | Have you ever noticed interruptions in the destination information? | Scores | |||||
| Degree | A. Never | B. Rarely | C. Sometimes | D. Occasionally | E. Frequently | 80.63 | |
| Quantity | 15 | 10 | 2 | 4 | 1 | ||
| Percentage | 46.88% | 31.25% | 6.25% | 12.50% | 3.13% | ||
| Question 5 | Have you ever felt confused about the direction of your destination after seeing a sign? | Scores | |||||
| Degree | A. Never | B. Rarely | C. Sometimes | D. Occasionally | E. Frequently | 70.63 | |
| Quantity | 10 | 10 | 1 | 10 | 1 | ||
| Percentage | 31.25% | 31.25% | 3.13% | 31.25% | 3.13% | ||
Disclaimer/Publisher’s Note: The statements, opinions and data contained in all publications are solely those of the individual author(s) and contributor(s) and not of MDPI and/or the editor(s). MDPI and/or the editor(s) disclaim responsibility for any injury to people or property resulting from any ideas, methods, instructions or products referred to in the content. |
© 2024 by the authors. Licensee MDPI, Basel, Switzerland. This article is an open access article distributed under the terms and conditions of the Creative Commons Attribution (CC BY) license (https://creativecommons.org/licenses/by/4.0/).
Share and Cite
Ran, J.; Li, M.; Rong, J.; Zhao, D.; Li, X.; Luo, Q. Optimal Design Alternatives of Guide Signs for Expressway Segments with Consecutive Dense Exits. Sustainability 2024, 16, 7128. https://doi.org/10.3390/su16167128
Ran J, Li M, Rong J, Zhao D, Li X, Luo Q. Optimal Design Alternatives of Guide Signs for Expressway Segments with Consecutive Dense Exits. Sustainability. 2024; 16(16):7128. https://doi.org/10.3390/su16167128
Chicago/Turabian StyleRan, Jin, Meiling Li, Jian Rong, Ding Zhao, Xingyuan Li, and Qiang Luo. 2024. "Optimal Design Alternatives of Guide Signs for Expressway Segments with Consecutive Dense Exits" Sustainability 16, no. 16: 7128. https://doi.org/10.3390/su16167128
APA StyleRan, J., Li, M., Rong, J., Zhao, D., Li, X., & Luo, Q. (2024). Optimal Design Alternatives of Guide Signs for Expressway Segments with Consecutive Dense Exits. Sustainability, 16(16), 7128. https://doi.org/10.3390/su16167128