Review

Mass Balance of Maritime Glaciers in the Southeastern Tibetan Plateau during Recent Decades

1
School of Physical Education, Hunan University of Science and Technology, Xiangtan 411201, China
2
School of Resource, Environment and Safety Engineering, Hunan University of Science and Technology, Xiangtan 411201, China
*
Author to whom correspondence should be addressed.
Sustainability 2024, 16(16), 7118; https://doi.org/10.3390/su16167118
Submission received: 18 July 2024 / Revised: 16 August 2024 / Accepted: 18 August 2024 / Published: 19 August 2024
(This article belongs to the Special Issue Climate Impacts on Water Resources: From the Glacier to the Lake)

Abstract

:
Maritime glaciers in the southeastern Tibetan Plateau (SETP) are particularly sensitive to changes in climate, and their changes directly and severely affect regional water security and glacier-related hazards. Given their large societal importance, a better understanding of the mass balance of maritime glaciers in the SETP, a key variable for characterizing the state of glacier health, is of great scientific interest. In this review, we synthesize in situ, satellite-based observations and simulations that present an overall accelerating negative mass balance of maritime glaciers in the SETP in recent decades. We hereby highlight a significant spatiotemporal difference in the mass balance of maritime glaciers across the SETP and investigate the drivers of the accelerated mass loss of these glaciers in recent years. We find that accelerated glacier mass loss agrees with the variabilities in temperatures rising and precipitation decreasing at regional scales, as well as the spatial patterns of widespread melt hotspots (e.g., thin debris, ice cliffs, supraglacial ponds, and surface streams), the expansion of glacial lakes, enlarged ice crevasses, and frequent ice avalanches. Finally, the challenges of the mass balance study of maritime glaciers and future perspectives are proposed. Our review confirms the urgent need to improve the existing glacier inventory and establish comprehensive monitoring networks in data-scarce glacierized catchments, and it suggests paying particular attention to the development of glacier mass-balance models that coupe multiple physical processes at different interfaces to predict the status of maritime glaciers and their responses to climate change. This study can inform the sustainable management of water resources and the assessment of socio-economic vulnerability due to glacier-related hazards in the SETP and its surroundings in the context of marked atmospheric warming.

1. Introduction

The Tibetan Plateau (TP) has the largest volume of glacier ice outside of the polar regions [1,2], and it is the source of several major river systems in Asia [1,2]. These glaciers are one of the key components of the water tower of Asia, which provides domestic, agricultural, and industrial freshwater to millions of people downstream [3,4,5]. Especially in arid and semi-arid regions or during the post-monsoon drought period (September through November), these glaciers can serve as a drought-resistant water source to relieve regional water supply pressure [3,4,5]. With continuous climate warming [6,7], most TP glaciers have experienced a rapid retreat and mass loss over the last decades [1,7,8,9,10], exacerbating the already serious water supply pressure [2,5,7] and leading to serious glacier-related hazards (e.g., glacial lake outburst floods (GLOFs), ice/snow avalanches, glacial debris flow, and landslides) to human society [11,12,13,14,15]. Therefore, glacier changes are essential for the reliability and sustainability of water resources, disaster prevention and reduction, and sustainable socio-economic development of the countries around the TP [2,3,5].
Glaciers on the TP are generally divided into maritime, subcontinental, and extremely continental glaciers based mainly on climatic settings and especially the regional differences in precipitation distribution [16,17,18]. The differences between these three types of TP glaciers are quite significant (Table S1) (see the Supplementary Materials). Among the three types of glaciers, maritime glaciers are mainly distributed in the southeastern TP (SETP), where the annual precipitation in glacierized regions ranges from 1000 to 3000 mm (Table S1), which is significantly higher than that in the distribution areas of other types of TP glaciers [16,17]. Compared with other types of TP glaciers (Table S1), maritime glaciers have a higher sensitivity to temperature change than precipitation change, and they are distinctively characterized by high ice temperature (at or near the pressure melting point), fast flow and significant basal sliding, and intense ablation [17,18,19]. Furthermore, the ablation zones of maritime glaciers generally extend downwards to lower elevations [16,17,19], and many of them are covered by extensive supraglacial debris with various thicknesses [19,20,21,22,23].
Against the background of continued climate warming, maritime glaciers are experiencing a higher mass loss rate [8,24,25,26], which largely alters the seasonal and inter-annual spatiotemporal characteristics of river runoff [7,24,27,28,29], as well as the frequency, extent, and scope of glacier-related hazards in the SETP [12,30,31,32,33]. Analysis of a glacierized catchment in the Hengduan Mountains of the SETP indicated that glacier meltwater runoff accounted for approximately 45.1% of the total catchment runoff from 1988 to 2017, and increased glacier meltwater runoff contributed approximately 54.0% of the increased river runoff in the last decade [28]. Since the 1970s, the annual runoff of the upper Brahmaputra River has experienced an increasing trend, in which glacier meltwater is the main contributor to the increased river runoff [29]. Owing to close connections with glacier retreat and meltwater production, the number, area, and volume of glacial lakes have grown rapidly in the TP and surroundings since the 1990s [15,34,35,36,37]. From 1990 to 2015, glacial lakes in the Himalayas increased by 399, and their area increased by 14.0% [34]. A total of 85 GLOFs in the SETP have been observed and recorded since 1900 [11,13], of which a GLOF that occurred at Kedarnath in the Indian Himalayas in 2013 claimed more than 6000 lives [38]. The GLOF frequency has significantly increased in the SETP and the China–Nepal border area over the last decade [14,15,34]. Consequently, drastic changes in maritime glaciers will further affect regional water security, infrastructure security, and ecological security along rivers and downstream regions [4,15,39]. In particular, as the global climate continues to warm in the coming decades [40], the risk of water resource sustainability and glacier-related hazards in the SETP and its surroundings will increase with the growing population and the expansion of the regional socio-economic scale [4,30,31].
However, the observation of maritime glaciers in the SETP is quite limited due to the extremely complex climatic, geological, and topographic conditions. Only a few maritime glaciers have carried out field observations (Table S2), and long-term glacier mass balance observations are particularly sparse [18,41,42,43,44]. Glacier mass balance, defined as the combination of mass gains and mass losses on a glacier, is a vital link in the exchange of energy, mass, and water on/within the glacier, and it is closely related to climate change as well as the mass basis that causes changes in glacier size, runoff, and hazardous effects [15,45,46,47]. Given that the spatiotemporal pattern of the maritime glacier mass balance can help us understand the features of glacier mass changes and the associated influencing mechanisms, an accurate assessment of the causes, mechanisms, and impacts of maritime glacier mass changes will reduce the uncertainty in studying the influence of these glacier changes on water resource sustainability and disaster-causing effects, thereby improving the ability to adapt to and mitigate climate change in the SETP and its surroundings.
In this study, we aim to provide a comprehensive and in-depth review of the mass balance status of maritime glaciers in the SETP based on in situ satellite observations and model simulations. We start with an overview of the distribution characteristics of maritime glaciers, the local climate, and their observational status in the SETP (Section 2). We then focus on the spatial and temporal characteristics of the mass balance of maritime glaciers in recent decades (Section 3) and the potential drivers of the recent acceleration in glacier mass loss (Section 4). Next, we explore knowledge gaps and challenges of the mass balance study of maritime glaciers in the SETP (Section 5). Finally, relevant urgent issues to be clarified are recommended for future research (Section 6).

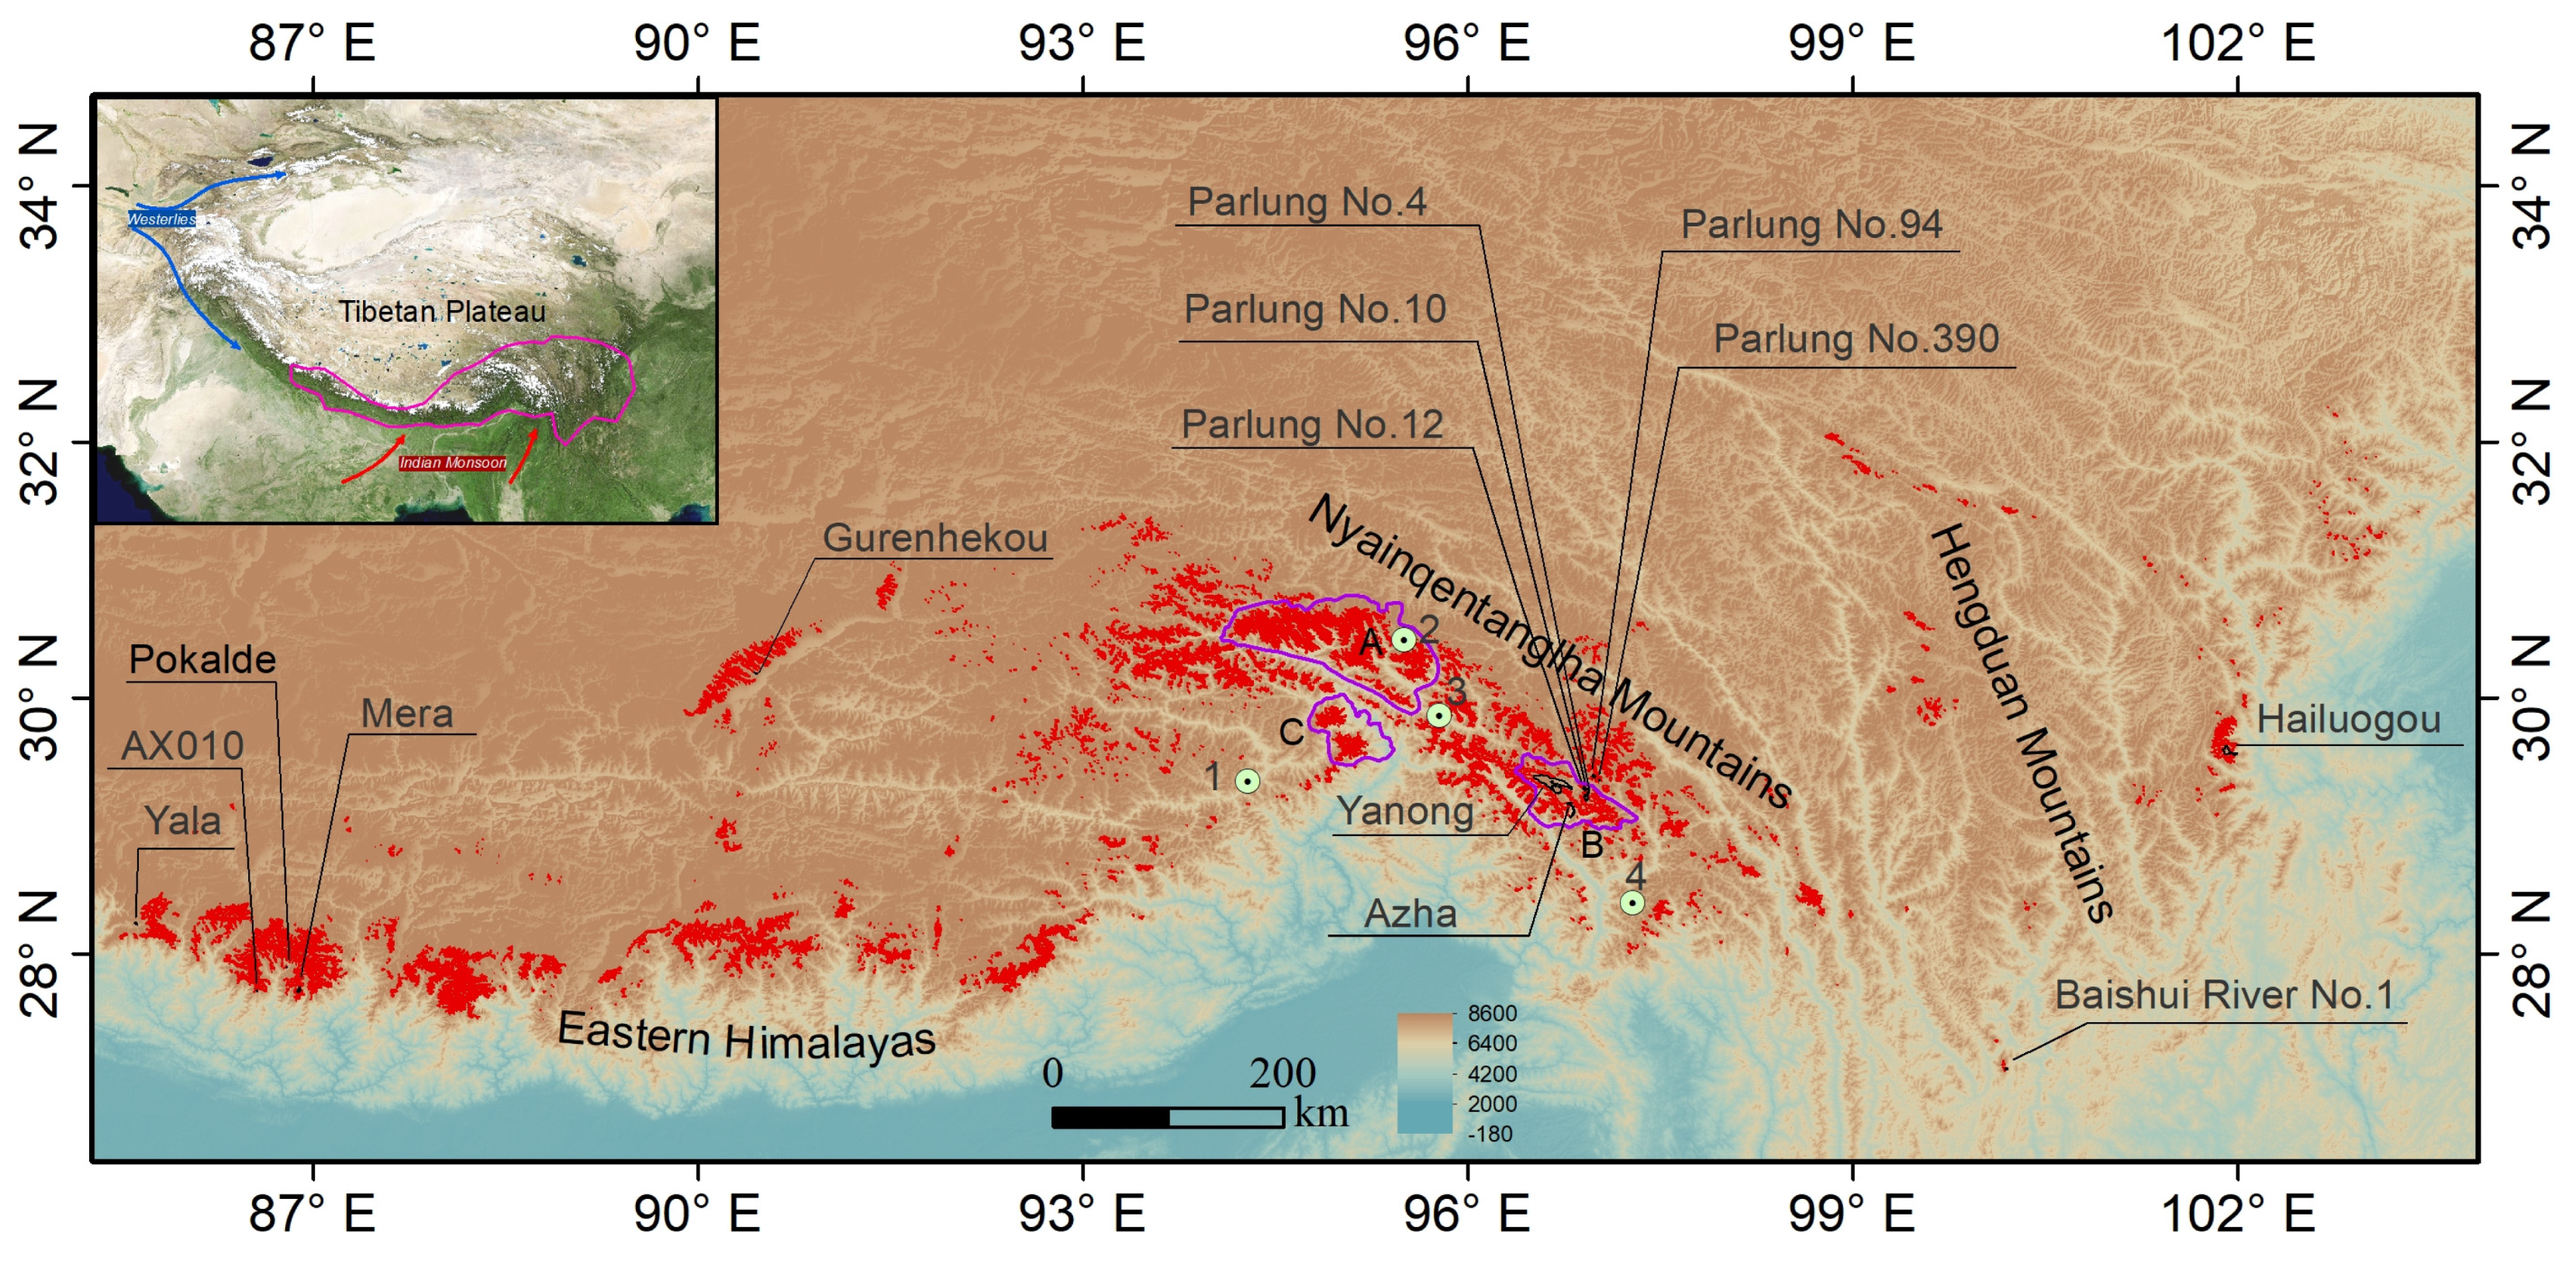
2. Study Area and Methods

2.1. Maritime Glaciers

The SETP has complex geological and topographic conditions with deep valleys and high mountains, ranging from ~100 m a.s.l. to 7782 m a.s.l. [18]. The average elevation increases from the south border of the plateau to the northwest inland area of the plateau. The region hosts about 8607 maritime glaciers covering a total area of 13,203.2 km2 (Figure 1 and Table 1), representing approximately 18.6% and 22.2% of the total glacier number and the total glacier area in western China [16,17]. These glaciers are mainly distributed in the Hengduan Mountains, central and eastern Nyainqêntanglha Mountains, and the eastern Himalayas. Of these regions (Table 1), the central and eastern Nyainqêntanglha Mountains have the largest number and area of maritime glaciers, which, respectively, represent 49.7% and 59.7% of the total number and area of glaciers in the region, while the Hengduan Mountains have the smallest number and area of glaciers.
Among these maritime glaciers in the SETP, about 67.4% are less than 0.5 km2, contributing 9.0% of the total glacier area in the region (Figure 2). Although only 2.3% of these glaciers have an area greater than 10.0 km2, their total area accounts for 47.8% of the total glacier area in the region (Figure 2). About 80% of the regional glacier area is concentrated between 4800 and 5900 m, while about 11.7% is distributed above 5900 m, and only 8.3% occurs below 4800 m. In the region, approximately 16.6% of the total glacier area is covered by debris with a heterogeneous distribution (Figure S1), which largely exceeds the global percentage of debris-covered area (~4.4%–7.3%) [48,49].
Since the Little Ice Age, the area of maritime glaciers in the SETP has decreased by approximately 30% [16]. Statistics from the first and second Chinese glacier inventories indicate that the retreat rates of glaciers in the Nyainqêntanglha Mountains, Hengduan Mountains, and Himalayas range from −8.61% (10 yr)−1 to −7.86% (10 yr)−1 [50]. Multisource remote sensing-based observations reveal that the glacier area of the Nyainqêntanglha Mountains shrinks rapidly, with a reduction rate of −0.75% yr−1 from 2008 to 2018, followed by that of the Hengduan Mountains, with a reduction rate of −0.62% yr−1 from 2008 to 2018 [51], while the reduction rate in the eastern Himalayas is relatively small, about −0.48% yr−1 from 1990 to 2015 [52]. Overall, there are significant differences in the reduction rate of the glacier area with different glacier sizes and in different mountainous regions of the SETP [16,47,50,51,52].

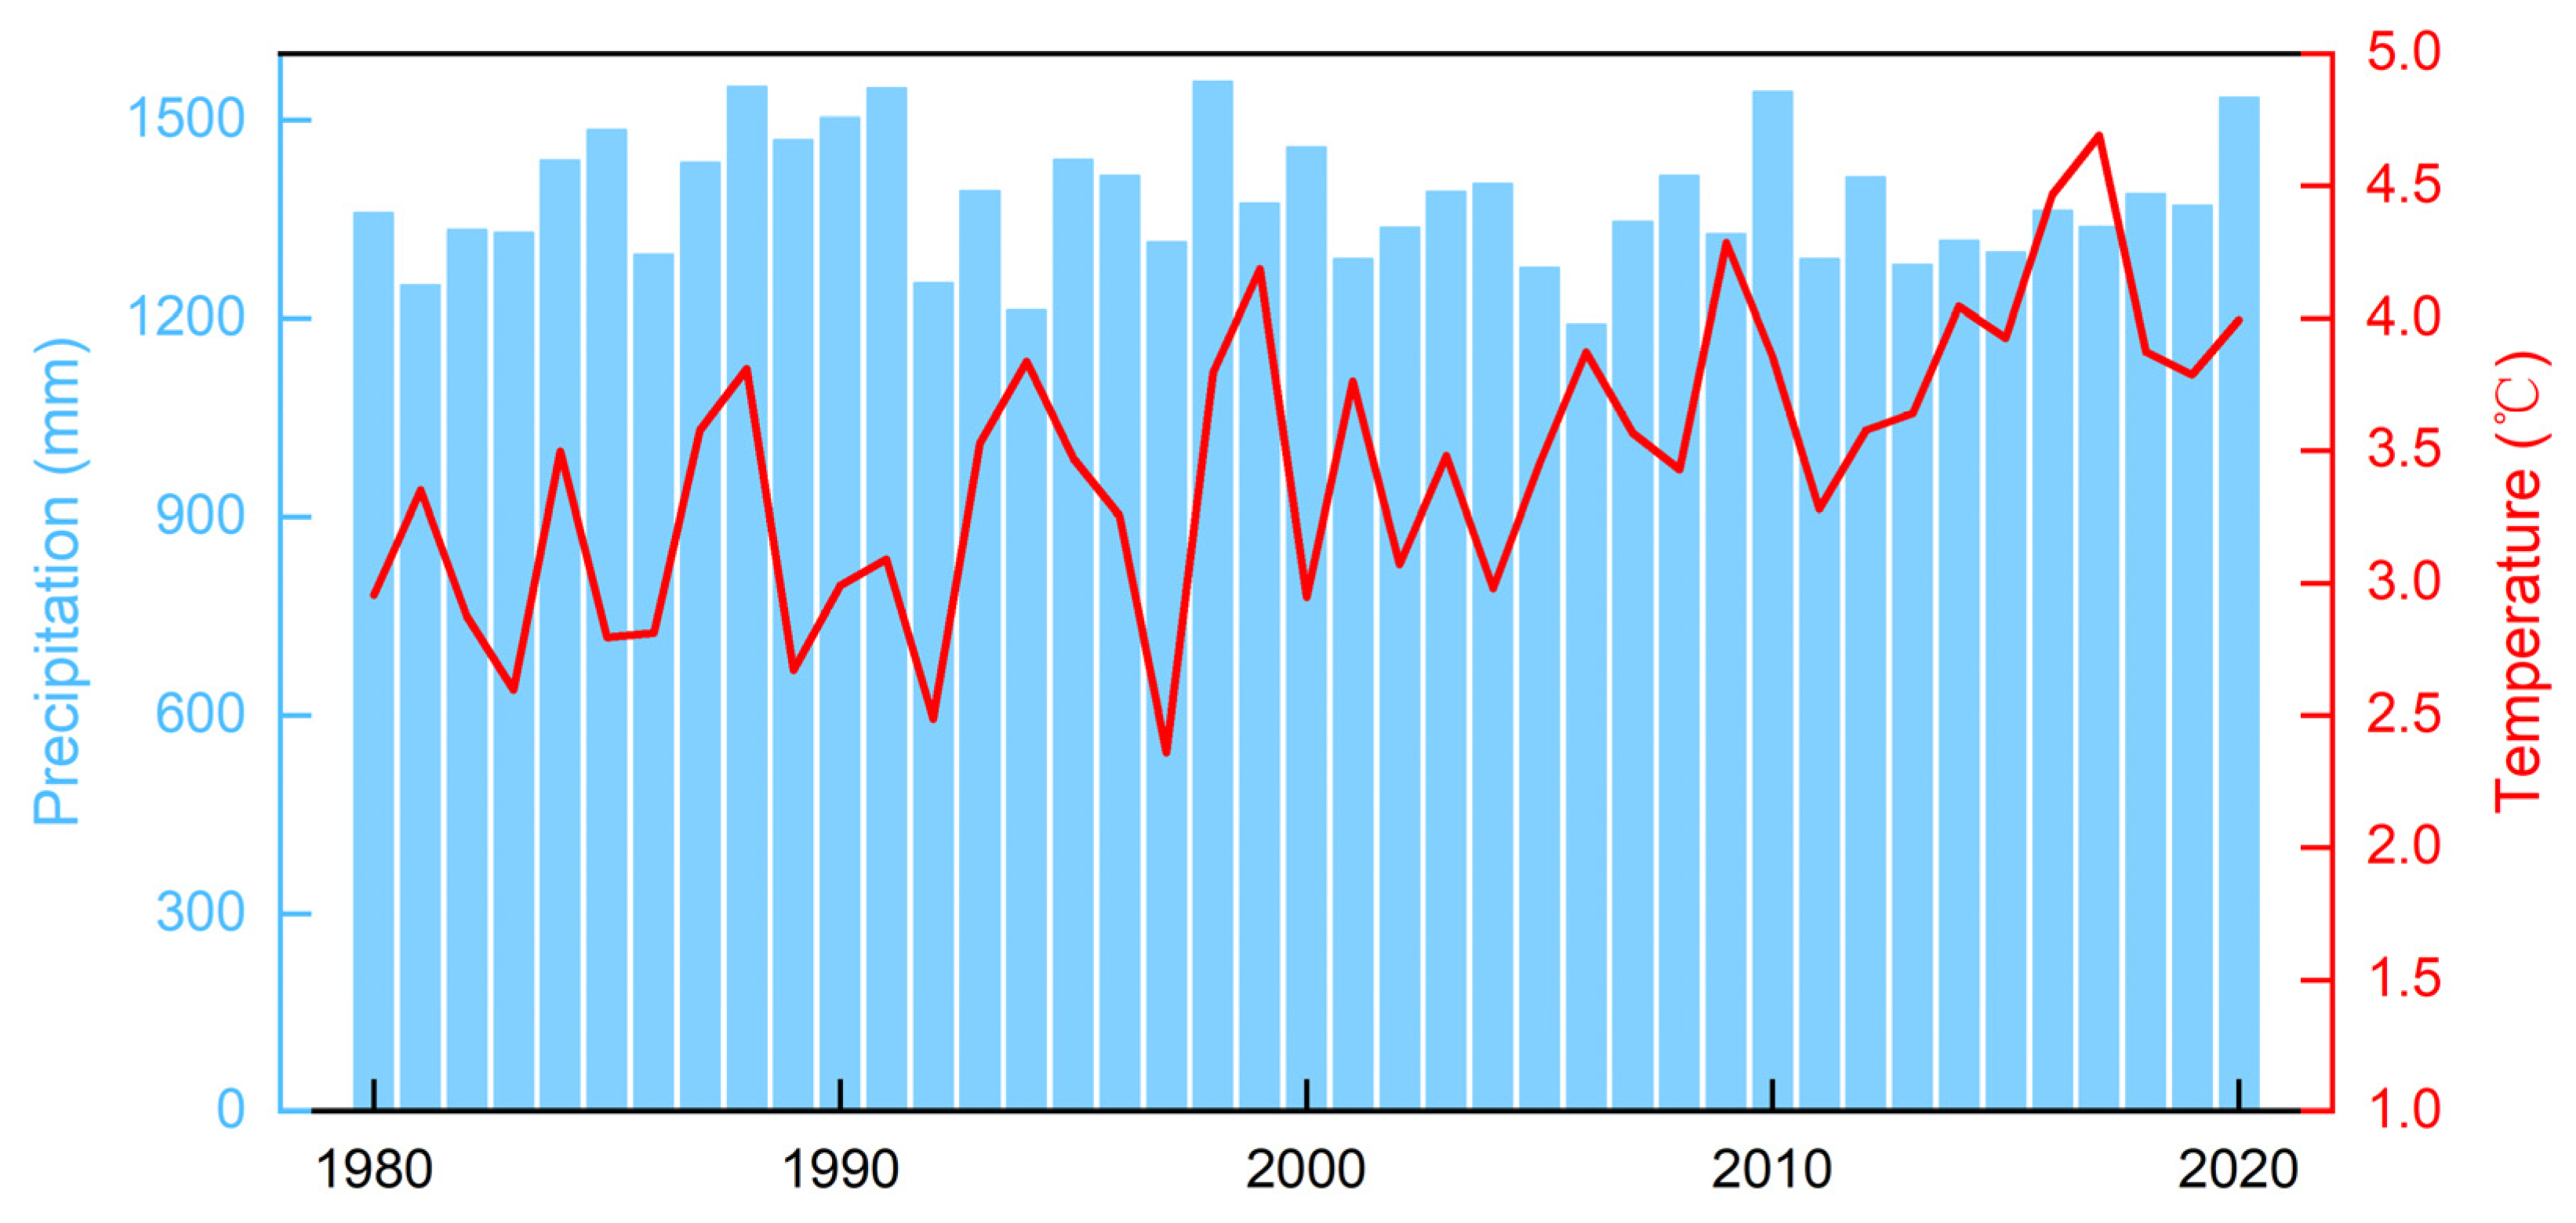
2.2. Climate of the SETP

The climate of the SETP is complex due to the influence of two synoptic circulation systems: the Indian monsoon in the summer and the westerlies in the winter (Figure 1). The Indian monsoon carries warm and humid air from the south via the Yarlung Zangbo River Basin and encounters the huge topographic landform, leading to high amounts of precipitation [16,18,19,53], while the westerlies modulate precipitation strength in spring and early summer via dynamic interaction with the Indian monsoon [53,54]. In the glacierized regions, the magnitude of precipitation is highly variable, with the annual precipitation ranging from 1000 to 3000 mm [16,17]. Most of the precipitation falls between April and October, accounting for approximately 60–90% of the annual precipitation, while the remaining months have less precipitation [16,19,28,50,55,56]. In general, the mean annual temperature in the region decreases from southeast to northwest [6,17,19]. On average, the warmest month in the SETP is usually July, with monthly average temperatures in different regions ranging from 16 to 19 °C, while the coldest month is January, with monthly average temperatures between 0 and 4 °C [25].
High-elevation regions in the SETP have a paucity of observations, and meteorological monitoring has been carried out for only a few glaciers during different periods (Table S2). According to meteorological observations from 1988 to 2020 on the Hailuogou Glacier (~3000 m a.s.l.; Figure 1) in the Hengduan Mountains, it is found that the average annual temperature is about 4.6 °C, whereas the average annual precipitation is approximately 1884 mm. Meteorological observations from 2008 to 2020 on the Baishui River Glacier No. 1 (~4700 m a.s.l.; Figure 1) in Mt. Yulong reveal that the average annual temperature is about −0.11 °C, whereas the average annual precipitation is about 2389 mm. In addition, the precipitation near the equilibrium-line altitude of the Parlung Glacier No. 4 (~5400 m a.s.l.) is about 2500–3000 mm [42,57].

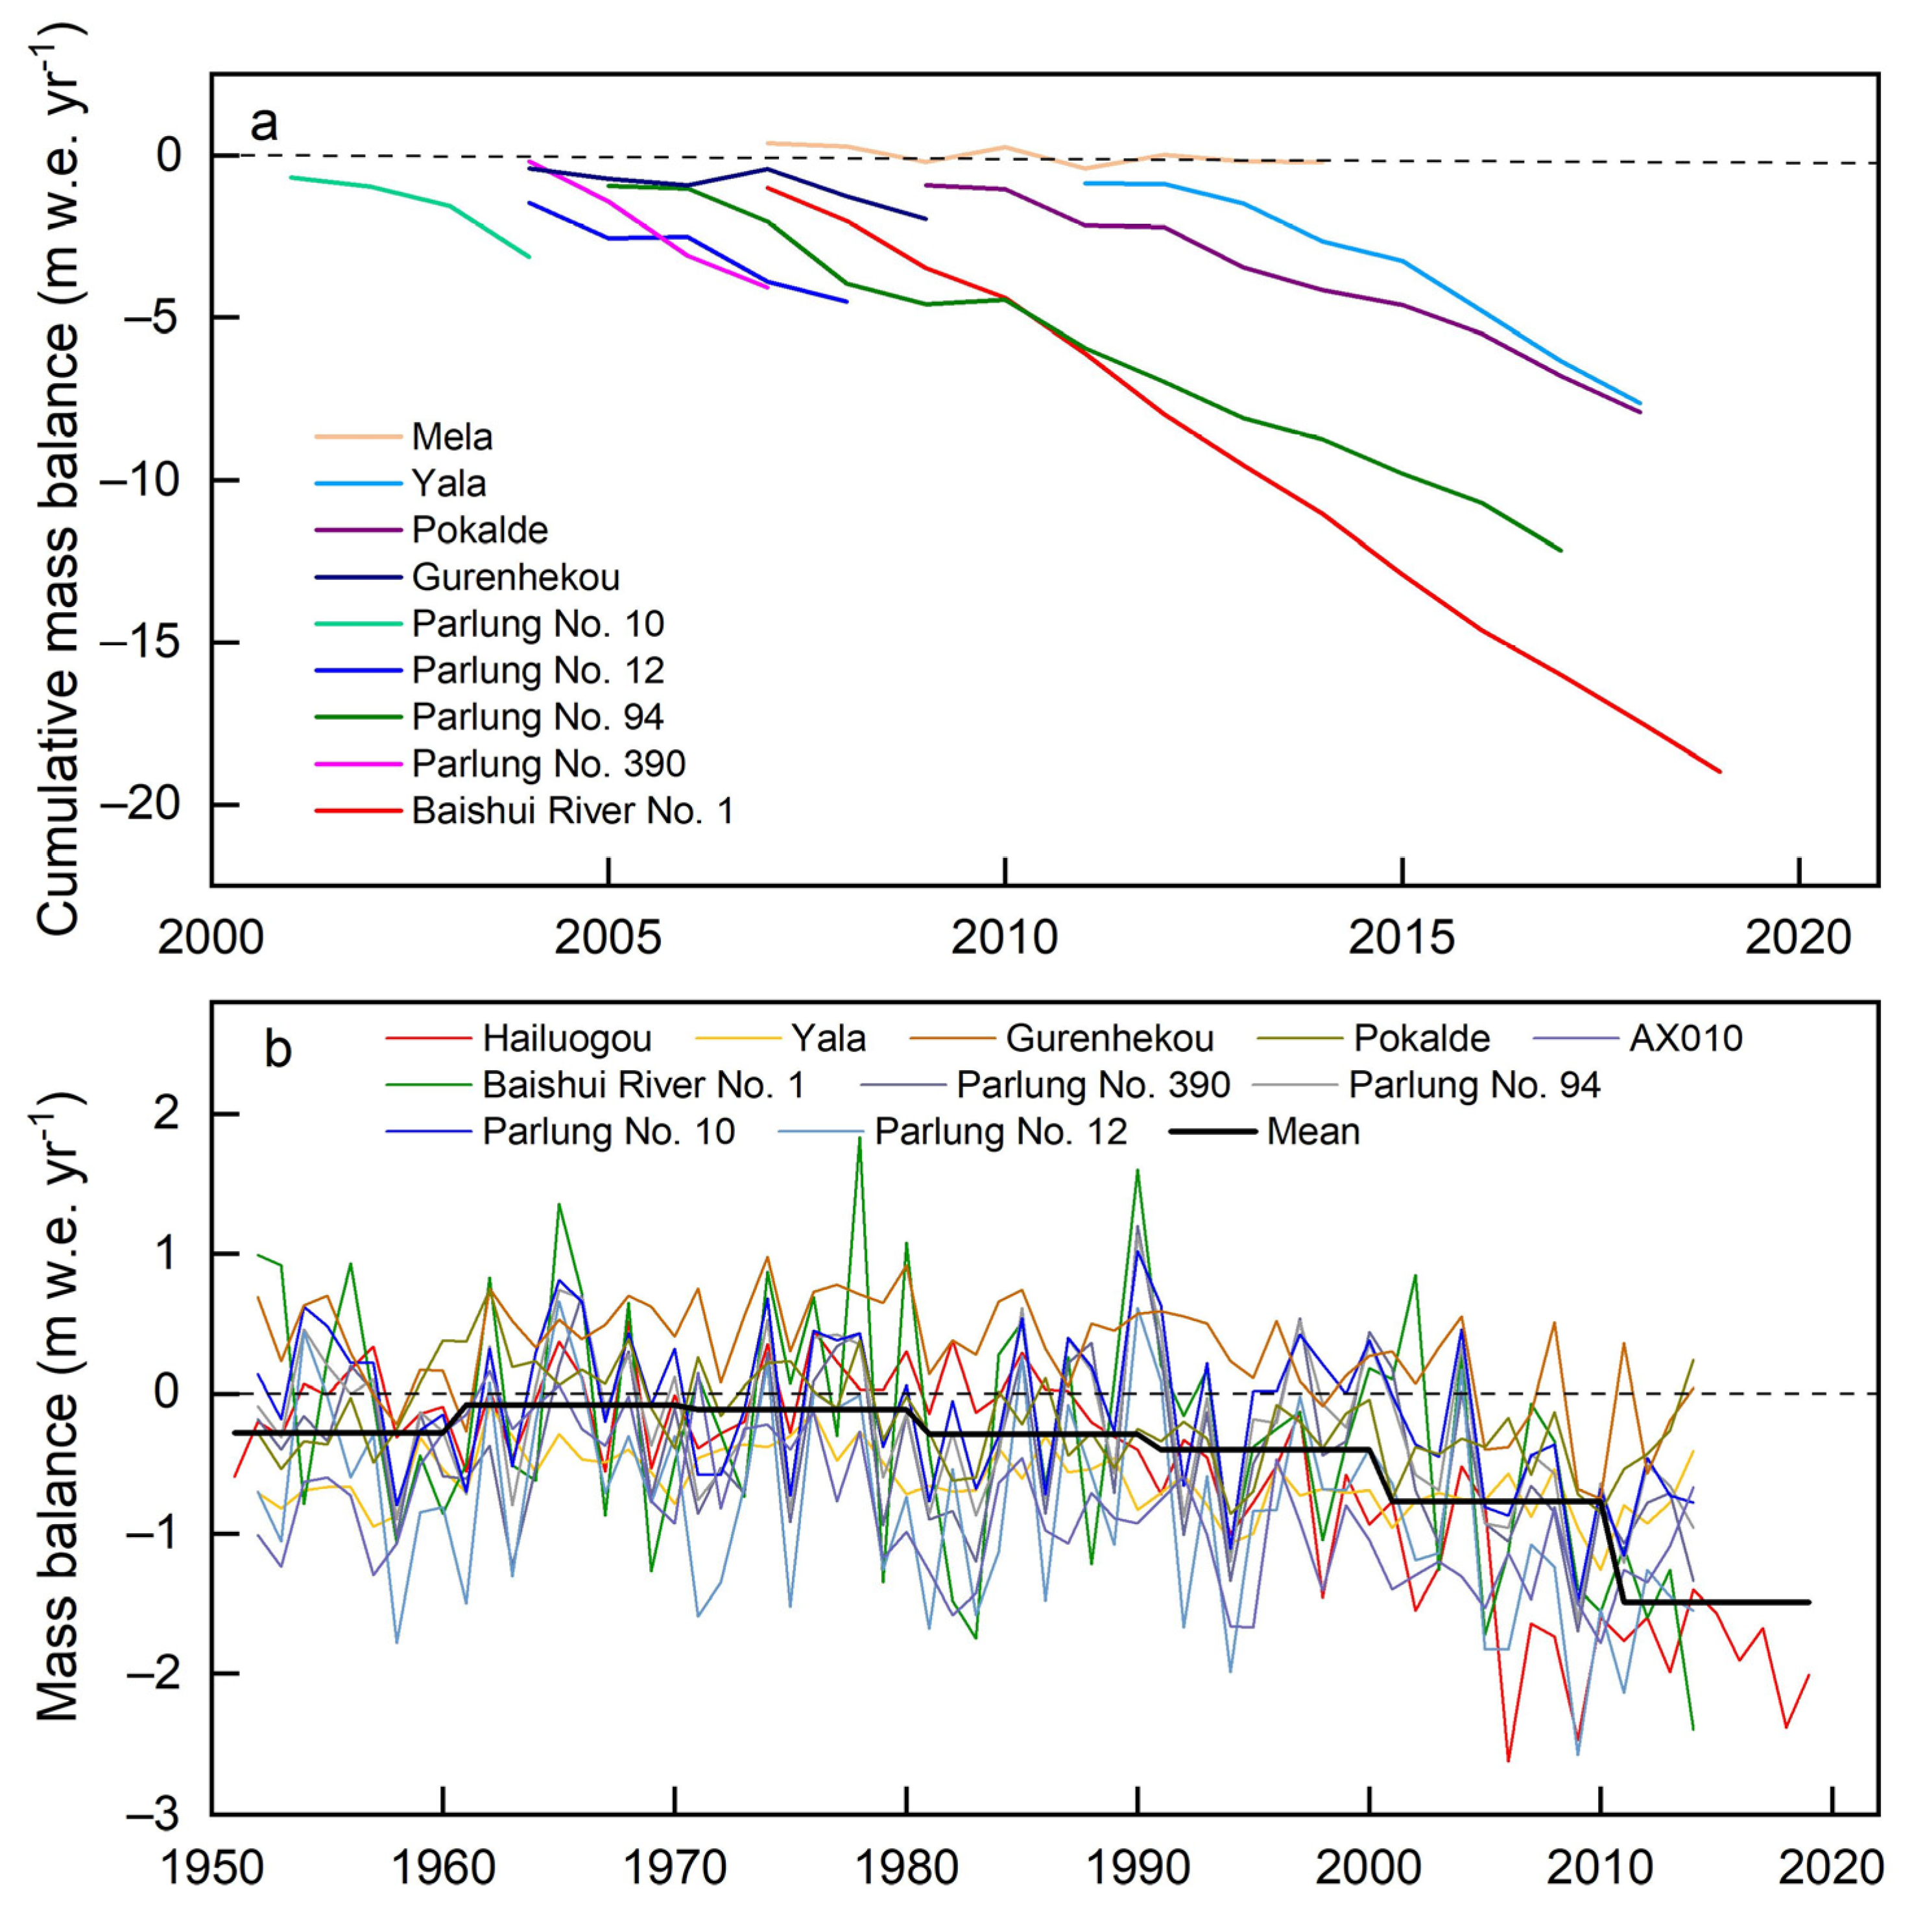
2.3. Observations on Maritime Glaciers

Although observations on maritime glaciers in the SETP are hampered by the harsh climatic conditions and remote access to glaciers, investigations of maritime glaciers in the region date back to the early 20th century [58,59,60]. Since the 1950s, scholars have conducted field observations on typical maritime glaciers from different perspectives [18,19,61,62,63,64]. A comprehensive scientific expedition and research in the Hengduan Mountains was carried out in the 1980s [18,19], during which a series of glacier–hydrometeorological observation data were obtained on different typical glaciers. During recent decades, maritime glaciers have become one of the areas of greatest concern due to their higher sensitivity to climate change [25,26,43,46,57,65], and several monitoring stations have been successively established on/near typical glaciers in the SETP [42,43,44].
Compared with other regions of the TP, glacier monitoring is sparse in the SETP, leading to a paucity of observations. In the SETP, mass balance observations have been conducted for less than 1% of maritime glaciers using the glaciological method during different periods (Figure 1), of which only four glaciers (the Baishui River Glacier No. 1, the Parlung Glacier No. 94, the Mera Glacier, and the Pokalde Glacier) have mass balance records of greater than 10 years. Among the four glaciers, field observations have not been continued for the Mera Glacier and the Pokalde Glacier [66,67,68], while field observations of the Baishui River Glacier No. 1 and the Parlung Glacier No. 94 began in 1982 and 2006, respectively, and continue to this day [1,35,44,69]. Although the Hailuogou Glacier (Figure 1), the longest glacier on the eastern slope of Mount Gongga in the Hengduan Mountains, has discontinuous short-term mass balance records [19,64,70], continuous meteorological and hydrological observations have been conducted for the glacier since 1988 [27,28].
In addition, the rapid development of remote sensing technologies provides important data support for monitoring the mass changes in maritime glaciers [71]. Three main satellite-based approaches have been developed over the last two decades [71,72], which are digital elevation model (DEM) differencing from stereo-imagery and synthetic aperture radar interferometry, repeat radar and laser altimetry, and space gravimetry. Recently, these approaches have been widely applied to maritime glaciers in the SETP; the glacier mass balance at different temporal and spatial scales has been obtained based on multisource satellite datasets, and the accuracy of these approaches has been demonstrated [24,25,26,47,56,73].

2.4. Methods

Three large scientific databases (Web of Science, Science Direct, and CNKI) were used to conduct a query based on a keyword-based search protocol. The search string was determined considering the three topics involved in this study: southeastern Tibetan Plateau, mass, and glacier. Hence, “southeastern Tibetan Plateau”, “mass”, and “glacier” in the title, abstract, or keywords were used in the following search query. The inclusion criteria comprised (1) studies that declared or investigated maritime glacier mass change in the SETP and its surroundings and (2) articles written in English or Chinese that were published from the 1990s to the present. The exclusion criterion comprised studies that did not clearly identify maritime glacier mass changes in the SETP and its surroundings, although the study area was located there.
The search of the Web of Science returned 99 results, while Science Direct and CNKI all returned 19 results. In addition, other studies, which were obtained from the reference lists in the selected publications that contained maritime glacier mass balance results of the SETP and/or were relevant to understanding the observed mass balance of maritime glaciers, were also reviewed. After removing duplicate results, we ended up with 110 papers. Then, relevant data and results were extracted from these selected papers and stored in files, which were used to analyze the research questions proposed in our study.

3. Recent Advances in the Mass Balance of Maritime Glaciers in the SETP

Glacier mass balance is expressed as the sum of mass gain on a glacier, mainly in the form of solid precipitation, and mass loss, mainly in the form of ice ablation during a specified period [45]. The glacier mass balance rate is a key variable for characterizing the health status of glaciers [45,74], providing a more direct access point for understanding glacier–climate interactions and energy–mass–water exchange on glaciers. Based on in situ, satellite observations and simulation results of glacier mass balances, we systematically analyzed the spatiotemporal pattern of maritime glacier mass balances in the SETP.
Recent satellite-based measurements using DEM differencing, repeat radar/laser altimetry, and gravimetry revealed a consistent trend in the mass balance of maritime glaciers in the SETP from the 1970s to 2020 based on different sources of remote sensing data [8,9,10,25,26,47,75,76]. These results indicated that maritime glaciers in the region have been in an overall state of mass loss since the 1970s (Figure 3). These glaciers showed a slight mass loss from the 1970s to 2000, while the glacier mass loss rate has accelerated since 2000 (Figure 3). Compared with the glacier mass loss from the 1970s to 2000, the average glacier mass loss rate during 2000–2020 was several times higher than that during this period (Figure 3). Overall, the mass loss rate of maritime glaciers across the region was approximately −0.74 m w.e. yr−1 over the last two decades.
According to satellite-based estimates [8,9,10,25,26,47,75,76], it was found that there was marked spatial heterogeneity in the rate of glacier mass change in different mountainous regions of the SETP (Table 2). Across the region, the largest glacier mass loss was observed in the Hengduan Mountains, followed by the Nyainqêntanglha Mountains, while the mass loss rate of the eastern Himalayas is relatively small (Table 2). Within the Nyainqêntanglha Mountains (Figure 1), glacier mass loss in the eastern part was greater than that in the central part for the period 2000–2013 [75,77]. For specific sub-regions of this region, the maximum rate of glacier mass loss was observed in the eastern Bomi region for the period 2000–2019 (−1.04 m w.e. yr−1), followed by that in the eastern Yigong Zangbo region (−0.63 m w.e. yr−1) [25], while the glacier mass loss rate in the Gangrigabu Range was relatively small (−0.46 m w.e. yr−1), and it was similar to the average glacier mass loss rate in the Nancha Barwa region (Figure 1) for the period 2000–2019 [25,75].
Most field observations of maritime glacier mass balance in the SETP have been conducted since 2000 (Figure 4a). According to field observations of glacier mass balance, we found that the average mass balance of observed glaciers ranged from −1.46 m w.e. yr−1 to −0.03 m w.e. yr−1 for the period 2000–2020 [1,46,66,68,78,79]. Although the observed periods on these glaciers were different, and the starting and ending years of observations were quite different, the multi-year average mass balance of these monitored maritime glaciers was in a deficit state (Figure 4a). Overall, the average mass loss of these observed glaciers during 2001–2010 was about −0.78 m w.e. yr−1, while the mass loss has rapidly increased since 2010 (Figure 4a), with an average rate of −1.0 m w.e. yr−1. Among these observed glaciers, the mass loss rates of the Mera Glacier and the Gurenhekou Glacier (Figure 1) were relatively small, while other glaciers experienced dramatic mass loss (Figure 4a). The average mass balance of the Baishui River No. 1 Glacier (Figure 1) has reached −1.55 m w.e. yr−1 since 2010, and the Parlung No. 94 Glacier and the Yala Glacier both reached approximately −0.95 m w.e. yr−1 during the same period.
Long-term mass balance reconstructions of different maritime glaciers in the SETP indicated that three distinct periods of the time series of the mass balance are detected (Figure 4b). Most of these glaciers showed slightly insignificant mass loss from the 1950s to the late 1980s and then began to experience an increasing trend of negative mass balance. Since the 21st century, the negative mass balance of maritime glaciers has rapidly intensified (Figure 4b). A recent glacier mass balance reconstruction in the Parlung Zangbo Basin of the SETP indicated that the average glacier mass balance of the basin was approximately −0.38 m w.e. yr−1 during 1980–1999 and −0.62 m w.e. yr−1 during 2000–2019, and especially small glaciers in the basin have experienced considerable mass loss over the last few decades, in which approximately 52% of glaciers with an area less than 1 km2 experienced significant negative mass balance during 1980–1999, while this proportion increased to 80% during 2000–2019 [56]. Cumulative glacier mass balance statistics indicated that the mass loss of these glaciers since 2000 accounted for approximately 66% of the total cumulative mass loss for the period 1952–2020. Among these glaciers, the AX010 Glacier and the Parlung Glacier No. 12 had the largest cumulative mass loss, followed by the Hailuogou Glacier. Even for glaciers in the same mountainous region, the difference in glacier mass loss was apparent. For example, the cumulative mass loss of the glaciers in the Parlung Zangbo Basin differed several times.
In summary, in situ and remote sensing-based observational evidence and model reconstructions reveal that maritime glaciers in the SETP have undergone significant and continuous mass loss over the last several decades, and the glacier mass loss rate has accelerated since 2000. Across the region, the mass balance of maritime glaciers shows significant spatial heterogeneity, even in the same mountainous region.

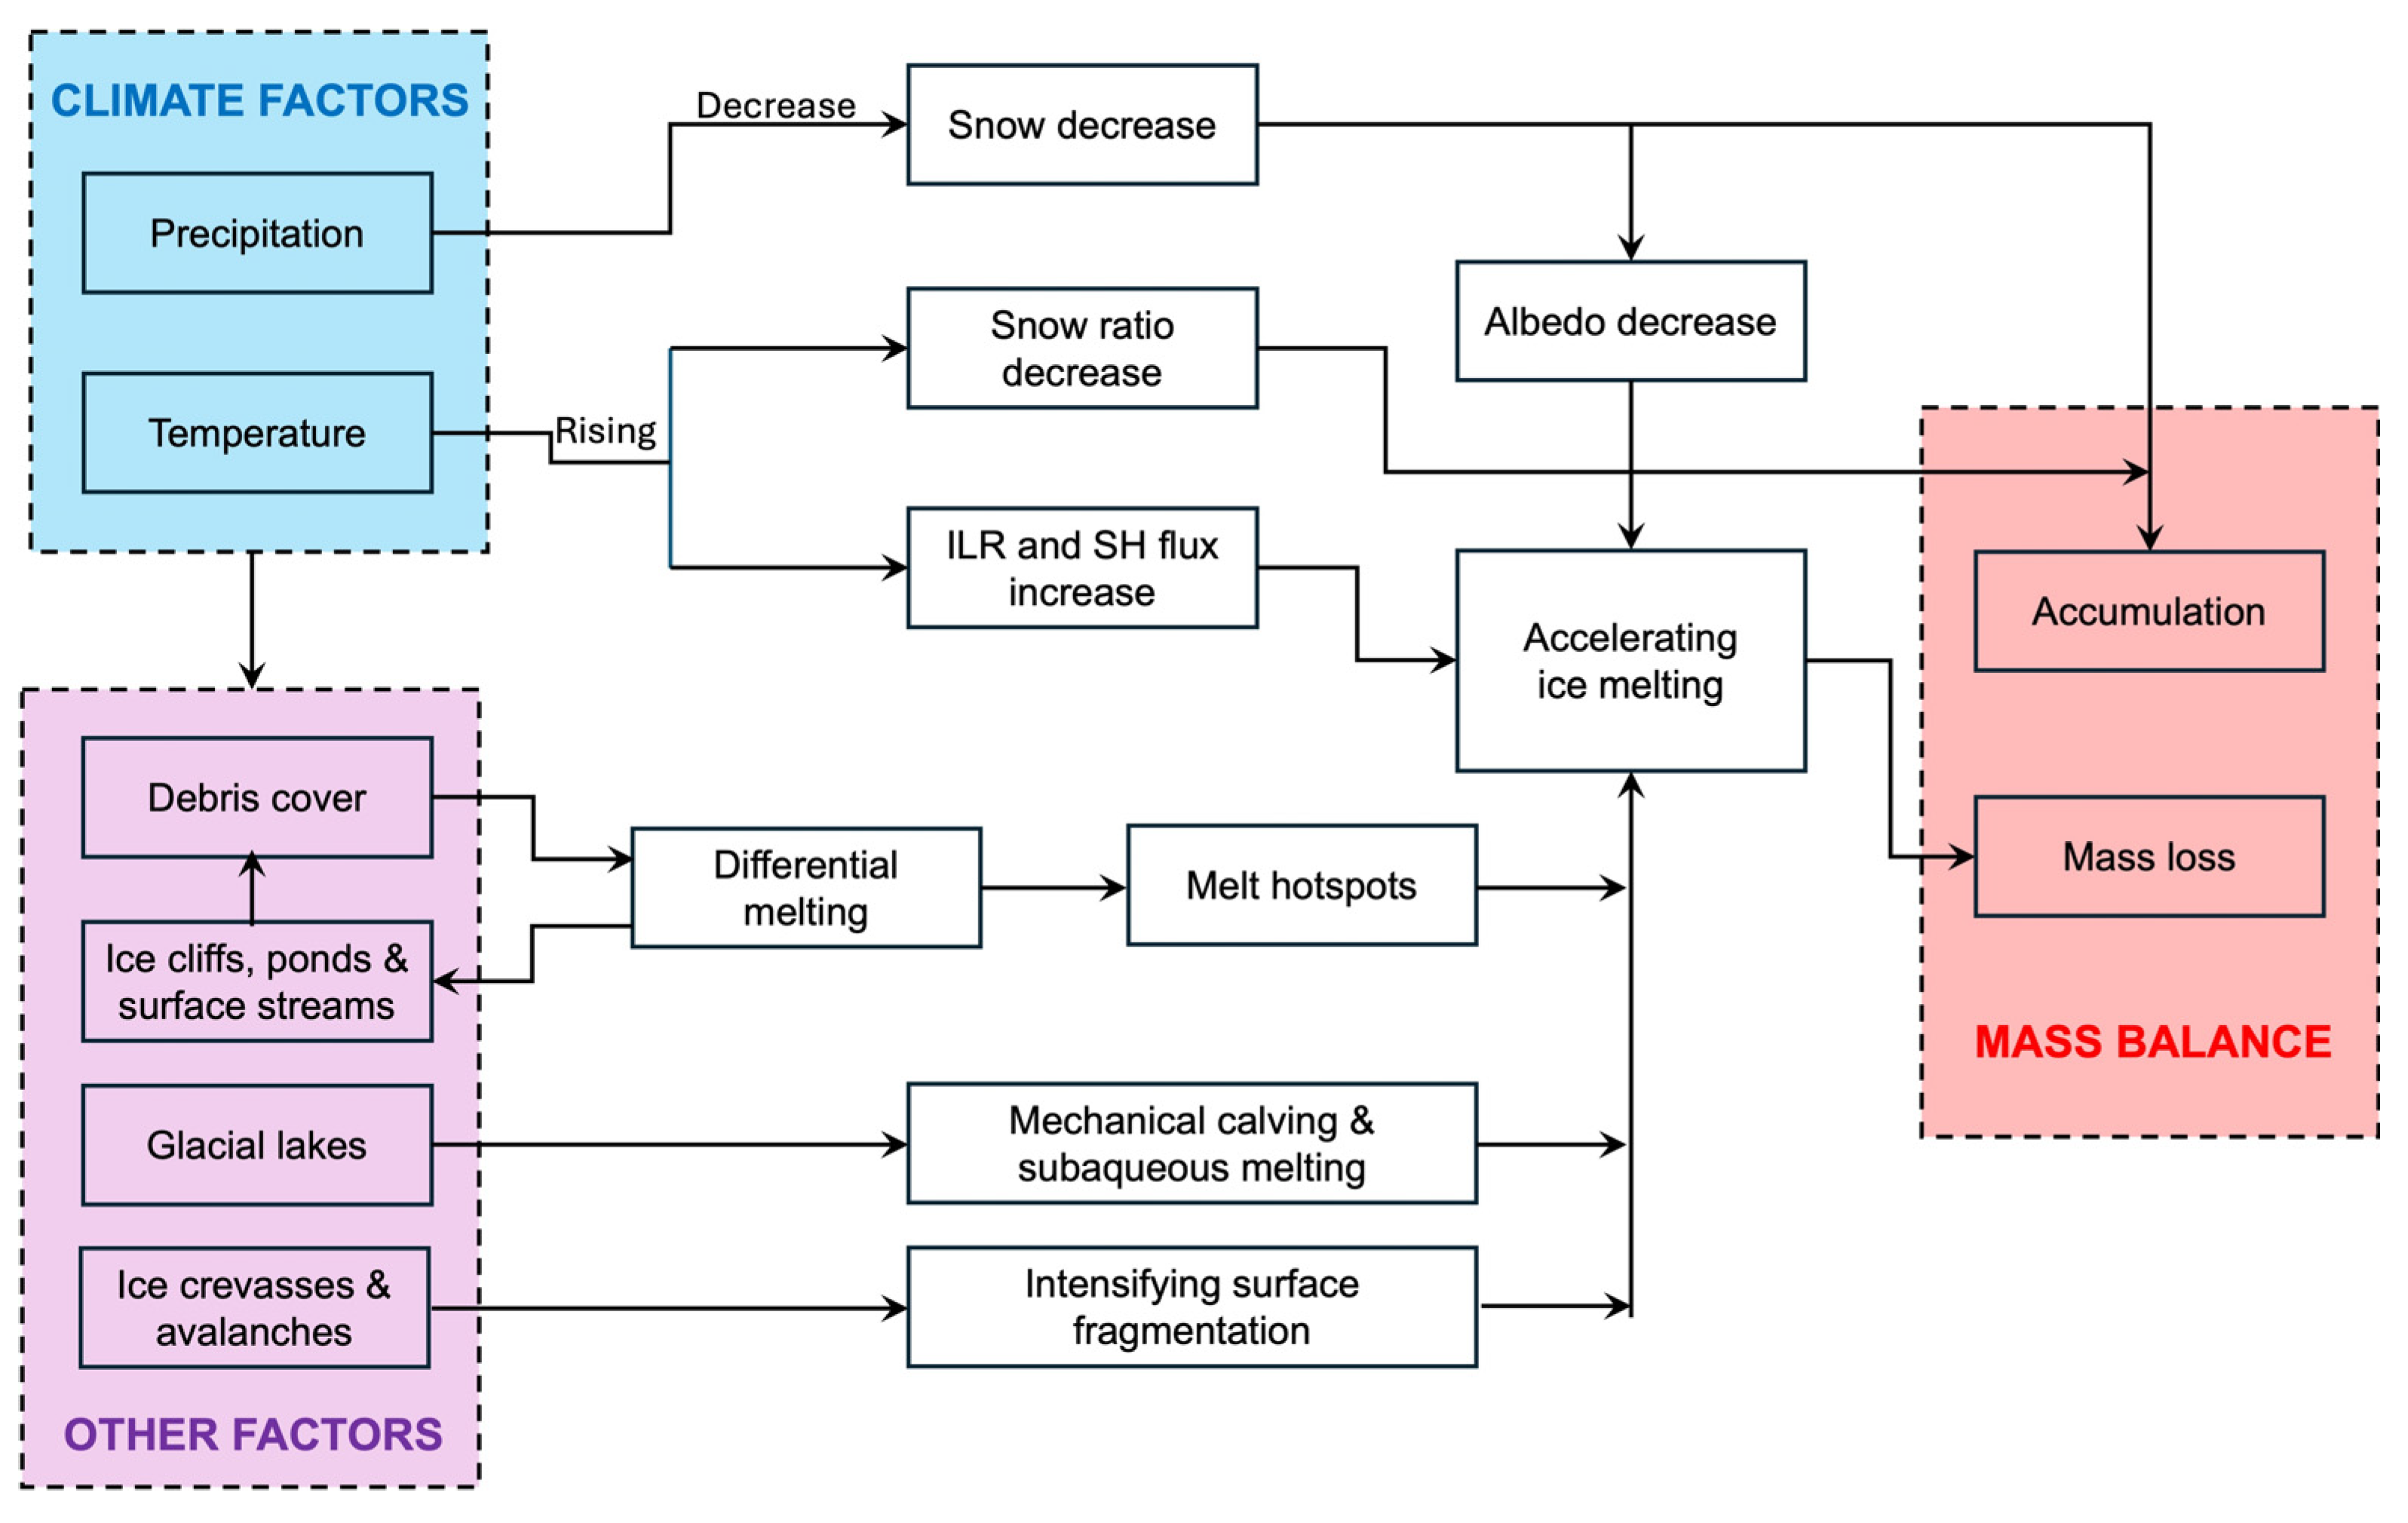
4. Drivers of Maritime Glacier Mass Loss in the SETP

As discussed above, maritime glaciers in the SETP have experienced considerable mass loss over the last few decades, leading to glacier retreat [65,83], expansion and thinning of the ablation zone [21,25], and an increase in glacier runoff [27,28]. The mass change in maritime glaciers in the SETP is being modified by climate change and other factors (e.g., debris cover, glacial lakes, and ice crevasses) (Figure 5), the effects of which need to be better understood.

4.1. Glacier Mass Loss Driven by Climate Change

Decreased snow accumulation or increased ablation generally controls the mass balance of maritime glaciers (Figure 5), and both of them are affected by changes in temperature and precipitation, especially temperature change [45,74]. Mass balance sensitivity experiments in different studies have shown that maritime glaciers in the SETP have a higher sensitivity to temperature change [17,45,56,81,82], and especially the mass balance of these glaciers demonstrates a markedly negative correlation with air temperature and a positive correlation with precipitation [45,50,57,81,84].
Here, we analyze temperature and precipitation data over the SETP from 1979 to 2021 based on outputs of the Fifth Generation European Centre for Medium-Range Weather Forecasts (ECMWF) Reanalysis ERA5 (https://cds.climate.copernicus.eu/; accessed on 3 September 2022). The results show that the SETP has experienced considerable warming overall since the end of the 1970s (Figure 6). The annual average warming rate over the entire SETP was approximately 0.31 °C (10 yr)−1 during 1979–2021 (Figure 6), which is higher than the global average rate [85]. The warming rate doubled in the SETP from 0.24 °C (10 yr)−1 during 1979–2000 to 0.48 °C (10 yr)−1 during 2001–2021. Especially in winter (October to the following February), intense warming was observed, in which the average warming rate over the region is approximately 0.30 °C (10 yr)−1, which was significantly higher than the warming rate in summer (0.24 °C (10 yr)−1, June to September) [25]. Meteorological observations from different national weather stations (e.g., Bomi, Chayu, Linzhi, and Luolong; Figure S2) and from different typical glacierized regions in the SETP confirmed this significant warming trend in recent decades [7,28,44,56,57,75,83,86], especially at high elevations [28,44,56,57,86]. The annual average warming rate on the Baishui River No. 1 Glacier (~4700 m a.s.l.; Figure 1) on Mt. Yulong from 2008 to 2020 was approximately 0.27 °C (10 yr)−1 [44], while the average rates on the Parlung Glacier No. 4 (~4650 m a.s.l.; Figure 1) from the early 1990s to 2018 and the Hailuogou Glacier (~3000 m a.s.l.; Figure 1) from 1988 to 2017 reached approximately 0.39 °C (10 yr)−1 [57]) and 0.50 °C (10 yr)−1 [28], respectively.
Rising temperatures, especially in winter, directly lead to a longer glacier ablation season. In addition to prolonging the ablation period, the influence of temperature rising on the increased mass loss of maritime glaciers is mainly attributed to two processes. First, increasing temperatures reduce the snow ratio by decreasing the precipitation falling as snow (Figure S4). Observations on typical maritime glaciers (e.g., the Parlung Glacier No. 4 and the Hailuogou Glacier; Figure 1) showed a significant decrease in the ratio of monsoon snowfall to monsoon total precipitation [57,82]. The decrease in fresh snow reduces snow accumulation and glacier surface albedo, which enhances the absorption of solar radiation, leading to greater ice melting [57,82,87]. Second, the energy balance processes on the glacier surface are generally closely related to the changes in air temperature, which especially affects the incoming longwave radiation and sensible heat flux on the glacier surface [88]. It is well known that the air temperature has limited influence through the sensible heat flux, and its information is transferred to the glacier surface mainly through the incoming longwave radiation [88], which is the main energy source for glacier ablation together with the shortwave radiation [45,88]. Therefore, temperature rising in the SETP leads to increased mass loss of maritime glaciers by profoundly affecting the snow ratio, surface albedo, incoming longwave radiation, and sensible heat flux. This may be the primary reason explaining why these glaciers have had a more negative mass balance in the last few decades.
Precipitation in the SETP, in contrast, has shown a slightly decreasing trend overall (Figure 6), but with apparent seasonal and regional differences [16,49,86,89]. In particular, the snowfall in the region has significantly decreased during the last decades [26,56,57,82,90], and a significant decrease in snowfall was observed after 2008 [56]. Precipitation observations from national weather stations and different typical glacierized regions in the SETP confirmed this decreasing trend during recent decades [26,56,57,82,90]. According to precipitation observations on the Hailuogou Glacier in the Hengduan Mountains (~3000 m a.s.l.; Figure 1), statistical analysis revealed that the mean annual solid precipitation for the period 2006–2020 reduced by about 36.0% compared with that during 1988–2005, whereas the days with solid precipitation decreased by 18.0% (Figure S4). Note that most maritime glaciers are referred to as summer-accumulation-type glaciers, as a large proportion of accumulation occurs during the monsoon months [18,19,87,91]. Observations at national weather stations (e.g., Bomi, Chayu, Linzhi, and Luolong; Figure S3) and on different maritime glaciers showed that precipitation in the monsoon months (June to September) has significantly decreased in the last decades, which is likely associated with the delayed onset or weakened intensity of the Indian summer monsoon [28,56,57]. A recent study confirmed that with a reduction in monsoon snowfalls, abundant spring snowfalls become increasingly important for reducing annual mass losses, but they remain insufficient to compensate for the exacerbated mass losses caused by monsoon temperature and precipitation changes [53,57]. In particular, the glacier areas receiving solid precipitation during the monsoon months have shrunk in the last few decades with the increase in the temperature [57]. Furthermore, large-scale atmospheric circulation patterns in the Eurasian region intensify the trend of decreased precipitation in the SETP [50,53,82,86]. Therefore, reduced precipitation further exacerbates the mass loss of maritime glaciers in the SETP.
In summary, air temperature and precipitation have simultaneously varied in the SETP during the last decades (Figure 6). The accelerated mass loss of these maritime glaciers is mainly attributed to warming and decreasing precipitation. Regional differences in warming rates and precipitation changes lead to spatially inhomogeneous glacier mass loss in the SETP.

4.2. Glacier Mass Loss Driven by Other Factors
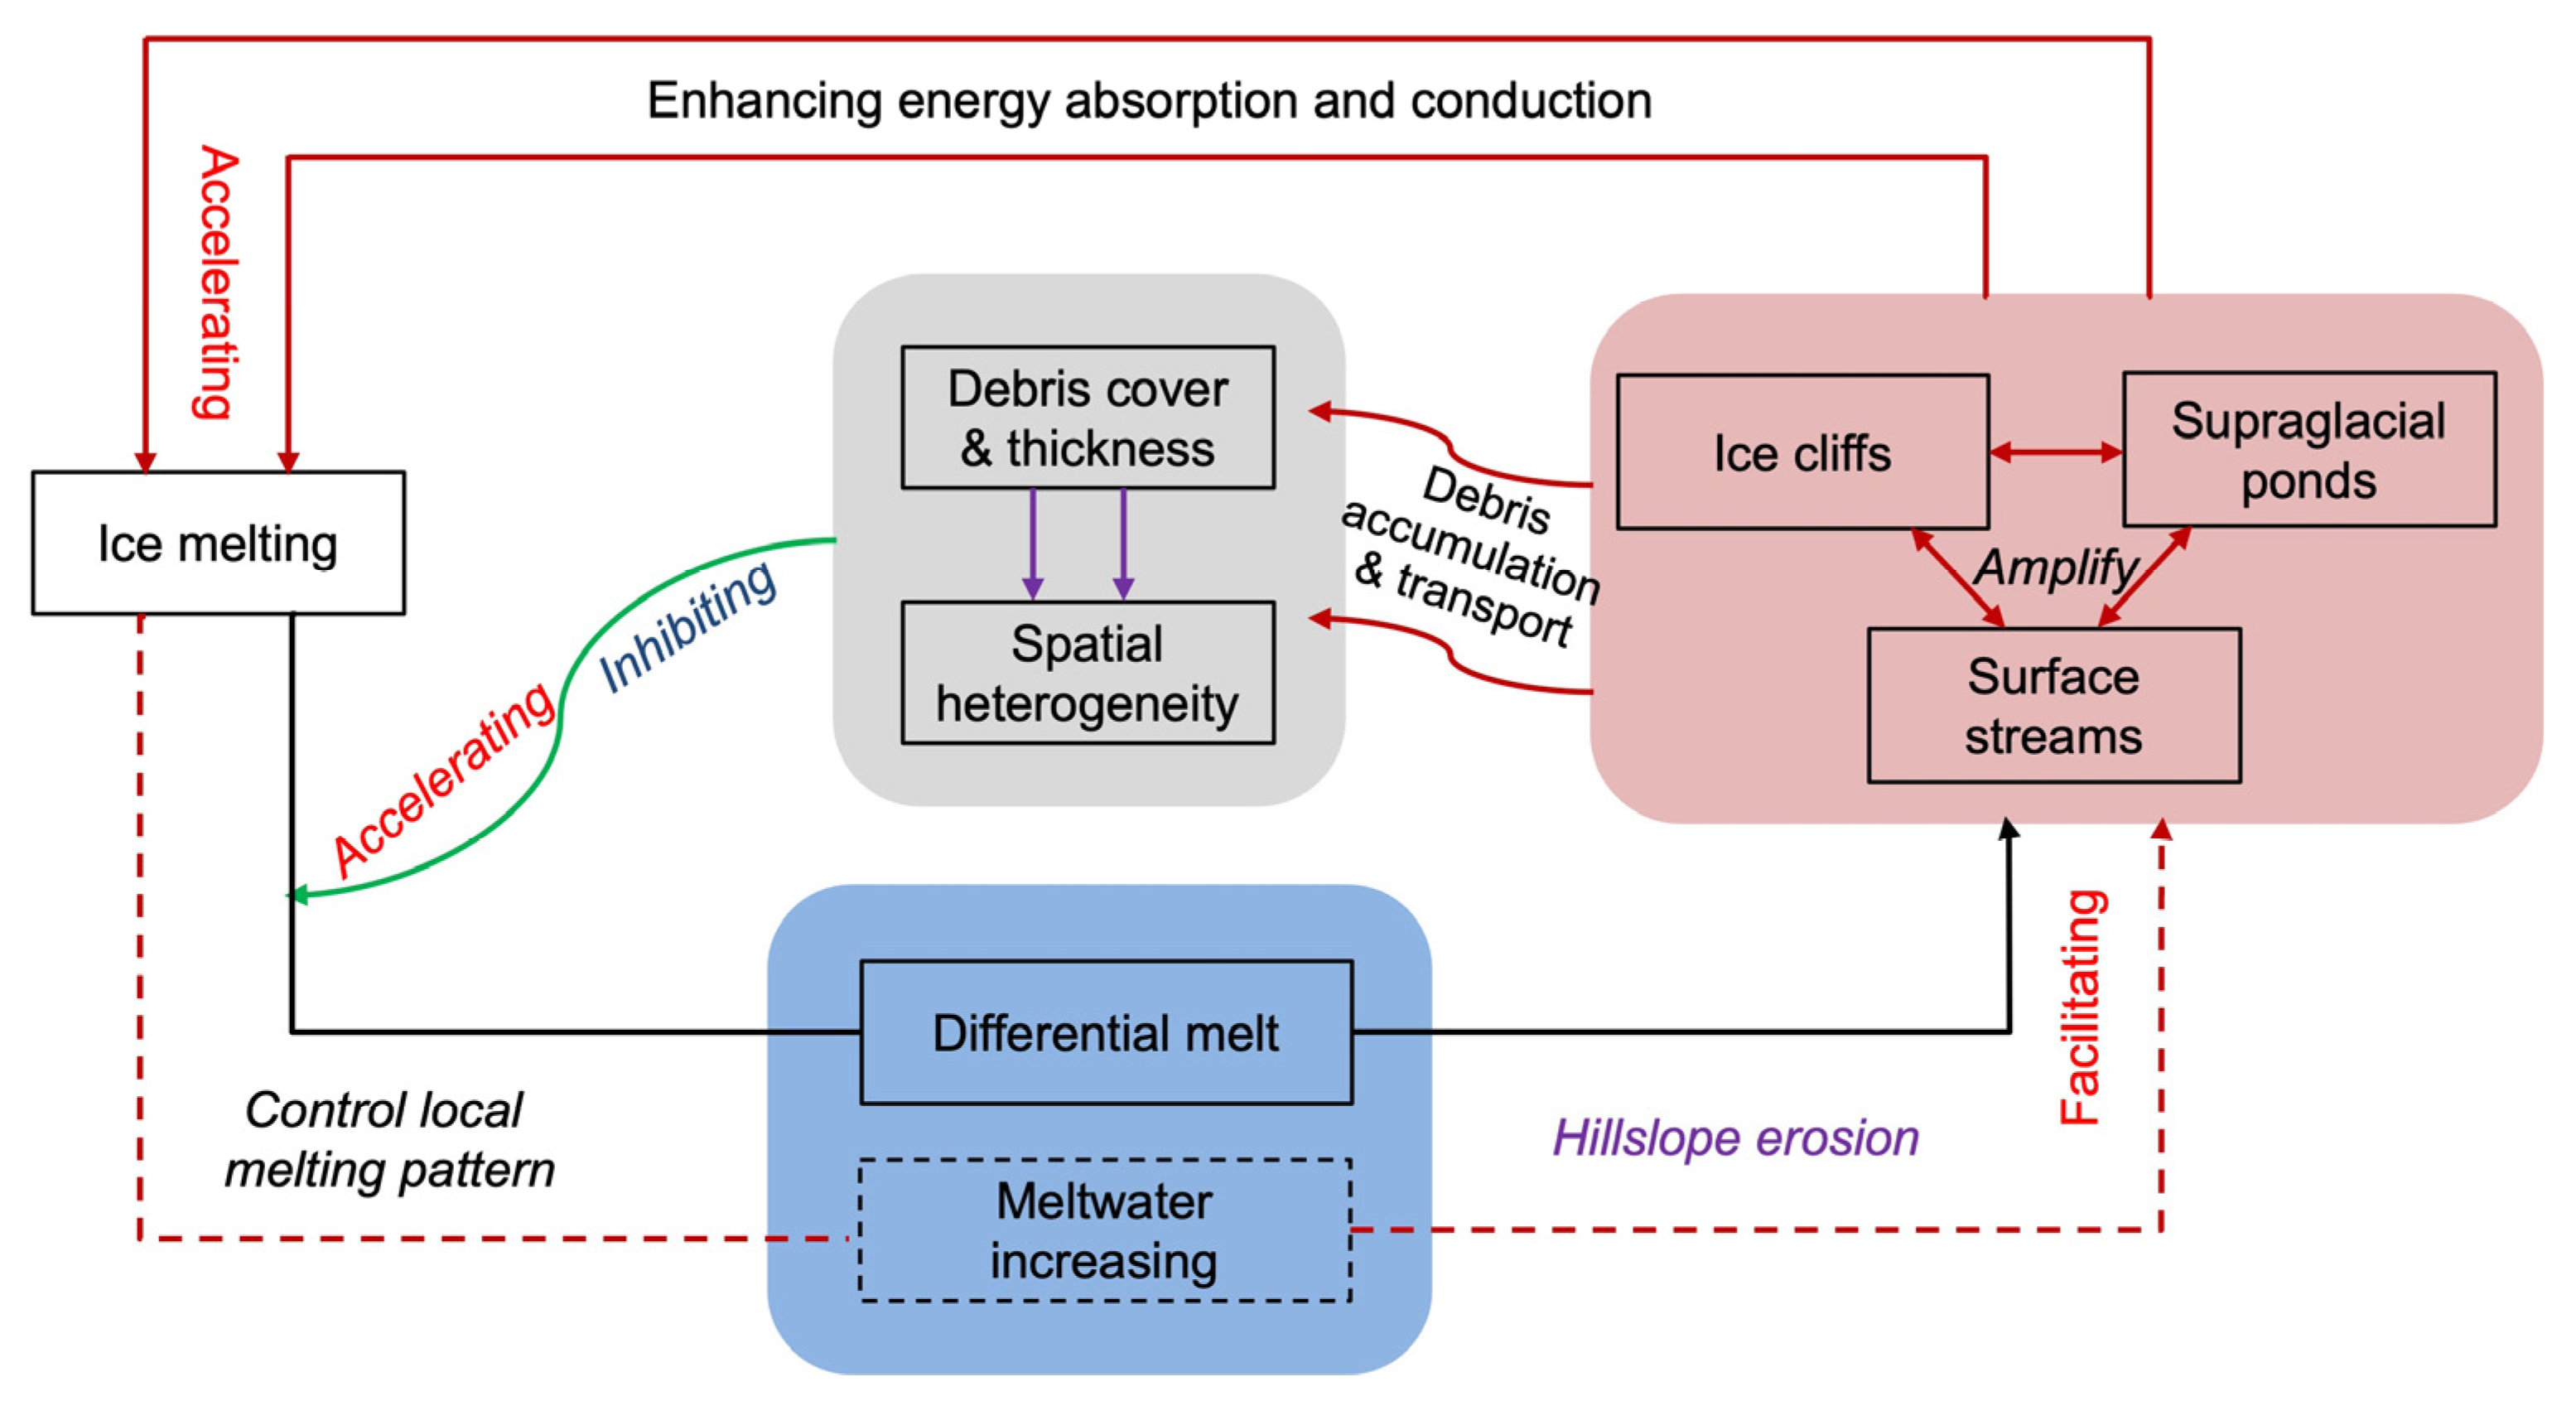
4.2.1. Debris Cover

Many maritime glaciers in the SETP have extensive debris cover on their ablation zones [19,20,21,41,69], where the debris-covered proportions range from 1.7% to 75.0% (Figure S1). Compared with clean ice or snow, the debris layer has distinctive physical properties (e.g., reflectance, particle size, and color) and thermal processes [92,93,94,95], leading to different melting processes in the underlying ice, that is, the ice melting rate is enhanced beneath thin debris layer in comparison with that of climatically equivalent exposed ice, while thick debris layers suppress the ice melting rate [41,92,93,94,95]. Consequently, the distribution of debris cover and its inhomogeneous thickness on glaciers profoundly affect the ice melting rate, surface thinning, and spatial patterns [21,41,69,96]. Analysis of a typical glacier in the Hengduan Mountains (Figure 1) revealed that due to the spatial distribution of supraglacial debris cover, about 67% of the ablation zone below the icefall on the glacier experienced accelerated melting compared with the climatically equivalent clean-ice surface, while approximately 19% of the zone experienced inhibited melting [41]. Importantly, with glacier retreat and continued mass loss, the spatial expansion of debris cover has been observed on different glaciers in recent decades [23,97,98,99]. A recent study on Mount Gongga in the Hengduan Mountains reported that the debris-covered proportion of the region increased from approximately 24.8% in 1990 to approximately 42.1% in 2019, among which the debris-covered proportion on the Hailuogou Glacier (Figure 1) increased from 13% to 22% during the same period [23]. This implies that the impact of debris cover is more significant than before. Therefore, the spatial distribution of debris cover and its influence on accelerating or inhibiting ice melting control the spatial pattern of ice melting rates in the ablation zone, thereby altering the altitude structure of glacier mass balance [41,96,100], which is quite different from that of clean glaciers of the region.
Due to the heterogeneous distribution of supraglacial debris thickness on the glacier, the glacier surface generally experiences significant differential melting (Figure 5 and Figure 7), which can further facilitate the formation and development of ice cliffs, supraglacial ponds, and surface streams on the glacier [95,101,102,103,104]. Ice cliffs, supraglacial ponds, and surface streams are referred to as melt hotspots, together with the thin debris layer [102,103,104]. Notably, the areas where melt hotspots are distributed on glaciers have been constantly expanding in recent years [21,23,102,103,104]. The distribution of these melt hotspots largely enhances the local melting and thinning of glaciers [41,102,103,104,105,106]. The distribution of ice cliffs and supraglacial ponds provides several times the amount of meltwater than the surrounding glacier areas [102,104,105,106]. Analysis of a typical glacierized catchment revealed that glacier mass loss in the entire catchment was underestimated by approximately 17% without considering the influence of ice cliffs [104], while the meltwater accelerated by the distribution of supraglacial ponds contributed about 12.5% of total ice loss in the catchment [102]. Furthermore, thin debris enhances melt rates [92,93,94,95], which are higher than those under thick debris, thus producing more meltwater for surface streams. Importantly, the coexistence of ice cliffs and surface streams causes each of them to amplify the effects of the other (Figure 7); that is, the melting of ice cliffs increases stream flow, whereas surface streams maintain ice cliffs by undercutting them [103]. This process allows debris rolling down them to accumulate in streams and increase the local variability in debris thickness (Figure 7). Then, the dynamic changes in debris thickness further intensify the differential melting of the glacier, whereby local glacier surface reliefs increase over time, which can cause new ice cliffs or supraglacial ponds to be created, thus tending to enhance the erosion and undercutting the effects of surface meltwater [96,103].
Overall, although the ice melting rate is suppressed beneath thick debris layer in comparison with that of climatically equivalent exposed ice, the distribution of melt hotspots such as thin debris, ice cliffs, supraglacial ponds, and surface streams and their continuous expansion on the glacier surface largely enhance the local ice melting and surface thinning of glaciers. In particular, the interactions among thin debris, ice cliffs, supraglacial ponds, and surface streams can help accelerate the mass loss of maritime glaciers in the SETP (Table S3).

4.2.2. Glacial Lakes

In situ and satellite observations showed that the number and size of glacial lakes in the SETP have grown rapidly in recent years (Figure S5) [25,107,108,109]. In total, there were 4479 glacial lakes with an area of 350 km2 across the SETP in 2018 [107]. The area of glacial lake at the terminus of the Yanong Glacier increased by 23% from 1999 to 2017 [108], while Guangxiecuo at the terminus of the Midui Glacier more than doubled in area from its 1988 outburst to 2020 [25]. In general, glacial lakes can form through the collection of meltwater in overdeepenings in former glacier beds that are uncovered during the process of glacier retreat, as well as the growth and coalescence of supraglacial ponds on debris-covered glaciers [15,96]. Glaciers connected to glacial lakes are generally called lake-terminating glaciers (Figure S5) [25,109,110], and many of them are small glaciers [25]. With the formation and gradual expansion of glacial lakes at the terminus of glaciers, the mass loss of such glaciers is amplified by glacial lakes through mechanical calving and subaqueous melting [25,109,110,111]. Two processes control calving, namely, fracturing and thinning of the ice as it flows toward the calving margin [45,111], while ice melting in the subaqueous part is mainly enhanced through the interaction of heat/mass at the water-ice interface [112].
It should be pointed out that there is a mutually reinforcing dynamic relationship between the formation and expansion of glacial lakes and glacier mass change (Table S3), which is positive feedback [15,25,75,110]. The relationship between the area of glacial lakes and glacier mass balance in the SETP was plotted [75], which revealed that glacier mass balance tends to be more negative with the increase in the glacial lake area, and it becomes stable after the area of glacial lakes exceeds 1.0 km2. A recent glacier mass change study in the SETP integrating satellite altimetry (ICESat, CryoSat-2, and ICESat-2) with DEM differencing and satellite gravity reported that lake-terminating glaciers in the region experienced a 45.0% faster mass loss rate than that of land-terminating glaciers from 2003 to 2019 [25], which was generally consistent with the results of previous studies [75,109,110].
Overall, glacier shrinkage and mass loss in the SETP facilitate the formation and expansion of glacial lakes, and this trend is likely to continue in the context of climate warming. Then, glacial lakes promote ice loss through calving and subaqueous melting, causing additional glacier mass loss and retreat, which, in turn, further expands the area of glacial lakes.

4.2.3. Ice Crevasses and Ice Avalanches

An ice crevasse is a deep, wedge-shaped opening on the glacier’s surface, and it is a tensional fracture in the ice [19,45]. The number of ice crevasses on many maritime glaciers has gradually increased in recent decades [44,113] and expanded upward on glaciers, leading to an increase in glacier surface fragmentation. As revealed by satellite observations, ice crevasses only existed at the terminus of the Baishui River Glacier No. 1 around 2005, and they developed more extensively across the entire glacier surface in 2018, even in the accumulation zone (Figure 8). Ice crevasses will open up where the strength of the ice is exceeded by the forces pulling ice apart, causing brittle failure. As the climate warms in the SETP, the ablation zones of many maritime glaciers expand, and basal sliding accelerates, which, in turn, increases the tensile stress in different parts of the glacier, leading to glacier surface fragmentation and an increase in ice crevasses [45,111], and the further destruction of glacier stability. As glacier surface fragmentation intensifies and meltwater increases, the area and depth of ice crevasses continue to expand, which makes it easier for surface meltwater to enter ice crevasses. Water in crevasses provides an additional outward-acting force, allowing crevasses to penetrate to greater depths. This process can bring additional energy into glacier ice [114], further accelerating glacier mass loss.
Furthermore, an ice avalanche is a sudden release of a large ice mass from a glacier, in which glacier ice falls or slides rapidly downslope while fragmenting into smaller pieces [45]. This phenomenon mostly occurs at the terminus of glaciers or at the edges of polar ice shelves, as well as in icefall zones. The main distribution areas of maritime glaciers have been areas of frequent ice avalanches in the TP and its surroundings in recent years [12,32,33,115]. The main reason is that maritime glaciers have been characterized by intensified ice melting, developed ice crevasses, increased surface streams, and fast flow in recent years, causing surface meltwater to easily infiltrate into ice crevasses and reach the glacier base. This process accelerates ice melting on both sides of ice crevasses, which leads to open ice crevasses and a change in the englacial and subglacial drainage systems and thermal-hydraulic properties, thereby resulting in glacier instability [112,113]. The increase in ice temperature and the enhancement of hydrological processes at the glacier bottom also greatly reduce the stability of the glacier [45,116], which increases the possibility of ice avalanches. Overall, the occurrence of ice avalanches triggers glacier ice to quickly fall or slide along a certain shear fracture surface or fragile surface of the glacier. This causes huge amounts of glacier mass to rapidly reach the lower part of the glacier from higher altitudes, exacerbating the glacier mass loss.

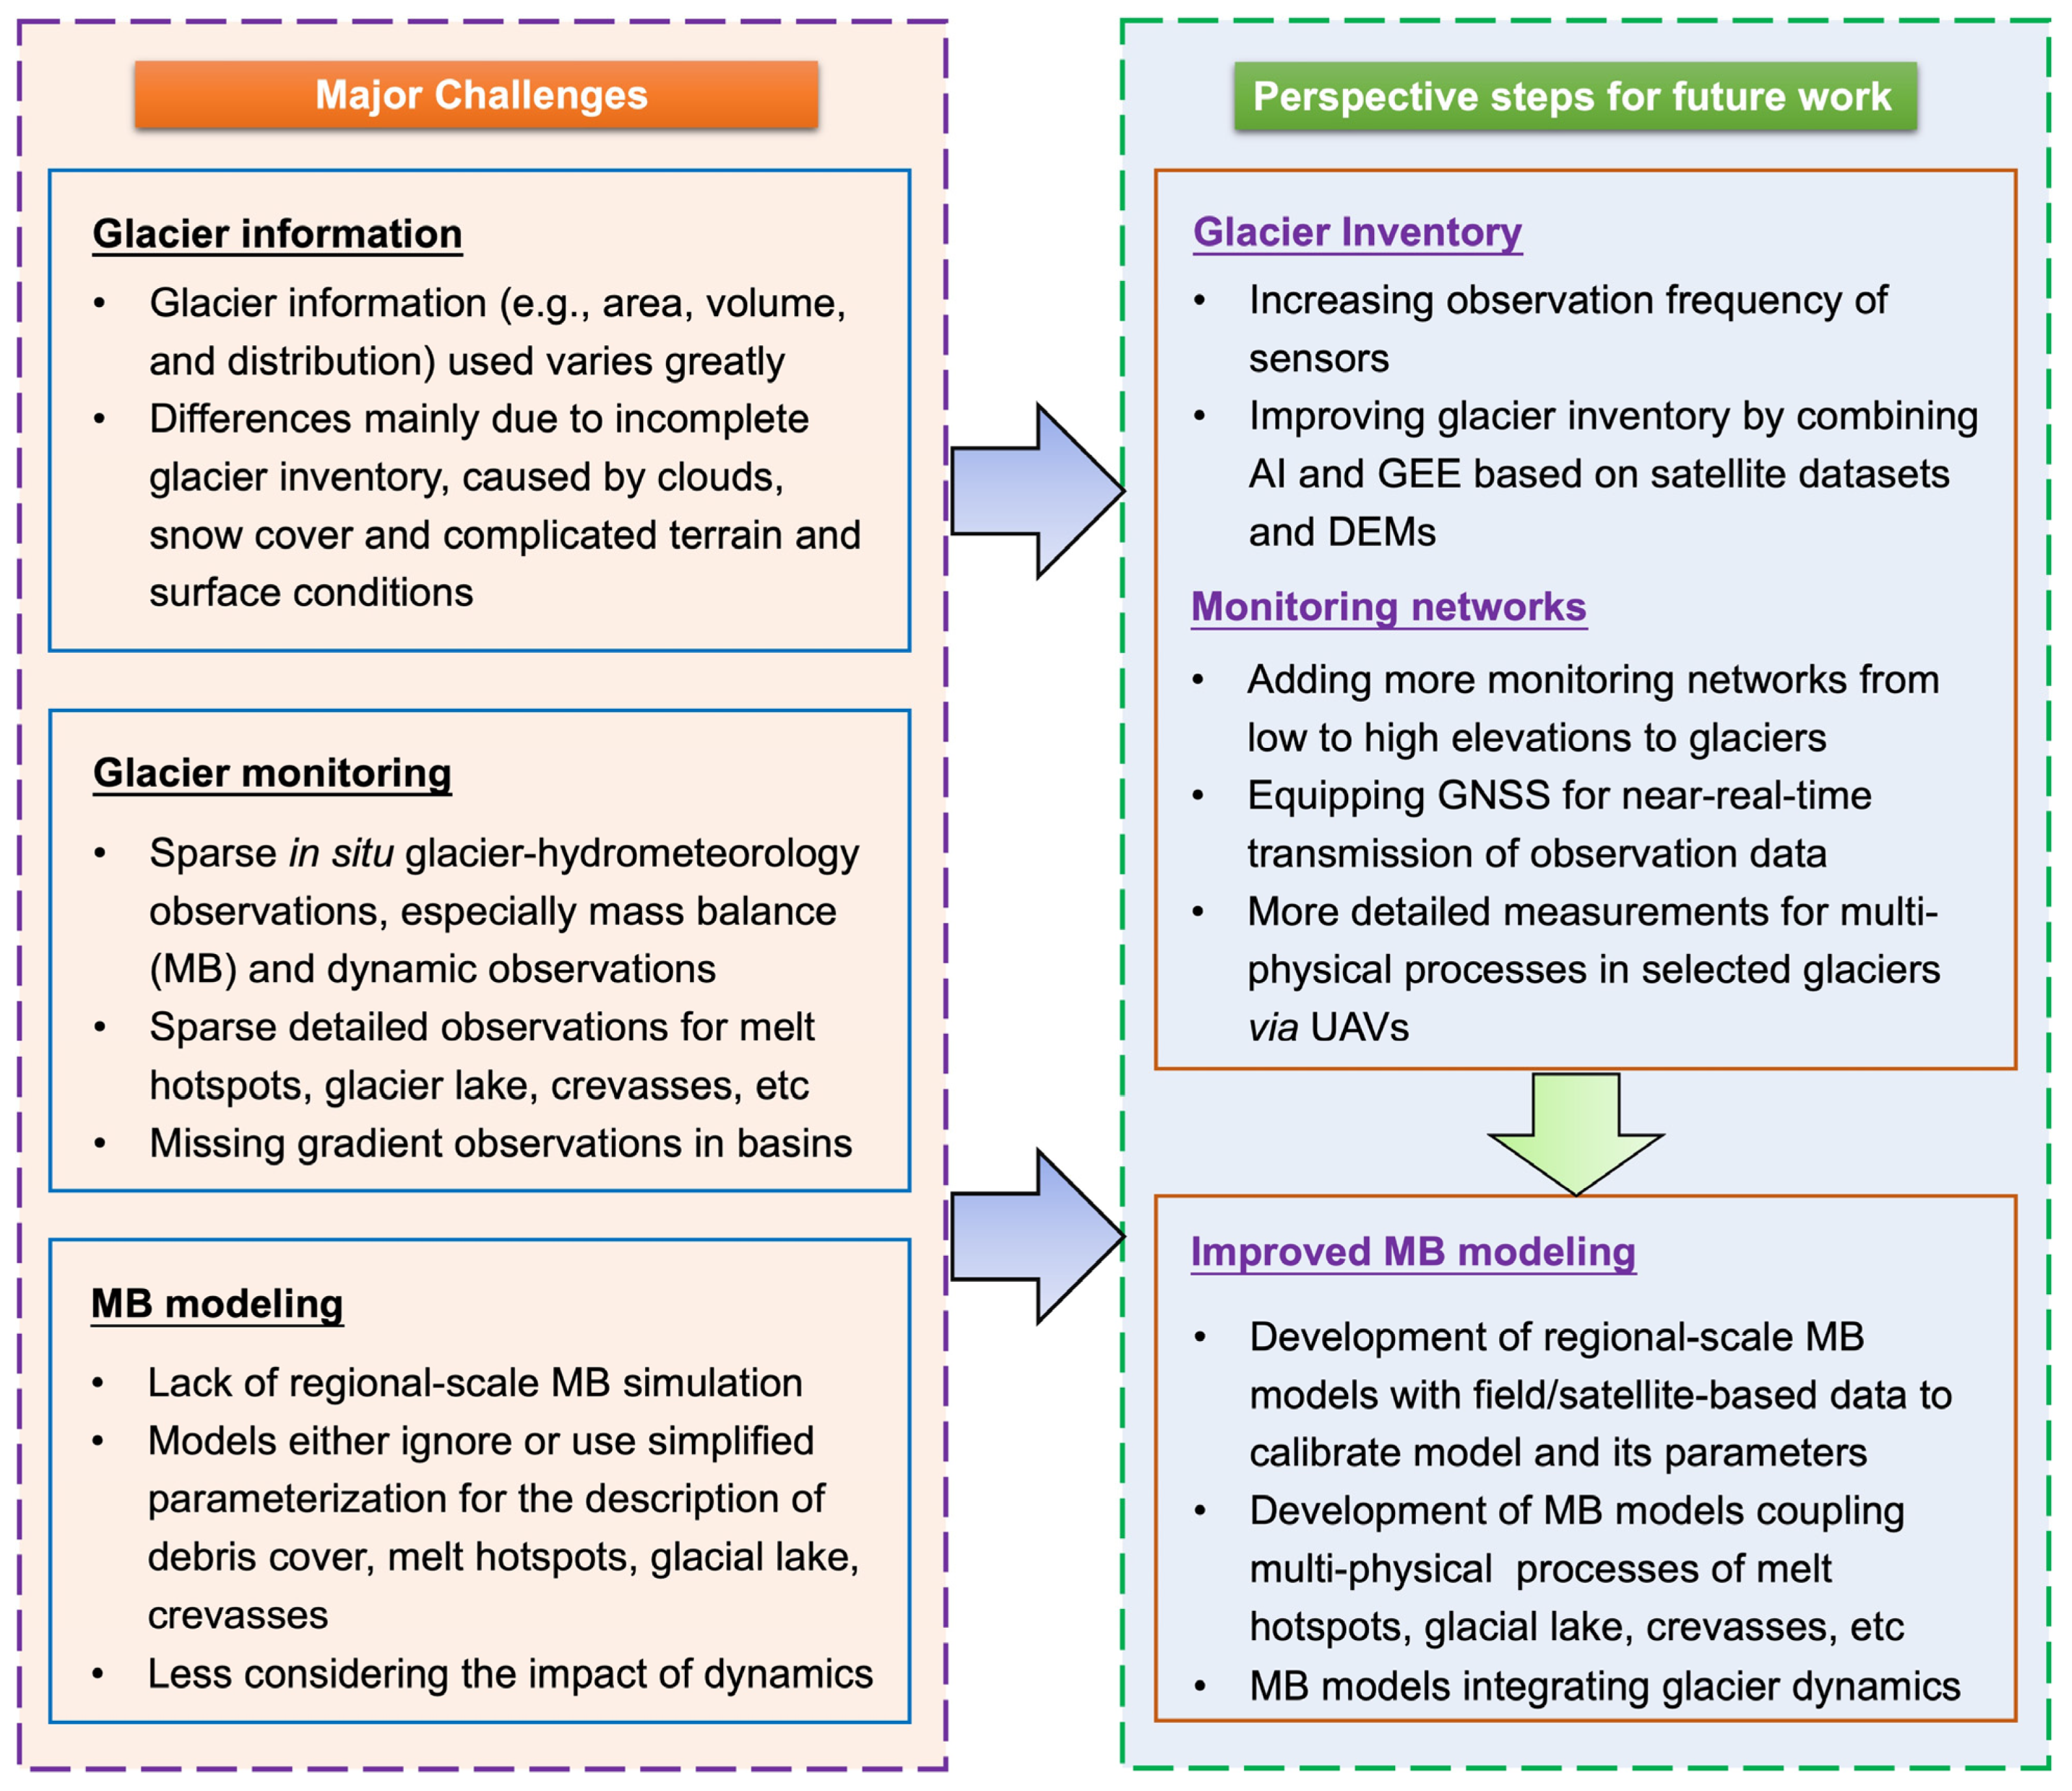
5. Challenges, Future Perspectives, and Recommendations for the Study of Maritime Glacier Mass Balance

5.1. Glacier Information

Accurate glacier information (e.g., area, volume, and distribution) and quantified uncertainties are of key importance for studying glacier mass balance, but the information on maritime glaciers in the SETP used in many current studies varies widely [16,24,25,26,56,66,75]. These differences are mainly due to incomplete glacier inventory and different geographical divisions of the mountains. Over the SETP, abundant clouds, seasonal snow cover, and complicated terrain and glacier surface conditions (e.g., debris cover and steep avalanche walls) greatly hamper remote sensing-based glacier delineation, which has a profound influence on glacier interpretation from remote sensing images. In particular, debris cover is widespread on many maritime glaciers in the SETP (Figure S1), whose spectral characteristics are similar to those of the surrounding rocks and soil, making it difficult to distinguish them from the surrounding terrains [117,118]. Therefore, this issue is a major deficiency in understanding the mass balance of maritime glaciers in the SETP at a regional scale (Figure 9).
Recently, the developments of spaceborne sensors and new-generation artificial intelligence (AI) technologies have provided abundant data and methodological support for the completion of glacier inventory in the SETP. With the launch of novel spaceborne sensors such as Sentinel-2 (at least every five days, even more often towards higher latitudes), the observation frequency of the sensors has improved [71]. This considerably increases the chance for cloud-free images acquired at the end of the ablation season in glacierized regions and their surroundings in the SETP, thus increasing the probability of mapping high-quality glacier extents in the region. The ability to interpret maritime glaciers, especially debris-covered glaciers, has been significantly improved due to recent developments in the above-mentioned satellites and cloud-computing platforms, such as Google Earth Engine. Furthermore, the development of new-generation AI technologies represented by machine learning and deep learning offers important methods for rapidly and automatically classifying and extracting various glacier types based on different remote sensing images [119,120]. Therefore, we suggest developing a method integrating AI technologies and cloud-computing platforms to extract the maritime glacier extent based on multisource satellite data, especially data observed by higher observation frequency of the sensors, and then to combine DEMs to obtain glacier information, thereby improving the existing inventory of maritime glaciers in the SETP. This can provide comprehensive basic glacier information for the study of the mass balance of maritime glaciers in the SETP.

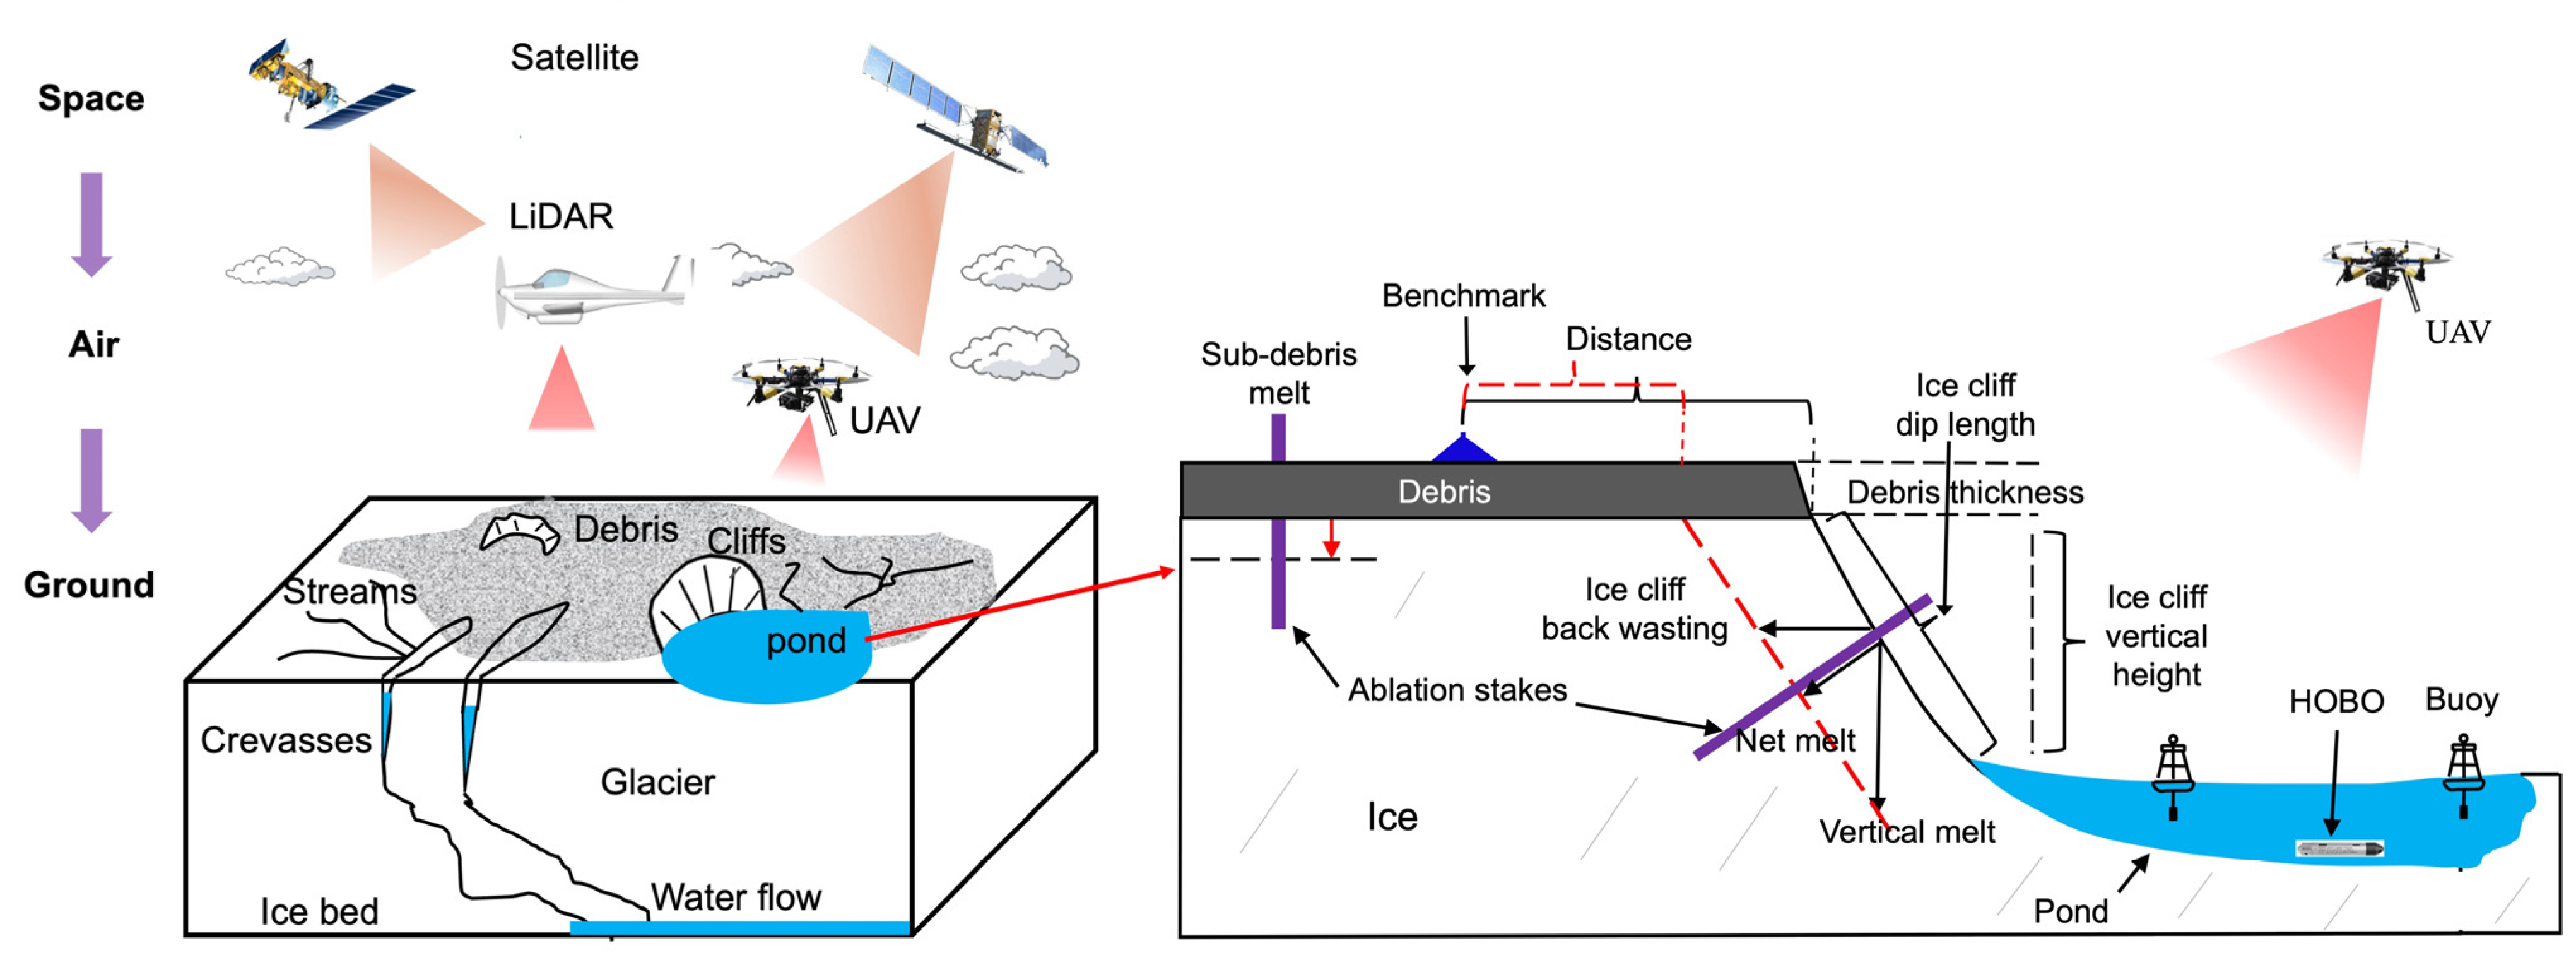
5.2. Monitoring Networks for Maritime Glaciers and Surroundings

There are only a small number of maritime glaciers over the SETP for which long-term positioning observations are being carried out, and most of these glaciers are small glaciers (Table S2). Furthermore, most meteorological stations in the SETP are located at low elevations, far away from the glaciers. Consequently, there is still a large gap in the monitoring and accumulation of glacier–hydrometeorological observation data on maritime glaciers and their surroundings in the SETP (Figure 9), such as precipitation distribution/gradients. Imperfections in precipitation gradients across glacierized catchments lead to the underestimation/overestimation of precipitation amounts, which, in turn, produces a considerable bias in glacier mass balance estimates. Therefore, this is a key issue facing the study of maritime glacier mass balance in the SETP, and more efforts should be devoted to future mass balance studies regarding the observations on maritime glaciers in the region.
Based on the existing glaciological observation sites in the SETP (Figure 1), we recommend adding more monitoring networks from the valley bottom to higher elevations in selected glacierized catchments, thereby establishing an integrated glacier-hydrometeorology observation system. Among these monitoring networks, the observation network for the minimum standard ancillary data for glacier mass balance estimation, such as temperature, precipitation, glacier ablation, and runoff, is particularly important. In addition, these monitoring networks also require wind speed and direction measurements, which are the minimum standard ancillary data for the measurement of snow correction in mountainous regions together with temperature. In particular, the observation system can equip the new generation Global Navigation Satellite System (GNSS) or ground public network to conduct the near-real-time transmission of the observation data from remote glacierized regions.
Concerning the strong seasonal and interannual characteristics of glacier surface processes (Figure 10), we recommend further strengthening the detailed monitoring capabilities of the surface processes (e.g., ice cliffs, supraglacial ponds, and ice crevasses) mentioned above through unpiloted aerial vehicles (UAVs) or very-high-resolution satellite data, thereby obtaining the detailed evolution of local processes on the glacier surface. Additionally, with regard to satellite-based techniques for glacier mass balance observations, we suggest developing a thorough experimental project involving intercomparisons to understand the different origins of these methods and to better constrain mass changes from the glacier scale to the regional scale. Overall, the establishment of comprehensive monitoring networks integrating space-air-ground techniques (Figure 10) can provide sufficient data support for accurately assessing mass changes in maritime glaciers and the associated past and future impacts in the SETP.

5.3. Glacier Mass-Balance Modeling

Glacier mass-balance models are one of the most widely used approaches for estimating glacier mass balance at different spatiotemporal scales, which range from energy-mass balance models to degree-day models [27,81,82,84,86]. As discussed above, glacier–hydrometeorological observations on most maritime glaciers in the SETP are prominently characterized by short and discontinuous time series (Table S2), which largely restricts the driving, calibration, and validation of glacier mass-balance models and their application on data-scarce glacierized catchments. Therefore, the wide applicability of glacier mass-balance models and related key parameters urgently needs to be strengthened (Figure 9).
Many maritime glaciers have particularly complex surface conditions consisting of debris cover, ice cliffs, supraglacial ponds, surface streams, and ice crevasses (Figure 10 and Table S3). Current glacier mass-balance models applied to maritime glaciers typically consider major components of the glacier mass budget, mainly including snow accumulation, ice and snow ablation, and refreezing [81,84,86], and only a few models consider the spatial pattern of debris cover and the associated impact on glacier mass balance [21,82,84]. Consequently, current glacier mass-balance models cannot realistically represent various mass change processes of maritime glaciers and their interactions. With climate warming, the complexity of the response of maritime glacier mass balance intensifies, and various processes of glacier mass balance experience drastic changes (Table S3). These processes have been confirmed to play a certain role in the mass changes in these glaciers. Therefore, a deep understanding of the physical mechanisms of these processes is the basis for the accurate simulation of maritime glacier mass balance. However, the existing glacier mass-balance models are often simplified or even ignore the description of these important processes. Although some studies have developed glacier ablation models that individually consider the impacts of ice cliffs or supraglacial ponds in Himalayan glaciers [83,103,105], these models require detailed field meteorological and topographic observations, limiting their application in other regions. In addition, little consideration has been given to the impact of glacier dynamics on glacier mass-balance modeling in the SETP, leading to the inaccurate assessment of glacier contribution to river runoff and glacier-related hazards. Therefore, it is difficult for existing glacier mass-balance models to systematically evaluate the impacts of these processes (Table S3), the contribution of each process, and the interactions between them, making this an urgent issue in the study of maritime glacier mass balance.
Based on the gradually improved glacier inventory and the integrated glacier-hydrometeorology observation system in the SETP, we recommend developing a glacier-scale or regional-scale mass-balance model that can prioritize multiple physical processes of mass changes and especially consider the role of each process in glacier mass changes on different time scales. Furthermore, the development of AI technologies, such as machine learning and deep learning, offers important methods for predicting the mass balance of maritime glaciers in the SETP [121,122,123]. Along with the increase in ground-surveyed, satellite-based, and reconstructed datasets of glacier mass balance, ice thickness, and surface velocity in recent years [124,125], it is possible to perform mass-balance modeling at different spatial scales with the incorporation of glacier dynamic processes based on AI technologies. Therefore, a glacier mass-balance model that finely characterizes multiple physical dynamic processes can further improve the accuracy of the mass balance simulation of maritime glaciers in the SETP, thereby assessing future trends in maritime glacier health and the associated hydrological and hazardous impacts.

6. Conclusions

Recent advances have significantly improved the scientific understanding of the mass balance status of maritime glaciers in the SETP. This review provides a comprehensive overview of the mass balance characteristics of maritime glaciers and their influencing factors in the SETP from the perspectives of in situ, satellite observations, and recent simulated findings. The mean mass loss of most maritime glaciers was slightly insignificant before the 1990s, and then glacier mass loss increased rapidly at regional scales. Approximately 66% of the total cumulative mass loss during 1952–2020 was concentrated in 2000–2020. A marked difference in the rate of glacier mass change was observed across the SETP, where the mean glacier mass loss in the Hengduan Mountains was quite large, while the average rate in the eastern Himalayas was relatively small. Overall, regional differences in warming rates and reduced precipitation have been the main drivers of the accelerated mass loss of maritime glaciers in the SETP in recent decades. In addition, the spatial patterns of melt hotspots, the expansion of glacial lakes, enlarged ice crevasses, and frequent ice avalanches are vital factors in enhancing the mass loss of maritime glaciers in the region.
Maritime glaciers will continue to play a unique role in regional water security, ecological security, and prevention and mitigation of glacier-related hazards in the SETP. However, the current understanding of maritime glacier mass balance and the associated impacts is still inadequate due to the scarcity of reliable field observations and uncertainties in model simulations. Therefore, we recommend several priorities for future mass balance research in maritime glaciers to redress these deficiencies. First, it is urgently necessary to improve the existing inventory of maritime glaciers by developing a method combining AI technologies and cloud-computing platforms based on multisource satellite datasets and DEMs. Second, it is necessary to establish large-scale space-air-ground monitoring networks to obtain reliable data on glacier mass balance. Finally, a glacier mass-balance model that can represent multiple physical processes and their interactions should be developed, especially considering the role of each process on different time scales. Only by considering these challenges will we gain an accurate understanding of the processes and mechanisms of maritime glacier mass loss, thereby achieving the ability to project regional water resources and disaster-causing effects in the SETP.

Supplementary Materials

The following supporting information can be downloaded at https://www.mdpi.com/article/10.3390/su16167118/s1, Figure S1: Spatial distribution of debris cover in the SETP, debris cover dataset is derived from [48]; Figure S2: Average annual, June to September, and October to the following February temperature observed at four national weather station: Chayu (a), Linzhi (b), Bomi (c) and Luolong (d) for the period 1979–2019; Data are from China Meteorological Administration (https://www.cma.gov.cn/en/; accessed on 5 June 2022); Figure S3: Annual and June to September precipitation observed at four national weather station: Chayu (a), Linzhi (b), Bomi (c) and Luolong (d) for the period 1979–2019; Data are from China Meteorological Administration (https://www.cma.gov.cn/en/; accessed on 5 June 2022); Figure S4: Variations in the day of precipitation falling as snow and the snowfall to total precipitation ratio observed on the Hailuogou Glacier of the Hengduan Mountains (see Figure 1) for the period 1988–2020; Figure S5: Area change in glacial lake at the terminus of G094574E30563N Glacier in the SETP, the glacier is termed lake-terminating glacier. Images are from Google Earth; Table S1: Summary of the characteristics of the three types of glaciers in the Tibetan Plateau (TP) [17,18]; Table S2: Summary of maritime glaciers observed in the SETP; Table S3: Summary of the factors driving the mass loss of maritime glaciers [1,35,42,57,66,68,78,81,82,126,127].

Author Contributions

Conceptualization, X.L. and Y.Z.; methodology, Y.Z.; writing—original draft preparation, X.L. and Y.Z.; writing—review and editing, Y.Z. and H.W.; visualization, H.W. and X.W.; funding acquisition, Y.Z. and X.W. All authors have read and agreed to the published version of the manuscript.

Funding

This research was funded by the National Natural Science Foundation of China (Grant No. 42171134, 421711347 and 41671057) and the Natural Science Foundation of Hunan Province (Grant No. 2021JJ30247).

Institutional Review Board Statement

Not applicable.

Informed Consent Statement

Not applicable.

Data Availability Statement

The data presented in this study are available on request from the corresponding author.

Conflicts of Interest

The authors declare no conflicts of interest.

References

  1. Yao, T.D.; Thompson, L.; Yang, W.; Yu, W.S.; Gao, Y.; Guo, X.J.; Yang, X.X.; Duan, K.Q.; Zhao, H.B.; Xu, B.Q.; et al. Different glacier status with atmospheric circulations in Tibetan Plateau and surroundings. Nat. Clim. Chang. 2012, 2, 663–667. [Google Scholar] [CrossRef]
  2. Immerzeel, W.W.; Lutz, A.; Andrade, M.; Bahl, A.; Biemans, H.; Bolch, T.; Hyde, S.; Brumby, S.; Davies, B.; Elmore, A. Importance and vulnerability of the world’s water towers. Nature 2020, 577, 364–369. [Google Scholar] [CrossRef] [PubMed]
  3. Ding, Y.J.; Zhang, S.Q.; Wu, J.K.; Zhao, Q.D.; Li, X.Y.; Qin, J. Recent progress on studies on cryospheric hydrological processes changes in China. Adv. Water Sci. 2020, 31, 690–702, (In Chinese with English Abstract). [Google Scholar]
  4. Azam, M.F.; Kargel, J.S.; Shea, J.M.; Nepal, S.; Haritashya, U.K.; Srivastava, S.; Maussion, F.; Qazi, N.; Chevallier, P.; Dimri, A. Glaciohydrology of the Himalaya-Karakoram. Science 2021, 373, eabf3668. [Google Scholar] [CrossRef]
  5. Pritchard Hamish, D. Asia’s shrinking glaciers protect large populations from drought stress. Nature 2019, 569, 649–654. [Google Scholar] [CrossRef] [PubMed]
  6. Yao, T.D.; Xue, Y.K.; Chen, D.L.; Chen, F.H.; Thompson, L.; Cui, P.; Koike, T.; Lau, W.K.M.; Lettenmaier, D.; Mosbrugger, V. Recent third pole’s rapid warming accompanies cryospheric melt and water cycle intensification and interactions between monsoon and environment: Multidisciplinary approach with observations, modeling, and analysis. Bull. Am. Meteorol. Soc. 2019, 100, 423–444. [Google Scholar] [CrossRef]
  7. Yao, T.D.; Bolch, T.; Chen, D.L.; Gao, J.; Immerzeel, W.; Piao, S.L.; Su, F.G.; Thompson, L.; Wada, Y.; Wang, L.; et al. The imbalance of the Asian water tower. Nat. Rev. Earth Environ. 2022, 3, 618–632. [Google Scholar] [CrossRef]
  8. Brun, F.; Berthier, E.; Wagnon, P.; Kääb, A.; Treichler, D. A spatially resolved estimate of High Mountain Asia glacier mass balances from 2000 to 2016. Nat. Geosci. 2017, 10, 668–673. [Google Scholar] [CrossRef] [PubMed]
  9. Shean, D.E.; Bhushan, S.; Montesano, P.; Rounce, D.R.; Arendt, A.; Osmanoglu, B. A systematic, reigonal assessment of High Mountain Asia glacier mass balance. Front. Earth Sci. 2020, 7, 363–381. [Google Scholar] [CrossRef]
  10. Hugonnet, R.; McNabb, R.; Berthier, E.; Menounos, B.; Nuth, C.; Girod, L.; Farinotti, D.; Huss, M.; Dussaillant, I.; Brun, F.; et al. Accelerated global glacier mass loss in the early twenty-first century. Nature 2021, 592, 726–731. [Google Scholar] [CrossRef] [PubMed]
  11. Veh, G.; Korup, O.; von Specht, S.; Roessner, S.; Walz, A. Unchanged frequency of moraine-dammed glacial lake outburst floods in the Himalaya. Nat. Clim. Chang. 2019, 9, 379–383. [Google Scholar] [CrossRef]
  12. Ding, Y.J.; Mu, C.C.; Wu, T.H.; Hu, G.J.; Zou, D.F.; Wang, D.; Li, W.P.; Wu, X.D. Increasing cryospheric hazards in a warming climate. Earth-Sci. Rev. 2021, 213, 103500. [Google Scholar] [CrossRef]
  13. Zhang, T.; Wang, W.; Gao, T.; An, B.; Shang, X. Glacial lake outburst floods on the High Mountain Asia: A review. J. Glaciol. Geocryol. 2021, 43, 1673–1692, (In Chinese with English Abstract). [Google Scholar]
  14. Zhang, T.; Wang, W.; An, B.; Wei, L. Enhanced glacial lake activity threatens numerous communities and infrastructure in the Third Pole. Nat. Commun. 2023, 14, 8250. [Google Scholar] [CrossRef]
  15. Taylor, C.; Robinson, T.R.; Dunning, S.; Carr, J.R.; Westoby, M. Glacial Lake outburst floods threaten millions globally. Nat. Commun. 2023, 14, 487. [Google Scholar] [CrossRef]
  16. Su, Z.; Shi, Y.F. Response of monsoonal temperate glaciers to global warming since the Little Ice Age. Quatern. Int. 2002, 97, 123–131. [Google Scholar] [CrossRef]
  17. Shi, Y.F.; Liu, S.Y. Estimation on the response of glaciers in China to the global warming in the 21st century. Chin. Sci. Bull. 2000, 45, 668–672. [Google Scholar] [CrossRef]
  18. Li, J.; Zheng, B.; Yang, X.; Xie, Y.; Zhang, L.; Ma, Z.; Xu, S. Glaciers of Xizang (Tibet); Science Press: Beijing, China, 1986. (In Chinese) [Google Scholar]
  19. Li, J.; Su, Z. Glaciers in the Hengduan Mountains; Science Press: Beijing, China, 1996; pp. 1–282. (In Chinese) [Google Scholar]
  20. Yang, W.; Yao, T.D.; Xu, B.Q.; Zhou, H. Influence of supraglacial debris on summer ablation and mass balance in the 24K Glacier, southeast Tibetan Plateau. Geogr. Ann. A 2010, 92, 353–360. [Google Scholar]
  21. Zhang, Y.; Hirabayashi, Y.; Fujita, K.; Liu, S.Y.; Liu, Q. Heterogeneity in supraglacial debris thickness and its role in glacier mass changes of the Mount Gongga. Sci. China Earth Sci. 2016, 59, 170–184. [Google Scholar] [CrossRef]
  22. Zhang, Y.; Gu, J.; Liu, S.Y.; Wang, X.; Jiang, Z.L.; Wei, J.F.; Zheng, Y.J. Spatial pattern of the debris-cover effect and its role in the Hindu Kush-Pamir-Karakoram-Himalaya glaciers. J. Hydrol. 2022, 615, 128613. [Google Scholar] [CrossRef]
  23. Liao, H.J.; Liu, Q.; Zhong, Y.; Lu, X.Y. Supraglacial debris-cover change and its spatial heterogeneity in the Mount Gongga, 1990–2019. Acta Geogr. Sin. 2021, 76, 2647–2659, (In Chinese with English Abstract). [Google Scholar]
  24. Yi, S.; Song, C.Q.; Heki, K.; Kang, S.C.; Wang, Q.Y.; Chang, L. Satellite-observed monthly glacier and snow mass changes in southeast Tibet: Implication for substantial meltwater contribution to the Brahmaputra. Cryosphere 2020, 14, 2267–2281. [Google Scholar] [CrossRef]
  25. Zhao, F.Y.; Long, D.; Li, X.D.; Huang, Q.; Han, P.F. Rapid glacier mass loss in the Southeastern Tibetan Plateau since the year 2000 from satellite observations. Remote Sens. Environ. 2022, 270, 112853. [Google Scholar] [CrossRef]
  26. Luo, L.H.; Ke, C.Q.; Fan, Y.B.; Wang, Z.F. Accelerated glacier mass loss in the southeastern Tibetan Plateau since the 1970s. Adv. Clim. Chang. Res. 2023, 14, 372–386. [Google Scholar] [CrossRef]
  27. Zhang, Y.; Hirabayashi, Y.; Liu, Q.; Liu, S.Y. Glacier runoff and its impact in a highly glacierized catchment in the southeastern Tibetan Plateau: Past and future trends. J. Glaciol. 2015, 61, 713–730. [Google Scholar] [CrossRef]
  28. Zhang, Y.; Liu, S.Y.; Liu, Q.; Wang, X.; Jiang, Z.L.; Wei, J.F. The Role of Debris Cover in Catchment Runoff: A Case Study of the Hailuogou Catchment, South-Eastern Tibetan Plateau. Water 2019, 11, 2601. [Google Scholar] [CrossRef]
  29. Su, F.G.; Zhang, L.; Ou, T.; Chen, D.; Yao, T.D.; Tong, K. Hydrological response to future climate changes for the major upstream river basins in the Tibetan Plateau. Glob. Planet. Chang. 2016, 136, 82–95. [Google Scholar] [CrossRef]
  30. Wang, Y.; Wang, H.; Cui, P.; Chen, D. Disaster effects of climate change and the associated scientific challenges. Chin. Sci. Bull. 2024, 69, 286–300, (In Chinese with English Abstract). [Google Scholar]
  31. Cui, P.; Guo, X.J.; Jiang, T.H.; Zhang, G.T.; Jin, W. Disaster Effect Induced by Asian Water Tower Change and Mitigation Strategies. Bull. Chin. Acad. Sci. 2019, 34, 1313–1321, (In Chinese with English Abstract). [Google Scholar]
  32. Chen, C.; Zhang, L.M.; Xiao, T.; He, J. Barrier Lake bursting and flood routing in the Yarlung Tsangpo Grand Canyon in October 2018. J. Hydrol. 2020, 583, 124603. [Google Scholar] [CrossRef]
  33. An, B.S.; Wang, W.C.; Yang, W.; Wu, G.J.; Guo, Y.H.; Zhu, H.F.; Gao, Y.; Bai, L.; Zhang, F.; Zeng, C.; et al. Process, mechanisms, and early warning of glacier collapse-induced river blocking disasters in the Yarlung Tsangpo Grand Canyon, southeastern Tibetan Plateau. Sci. Total Environ. 2022, 816, 151652. [Google Scholar] [CrossRef] [PubMed]
  34. Nie, Y.; Sheng, Y.W.; Liu, Q.; Liu, L.S.; Liu, S.Y.; Zhang, Y.L.; Song, C.Q. A regional-scale assessment of Himalayan glacial lake changes using satellite observations from 1990 to 2015. Remote Sens. Environ. 2017, 189, 1–13. [Google Scholar] [CrossRef]
  35. Wang, S.J.; Che, Y.J.; Pang, H.X.; Du, J.K.; Zhang, Z.L. Accelerated changes of glaciers in the Yulong Snow Mountain, Southeast Qinghai-Tibetan Plateau. Reg. Environ. Chang. 2020, 20, 1–13. [Google Scholar] [CrossRef]
  36. Shugar, D.H.; Burr, A.; Haritashya, U.K.; Kargel, J.S.; Watson, C.S.; Kennedy, M.C.; Bevington, A.R.; Betts, R.A.; Harrison, S.; Strattman, K. Rapid worldwide growth of glacial lakes since 1990. Nat. Clim. Chang. 2020, 10, 939–945. [Google Scholar] [CrossRef]
  37. Schwanghart, W.; Worni, R.; Huggel, C.; Stoffel, M.; Korup, O. Uncertainty in the Himalayan energy-water nexus: Estimating regional exposure to glacial lake outburst floods. Environ. Res. Lett. 2016, 11, 074005. [Google Scholar] [CrossRef]
  38. Allen, S.K.; Rastner, P.; Arora, M.; Huggel, C.; Stoffel, M. Lake outburst and debris flow disaster at Kedarnath, June 2013: Hydrometeorological triggering and topographic predisposition. Landslides 2016, 13, 1479–1491. [Google Scholar] [CrossRef]
  39. Engelke, P.; Michel, D. Ecology Meets Geopolitics: Water Security in Himalayan Asia; Atlantic Council: Washington, DC, USA, 2019; pp. 1–87. [Google Scholar]
  40. Lee, J.Y.; Marotzke, J.; Bala, G.; Cao, L.; Corti, S.; Dunne, J.P.; Engelbrecht, F.; Fischer, E.; Fyfe, J.C.; Jones, C.; et al. Future Global Climate: Scenario-Based Projections and Near-Term Information. In Climate Change 2021: The Physical Science Basis: Contribution of Working Group I to the Sixth Assessment Report of the Intergovernmental Panel on Climate Change; Masson-Delmotte, V., Zhai, P., Pirani, A., Connors, S.L., Péan, C., Berger, S., Caud, N., Chen, Y., Goldfarb, L., Gomis, M.I., et al., Eds.; Cambridge University Press: Cambridge, UK; New York, NY, USA, 2023; pp. 553–672. [Google Scholar]
  41. Zhang, Y.; Fujita, K.; Liu, S.Y.; Liu, Q.; Nuimura, T. Distribution of debris thickness and its effect on ice melt at Hailuogou glacier, southeastern Tibetan Plateau, using in situ surveys and ASTER imagery. J. Glaciol. 2011, 57, 1147–1157. [Google Scholar] [CrossRef]
  42. Yang, W.; Yao, T.D.; Guo, X.F.; Zhu, M.L.; Li, S.H. Mass balance of a maritime glacier on the southeast Tibetan Plateau and its climatic sensitivity. J. Geophys. Res. Atmos. 2013, 118, 9579–9594. [Google Scholar] [CrossRef]
  43. Wu, K.P.; Liu, S.Y.; Zhu, Y.; Xie, F.M.; Gao, Y.P.; Resources, C.L.C. High-resolution monitoring of glacier dynamics based on unmanned aerial vehicle survey in the Meili Snow Mountain. Prog. Geog. 2021, 40, 1581–1589, (In Chinese with English Abstract). [Google Scholar] [CrossRef]
  44. Yan, X.G.; Ma, J.Z.; Ma, X.Y.; Wang, S.J.; Chen, P.Y.; He, Y.Q. Accelerated glacier mass loss with atmospheric changes on Mt. Yulong, Southeastern Tibetan Plateau. J. Hydrol. 2021, 603, 126931. [Google Scholar] [CrossRef]
  45. Cuffey, K.M.; Paterson, W.S.B. The Physics of Glaciers, 4th ed.; Academic Press: Cambridge, MA, USA, 2010; pp. 1–674. [Google Scholar]
  46. Haeberli, W.; Whiteman, C. Snow and Ice-Related Hazards, Risks, and Disasters: A General Framework; Academic Press: Cambridge, MA, USA, 2015; pp. 1–34. [Google Scholar]
  47. Zhou, Y.S.; Li, Z.W.; Li, J.; Zhao, R.; Ding, X. Glacier mass balance in the Qinghai–Tibet Plateau and its surroundings from the mid-1970s to 2000 based on Hexagon KH-9 and SRTM DEMs. Remote Sens. Environ. 2018, 210, 96–112. [Google Scholar] [CrossRef]
  48. Scherler, D.; Wulf, H.; Gorelick, N. Global Assessment of Supraglacial Debris-Cover Extents. Geophys. Res. Lett. 2018, 45, 11798–11805. [Google Scholar] [CrossRef]
  49. Herreid, S.; Pellicciotti, F. The state of rock de- bris covering Earth’s glaciers. Nat. Geosci. 2020, 13, 621. [Google Scholar] [CrossRef]
  50. Liu, S.Y.; Zhang, Y.; Liu, Q.; Sun, M.P. Study on the Impact of Climate Change on Glacier and Its Risk; Science Press: Beijing, China, 2017; pp. 1–236. (In Chinese) [Google Scholar]
  51. Zhao, H.Q.; Wang, X.; Zhao, X.R.; Guo, W.Q.; Liu, S.Y.; Wei, J.F.; Zhang, Y. Analysis of glacier changes in China from 2008 to 2018. J. Glaciol. Geocryol. 2021, 43, 976–986, (In Chinese with English Abstract). [Google Scholar]
  52. Ji, Q.; Liu, R.; Yang, T.B. Glacier variations in the Himalayas during 1990–2015. Geogr. Res. 2020, 39, 2403–2414, (In Chinese with English Abstract). [Google Scholar]
  53. Mölg, T.; Maussion, F.; Scherer, D. Mid-latitude westerlies as a driver of glacier variability in monsoonal High Asia. Nat. Clim. Chang. 2014, 4, 68–73. [Google Scholar] [CrossRef]
  54. Kong, W.W.; Chiang, J.C.H. Southward shift of westerlies intensifies the East Asian early summer rainband following El Niño. Geophys. Res. Lett. 2020, 47, e2020GL088631. [Google Scholar] [CrossRef]
  55. Wang, X.J.; Pang, G.J.; Yang, M.X. Precipitation over the Tibetan Plateau during recent decades: A review based on observations and simulations. Int. J. Climatol. 2018, 38, 1116–1131. [Google Scholar] [CrossRef]
  56. Xiao, L.; Li, S.; Wu, K.; Liu, S.; Zhu, Y.; Afzal, M.M.; Zhou, J.; Yi, Y.; Wei, J.; Duan, Y.; et al. A Geodetic-Data-Calibrated Ice Flow Model to Simulate Historical and Future Response of Glaciers in Southeastern Tibetan Plateau. Remote Sens. 2024, 16, 522. [Google Scholar] [CrossRef]
  57. Jouberton, A.; Shaw, T.E.; Miles, E.; McCarthy, M.; Fugger, S.; Ren, S.T.; Dehecq, A.; Yang, W.; Pellicciotti, F. Warming-induced monsoon precipitation phase change intensifies glacier mass loss in the southeastern Tibetan Plateau. Proc. Natl. Acad. Sci. USA 2022, 119, e2109796119. [Google Scholar] [CrossRef]
  58. Ward, F.K. The snow mountains of Yunnan. Geog. J. 1924, 64, 222–231. [Google Scholar] [CrossRef]
  59. Ward, F.K.; Smith, M.A. The Himalaya east of the Tsangpo. Geog. J. 1934, 84, 369–397. [Google Scholar] [CrossRef]
  60. Heim, A. The glaciation and solifluction of Minya Gongkar. Geog. J. 1936, 87, 444–450. [Google Scholar] [CrossRef]
  61. Cui, Z. Preliminary observations of the modern glaciers of Gongga Mountain–commemorating comrades who heroically sacrificed their lives for the conquest of Gongga Mountain. Acta Geogr. Sin. 1958, 3, 318–342, (In Chinese with English Abstract). [Google Scholar]
  62. Li, B.Y.; Wang, F.B.; Zhang, Q.S.; Yang, Y.C.; Yin, Z.S.; Jing, K.; Li, W.Y.; Zheng, Y.H.; Huang, C.X.; Li, J.Y.; et al. Quaternary Geology of Tibet; Science Press: Beijing, China, 1983; pp. 1–192. (In Chinese) [Google Scholar]
  63. Yao, T. Glacier Climate and Environment of the Qinghai-Tibet Plateau: A Study on glaciers on the Qinghai-Tibet Plateau in China and Japan in 1989; Science Press: Beijing, China, 1993. (In Chinese) [Google Scholar]
  64. Xie, Z.C.; Su, Z.; Shen, Y.P.; Feng, Q.H. Mass balance and water exchange of Hailuoguo glacier in Mount Gongga and their influence on glacial melt runoff. J. Glaciol. Geocryol. 2001, 23, 7–15, (In Chinese with English Abstract). [Google Scholar]
  65. Wu, K.P.; Liu, S.Y.; Zhu, Y.; Liu, Q.; Jiang, Z.L. Dynamics of glacier surface velocity and ice thickness for maritime glaciers in the southeastern Tibetan Plateau. J. Hydrol. 2020, 590, 125527. [Google Scholar] [CrossRef]
  66. Sherpa, S.F.; Wagnon, P.; Brun, F.; Berthier, E.; Vincent, C.; Lejeune, Y.; Arnaud, Y.; Kayastha, R.B.; Sinisalo, A. Contrasted surface mass balances of debris-free glaciers observed between the southern and the inner parts of the Everest region (2007–2015). J. Glaciol. 2017, 63, 637–651. [Google Scholar] [CrossRef]
  67. Wang, N.L.; Yao, T.D.; Xu, B.Q.; Chen, A.A.; Wang, W.C. Spatiotemporal Pattern, Trend, and Influence of Glacier Change in Tibetan Plateau and Surroundings under Global Warming. Bull. Chin. Acad. Sci. 2019, 34, 1220–1232, (In Chinese with English Abstract). [Google Scholar]
  68. Wagnon, P.; Brun, F.; Khadka, A.; Berthier, E.; Shrestha, D.; Vincent, C.1; Arnaud, Y.; Six, D.; Dehecq, A.; Ménégoz, M.; et al. Reanalysing the 2007–2019 glaciological mass-balance series of Mera Glacier, Nepal, Central Himalaya, using geodetic mass balance. J. Glaciol. 2021, 67, 117–125. [Google Scholar] [CrossRef]
  69. Yang, W.; Yao, T.D.; Xu, B.Q.; Ma, L.L.; Wang, Z.H.; Wan, M. Characteristics of recent temperature glacier fluctuations in the Parlung Zangbo River basin, southeast Tibetan Plateau. Chin. Sci. Bull. 2010, 55, 1775–1780, (In Chinese with English Abstract). [Google Scholar]
  70. Su, Z.; Song, G.P.; Cao, Z.T. Maritime characteristics of Hailuogou glacier in the Gongga Mountains. J. Glaciol. Geocryol. 1996, 18 (Suppl. S1), 51–59, (In Chinese with English Abstract). [Google Scholar]
  71. Taylor, L.S.; Quincey, D.J.; Smith, M.W.; Baumhoer, C.A.; McMillan, M.; Mansell, D.T. Remote sensing of the mountain cryosphere: Current capabilities and future opportunities for research. Prog. Phys. Geogr. 2021, 45, 931–964. [Google Scholar] [CrossRef]
  72. Bamber, J.L.; Rivera, A. A review of remote sensing methods for glacier mass balance determination. Glob. Planet. Chang. 2007, 59, 138–148. [Google Scholar] [CrossRef]
  73. Ren, S.T.; Menenti, M.; Jia, L.; Zhang, J.; Zhang, J.X.; Li, X. Glacier mass balance in the Nyainqentanglha mountains between 2000 and 2017 retrieved from ZiYuan-3 stereo images and the SRTM DEM. Remote Sens. 2020, 12, 864. [Google Scholar] [CrossRef]
  74. Oerlemans, J. Glaciers and Climate Change; A. A. Balkema Publishers: Rotterdam, The Netherlands, 2001; pp. 1–160. [Google Scholar]
  75. Ke, L.H.; Song, C.Q.; Yong, B.; Lei, Y.B.; Ding, X.L. Which heterogeneous glacier melting patterns can be robustly observed from space? A multi-scale assessment in southeastern Tibetan Plateau. Remote Sens. Environ. 2020, 242, 111777. [Google Scholar] [CrossRef]
  76. Jakob, L.; Gourmelen, N.; Ewart, M.; Plummer, S. Spatially and temporally resolved ice loss in High Mountain Asia and the Gulf of Alaska observed by CryoSat-2 swath altimetry between 2010 and 2019. Cryosphere 2021, 15, 1845–1862. [Google Scholar] [CrossRef]
  77. Wu, K.; Liu, S.; Jiang, Z.; Xu, J.; Wei, J. Glacier mass balance over the central Nyainqentanglha Range during recent decades derived from remote-sensing data. J. Glaciol. 2019, 65, 422–439. [Google Scholar] [CrossRef]
  78. Zhao, L.Y.; Tian, L.D.; Zwinger, T.; Ding, R.; Zong, J.B.; Ye, Q.H.; Moore, J.C. Numerical simulations of Gurenhekou glacier on the Tibetan Plateau. J. Glaciol. 2014, 60, 71–82. [Google Scholar] [CrossRef]
  79. Acharya, A.; Kayastha, R.B. Mass and energy balance estimation of Yala glacier (2011–2017), Langtang Valley, Nepal. Water 2018, 11, 6. [Google Scholar] [CrossRef]
  80. WGMS Fluctuations of Glaciers Database-World Glacier Monitoring Service. Available online: https://wgms.ch/products_fog/ (accessed on 22 March 2024).
  81. Wang, R.J.; Liu, S.Y.; Shangguan, D.H.; Radic, V.; Zhang, Y. Spatial heterogeneity in glacier mass-balance sensitivity across High Mountain Asia. Water 2019, 11, 776. [Google Scholar] [CrossRef]
  82. Gu, J.; Zhang, Y.; Lyu, X.W.; Wang, H.H.; Jiang, Z.L.; Wang, X.; Wei, J.F. Multidecadal Changes in the Flow Velocity and Mass Balance of the Hailuogou Glacier in Mount Gongga, Southeastern Tibetan Plateau. Remote Sens. 2024, 16, 571. [Google Scholar] [CrossRef]
  83. Wu, K.P.; Liu, S.Y.; Bao, W.J.; Wang, R.J. Remote sensing monitoring of the glacier change in the Gangrigabu Range, southeast Tibetan Plateau from 1980 through 2015. J. Glaciol. Geocryol. 2017, 39, 24–34, (In Chinese with English Abstract). [Google Scholar]
  84. Zhang, Y.; Hirabayashi, Y.; Liu, S.Y. Catchment-scale reconstruction of glacier mass balance using observations and global climate data: Case study of the Hailuogou catchment, south-eastern Tibetan Plateau. J. Hydrol. 2012, 444, 146–160. [Google Scholar] [CrossRef]
  85. Gulev, S.K.; Thorne, P.W.; Ahn, J.; Dentener, F.J.; Domingues, C.M.; Gerland, S.; Gong, D.; Kaufman, D.S.; Nnamchi, H.C.; Quaas, J.; et al. Changing state of the climate system. In Climate Change 2021: The Physical Science Basis: Contribution of Working Group I to the Sixth Assessment Report of the Intergovernmental Panel on Climate Change; Masson-Delmotte, V., Zhai, P., Pirani, A., Connors, S.L., Péan, C., Berger, S., Caud, N., Chen, Y., Goldfarb, L., Gomis, M.I., et al., Eds.; Cambridge University Press: Cambridge, UK; New York, NY, USA,, 2021; pp. 287–422. [Google Scholar]
  86. Yang, W.; Guo, X.F.; Yao, T.D.; Zhu, M.L.; Wang, Y.J. Recent accelerating mass loss of southeast Tibetan glaciers and the relationship with changes in macroscale atmospheric circulations. Clim. Dynam. 2016, 47, 805–815. [Google Scholar] [CrossRef]
  87. Fujita, K. Effect of precipitation seasonality on climatic sensitivity of glacier mass balance. Earth Planet. Sci. Lett. 2008, 276, 14–19. [Google Scholar] [CrossRef]
  88. Ohmura, A. Physical basis for the temperature-based melt-index method. J. Appl. Meteorol. 2001, 40, 753–761. [Google Scholar] [CrossRef]
  89. Yang, K.; Wu, H.; Qin, J.; Lin, C.G.; Tang, W.J.; Chen, Y.Y. Recent climate changes over the Tibetan Plateau and their impacts on energy and water cycle: A review. Glob. Planet. Change 2014, 112, 79–91. [Google Scholar] [CrossRef]
  90. Liu, X.H.; Zhao, L.J.; Chen, T.; Shao, X.M.; Liu, Q.; Hou, S.G.; Qin, D.H.; An, W.L. Combined tree-ring width and δ13C to reconstruct snowpack depth: A pilot study in the Gongga Mountain, west China. Theor. Appl. Climatol. 2011, 103, 133–144. [Google Scholar] [CrossRef]
  91. Fujita, K.; Ageta, Y. Effect of summer accumulation on glacier mass balance on the Tibetan Plateau revealed by mass-balance model. J. Glaciol. 2000, 46, 244–252. [Google Scholar] [CrossRef]
  92. Østrem, G. Ice melting under a thin layer of moraine, and the existence of ice cores in moraine ridges. Geogr. Ann. 1959, 41, 228–230. [Google Scholar] [CrossRef]
  93. Nakawo, M.; Young, G.J. Field experiments to determine the effect of a debris layer on ablation of glacier ice. Ann. Glaciol. 1981, 2, 85–91. [Google Scholar] [CrossRef]
  94. Mattson, L.E.; Gardner, J.S.; Young, G.J. Ablation on debris-covered glaciers: An example from the Rakhiot Glacier, Punjab, Himalaya. IAHS Publ. 1993, 218, 289–296. [Google Scholar]
  95. Nicholson, L.; Benn, D.I. Calculating ice melt beneath a debris layer using meteorological data. J. Glaciol. 2006, 52, 463–470. [Google Scholar] [CrossRef]
  96. Benn, D.I.; Bolch, T.; Hands, K.; Gulley, J.; Luckman, A.; Nicholson, L.I.; Quincey, D.; Thompson, S.; Toumi, R.; Wiseman, S. Response of debris-covered glaciers in the Mount Everest region to recent warming, and implications for outburst flood hazards. Earth-Sci. Rev. 2012, 114, 156–174. [Google Scholar] [CrossRef]
  97. Kirkbride, M.P.; Deline, P. The formation of supraglacial debris covers by primary dispersal from transverse englacial debris bands. Earth Surf. Proc. Land. 2013, 38, 1779–1792. [Google Scholar] [CrossRef]
  98. Tielidze, L.G.; Bolch, T.; Wheate, R.D.; Kutuzov, S.S.; Lavrentiev, I.I.; Zemp, M. Supra-glacial debris cover changes in the Greater Caucasus from 1986 to 2014. Cryosphere 2020, 14, 585–598. [Google Scholar] [CrossRef]
  99. Xie, F.M.; Liu, S.Y.; Wu, K.P.; Zhu, Y.; Gao, Y.P.; Qi, M.M.; Duan, S.M.; Saifullah, M.; Tahir, A.A. Upward expansion of supra-glacial debris cover in the Hunza Valley, Karakoram, During 1990~2019. Front. Earth Sci. 2020, 8, 308. [Google Scholar] [CrossRef]
  100. Zhang, Y.; Liu, S.Y.; Wang, X. Debris-cover effect in the Tibetan Plateau and surroundings: A review. J. Glaciol. Geocryol. 2022, 44, 1–14, (In Chinese with English Abstract). [Google Scholar]
  101. Sakai, A.; Fujita, K. Formation conditions of supraglacial lakes on debris-covered glaciers in the Himalayas. J. Glaciol. 2010, 56, 177–181. [Google Scholar] [CrossRef]
  102. Miles, E.S.; Willis, I.; Buri, P.; Steiner, J.F.; Arnold, N.S.; Pellicciotti, F. Surface Pond energy absorption across four Himalayan glaciers accounts for 1/8 of total catchment ice loss. Geophys. Res. Lett. 2018, 45, 10,464–10,473. [Google Scholar] [CrossRef] [PubMed]
  103. Anderson, L.S.; Armstrong, W.H.; Anderson, R.S.; Scherler, D.; Petersen, E. The causes of debris-covered glacier thinning: Evidence for the importance of ice dynamics from Kennicott Glacier, Alaska. Front. Earth Sci. 2021, 9, 680995. [Google Scholar] [CrossRef]
  104. Buri, P.; Miles, E.S.; Steiner, J.F.; Ragettli, S.; Pellicciotti, F. Supraglacial ice cliffs can substantially increase the mass loss of debris-covered glaciers. Geophys. Res. Lett. 2021, 48, e2020GL092150. [Google Scholar] [CrossRef]
  105. Sakai, A.; Takeuchi, N.; Fujita, K.; Nakawo, M. Role of supraglacial ponds in the ablation process of a debris-covered glacier in the Nepal Himalayas. IAHS-AISH Publ. 2000, 264, 119–130. [Google Scholar]
  106. Sakai, A.; Nakawo, M.; Fujita, K. Distribution characteristics and energy balance of ice cliffs on debris-covered glaciers, Nepal Himalaya. Arct. Antarct. Alp. Res. 2002, 34, 12–19. [Google Scholar] [CrossRef]
  107. Wang, X.; Guo, X.Y.; Yang, C.D.; Liu, Q.H.; Wei, J.F.; Zhang, Y.; Liu, S.Y.; Zhang, Y.L.; Jiang, Z.L.; Tang, Z.G. Glacial Lake inventory of high-mountain Asia in 1990 and 2018 derived from Landsat images. Earth Syst. Sci. Data 2020, 12, 2169–2182. [Google Scholar] [CrossRef]
  108. Li, G.; Li, Y.; Lin, H.; Ye, Q.H.; Jiang, L.M. Two periods of geodetic glacier mass balance at Eastern Nyainqentanglha derived from multi-platform bistatic SAR interferometry. Int. J. Appl. Earth Obs. 2021, 104, 102541. [Google Scholar] [CrossRef]
  109. Zhang, G.Q.; Bolch, T.; Yao, T.D.; Rounce, D.R.; Chen, W.F.; Veh, G.; King, O.; Allen, S.K.; Wang, M.M.; Wang, W.C. Underestimated mass loss from lake-terminating glaciers in the greater Himalaya. Nat. Geosci. 2023, 16, 333–338. [Google Scholar] [CrossRef]
  110. King, O.; Bhattacharya, A.; Bhambri, R.; Bolch, T. Glacial lakes exacerbate Himalayan glacier mass loss. Sci. Rep. 2019, 9, 18145. [Google Scholar] [CrossRef] [PubMed]
  111. Benn, D.I.; Warren, C.R.; Mottram, R.H. Calving processes and the dynamics of calving glaciers. Earth-Sci. Rev. 2007, 82, 143–179. [Google Scholar] [CrossRef]
  112. Cook, S.J.; Christoffersen, P.; Todd, J.; Slater, D.; Chauché, N. Coupled modelling of subglacial hydrology and calving-front melting at Store Glacier, West Greenland. Cryosphere 2020, 14, 905–924. [Google Scholar] [CrossRef]
  113. Du, J.K.; He, Y.Q.; Li, S.; Wang, S.J.; Niu, H.W. Mass balance of a typical monsoonal temperate glacier in Hengduan Mountains Region. Acta Geogr. Sin. 2015, 70, 1415–1422, (In Chinese with English Abstract). [Google Scholar]
  114. Bassis, J.N.; Ma, Y. Evolution of basal crevasses links ice shelf stability to ocean forcing. Earth Planet. Sci. Lett. 2015, 409, 203–211. [Google Scholar] [CrossRef]
  115. Kääb, A.; Leinss, S.; Gilbert, A.; Bühler, Y.; Gascoin, S.; Evans, S.G.; Bartelt, P.; Berthier, E.; Brun, F.; Chao, W.A.; et al. Massive collapse of two glaciers in western Tibet in 2016 after surge-like instability. Nat. Geosci. 2018, 11, 114–120. [Google Scholar] [CrossRef]
  116. Gu, J.; Zhang, Y.; Liu, S.Y.; Wang, X. Research on estimation methods of glacier basal sliding on the Tibetan Plateau: Progress, problems and prospects. Adv. Earth Sci. 2021, 36, 307–316, (In Chinese with English Abstract). [Google Scholar]
  117. Racoviteanu, A.E.; Nicholson, L.; Glasser, N.F. Surface composition of debris-covered glaciers across the Himalaya using linear spectral unmixing of Landsat 8 OLI imagery. Cryosphere 2021, 15, 4557–4588. [Google Scholar] [CrossRef]
  118. Robson, B.A.; Bolch, T.; MacDonell, S.; Hölbling, D.; Rastner, P.; Schaffer, N. Automated Detection of Rock Glaciers Using Deep Learning and Object-Based Image Analysis. Remote Sens. Environ. 2020, 250, 112033. [Google Scholar] [CrossRef]
  119. Pandey, A.; Rai, A.; Gupta, S.K.; Shukla, D.P.; Dimri, A.P. Integrated Approach for Effective Debris Mapping in Glacierized Regions of Chandra River Basin, Western Himalayas, India. Sci. Total Environ. 2021, 779, 146492. [Google Scholar] [CrossRef] [PubMed]
  120. Yousuf, B.; Shukla, A.; Arora, M.K.; Bindal, A.; Jasrotia, A.S. On Drivers of Subpixel Classification Accuracy—An Example from Glacier Facies. IEEE J. Sel. Top. Appl. Earth Obs. Remote Sens. 2020, 13, 601–608. [Google Scholar] [CrossRef]
  121. Haq, M.A.; Azam, M.F.; Vincent, C. Efficiency of artificial neural networks for glacier ice-thickness estimation: A case study in western Himalaya, India. J. Glaciol. 2021, 67, 671–684. [Google Scholar] [CrossRef]
  122. Haq, M.A.; Jain, K.; Menon, K.P.R. Modelling of Gangotri glacier thickness and volume using an artificial neural network. Int. J. Remote Sens. 2014, 35, 6035–6042. [Google Scholar] [CrossRef]
  123. Bolibar, J.; Rabatel, A.; Gouttevin, I.; Zekollari, H.; Galiez, C. Nonlinear sensitivity of glacier mass balance to future climate change unveiled by deep learning. Nat. Commun. 2022, 13, 409. [Google Scholar] [CrossRef] [PubMed]
  124. Farinotti, D.; Huss, M.; Fürst, J.J.; Landmann, J.; Machguth, H.; Maussion, F.; Pandit, A. A consensus estimates for the ice thickness distribution of all glaciers on Earth. Nature Geosci. 2019, 12, 168–173. [Google Scholar] [CrossRef]
  125. Millan, R.; Mouginot, J.; Rabatel, A.; Morlighem, M. Ice velocity and thickness of the world’s glaciers. Nature Geosci. 2022, 15, 124–129. [Google Scholar] [CrossRef]
  126. Liu, S.; Shangguan, D.; Ding, Y.; Han, H.; Zhang, Y.; Wang, J.; Xie, C.; Ding, L.; Li, G. Glacier Variations since the Early 20th Century in the Gangrigabu Range, Southeast Tibetan Plateau. J. Glaciol. Geocryol. 2005, 27, 55–63, (In Chinese with English abstract). [Google Scholar]
  127. Wu, K.P.; Liu, S.Y.; Jiang, Z.L.; Xu, J.L.; Wei, J.F.; Guo, W.Q. Recent glacier mass balance and area changes in the Kangri Karpo Mountains from DEMs and glacier inventories. Cryosphere 2018, 12, 103–121. [Google Scholar] [CrossRef]
Figure 1. Distribution of maritime glaciers (red color) in the SETP and glaciers with mass balance observations over different periods (see Table S2 for details). A, B, and C represent the Eastern Yigong, Eastern Bomi, and Nancha Barwa regions, and 1–4 indicate national weather stations, Linzhi, Luolong, Bomi, and Chayu. The Parlung No.4, No. 10, No. 12, No. 94, and No. 390 glaciers are located in the same basin, the Parlung Zangbo Basin. The pink line in the upper left part of the figure shows the distribution boundary of maritime glaciers in the TP that is derived from [17], and blue and red lines with arrows denote the westerlies and the Indian monsoon.
Sustainability 16 07118 g001
Figure 2. Glacier number and area distribution for different area classes in the SETP.
Sustainability 16 07118 g002
Figure 3. Satellite-based average mass balance of maritime glaciers across the SETP from the 1970s to 2020, which are derived from previous studies [8,9,10,25,26,47,75,76]. The data used for each estimate are provided in the legend, and the bars indicate the error for each estimate derived from each study.
Sustainability 16 07118 g003
Figure 4. Observed cumulative mass balance (a) and reconstructed mass balance (b) on different maritime glaciers in the SETP. The data are derived from different studies [80,81,82]. The dotted line in the figure shows that glacier mass balance is 0.
Sustainability 16 07118 g004
Figure 5. Flow chart showing the network of factors influencing maritime glacier mass balance. ILR and SH flux indicate incoming longwave radiation and sensible heat flux.
Sustainability 16 07118 g005
Figure 6. Variations in annual precipitation (light blue bar) and average temperature (red line) in the SETP during 1979–2021, which are derived from outputs of ERA5.
Sustainability 16 07118 g006
Figure 7. Schematic showing interactions between melt hotspots on the glacier surface.
Sustainability 16 07118 g007
Figure 8. Development of ice crevasses on the Baishui River Glacier No. 1 in Mt. Yulong of the SETP from 2005 to 2018. The location of the Baishui River Glacier No. 1 is shown in Figure 1. Images are obtained from Google Earth in June 2005 (a) and October 2018 (b), respectively.
Sustainability 16 07118 g008
Figure 9. Major challenges and perspective steps for future mass balance study on maritime glaciers in the SETP. GNSS and UAVs denote the Global Navigation Satellite System and unpiloted aerial vehicles, respectively.
Sustainability 16 07118 g009
Figure 10. Schematic of monitoring networks for maritime glaciers and their surface processes.
Sustainability 16 07118 g010
Table 1. Basic statistics for maritime glaciers in different regions of the SETP. Data are derived from [16,17].
RegionElevation
(m)
Glacier
Number
Glacier Area (km2)Proportion
(%)
Average Area (km2)
Hengduan Mountains2979–755617251579.512.00.92
Central and eastern Nyainqêntanglha2459–693042737888.859.71.85
Eastern Himalayas3225–879826093734.928.31.43
Total2459–8798860713,203.21001.53
Table 2. Summary of average glacier mass balance (m w.e. yr−1) in different mountainous regions of the SETP since 2000.
PeriodHengduanNyainqêntanglhaEastern HimalayasReferences
2000–2020−0.71 ± 0.11−0.53 ± 0.10−0.52 ± 0.10[26]
2000–2019−1.29 ± 0.32−0.84 ± 0.22−0.55 ± 0.14[25]
2000–2018−0.64 ± 0.15−0.46 ± 0.14−0.52 ± 0.15[9]
2000–2016−0.56 ± 0.23−0.62 ± 0.23−0.38 ± 0.20[8]
2010–2019−0.92 ± 0.53−0.89 ± 0.19−0.69 ± 0.24[76]
Disclaimer/Publisher’s Note: The statements, opinions and data contained in all publications are solely those of the individual author(s) and contributor(s) and not of MDPI and/or the editor(s). MDPI and/or the editor(s) disclaim responsibility for any injury to people or property resulting from any ideas, methods, instructions or products referred to in the content.

