
A Review of the Most Concerning Chemical Contaminants in Drinking Water for Human Health


Abstract
1. Introduction
2. Materials and Methods
- -
- Phase 1: Title analysis.
- -
- Phase 2: Abstract analysis.
- -
- Phase 3: Full-article analysis.
- -
- Reports focusing on the contamination of private water sources, as these are typically not regulated by most countries.
- -
- Reports lacking data on the concentrations of specific chemicals.
- -
- Reports that did not clarify whether the water was used directly for drinking or was pre-treated.
3. Results and Discussion
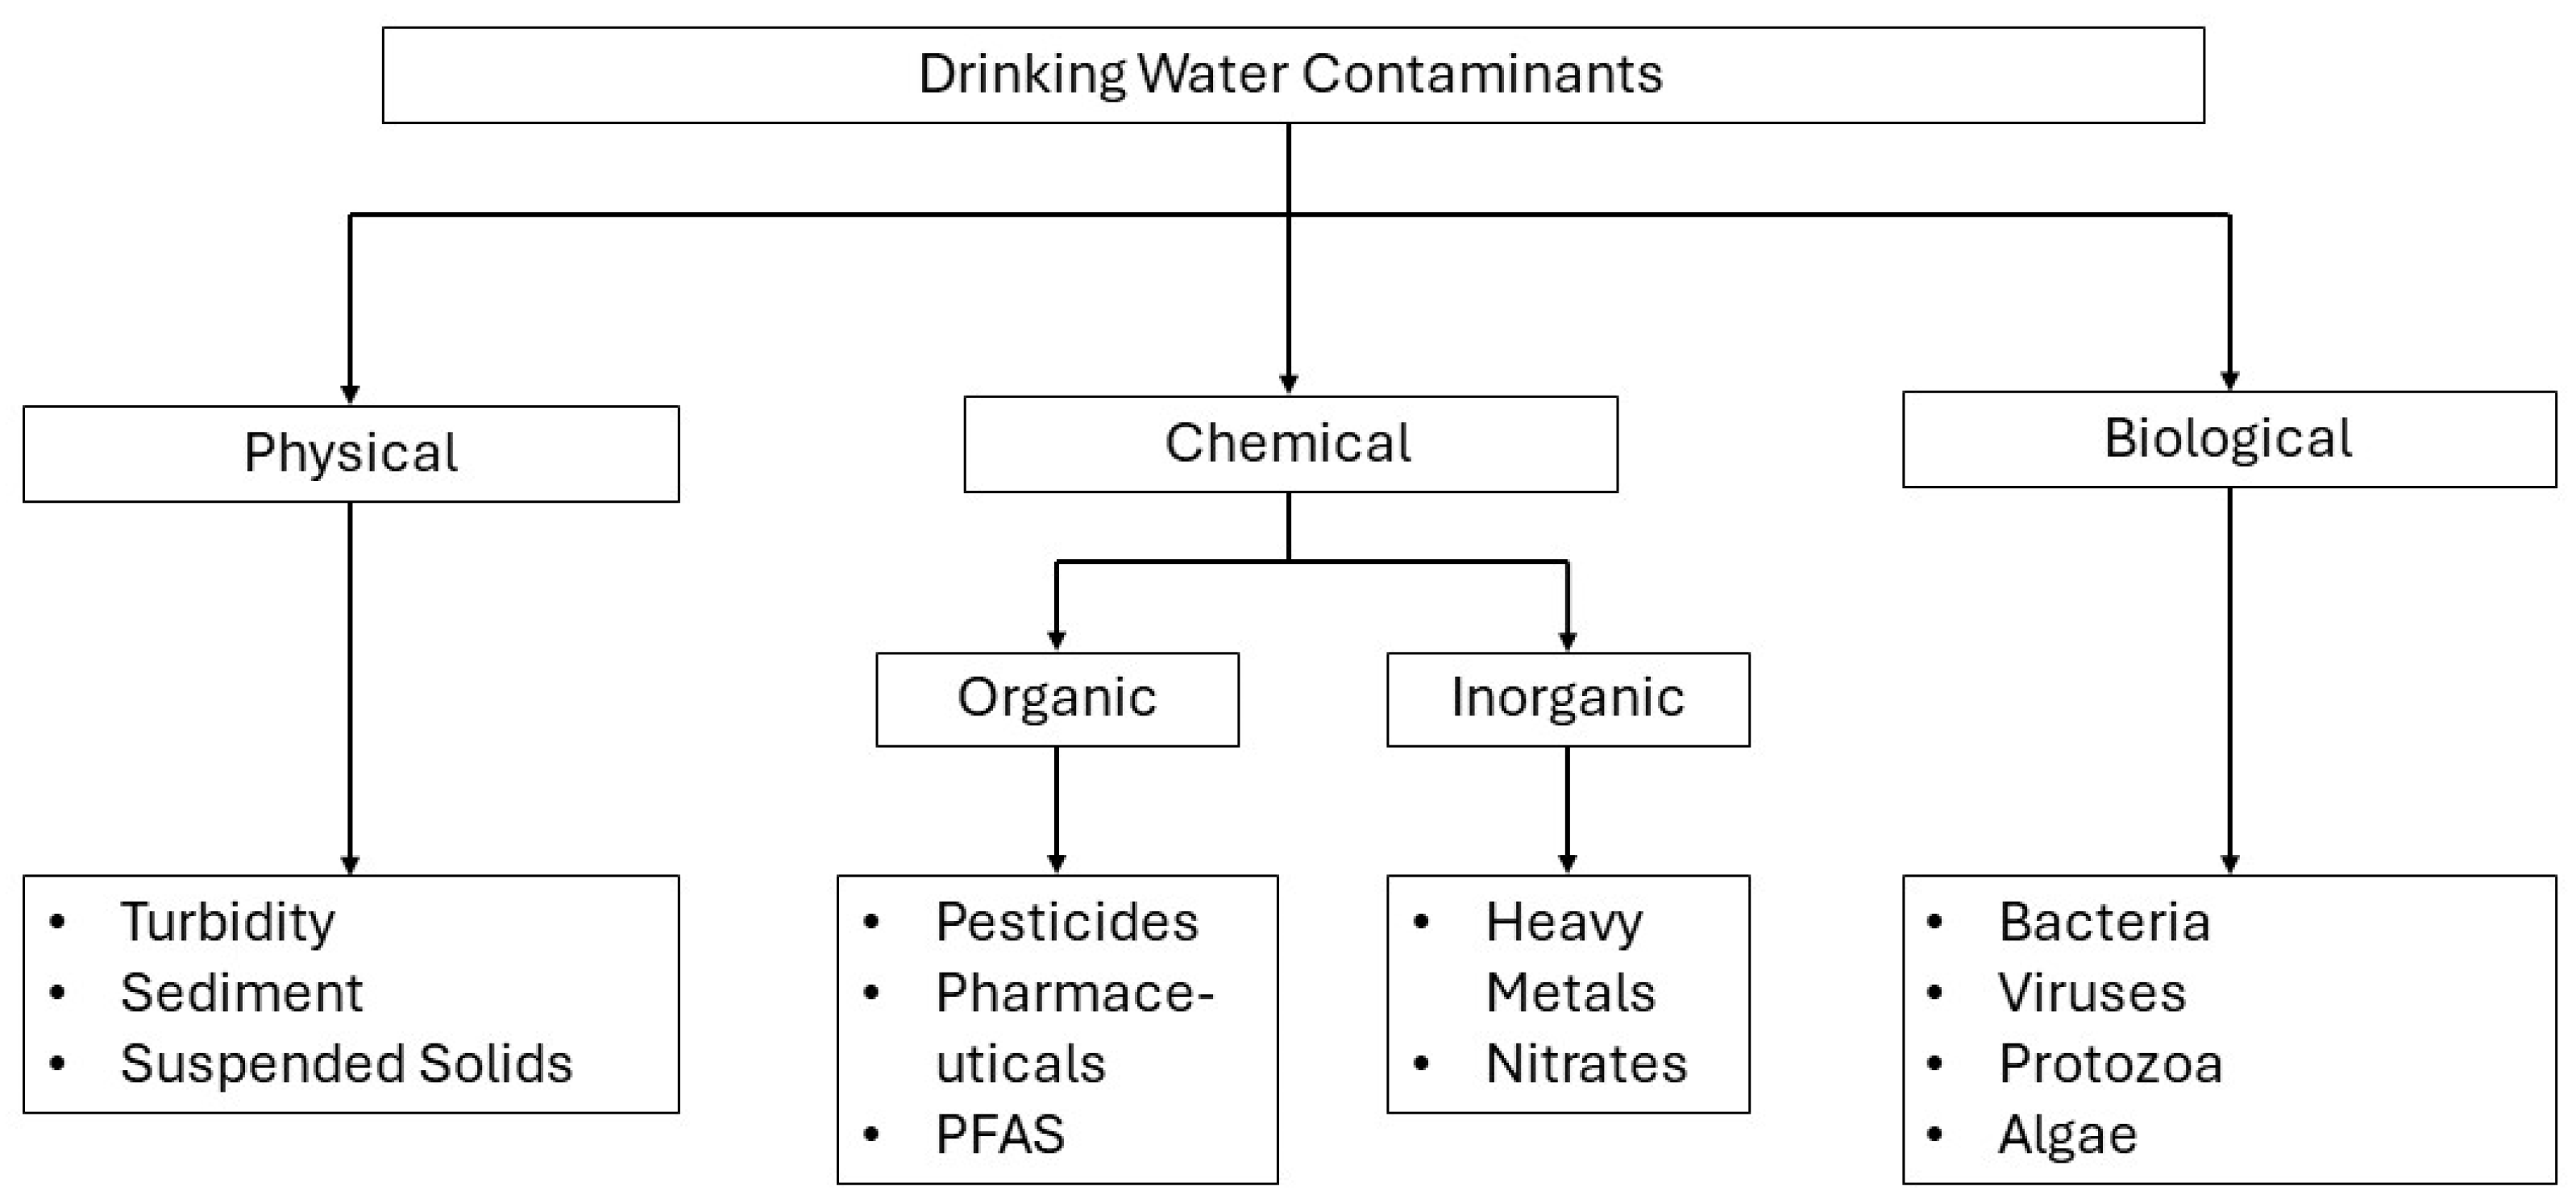
3.1. Priority Chemical Contaminants
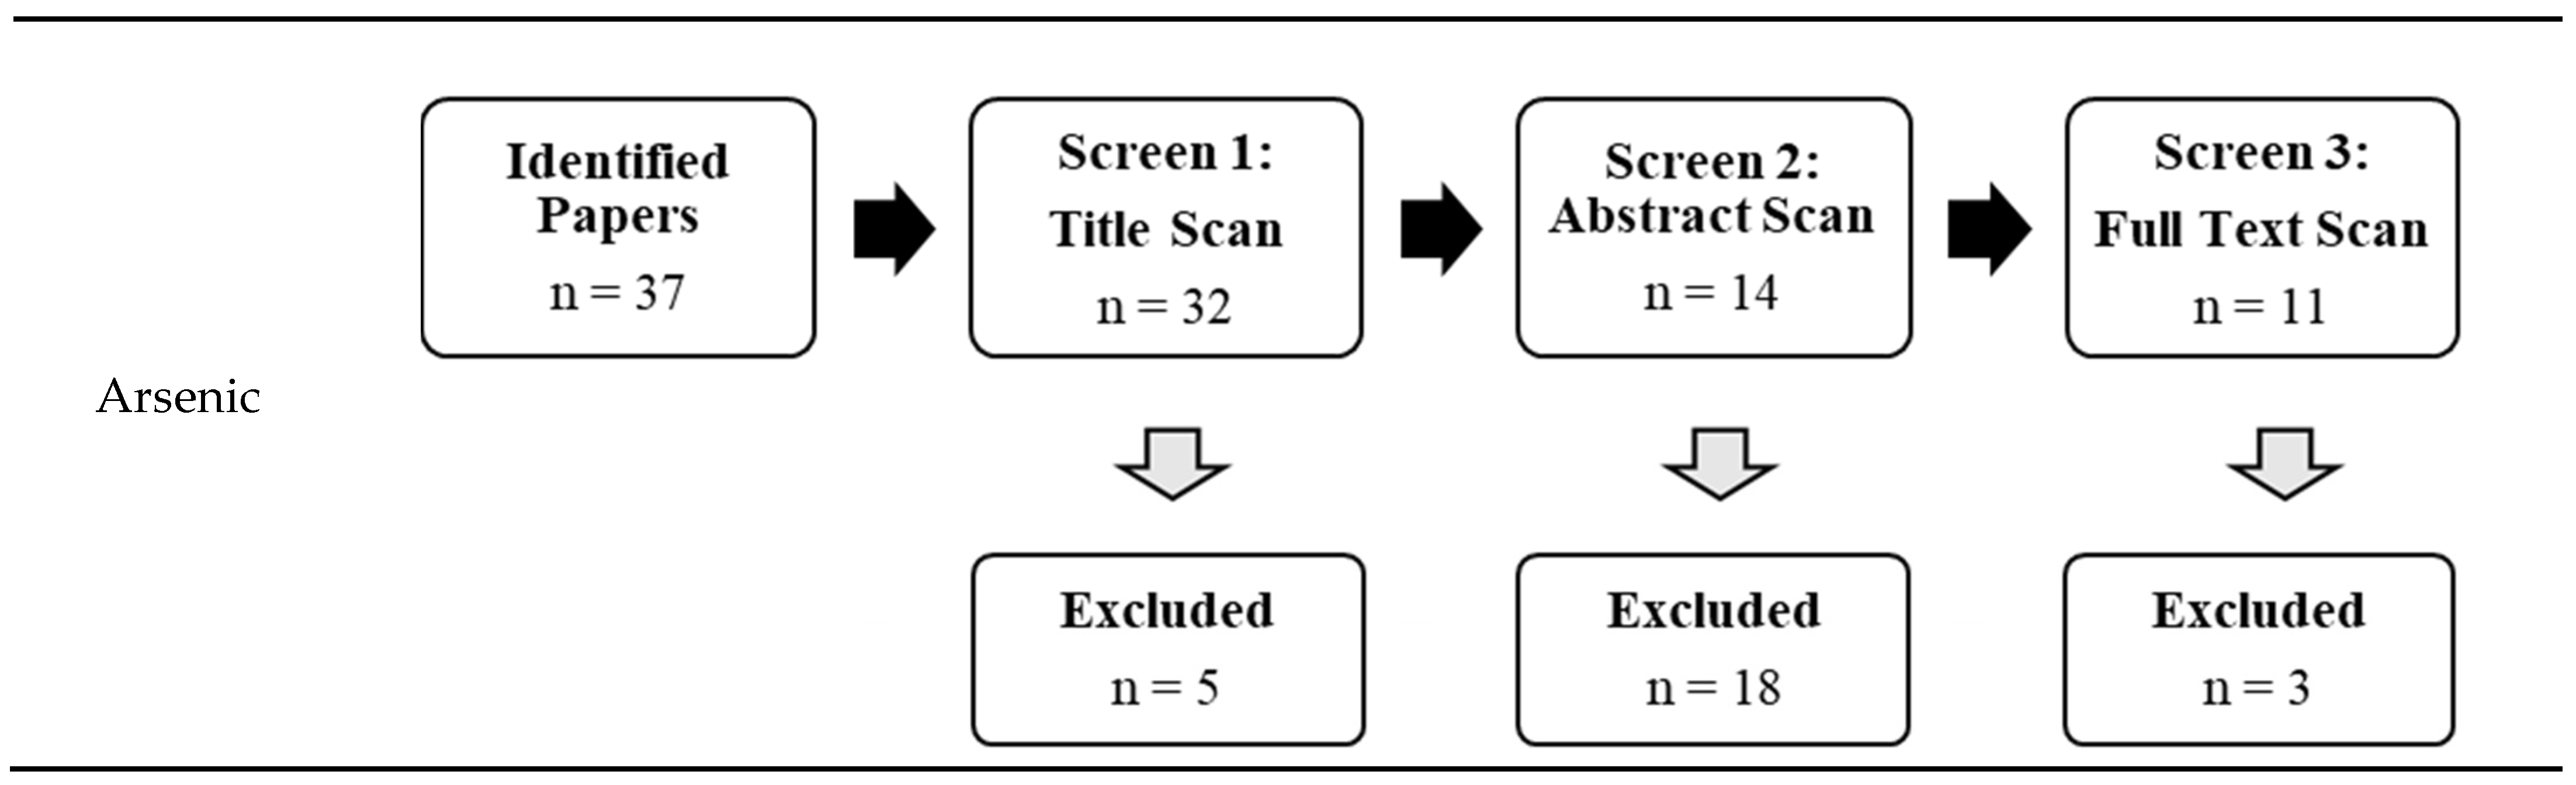
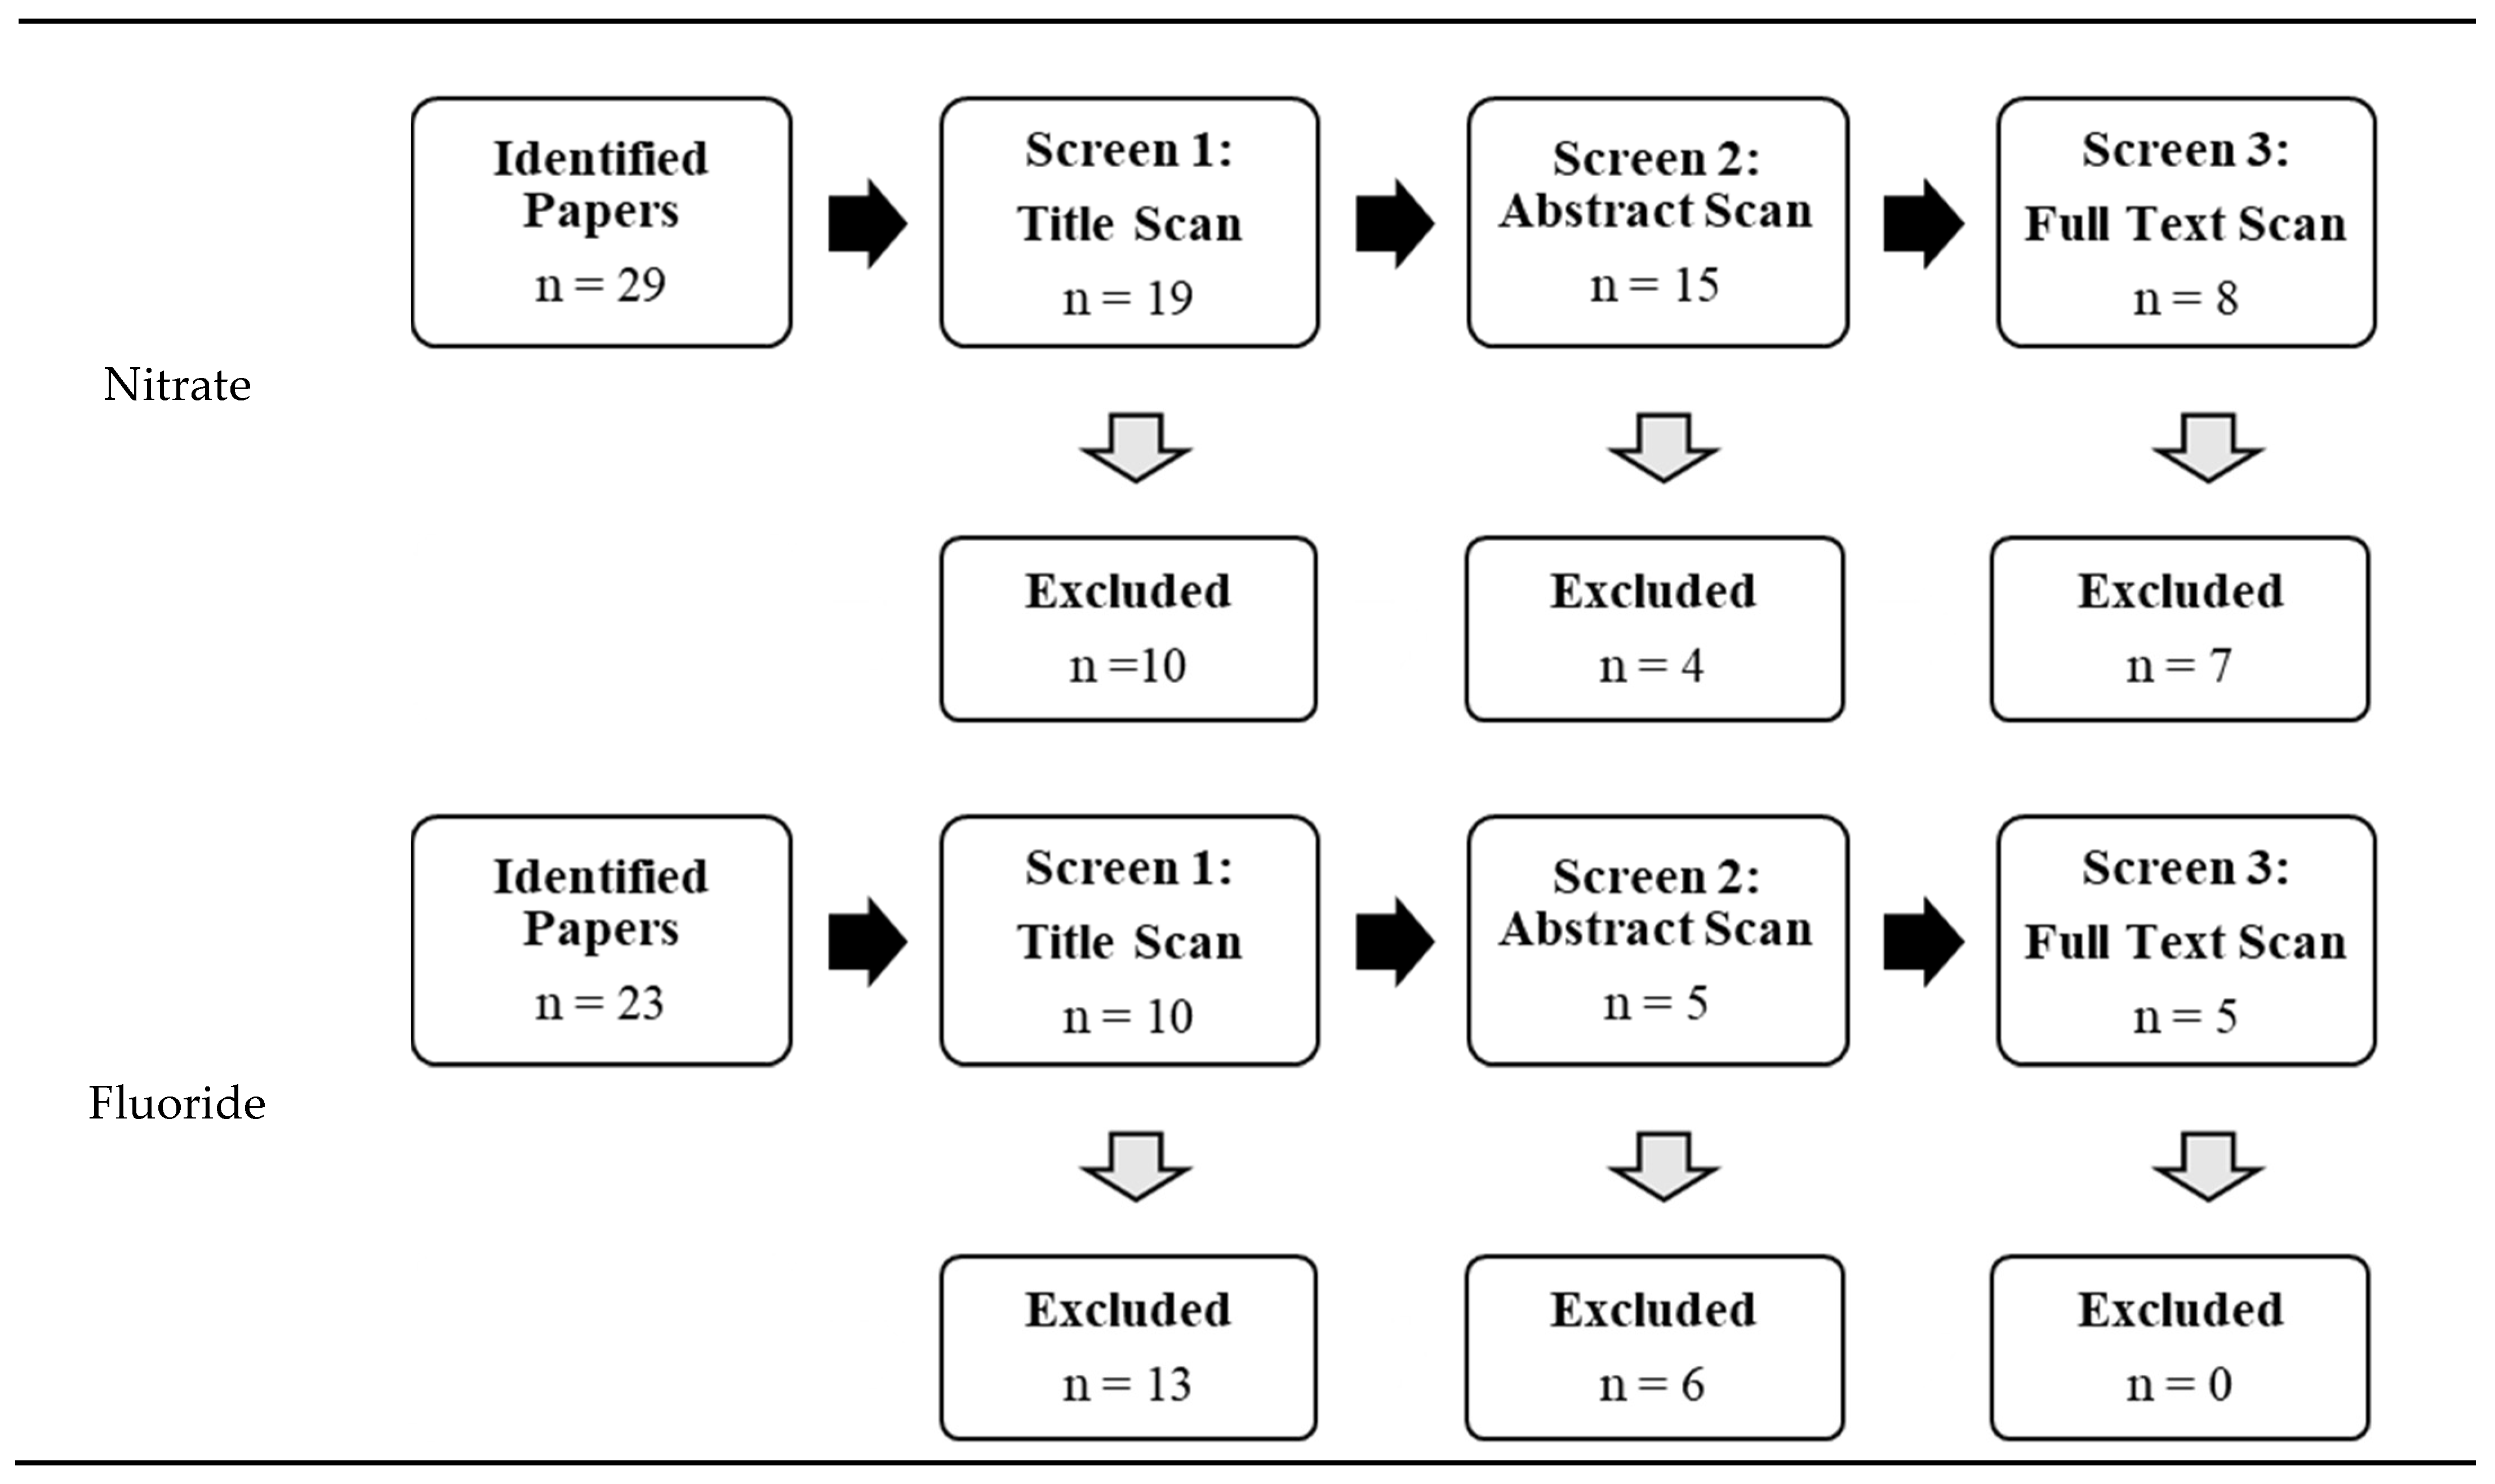
3.2. Screening
3.3. Contamination Levels
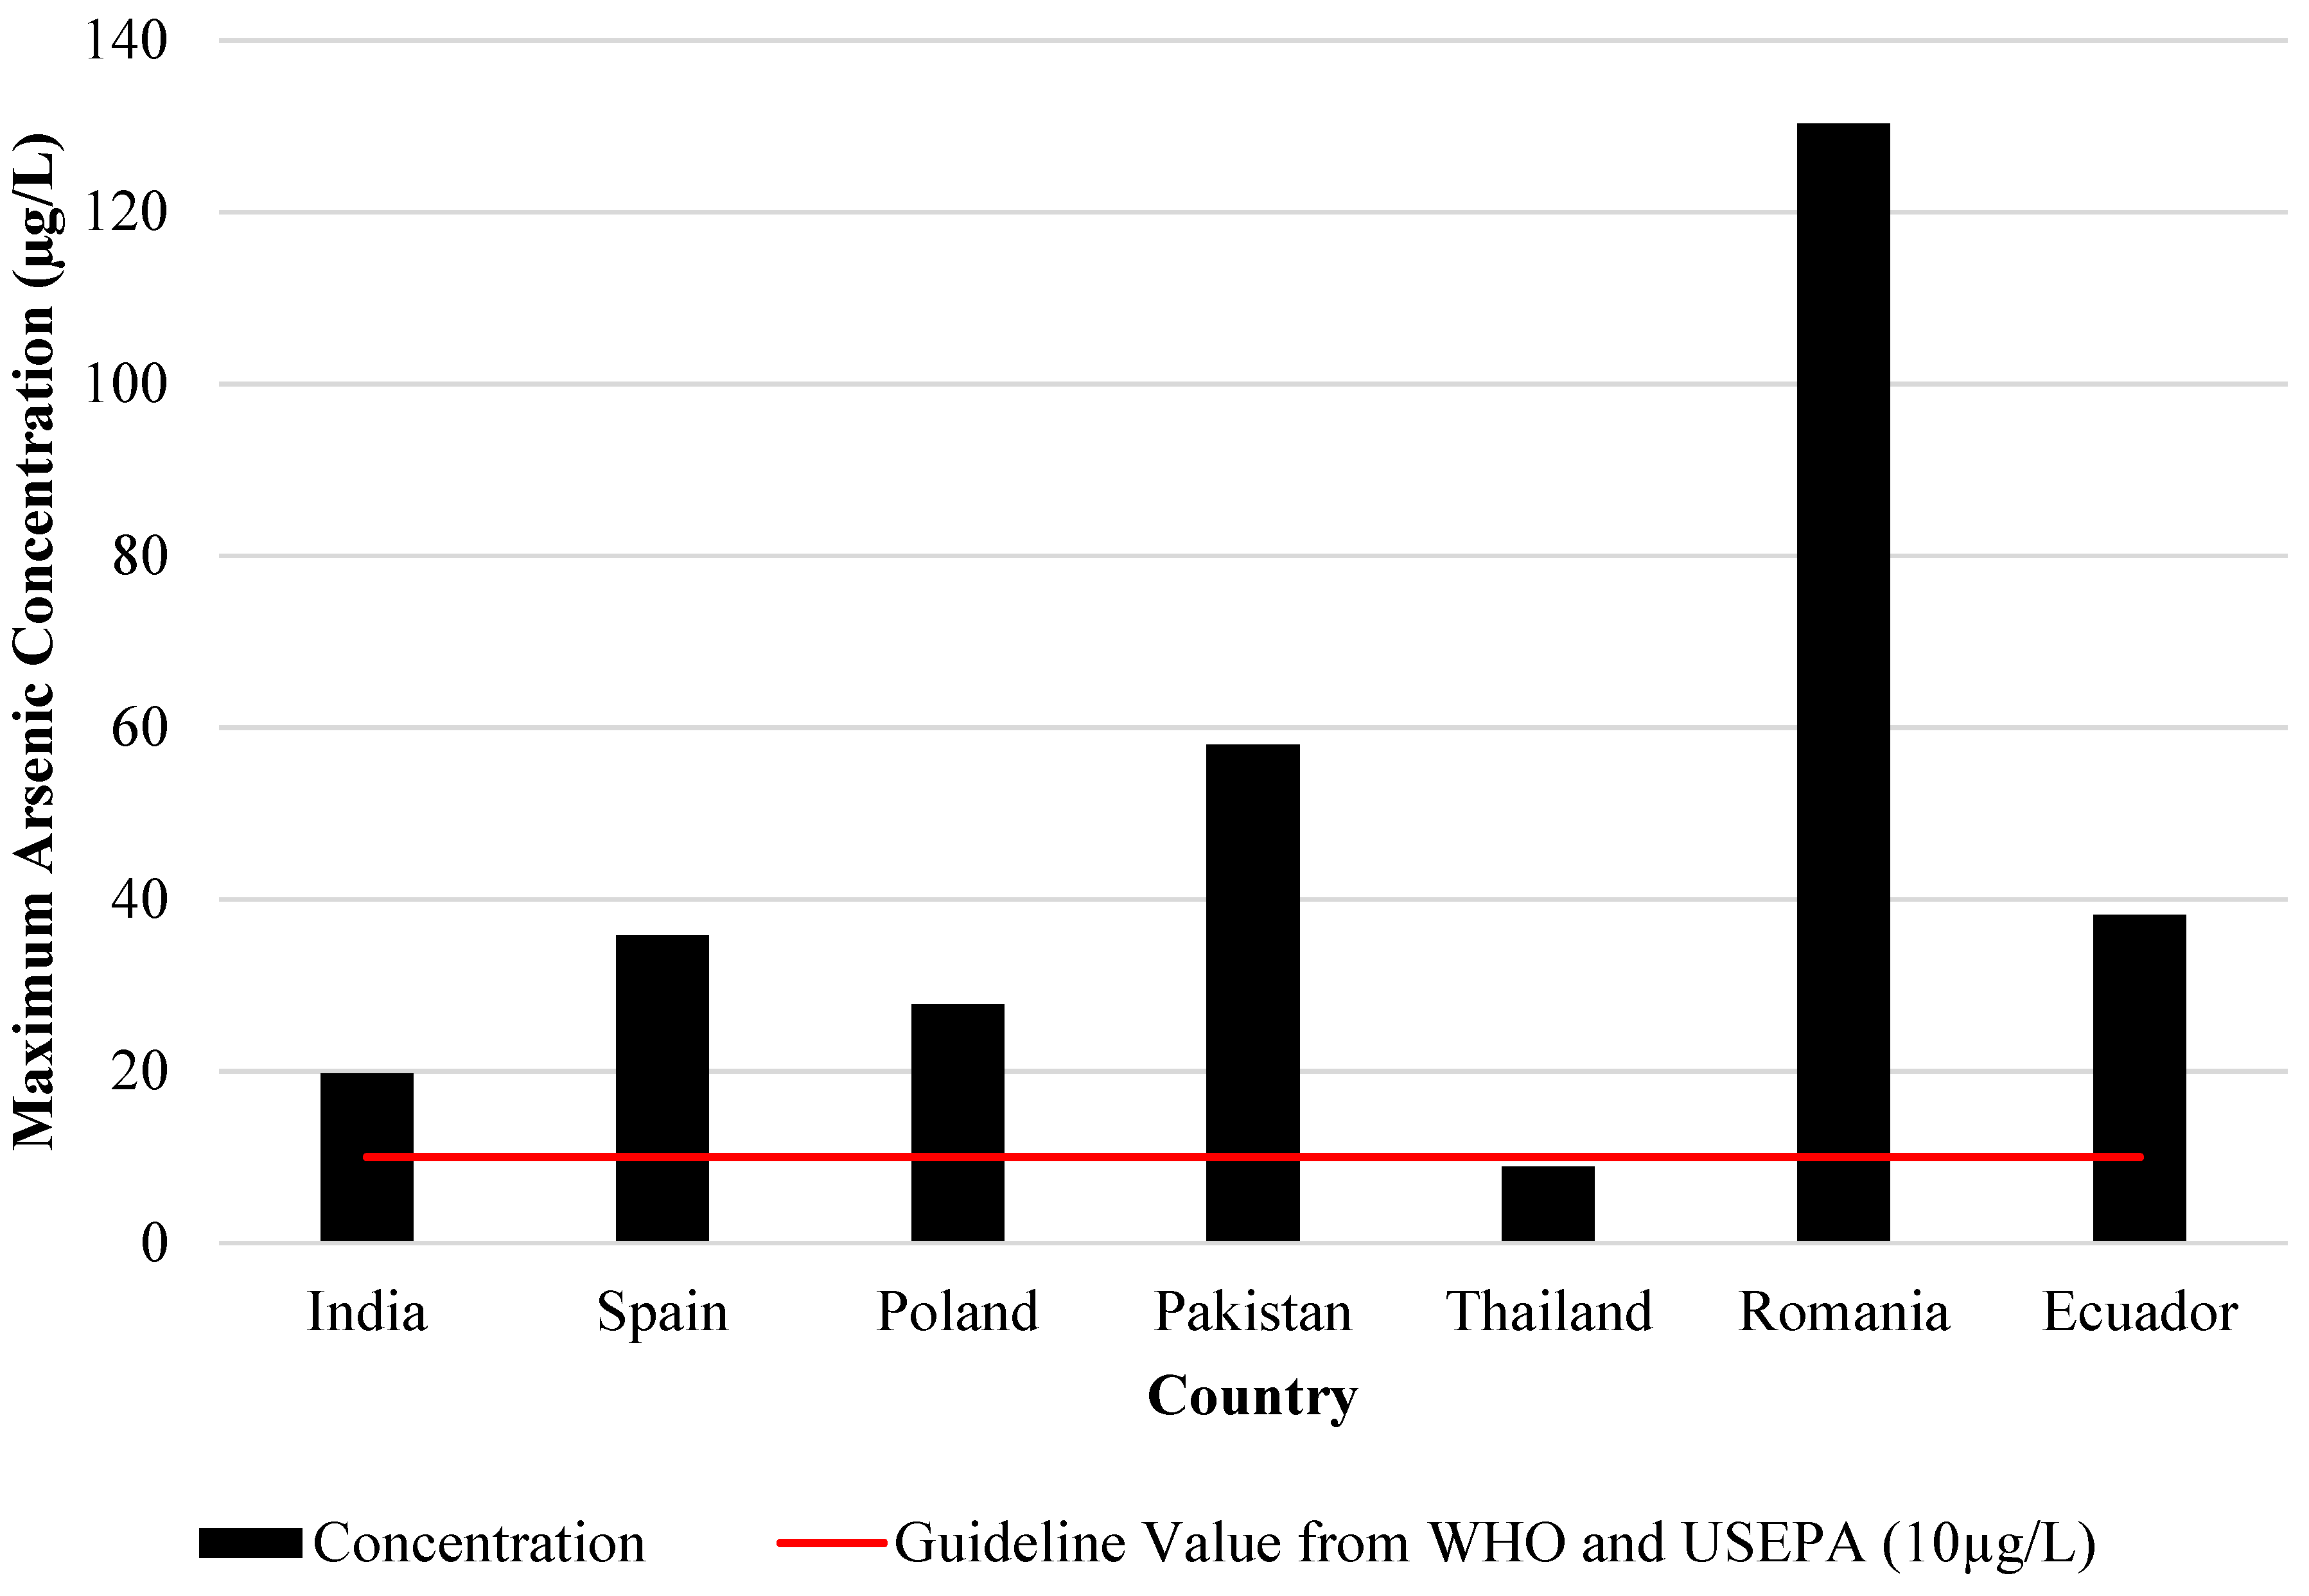
3.3.1. Arsenic
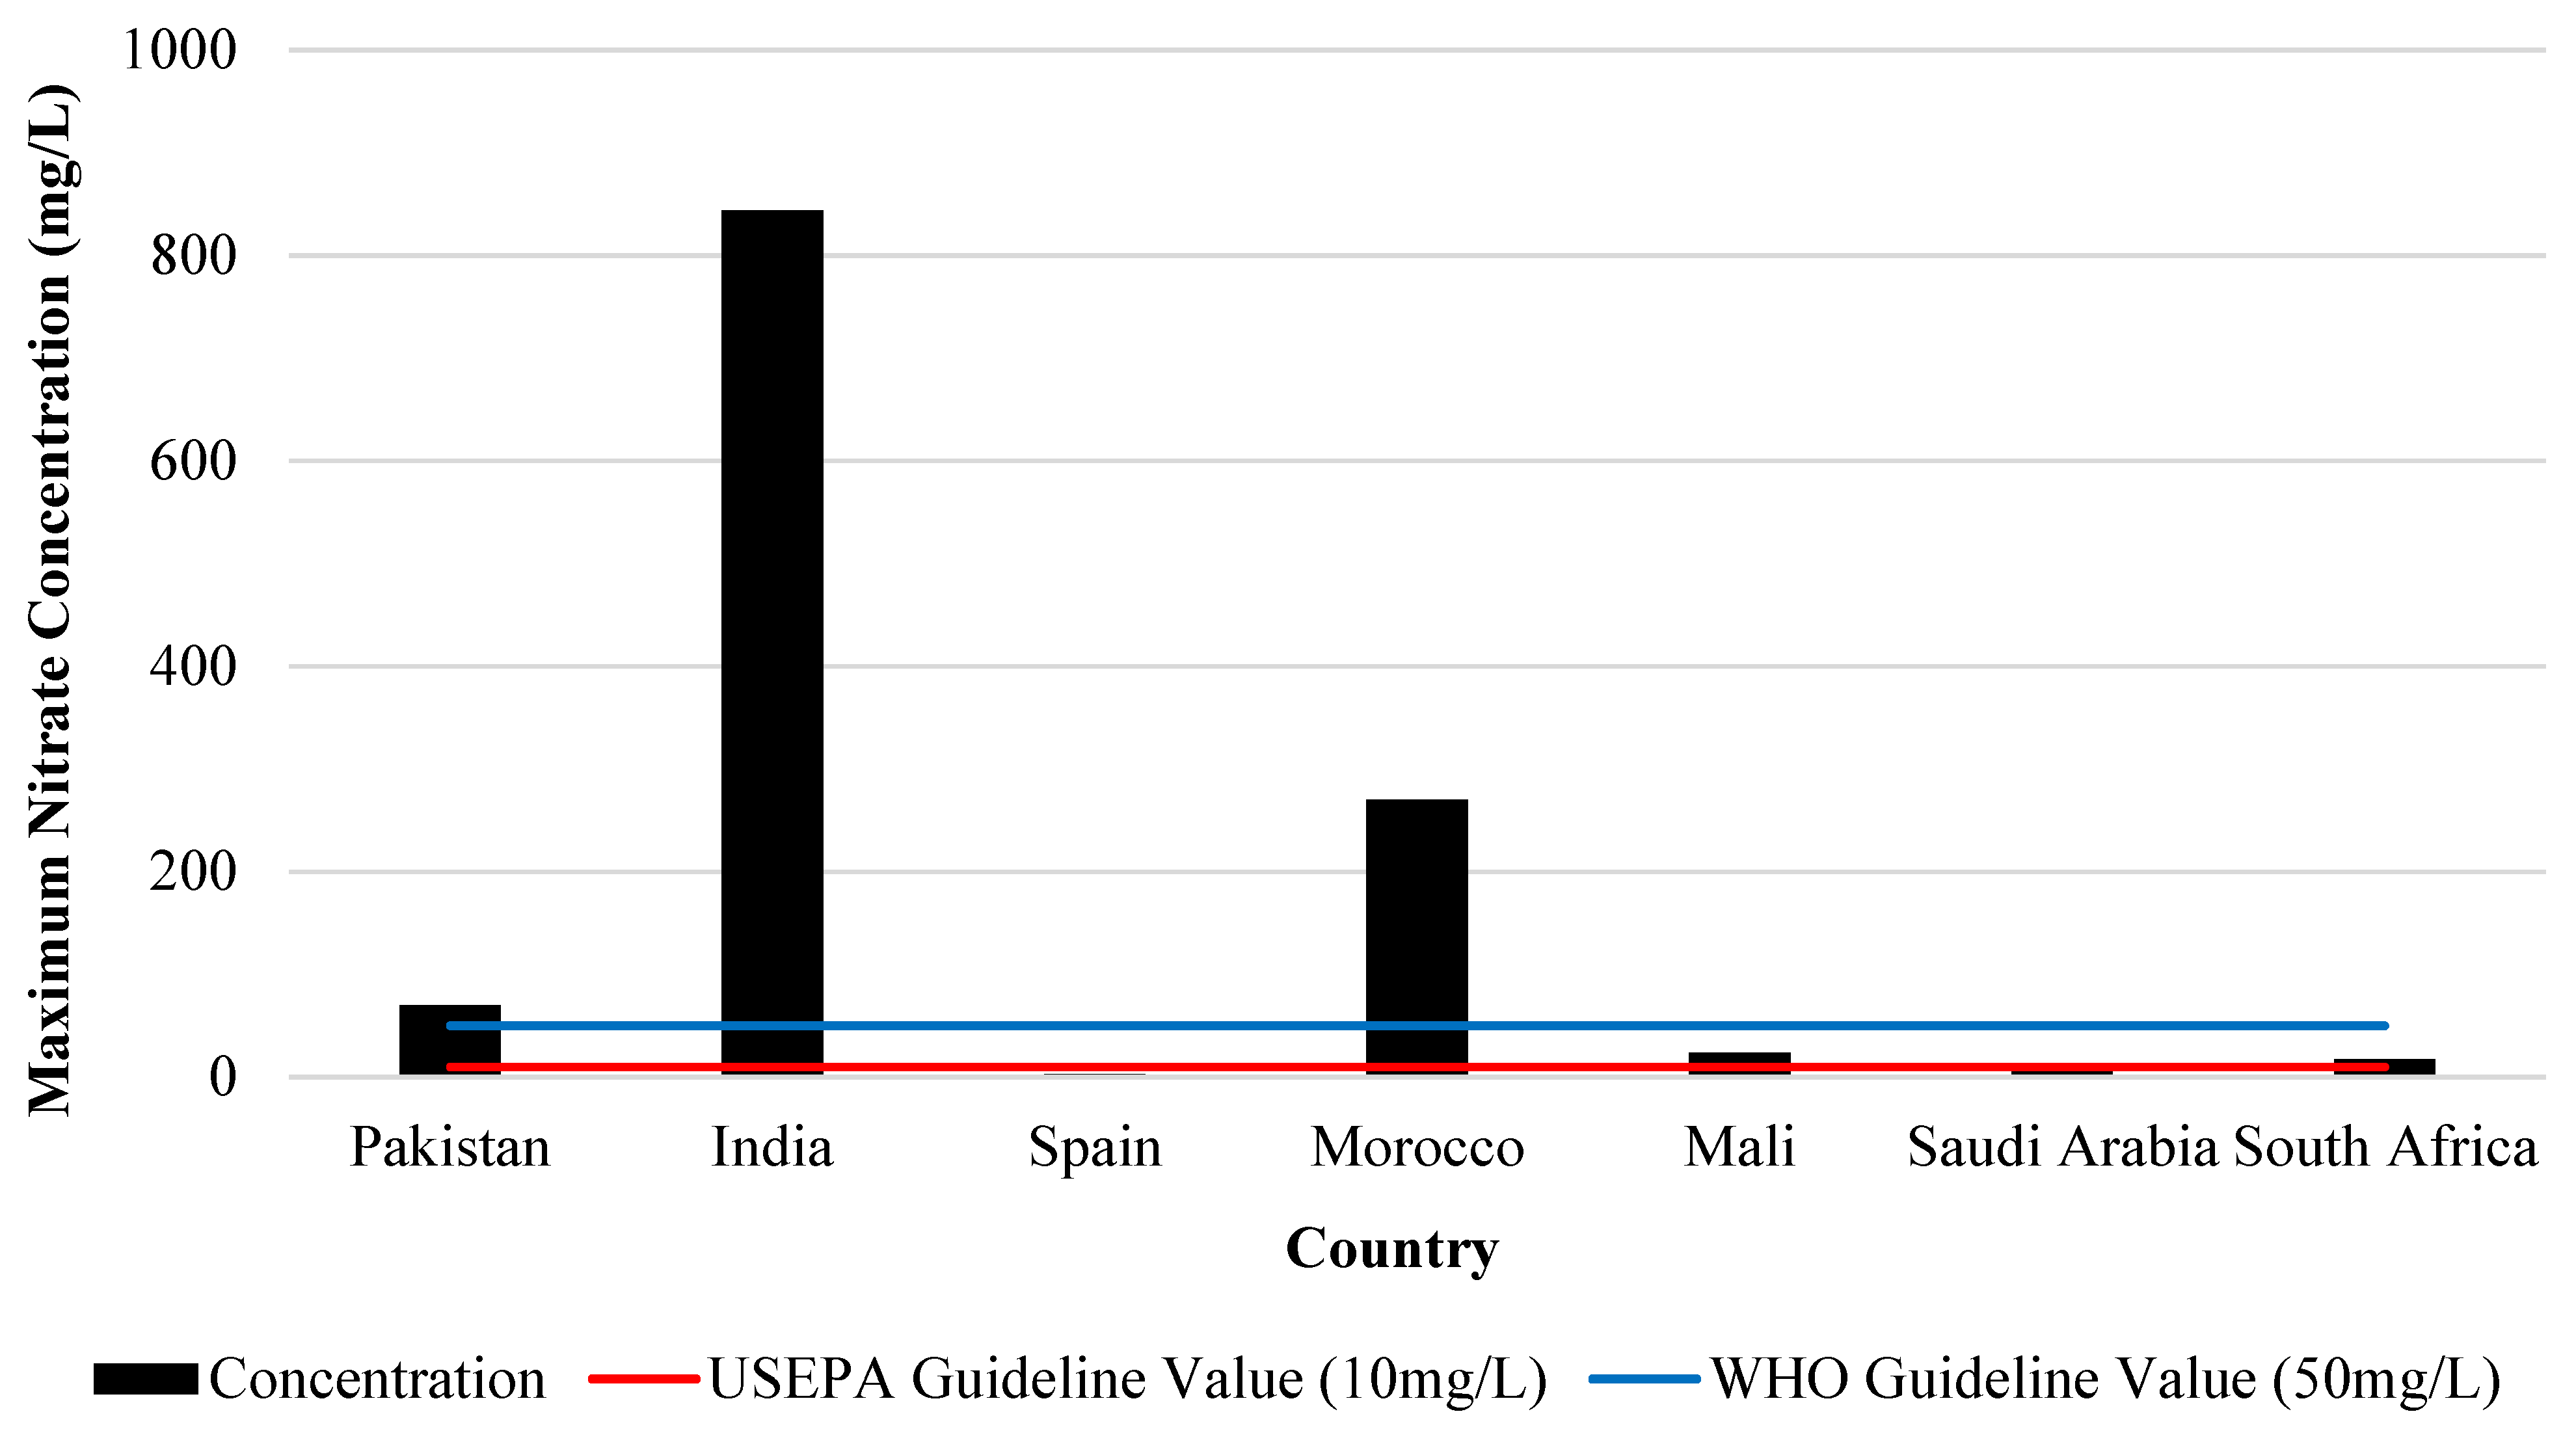
3.3.2. Nitrate
3.3.3. Fluoride

| Arsenic | |||||||
| Country | Daily water consumption (WC) per kg of body weight L/kg [70] | ||||||
| Infants (<1 year) 0.044 | Children (1 to 10 years) 0.036 | ||||||
| Average weight (W) in kg of children aged six months to 5 years for boys and girls [71] | |||||||
| Boys | Girls | ||||||
| Six months | Two Years | Five Years | Six Months | Two Years | Five years | ||
| 7.9 Exposure Level (µg) 3.47 * | 12.2 Exposure Level (µg) 4.39 * | 18.3 Exposure Level (µg) 6.58 * | 7.3 Exposure Level (µg) 3.21 * | 11.5 Exposure Level (µg) 4.14 * | 18.2 Exposure Level (µg) 6.55 * | ||
| * Value calculated considering the maximum exposure limit for arsenic according to WHO—(10 µg/L) | |||||||
| Maximum arsenic concentration found per country (C) µg/L | Amount (A) (µg) of arsenic in the infant’s and child’s body based on water consumption by age, weight and sex. A = C × WC × W | ||||||
| India | 19.73 | 6.85 | 8.66 | 12.99 | 6.33 | 8.17 | 12.92 |
| Spain | 35.80 | 12.44 | 15.72 | 25.58 | 9.97 | 14.82 | 23.45 |
| Poland | 27.80 | 9.66 | 12.20 | 18.31 | 8.92 | 11.50 | 18.21 |
| Pakistan | 58.00 | 20.16 | 25.47 | 38.21 | 18.63 | 24.01 | 38.00 |
| Thailand | 8.87 | 3.08 | 3.89 | 5.84 | 2.85 | 3.67 | 5.81 |
| Romania | 130.30 | 45.29 | 57.22 | 85.84 | 41.85 | 53.94 | 85.37 |
| Ecuador | 38.18 | 13.27 | 16.76 | 25.15 | 12.26 | 15.80 | 25.01 |
| Nitrate | |||||||
| Country | Daily water consumption (WC) per kg of body weight L/kg [70] | ||||||
| Infants (<1 year) 0.044 | Children (1 to 10 years) 0.036 | ||||||
| Average weight (W) in kg of children aged six months to 5 years for boys and girls [71] | |||||||
| Boys | Girls | ||||||
| Six months | Two Years | Five Years | Six Months | Two Years | Five Years | ||
| 7.9 Exposure Level (mg) 17.38 * | 12.2 Exposure Level (mg) 21.96 * | 18.3 Exposure Level (mg) 32.94 * | 7.3 Exposure Level (mg) 16.06 * | 11.5 Exposure Level (mg) 20.70 * | 18.2 Exposure Level (mg) 32.76 * | ||
| * Value calculated considering the maximum exposure limit for nitrate according to WHO—(50 mg/L) | |||||||
| Maximum nitrate concentration found per country (C) mg/L | Amount (A) (mg) of nitrate in the infant’s and child’s body based on water consumption by age, weight and sex. A = C × WC × W | ||||||
| Pakistan | 70 | 24.332 | 30.74 | 46.12 | 22.48 | 28.98 | 45.86 |
| Indian | 844 | 293.37 | 370.68 | 556.02 | 271.09 | 349.42 | 552.98 |
| Spain | 2.865 | 0.99 | 1.26 | 1.88 | 0.92 | 1.18 | 1.87 |
| Morocco | 270.1 | 93.88 | 118.62 | 177.94 | 86.75 | 111.82 | 176.96 |
| Mali | 23.4 | 8.13 | 10.28 | 15.41 | 7.52 | 9.68 | 15.33 |
| Saud Arabia | 11.75 | 4.08 | 5.16 | 7.74 | 3.77 | 4.86 | 7.69 |
| South Africa | 17.1 | 5.94 | 7.51 | 11.26 | 5.49 | 7.08 | 11.20 |
| Fluoride | |||||||
| Country | Daily water consumption (WC) per kg of body weight L/kg [70] | ||||||
| Infants (<1 year) 0.044 | Children (1 to 10 years) 0.036 | ||||||
| Average weight (W) in kg of children aged six months to 5 years for boys and girls [71] | |||||||
| Boys | Girls | ||||||
| Six months | Two Years | Five Years | Six months | Two Years | Five Years | ||
| 7.9 Exposure Level (mg) 0.52 * | 12.2 Exposure Level (mg) 0.65 * | 18.3 Exposure Level (mg) 0.98 * | 7.3 Exposure Level (mg) 0.48 * | 11.5 Exposure Level (mg) 0.62 * | 18.2 Exposure Level (mg) 0.98 * | ||
| * Value calculated considering the maximum exposure limit for fluoride according to WHO—(1.5 mg/L) | |||||||
| Maximum arsenic concentration found per country (C) mg/L | Amount (A) (µg) of arsenic in the infant’s and child’s body based on water consumption by age, weight and sex. A = C × WC × W | ||||||
| India | 1.792 | 0.62 | 0.78 | 1.18 | 0.57 | 0.74 | 1.17 |
| Pakistan | 30 | 10.42 | 13.17 | 19.76 | 9.636 | 12.42 | 19.65 |
| Saudi Arabia | 4.6 | 1.59 | 2.02 | 3.03 | 1.47 | 1.90 | 3.01 |
3.4. Daily and Annual Potential Exposure
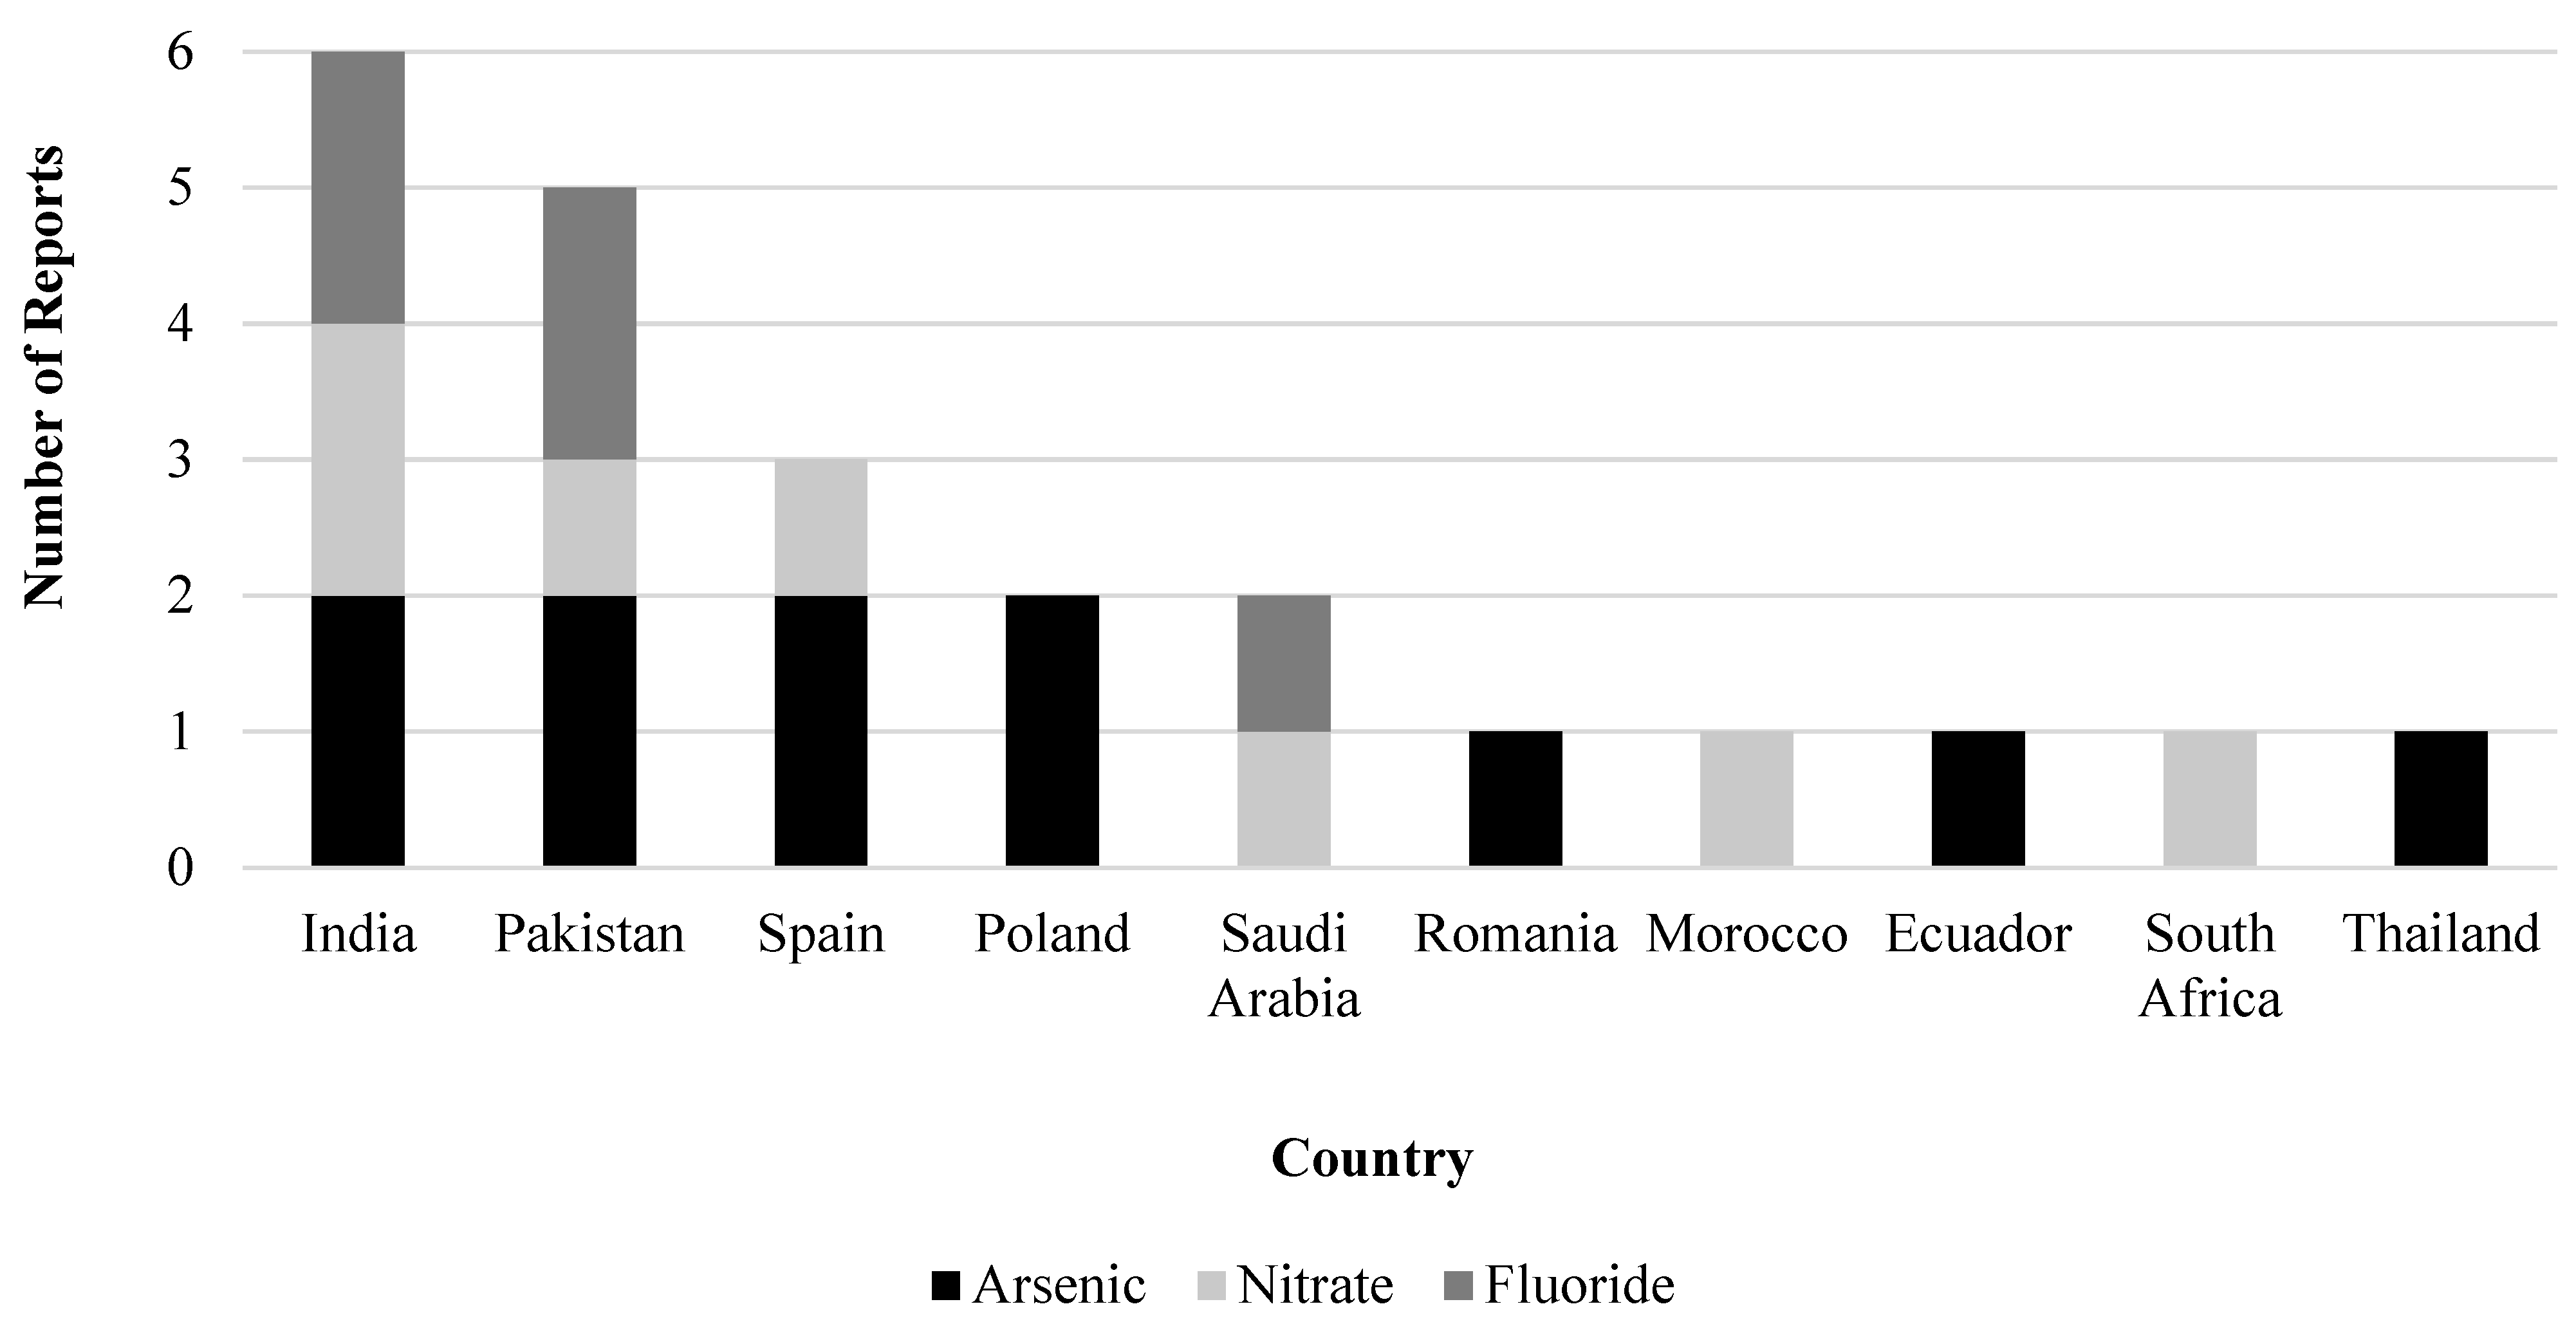
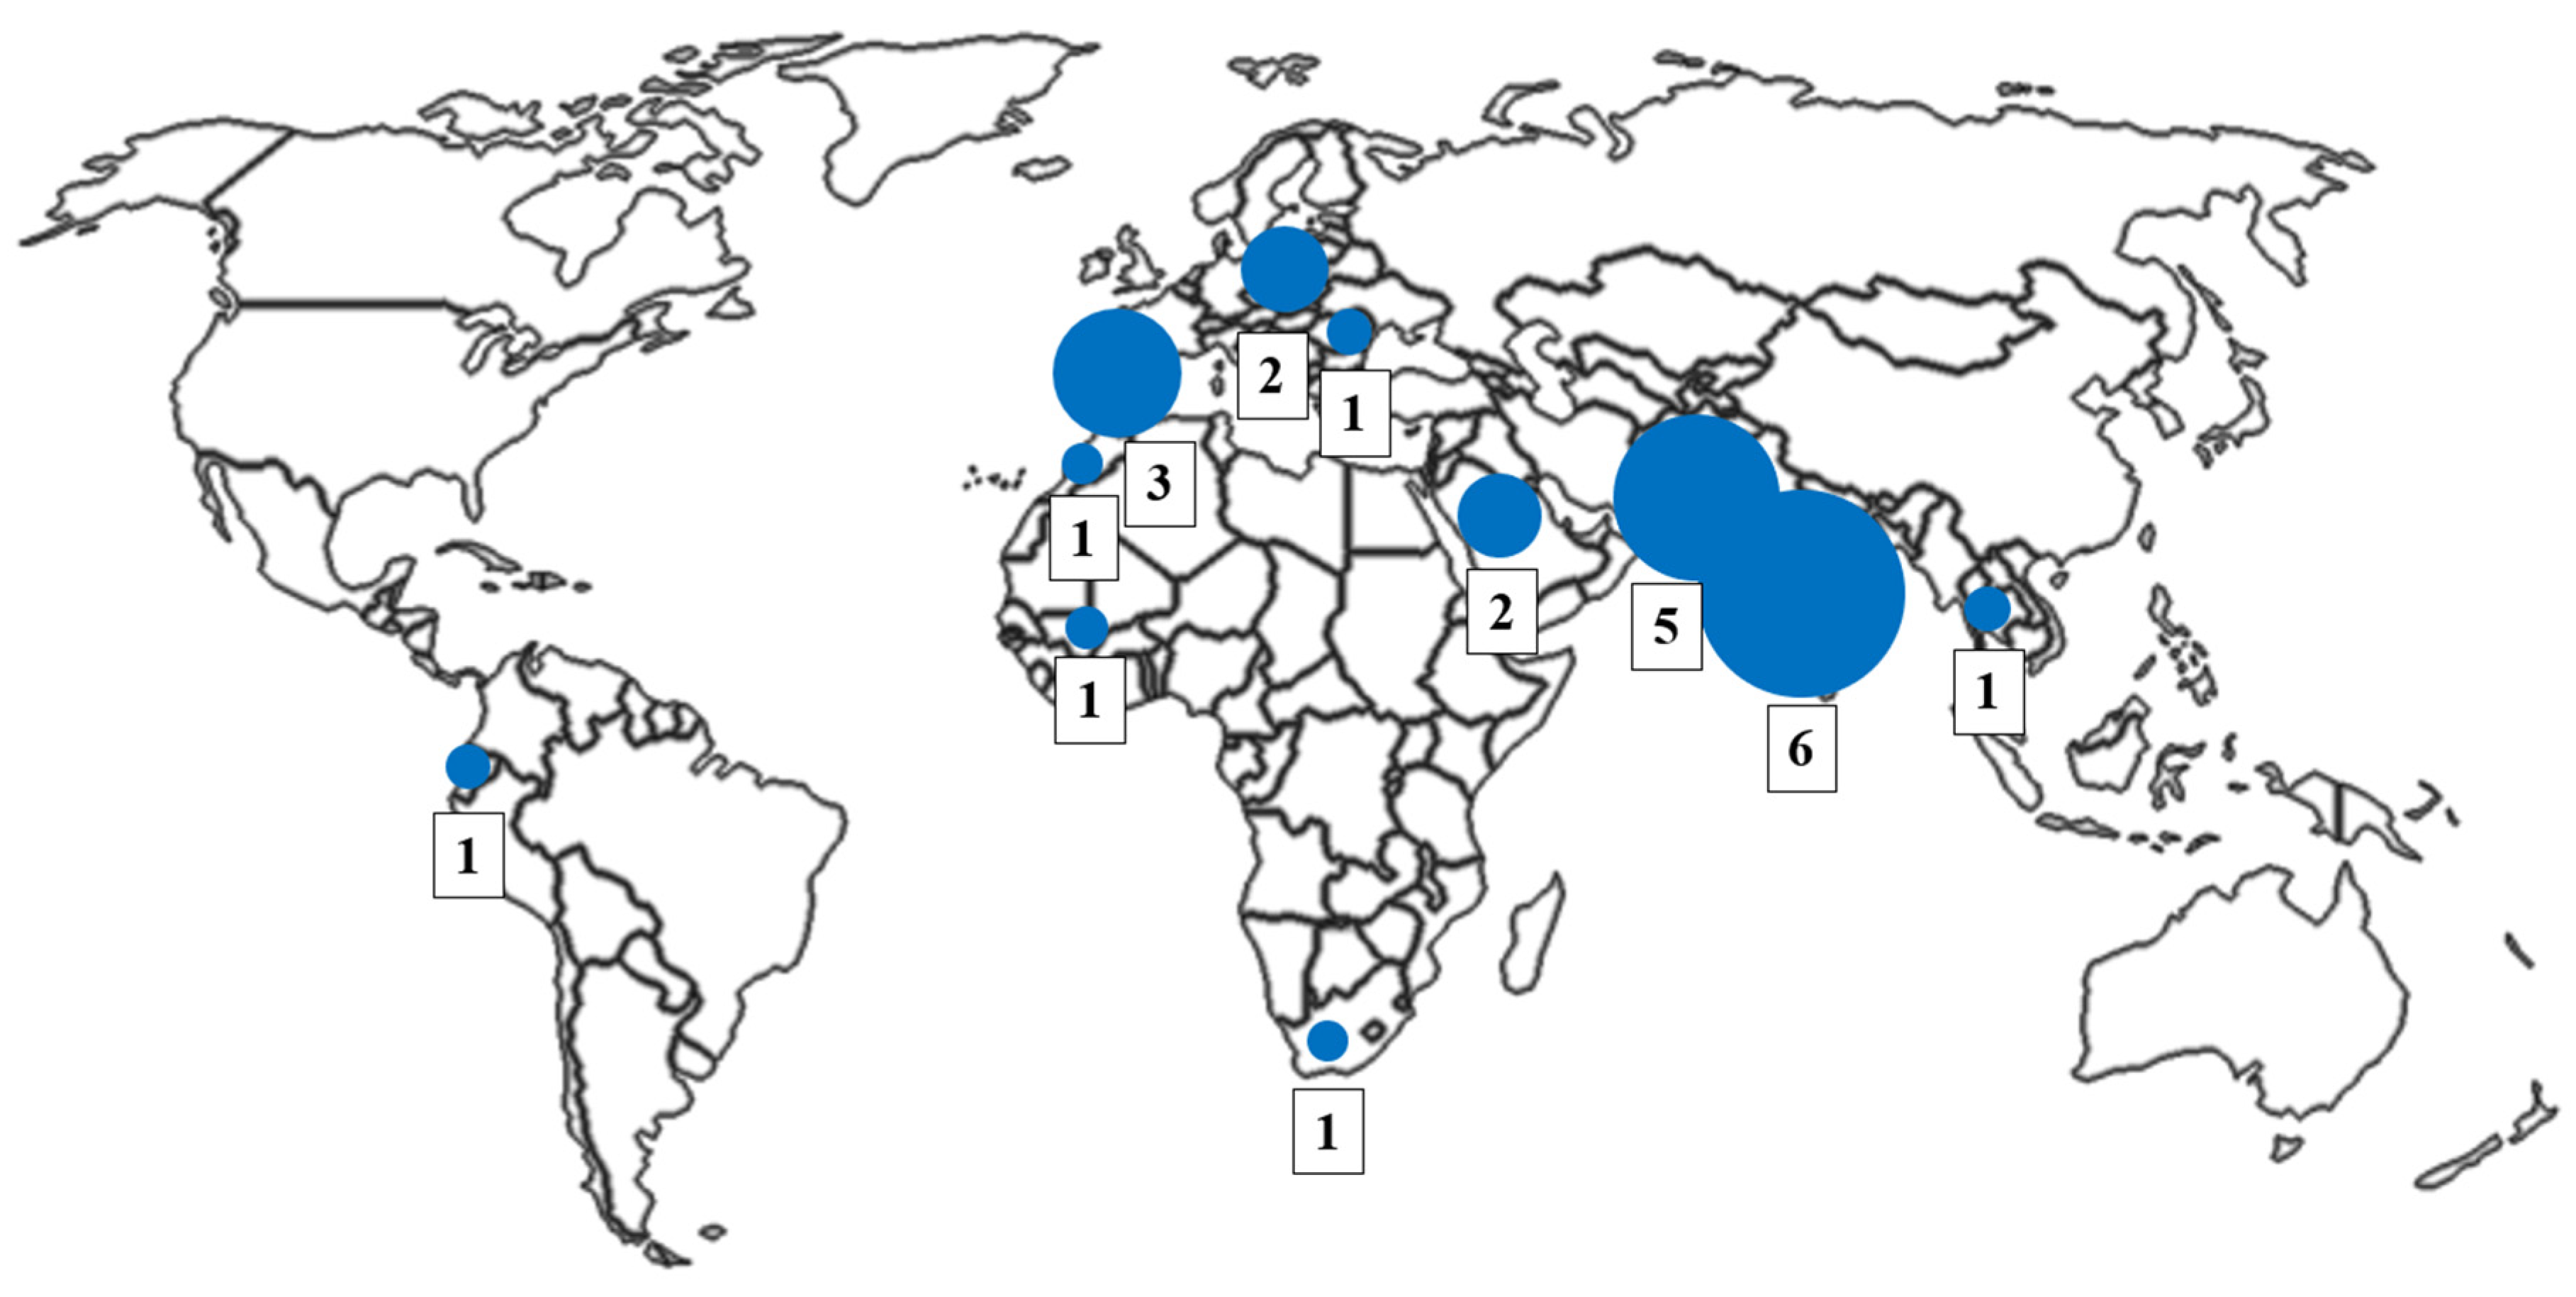
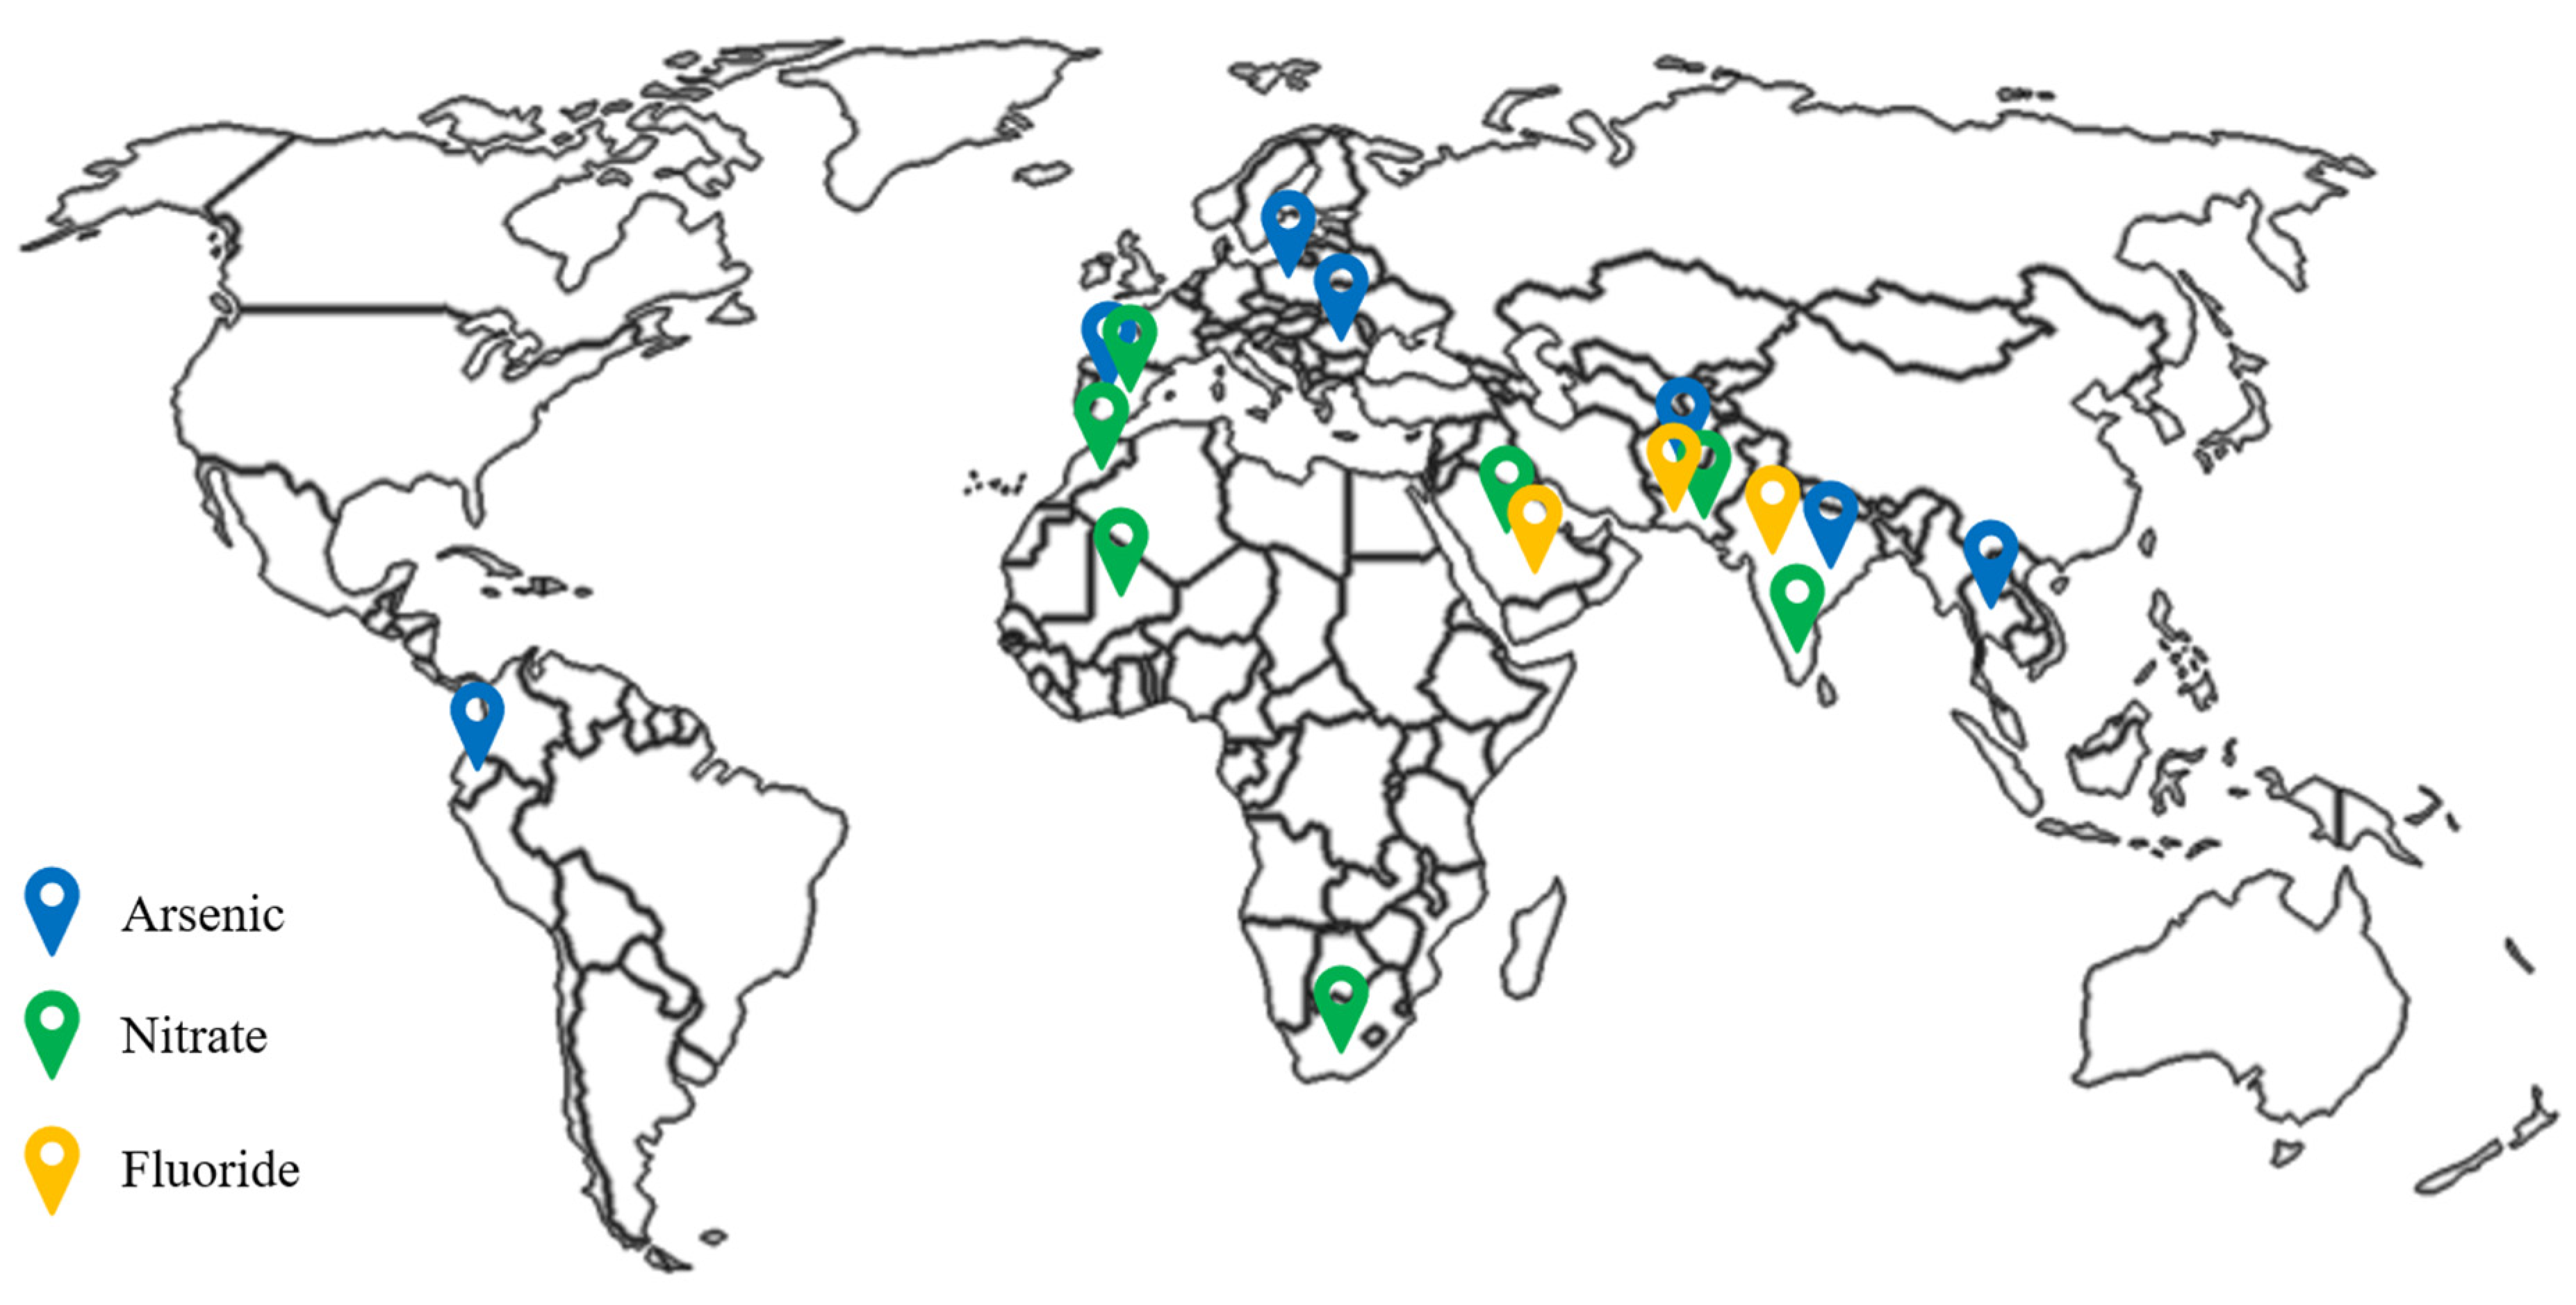
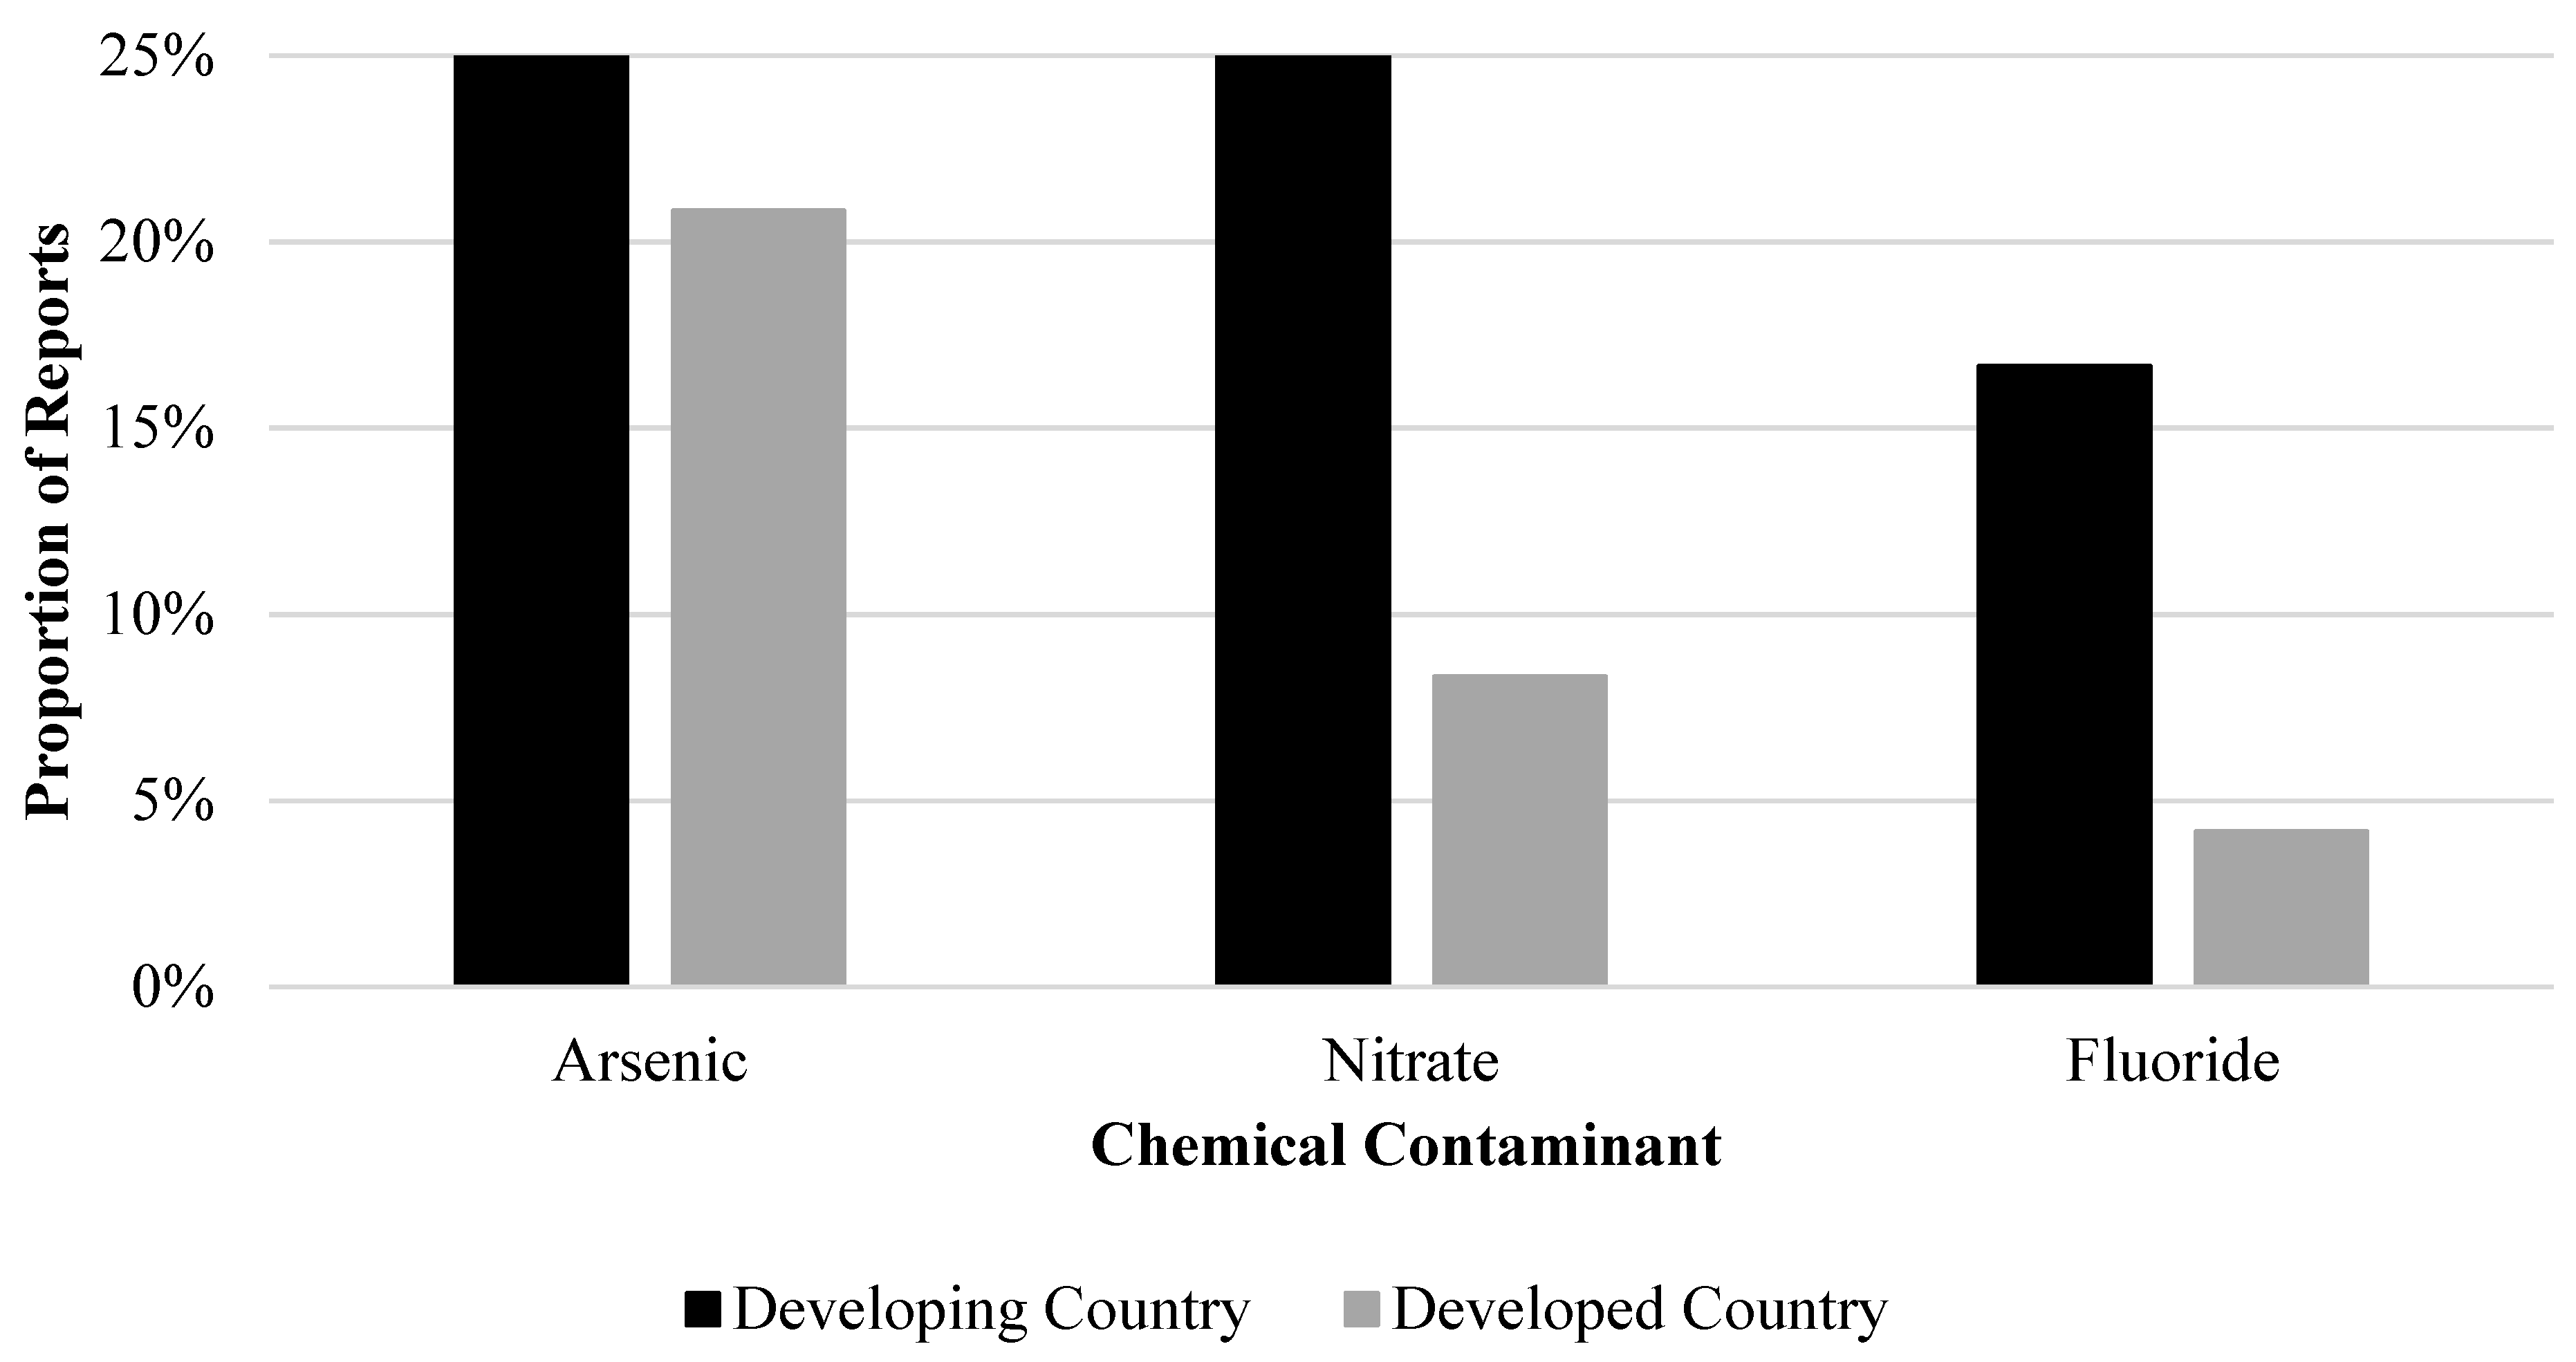
3.5. Regional Distribution of Contamination
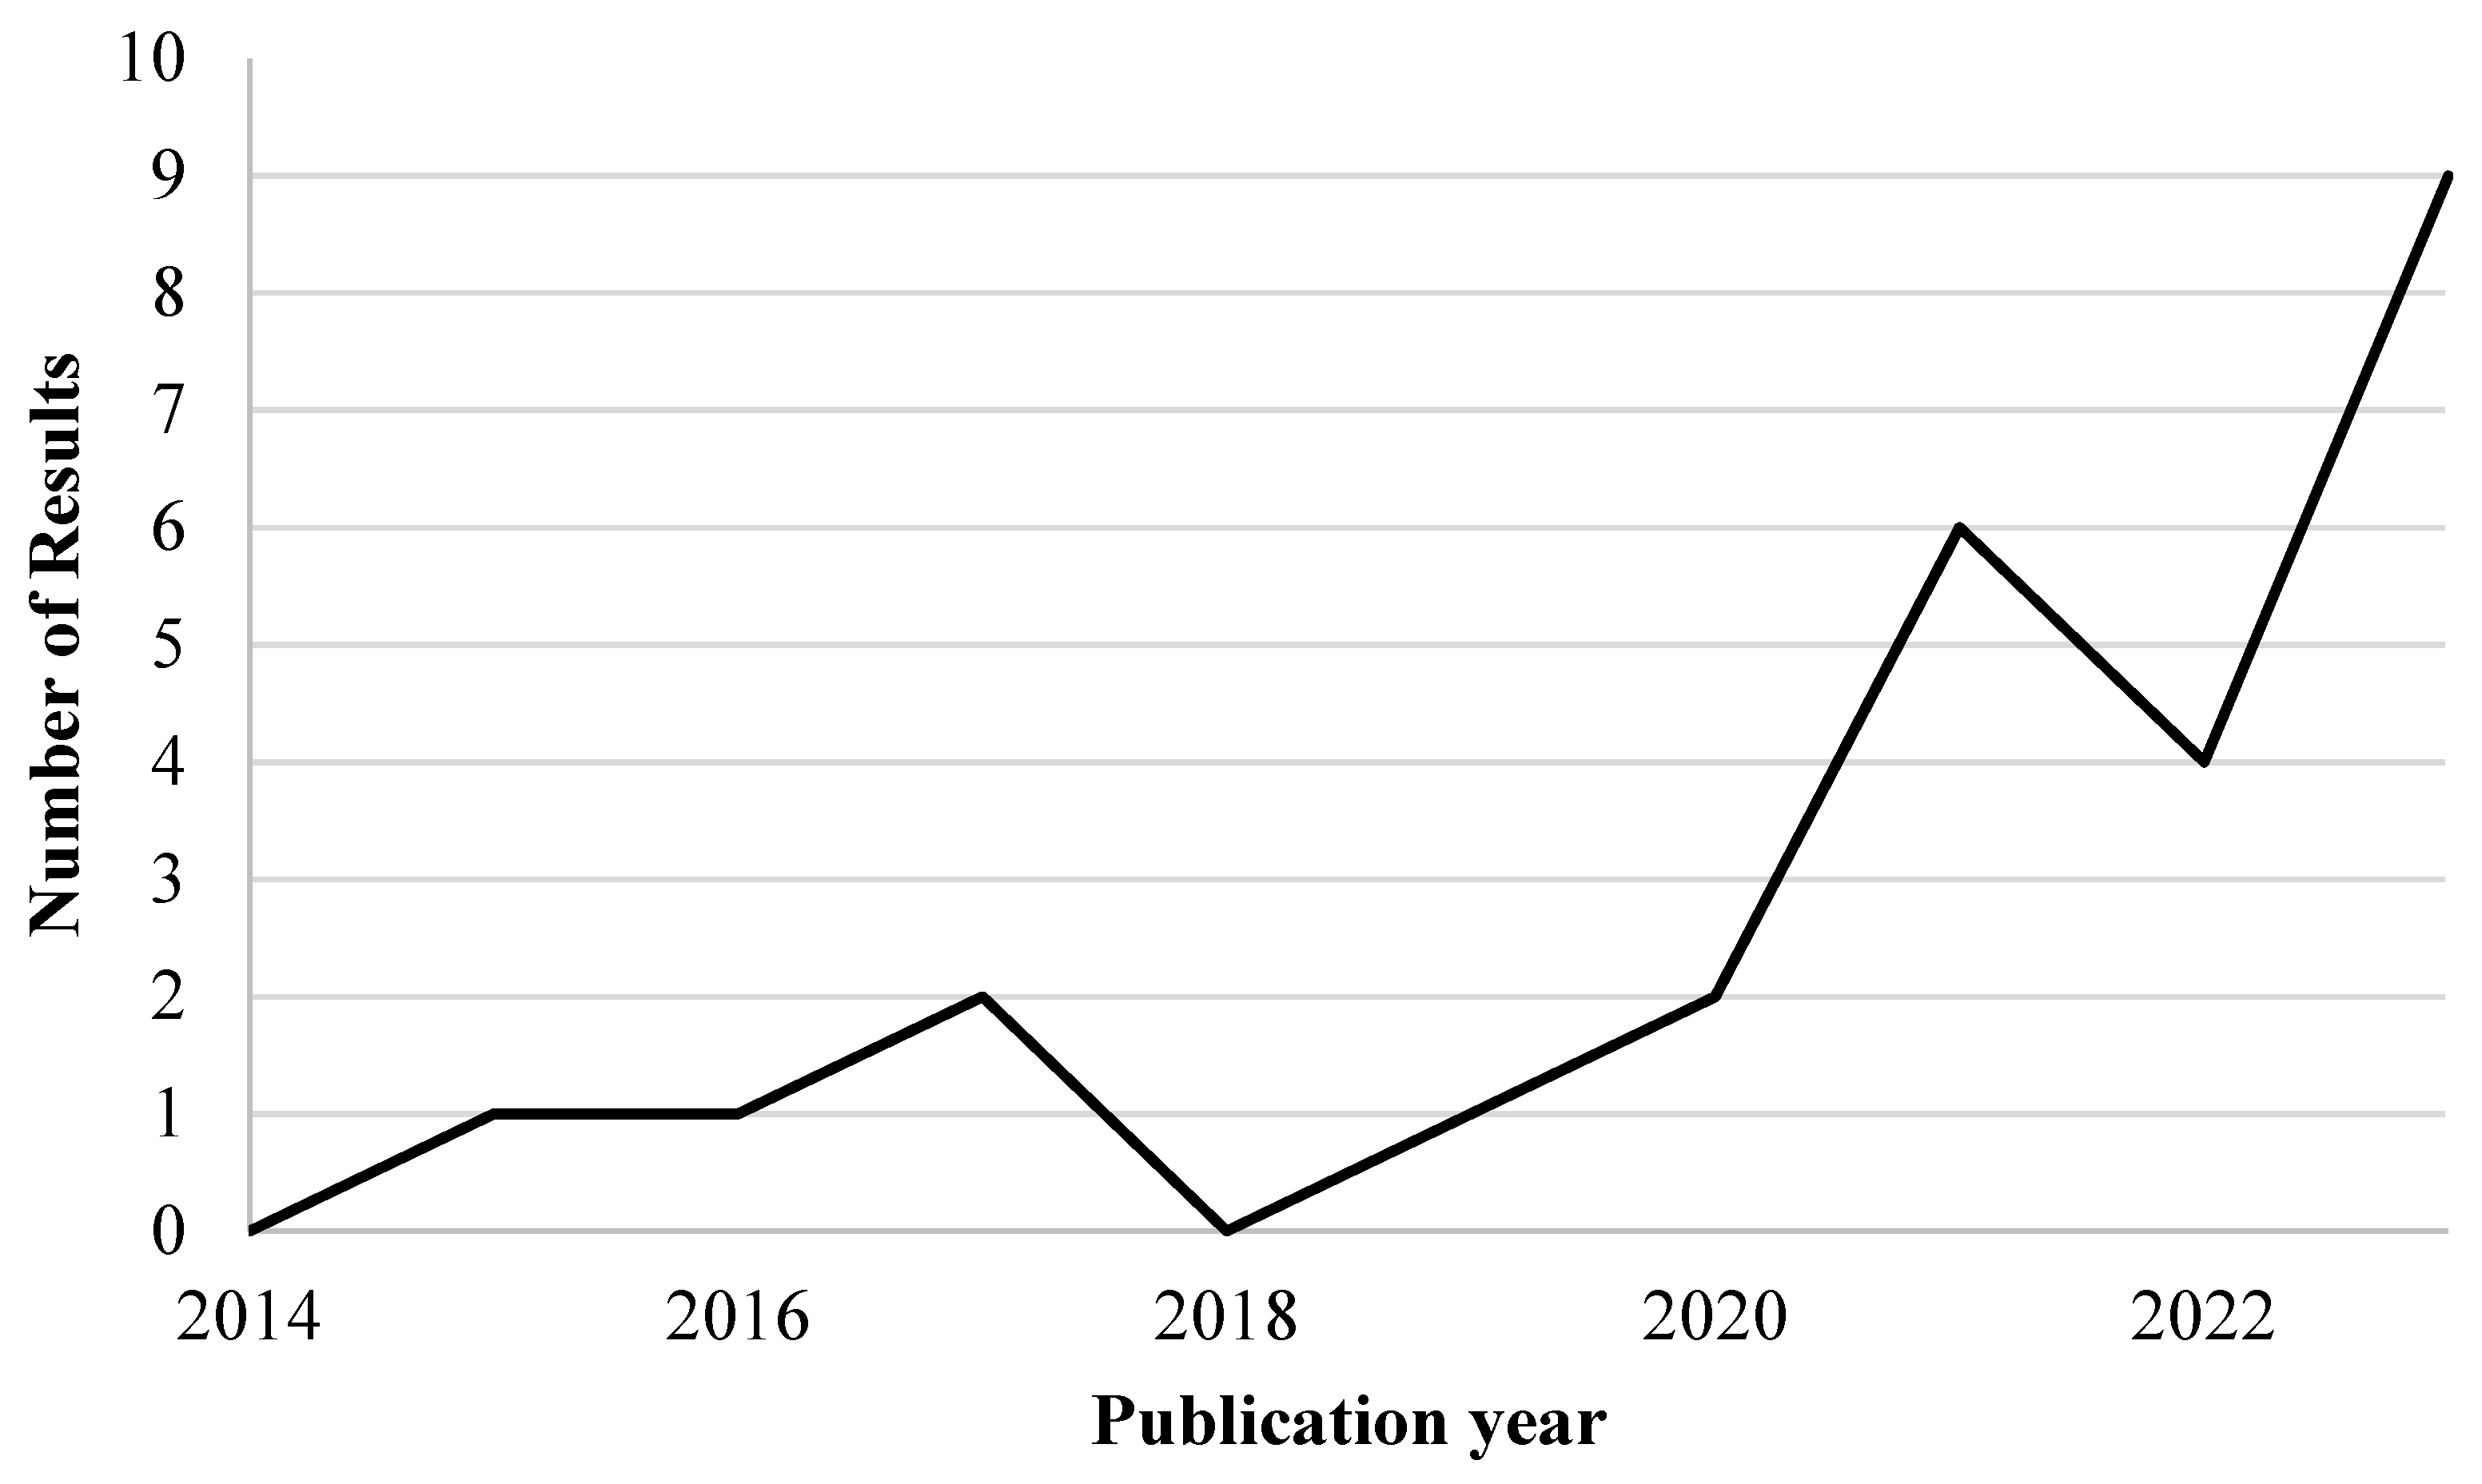
3.6. Research Trend
3.7. Causes of Contamination
3.8. Impact on Human Health
4. Future Perspectives
5. Conclusions
Author Contributions
Funding
Data Availability Statement
Conflicts of Interest
Appendix A
| Chemical | Characteristic * | Maximum Value | ||
|---|---|---|---|---|
| Day | Year | |||
| Arsenic (µg) | Romania | |||
| Age Group | Infants (<1 year) | 39.35 | 14,362.97 | |
| Children (1 to 10 years) | 95.90 | 35,003.79 | ||
| Teenagers (11 to 19 years) | 125.74 | 45,894.92 | ||
| Adults (20 to 64 years) | 177.99 | 64,966.28 | ||
| Adults (≥65 years) | 190.11 | 69,389.31 | ||
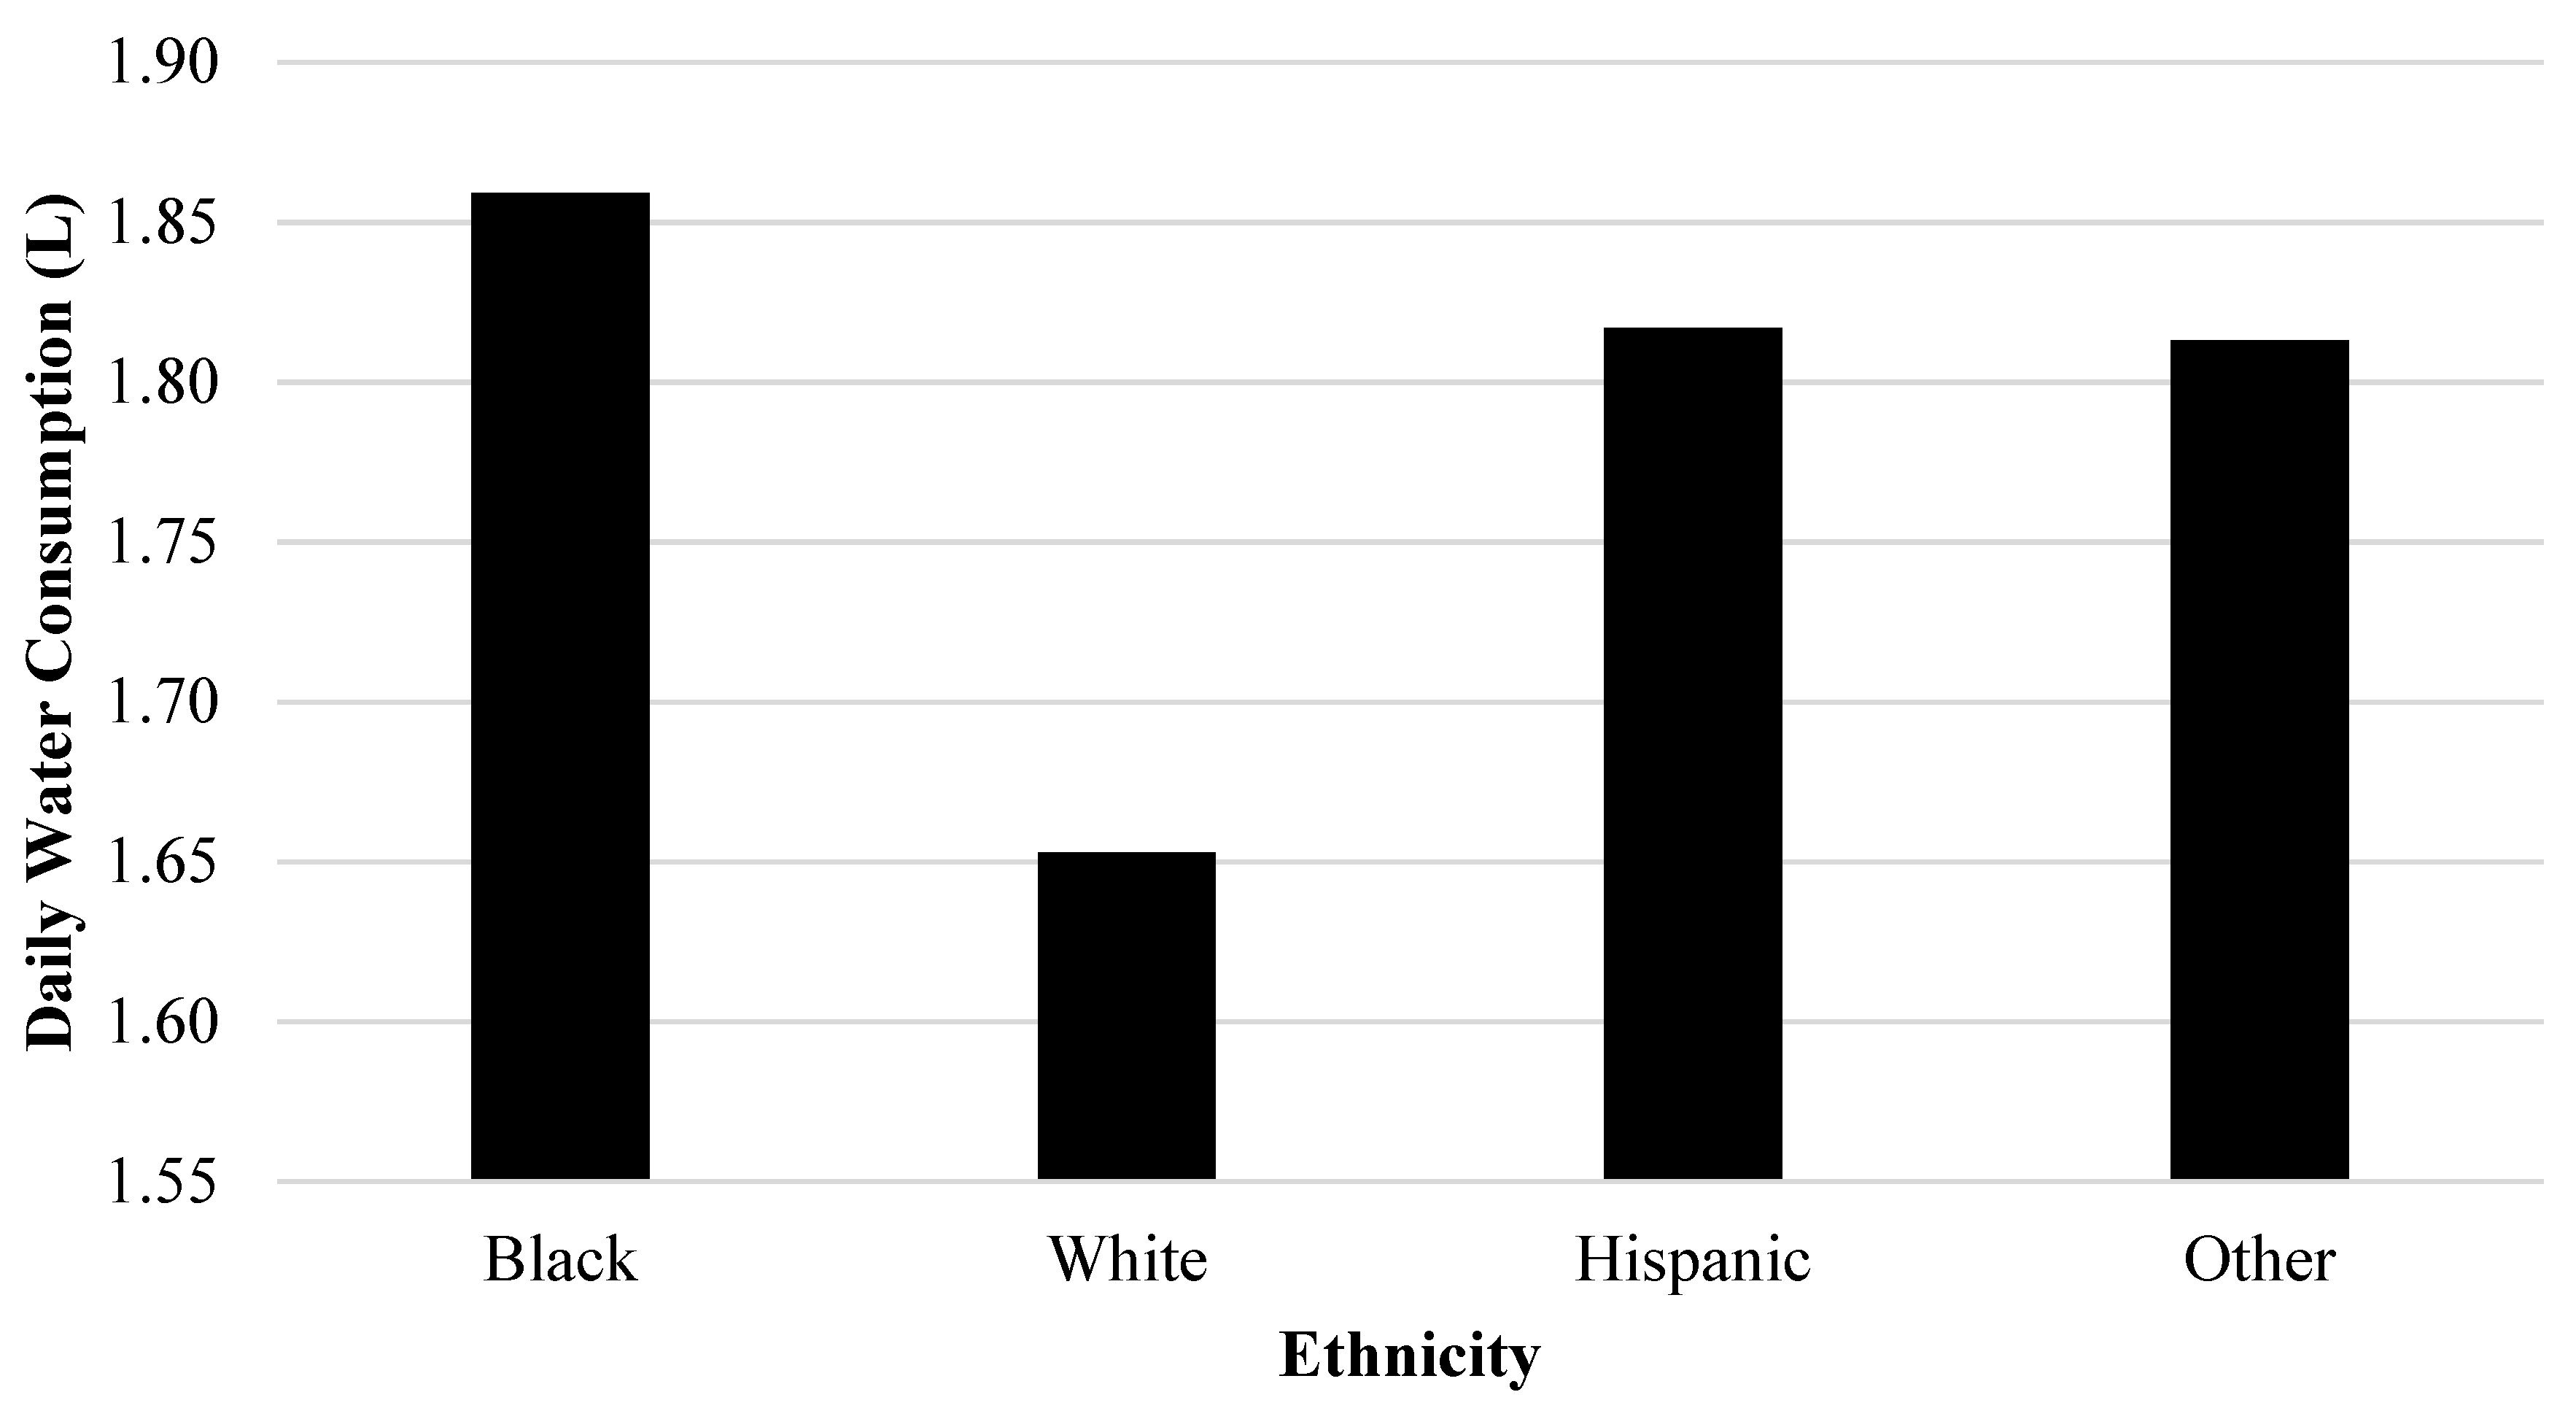
| Ethnicity | Black | 242.23 | 88,413.11 | |
| White | 215.39 | 78,615.85 | ||
| Hispanic | 236.76 | 86,415.61 | ||
| Other | 236.23 | 86,225.37 | ||
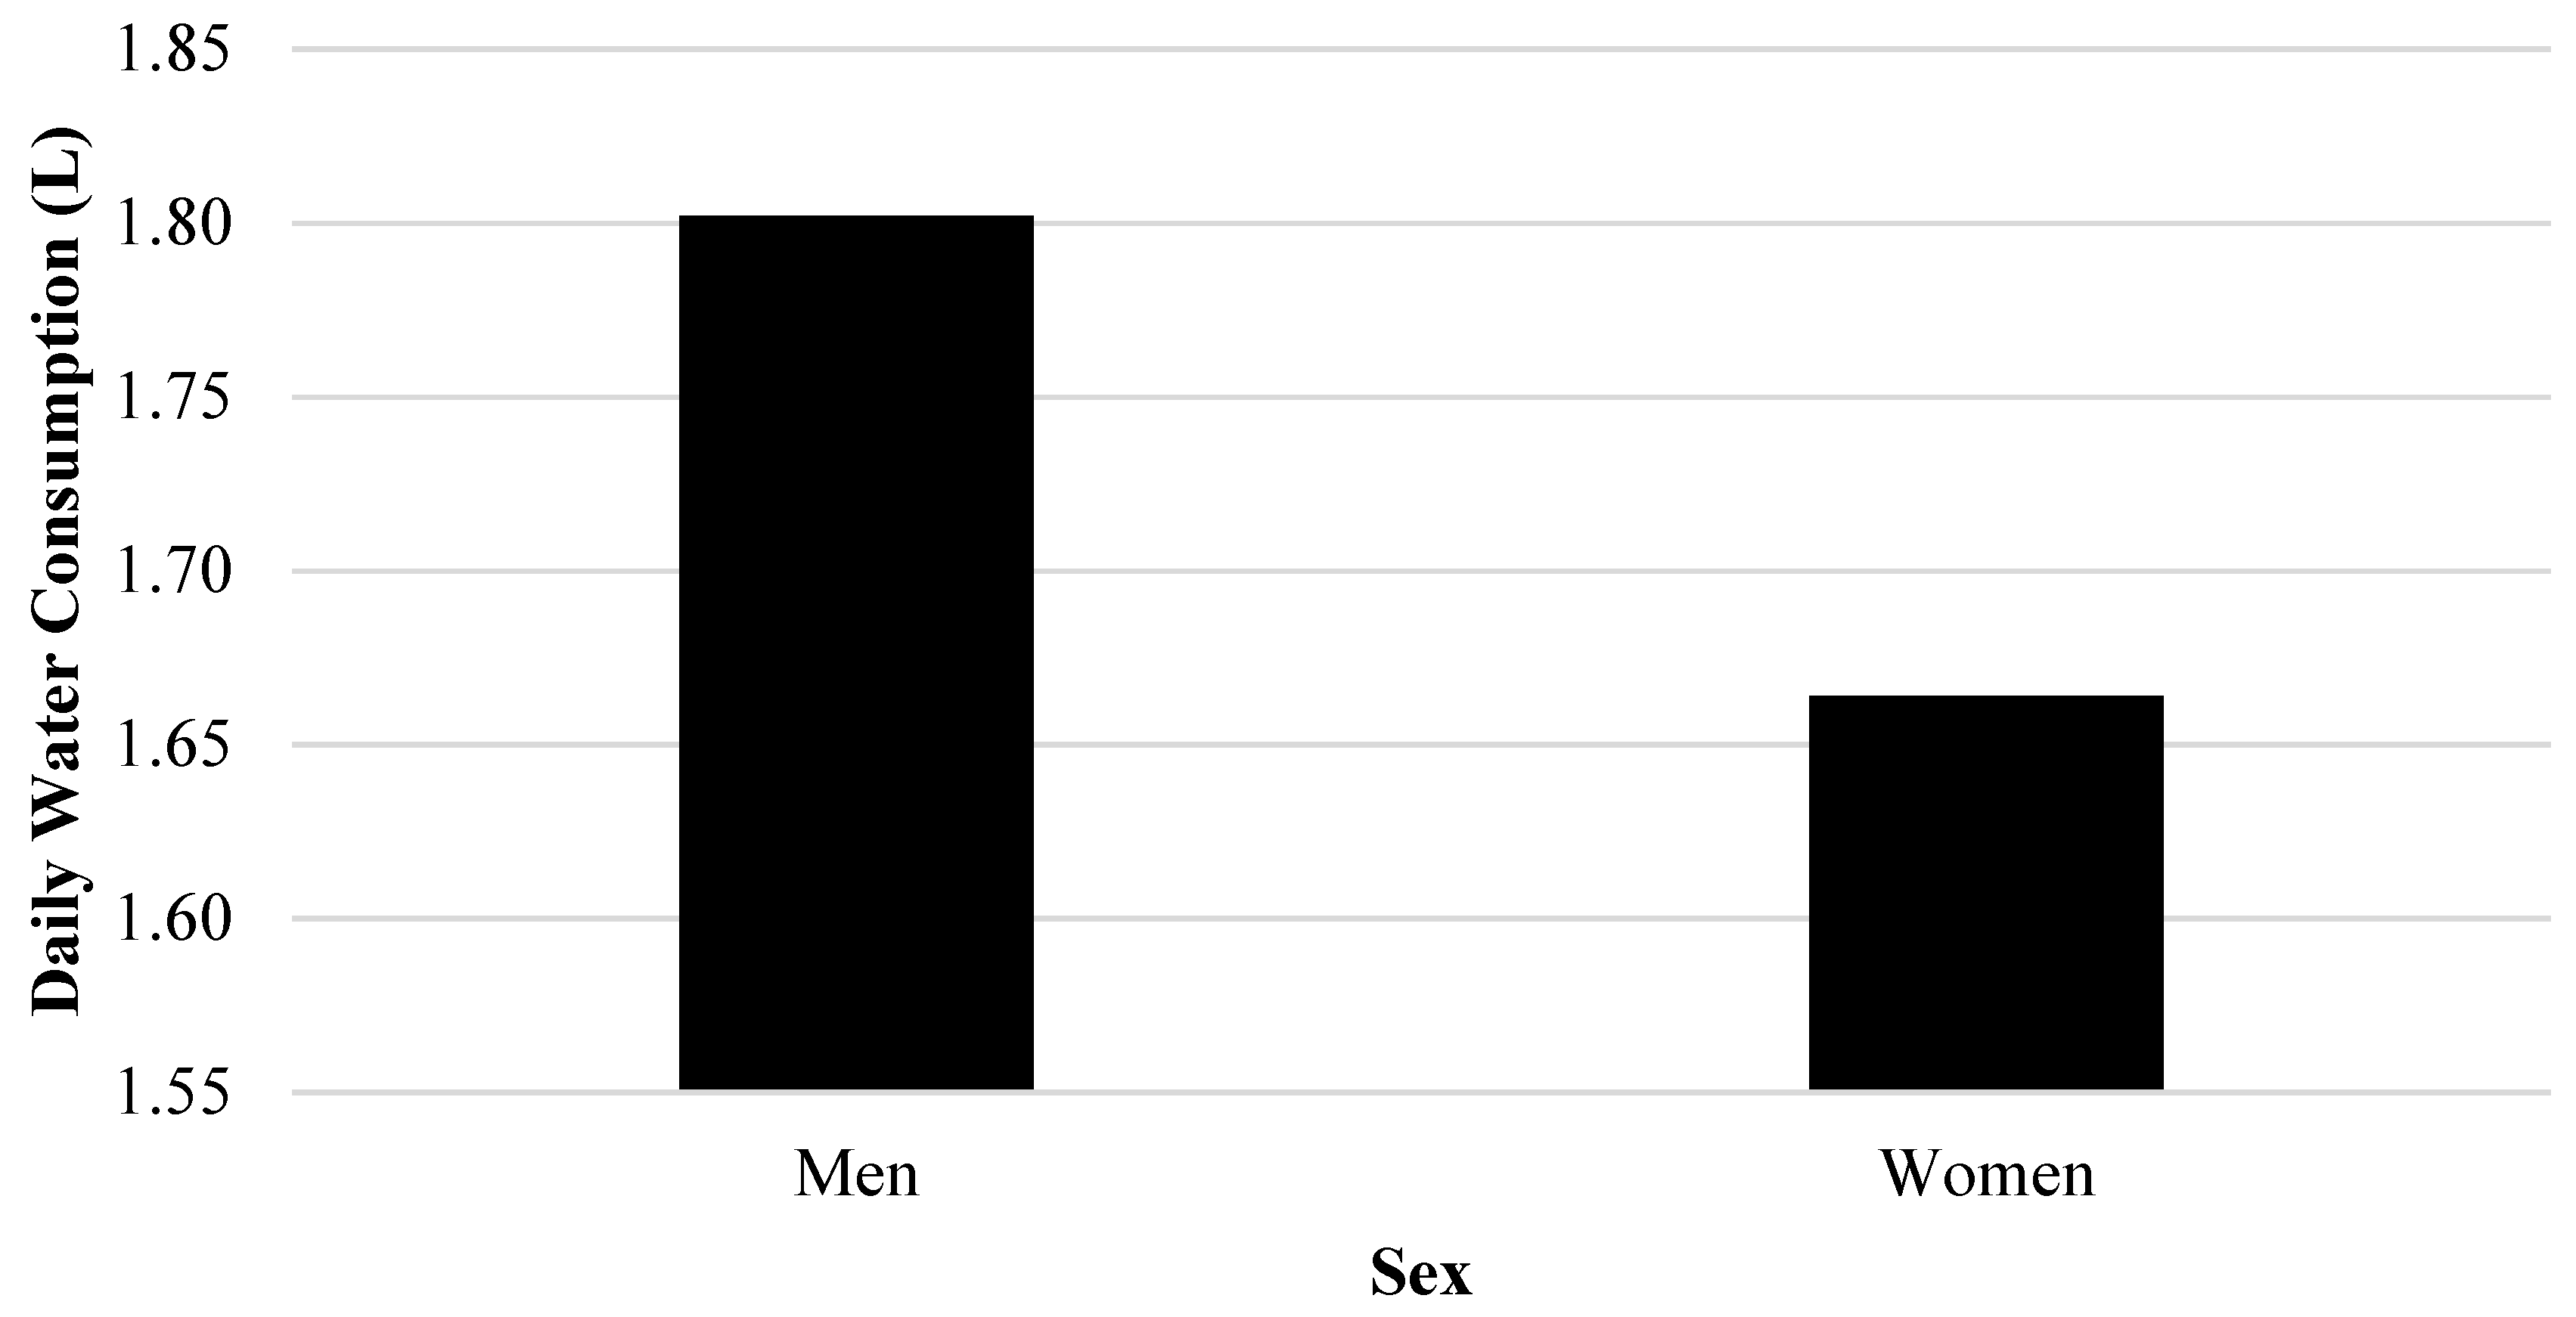
| Sex | Men | 234.80 | 85,702.22 | |
| Women | 216.82 | 79,139.01 | ||
| Nitrate (mg) | India | |||
| Age Group | Infants (<1 year) | 254.89 | 93,034.12 | |
| Children (1 to 10 years) | 621.18 | 226,732.16 | ||
| Teenagers (11 to 19 years) | 814.46 | 297,277.90 | ||
| Adults (20 to 64 years) | 1152.90 | 420,809.96 | ||
| Adults (≥65 years) | 1231.40 | 449,459.54 | ||
| Ethnicity | Black | 1395.13 | 509,223.18 | |
| White | 1569.00 | 572,683.54 | ||
| Hispanic | 1533.55 | 559,745.02 | ||
| Other | 1530.17 | 558,512.78 | ||
| Sex | Men | 1520.89 | 555,124.12 | |
| Women | 1404.42 | 512,611.84 | ||
| Fluoride (mg) | Pakistan | |||
| Age Group | Infants (<1 year) | 8.91 | 3251.79 | |
| Children (1 to 10 years) | 21.71 | 7924.88 | ||
| Teenagers (11 to 19 years) | 28.47 | 10,390.64 | ||
| Adults (20 to 64 years) | 40.30 | 14,708.41 | ||
| Adults (≥65 years) | 43.04 | 15,709.78 | ||
| Ethnicity | Black | 48.76 | 17,798.68 | |
| White | 54.84 | 20,016.78 | ||
| Hispanic | 53.60 | 19,564.55 | ||
| Other | 53.48 | 19,521.48 | ||
| Sex | Men | 53.16 | 19,403.04 | |
| Women | 49.09 | 17,917.12 | ||
References
- OHCHR. United Nations about Water and Sanitation; OHCHR: Geneva, Switzerland, 2024; pp. 6–9. [Google Scholar]
- Vereinte Nationen; Weltgesundheitsorganisation. The Human Rights to Water and Sanitation in Practice: Findings and Lessons Learned from the Work on Equitable Access to Water and Sanitation under the Protocol on Water and Health in the Pan-European Region; United Nations Economic Commission for Europe: Geneva, Switzerland, 2019; ISBN 978-92-1-117226-3. [Google Scholar]
- Scanlon, B.R.; Fakhreddine, S.; Reedy, R.C.; Yang, Q.; Malito, J.G. Drivers of Spatiotemporal Variability in Drinking Water Quality in the United States. Environ. Sci. Technol. 2022, 56, 12965–12974. [Google Scholar] [CrossRef] [PubMed]
- World Health Organization. Guidelines for Drinking-Water Quality Fourth Edition Incorporating the First Addendum; WHO: Geneva, Switzerland, 2017. [Google Scholar]
- Groundwater Uses and Benefits|UN World Water Development Report 2022. Available online: https://www.unesco.org/reports/wwdr/2022/en/benefits (accessed on 7 March 2024).
- Types of Drinking Water Contaminants|US EPA. Available online: https://www.epa.gov/ccl/types-drinking-water-contaminants (accessed on 3 March 2024).
- Amrose, S.; Cherukumilli, K.; Wright, N.C. Chemical Contamination of Drinking Water in Resource-Constrained Settings: Global Prevalence and Piloted Mitigation Strategies. Annu. Rev. Environ. Resour. 2020, 45, 195–226. [Google Scholar] [CrossRef]
- Badeenezhad, A.; Abbasi, F.; Shahsavani, S. Performance of Household Water Desalinations Devices and Health Risks Assessment of Fluorides (F−) and Nitrate (NO3−) in Input and Output Water of the Devices in Behbahan City Southwest Iran. Hum. Ecol. Risk Assess. 2019, 25, 217–229. [Google Scholar] [CrossRef]
- Pichel, N.; Hymnô De Souza, F.; Sabogal-Paz, L.P.; Shah, P.K.; Adhikari, N.; Pandey, S.; Shrestha, B.M.; Gaihre, S.; Pineda-Marulanda, D.A.; Hincapie, M.; et al. Field-Testing Solutions for Drinking Water Quality Monitoring in Low- and Middle-Income Regions and Case Studies from Latin American, African and Asian Countries. J. Environ. Chem. Eng. 2023, 11, 111180. [Google Scholar] [CrossRef]
- Saha, N.; Rahman, M.S.; Ahmed, M.B.; Zhou, J.L.; Ngo, H.H.; Guo, W. Industrial Metal Pollution in Water and Probabilistic Assessment of Human Health Risk. J. Environ. Manag. 2017, 185, 70–78. [Google Scholar] [CrossRef]
- Al-Sulaiman, S.A.A.-W. Chemical Safety of Drinking-Water: Assessing Priorities for Risk Management. Int. J. Environ. Stud. 2012, 69, 1001. [Google Scholar] [CrossRef]
- Akhtar, N.; Syakir Ishak, M.I.; Bhawani, S.A.; Umar, K. Various Natural and Anthropogenic Factors Responsible for Water Quality Degradation: A Review. Water 2021, 13, 2660. [Google Scholar] [CrossRef]
- Fuller, R.; Landrigan, P.J.; Balakrishnan, K.; Bathan, G.; Bose-O’Reilly, S.; Brauer, M.; Caravanos, J.; Chiles, T.; Cohen, A.; Corra, L.; et al. Pollution and Health: A Progress Update. Lancet Planet. Health 2022, 6, e535–e547. [Google Scholar] [CrossRef]
- Santos, T. The Great Detox—Largest Ever Ban of Toxic Chemicals Announced by EU. Available online: https://meta.eeb.org/2022/04/28/the-great-detox-largest-ever-ban-of-toxic-chemicals-announced-by-eu/ (accessed on 5 March 2024).
- Murphy, E.A.; Post, G.B.; Buckley, B.T.; Lippincott, R.L.; Robson, M.G. Future Challenges to Protecting Public Health from Drinking-Water Contaminants. Annu. Rev. Public Health 2012, 33, 209–224. [Google Scholar] [CrossRef]
- Vineis, P.; Xun, W. The Emerging Epidemic of Environmental Cancers in Developing Countries. Ann. Oncol. 2009, 20, 205–212. [Google Scholar] [CrossRef] [PubMed]
- Aswal, R.S.; Prasad, M.; Patel, N.K.; Srivastav, A.L.; Egbueri, J.C.; Kumar, G.A.; Ramola, R.C. Occurrences, Sources and Health Hazard Estimation of Potentially Toxic Elements in the Groundwater of Garhwal Himalaya, India. Sci Rep 2023, 13, 13069. [Google Scholar] [CrossRef] [PubMed]
- Dettori, M.; Arghittu, A.; Deiana, G.; Castiglia, P.; Azara, A. The Revised European Directive 2020/2184 on the Quality of Water Intended for Human Consumption. A Step Forward in Risk Assessment, Consumer Safety and Informative Communication. Environ. Res. 2022, 209, 112773. [Google Scholar] [CrossRef] [PubMed]
- Li, F. Drinking Water Quality Introduction and Foreword. Water Quality Testing, 10 September 2021. [Google Scholar]
- Selwe, K.P.; Thorn, J.P.R.; Desrousseaux, A.O.S.; Dessent, C.E.H.; Sallach, J.B. Emerging Contaminant Exposure to Aquatic Systems in the Southern African Development Community. Environ. Toxicol. Chem. 2022, 41, 382–395. [Google Scholar] [CrossRef] [PubMed]
- Rossiter, H.M.; Owusu, P.A.; Awuah, E.; Macdonald, A.M.; Schäfer, A.I. Chemical drinking water quality in Ghana: Water costs and scope for advanced treatment. Sci. Total Environ. 2010, 408, 2378–2386. [Google Scholar] [CrossRef] [PubMed]
- Zhang, Y.; Geißen, S.U.; Gal, C. Carbamazepine and Diclofenac: Removal in Wastewater Treatment Plants and Occurrence in Water Bodies. Chemosphere 2008, 73, 1151–1161. [Google Scholar] [CrossRef] [PubMed]
- Miklos, D.B.; Hartl, R.; Michel, P.; Linden, K.G.; Drewes, J.E.; Hübner, U. UV/H2O2 Process Stability and Pilot-Scale Validation for Trace Organic Chemical Removal from Wastewater Treatment Plant Effluents. Water Res. 2018, 136, 169–179. [Google Scholar] [CrossRef]
- Tang, Y.; Lee, C.S.; Walker, H.; Gobler, C.; Apul, O.; Venkatesan, A.K.; Mao, X. Effect of Residual H2O2 on the Removal of Advanced Oxidation Byproducts by Two Types of Granular Activated Carbon. J. Environ. Chem. Eng. 2021, 9, 106838. [Google Scholar] [CrossRef]
- Mercy, M.; Mkangombe, K.F.; Yongji, P.Z. Water Availability, Quality and Treatment Methods In Malawi: A Review. Int. J. Sci. Res. Publ. 2021, 11, 542–553. [Google Scholar] [CrossRef]
- Islam, M.R.; Islam, M.S.; Akter, J.; Sultana, T. The Studies of Environmental Load and Consequences of Leather Industrial Effluents in Bangladesh. J. Environ. Impact Manag. Policy 2023, 3, 1–14. [Google Scholar] [CrossRef]
- Mitchell, E.J.; Frisbie, S.H. A Comprehensive Survey and Analysis of International Drinking Water Regulations for Inorganic Chemicals with Comparisons to the World Health Organization’s Drinking-Water Guidelines; WHO: Geneva, Switzerland, 2023; Volume 18. [Google Scholar]
- Kayser, G.L.; Amjad, U.; Dalcanale, F.; Bartram, J.; Bentley, M.E. Drinking Water Quality Governance: A Comparative Case Study of Brazil, Ecuador, and Malawi. Environ. Sci. Policy 2015, 48, 186–195. [Google Scholar] [CrossRef]
- UN-WATER Transboundary Waters: Sharing Benefits, Sharing Responsibilities. Available online: https://www.un.org/waterforlifedecade/transboundary_waters.shtml (accessed on 2 March 2024).
- Transboundary Waters|UN-Water. Available online: https://www.unwater.org/water-facts/transboundary-waters (accessed on 2 March 2024).
- Gebreluel, G. Ethiopia’s Grand Renaissance Dam: Ending Africa’s Oldest Geopolitical Rivalry? Wash. Q. 2014, 37, 25–37. [Google Scholar] [CrossRef]
- Chimtali, P.J.; Ngumbira, K.S.; Mguntha, T.T. Physico-Chemical Quality of Bottled Drinking Water Sold in Zomba City, Malawi. Malays. J. Sci. Health Technol. 2023, 9, 120–127. [Google Scholar] [CrossRef]
- Brika, B.; Dévora-Isiordia, G.E.; Alturki, E. Chemical Composition of Selected Brands of Bottled Water Commercilaized in Tripoli, Libya. Environ. Sci. Proc. 2022, 21, 48. [Google Scholar] [CrossRef]
- Singh, M.; Parihar, D.S.; Rawat, J.S. Analysis of Water Quality Status of the Upper Kosi River of Central Himalaya. India Artic. Int. J. Sci. Res. 2021, 10, 1262–1266. [Google Scholar]
- Pramanik, A.K.; Das, S.K.; Chatterjee, A. A Study on Groundwater Quality Based on Major Ion Chemistry of Jharkhand State in India: A Review. Orient. J. Chem. 2021, 37, 962–971. [Google Scholar] [CrossRef]
- Schaider, L.A.; Swetschinski, L.; Campbell, C.; Rudel, R.A. Environmental Justice and Drinking Water Quality: Are There Socioeconomic Disparities in Nitrate Levels in U.S. Drinking Water? Environ. Health 2019, 18, 3. [Google Scholar] [CrossRef]
- Hyde, K. The Regressive Costs of Drinking Water Contaminant Avoidance. SSRN Electron. J. 2022, 1–23. [Google Scholar] [CrossRef]
- Michielssen, S.; Vedrin, M.C.; Guikema, S.D. Trends in Microbiological Drinking Water Quality Violations across the United States. Environ. Sci. Water Res. Technol. 2020, 6, 3091–3105. [Google Scholar] [CrossRef]
- Scanlon, B.R.; Reedy, R.C.; Fakhreddine, S.; Yang, Q.; Pierce, G. Drinking Water Quality and Social Vulnerability Linkages at the System Level in the United States. Environ. Res. Lett. 2023, 18, 094039. [Google Scholar] [CrossRef]
- Yilkal, E.; Zewge, F.; Chandravanshi, B.S. Assessment of the Quality of Bottled Water Marketed in Addis Ababa, Ethiopia. Bull. Chem. Soc. Ethiop. 2019, 33, 21–41. [Google Scholar] [CrossRef]
- Abiodun Segun, A.; Morufu Olalekan, R. When Water Turns Deadly: Investigating Source Identification and Quality of Drinking Water in Piwoyi Community of Federal Capital Territory, Abuja Nigeria. Trends J. Sci. Res. 2021, 1, 38–58. [Google Scholar] [CrossRef]
- Page, M.J.; McKenzie, J.E.; Bossuyt, P.M.; Boutron, I.; Hoffmann, T.C.; Mulrow, C.D.; Shamseer, L.; Tetzlaff, J.M.; Akl, E.A.; Brennan, S.E.; et al. The PRISMA 2020 Statement: An Updated Guideline for Reporting Systematic Reviews. BMJ 2021, 372, n71. [Google Scholar] [CrossRef]
- Shittu, E.; Lakhanpaul, M.; Vigurs, C.; Sarkar, K.; Koch, M.; Parikh, P.; Campos, L.C. A Rapid Systematic Scoping Review of Research on the Impacts of Water Contaminated by Chemicals on Very Young Children. Sci. Total Environ. 2023, 891, 164604. [Google Scholar] [CrossRef]
- National Primary Drinking Water Regulations|US EPA. Available online: https://www.epa.gov/ground-water-and-drinking-water/national-primary-drinking-water-regulations (accessed on 20 February 2024).
- Overview, G.; Of, V.; Fmea, T.H.E.; This, A.; Anderson, B.A.; Benware, J.; Brown, L.; Caracci, K.; Cox, B.; Jordan, F.; et al. Guidelines for Drinking-Water Quality: Fourth Edition Incorporating the Firist and Second Addenda; World Health Organization: Geneva, Switzerland, 2022; Volume 21. [Google Scholar]
- Biswas, T.; Chandra Pal, S.; Saha, A.; Ruidas, D. Arsenic and Fluoride Exposure in Drinking Water Caused Human Health Risk in Coastal Groundwater Aquifers. Environ. Res. 2023, 238, 117257. [Google Scholar] [CrossRef]
- Domínguez-Álvarez, J. Capillary Electrophoresis Coupled to Electrospray Mass Spectrometry for the Determination of Organic and Inorganic Arsenic Compounds in Water Samples. Talanta 2020, 212, 120803. [Google Scholar] [CrossRef]
- Veiga-Gómez, M.; Nebot, C.; Falqué, E.; Pérez, B.; Franco, C.M.; Cepeda, A. Determination of Pharmaceuticals and Heavy Metals in Groundwater for Human and Animal Consumption and Crop Irrigation in Galicia. Food Addit. Contam. Part A Chem. Anal. Control Expo. Risk. Assess 2021, 38, 2055–2076. [Google Scholar] [CrossRef] [PubMed]
- Tomczyk, K.; Dziubanek, G.; Kowalska, A.; Szymala, I.; Łabuz-Roszak, B. Health Risk Related to Exposure to Toxic Compounds Contained in Mineral and Spring Waters. Wiad Lek 2021, 74, 1587–1594. [Google Scholar] [CrossRef]
- Lorenc, W.; Markiewicz, B.; Kruszka, D.; Kachlicki, P.; Barałkiewicz, D. Total versus Inorganic and Organic Species of As, Cr, and Sb in Flavored and Functional Drinking Waters: Analysis and Risk Assessment. Molecules 2020, 25, 1099. [Google Scholar] [CrossRef]
- Ahmad, S.; Imran, M.; Murtaza, B.; Natasha; Arshad, M.; Nawaz, R.; Waheed, A.; Hammad, H.M.; Naeem, M.A.; Shahid, M.; et al. Hydrogeochemical and Health Risk Investigation of Potentially Toxic Elements in Groundwater along River Sutlej Floodplain in Punjab, Pakistan. Environ. Geochem. Health 2021, 43, 5195–5209. [Google Scholar] [CrossRef]
- Iqbal, Z.; Imran, M.; Natasha; Rahman, G.; Miandad, M.; Shahid, M.; Murtaza, B. Spatial Distribution, Health Risk Assessment, and Public Perception of Groundwater in Bahawalnagar, Punjab, Pakistan: A Multivariate Analysis. Environ. Geochem. Health 2023, 45, 381–391. [Google Scholar] [CrossRef]
- Wongsasuluk, P.; Chotpantarat, S.; Siriwong, W.; Robson, M. Human Biomarkers Associated with Low Concentrations of Arsenic (As) and Lead (Pb) in Groundwater in Agricultural Areas of Thailand. Sci. Rep. 2021, 11, 13896. [Google Scholar] [CrossRef] [PubMed]
- Bloom, M.S.; Neamtiu, I.A.; Surdu, S.; Pop, C.; Anastasiu, D.; Appleton, A.A.; Fitzgerald, E.F.; Gurzau, E.S. Low Level Arsenic Contaminated Water Consumption and Birth Outcomes in Romania—An Exploratory Study. Reprod. Toxicol. 2016, 59, 8–16. [Google Scholar] [CrossRef] [PubMed]
- Jiménez-Oyola, S.; Valverde-Armas, P.E.; Romero-Crespo, P.; Capa, D.; Valdivieso, A.; Coronel-León, J.; Guzmán-Martínez, F.; Chavez, E. Heavy Metal(Loid)s Contamination in Water and Sediments in a Mining Area in Ecuador: A Comprehensive Assessment for Drinking Water Quality and Human Health Risk. Environ. Geochem. Health 2023, 45, 4929–4949. [Google Scholar] [CrossRef]
- Iqbal, J.; Su, C.; Wang, M.; Abbas, H.; Baloch, M.Y.J.; Ghani, J.; Ullah, Z.; Huq, M.E. Groundwater Fluoride and Nitrate Contamination and Associated Human Health Risk Assessment in South Punjab, Pakistan. Environ. Sci. Pollut. Res. 2023, 30, 61606–61625. [Google Scholar] [CrossRef] [PubMed]
- Panneerselvam, B.; Muniraj, K.; Pande, C.; Ravichandran, N.; Thomas, M.; Karuppannan, S. Geochemical Evaluation and Human Health Risk Assessment of Nitrate-Contaminated Groundwater in an Industrial Area of South India. Environ. Sci. Pollut. Res. 2022, 29, 86202–86219. [Google Scholar] [CrossRef] [PubMed]
- Marghade, D.; Malpe, D.B.; Duraisamy, K.; Patil, P.D.; Li, P. Hydrogeochemical Evaluation, Suitability, and Health Risk Assessment of Groundwater in the Watershed of Godavari Basin, Maharashtra, Central India. Environ. Sci. Pollut. Res. 2021, 28, 18471–18494. [Google Scholar] [CrossRef]
- Fernández-Navarro, P.; Villanueva, C.M.; García-Pérez, J.; Boldo, E.; Goñi-Irigoyen, F.; Ulibarrena, E.; Rantakokko, P.; García-Esquinas, E.; Pérez-Gómez, B.; Pollán, M.; et al. Chemical Quality of Tap Water in Madrid: Multicase Control Cancer Study in Spain (MCC-Spain). Environ. Sci. Pollut. Res. 2017, 24, 4755–4764. [Google Scholar] [CrossRef]
- Sehlaoui, H.; Hassikou, R.; Dakak, H.; Zouahri, A.; El Hasini, S.; Iaaich, H.; Ghanimi, A.; Douaik, A. Nitrate Contamination and Associated Health Risks of the Benslimane Groundwater, Morocco. Environ. Geochem. Health 2022, 44, 4343–4358. [Google Scholar] [CrossRef] [PubMed]
- Toure, A.; Wenbiao, D.; Keita, Z.; Dembele, A.; Elzaki, E.E.A. Drinking Water Quality and Risk for Human Health in Pelengana Commune, Segou, Mali. J. Water Health 2019, 17, 609–621. [Google Scholar] [CrossRef] [PubMed]
- Abba, S.I.; Egbueri, J.C.; Benaafi, M.; Usman, J.; Usman, A.G.; Aljundi, I.H. Fluoride and Nitrate Enrichment in Coastal Aquifers of the Eastern Province, Saudi Arabia: The Influencing Factors, Toxicity, and Human Health Risks. Chemosphere 2023, 336, 139083. [Google Scholar] [CrossRef]
- Palamuleni, L.; Akoth, M. Physico-Chemical and Microbial Analysis of Selected Borehole Water in Mahikeng, South Africa. Int. J. Environ. Res. Public Health 2015, 12, 8619–8630. [Google Scholar] [CrossRef] [PubMed]
- Kumar, L.; Kumari, R.; Kumar, A.; Tunio, I.A.; Sassanelli, C. Water Quality Assessment and Monitoring in Pakistan: A Comprehensive Review. Sustainability 2023, 15, 6246. [Google Scholar] [CrossRef]
- Press Release: Historic UN Conference Marks Watershed Moment to Tackle Global Water Crisis and Ensure Water-Secure Future—United Nations Sustainable Development. Available online: https://www.un.org/sustainabledevelopment/blog/2023/03/press-release-historic-un-conference-marks-watershed-moment-to-tackle-global-water-crisis-and-ensure-water-secure-future/ (accessed on 7 March 2024).
- Daud, M.K.; Nafees, M.; Ali, S.; Rizwan, M.; Bajwa, R.A.; Shakoor, M.B.; Arshad, M.U.; Chatha, S.A.S.; Deeba, F.; Murad, W.; et al. Drinking Water Quality Status and Contamination in Pakistan. BioMed Res. Int. 2017, 2017, 7908183. [Google Scholar] [CrossRef] [PubMed]
- Barakat, A. Groundwater NO3 Concentration and Its Potential Health Effects in Beni Moussa Perimeter (Tadla Plain, Morocco). Geoenviron. Disasters 2020, 7, 14. [Google Scholar] [CrossRef]
- Campos, L.C.; Ross, P.; Nasir, Z.A.; Taylor, H.; Parkinson, J. Development and Application of a Methodology to Assess Sanitary Risks in Maputo, Mozambique. Environ. Urban. 2015, 27, 371–388. [Google Scholar] [CrossRef]
- McLachlan, M.S.; Czub, G.; Macleod, M.; Arnot, J.A. Bioaccumulation of Organic Contaminants in Humans: A Multimedia Perspective and the Importance of Biotransformation. Environ. Sci. Technol. 2011, 45, 197–202. [Google Scholar] [CrossRef]
- Exposure Factors Handbook (2011 Edition)|US EPA. Available online: https://www.epa.gov/expobox/exposure-factors-handbook-2011-edition (accessed on 3 March 2024).
- World Health Organisation. Weight-for-Age. Available online: https://www.who.int/tools/child-growth-standards/standards/weight-for-age (accessed on 7 July 2024).
- Effects of Fluorine on the Human Fetus (Journal Article)|ETDEWEB. Available online: https://www.osti.gov/etdeweb/biblio/21162085 (accessed on 6 March 2024).
- Population of South America (2024)—Worldometer. Available online: https://www.worldometers.info/world-population/south-america-population/ (accessed on 8 August 2024).
- Countries Defined as Developing by the OECD—GOV.UK. Available online: https://www.gov.uk/government/publications/countries-defined-as-developing-by-the-oecd (accessed on 28 February 2024).
- WHO. The WHO/UNICEF Joint Monitoring Programme for Water Supply and Sanitation (JMP). In Proceedings of the JMP Technical Task Force Meeting on Monitoring Drinking-Water Quality, Chateau de Pizay, Villié-Morgon, France, 16–18 November 2010. [Google Scholar]
- Asian Countries by Population (2024)—Worldometer. Available online: https://www.worldometers.info/population/countries-in-asia-by-population/ (accessed on 2 March 2024).
- Azizullah, A.; Nasir, M.; Khattak, K.; Richter, P. Environment International Water Pollution in Pakistan and Its Impact on Public Health-A Review. Environ. Int. 2011, 37, 479–497. [Google Scholar] [CrossRef]
- Brindha, K.; Elango, L. PAHs Contamination in Groundwater from a Part of Metropolitan City, India: A Study Based on Sampling over a 10-Year Period. Environ. Earth Sci 2014, 71, 5113–5120. [Google Scholar] [CrossRef]
- FRA 2015|Global Forest Resources Assessments|Food and Agriculture Organization of the United Nations. Available online: https://www.fao.org/forest-resources-assessment/past-assessments/fra-2015/en/ (accessed on 21 February 2024).
- Rasool, A.; Farooqi, A.; Masood, S.; Hussain, K. Arsenic in Groundwater and Its Health Risk Assessment in Drinking Water of Mailsi, Punjab, Pakistan. Hum. Ecol. Risk Assess. 2016, 22, 187–202. [Google Scholar] [CrossRef]
- Mayer, J. EconPapers: Industrialization in Developing Countries: Some Evidence from a New Economic Geography Perspective; United Nations Conference on Trade and Development: Geneva, Switzerland, 2004. [Google Scholar]
- Welch, A.; Ryker, S.; Helsel, D.; Hamilton, P. Arsenic in Ground Water of the United States: An Overview. Water Well J. 2001, 55, 30. [Google Scholar]
- Global Report on Sanitation and Wastewater Management in Cities and Human Settlements|UN-Habitat. Available online: https://unhabitat.org/global-report-on-sanitation-and-wastewater-management-in-cities-and-human-settlements (accessed on 17 February 2024).
- Shaji, E.; Sarath, K.V.; Santosh, M.; Krishnaprasad, P.K.; Arya, B.K.; Babu, M.S. Fluoride Contamination in Groundwater: A Global Review of the Status, Processes, Challenges, and Remedial Measures. Geosci. Front. 2024, 15, 101734. [Google Scholar] [CrossRef]
- Aggeborn, L.; Öhman, M. The Effects of Fluoride in Drinking Water. J. Polit. Econ. 2021, 129, 465–491. [Google Scholar] [CrossRef]
- Boyd, E.H. The State of the Environment: Water Quality Chair’s Foreword; Environment Agency: London, UK, 2018. [Google Scholar]
- Benameur, T.; Benameur, N.; Saidi, N.; Tartag, S.; Sayad, H.; Agouni, A. Predicting Factors of Public Awareness and Perception about the Quality, Safety of Drinking Water, and Pollution Incidents. Environ. Monit. Assess. 2022, 194, 22. [Google Scholar] [CrossRef]
- Wang, H.; Gao, J.; Li, X.; Zhang, S.; Wang, H. Nitrate Accumulation and Leaching in Surface and Ground Water Based on Simulated Rainfall Experiments. PLoS ONE 2015, 10, e0136274. [Google Scholar] [CrossRef] [PubMed]
- Brindha, K.; Schneider, M. Impact of Urbanization on Groundwater Quality. In GIS and Geostatistical Techniques for Groundwater Science; Elsevier: Amsterdam, The Netherlands, 2019; pp. 179–196. ISBN 978-0-12-815413-7. [Google Scholar]
- Wakida, F.T.; Lerner, D.N. Non-Agricultural Sources of Groundwater Nitrate: A Review and Case Study. Water Res. 2005, 39, 3–16. [Google Scholar] [CrossRef]
- Fluoride in Groundwater Probability of Occurrence of Excessive Concentration on Global Scale IRC. Available online: https://www.ircwash.org/resources/fluoride-groundwater-probability-occurrence-excessive-concentration-global-scale (accessed on 2 March 2024).
- World Health Organization. Water Safety Plan Manual Step-by-Step Risk Management for Drinking-Water Suppliers, 2nd ed.; World Health Organization: Geneva, Switzerland, 2023. [Google Scholar]
- Mohammed Abdul, K.S.; Jayasinghe, S.S.; Chandana, E.P.S.; Jayasumana, C.; De Silva, P.M.C.S. Arsenic and Human Health Effects: A Review. Environ. Toxicol. Pharmacol. 2015, 40, 828–846. [Google Scholar] [CrossRef]
- Hall, A.H. Chronic Arsenic Poisoning. Toxicol. Lett. 2002, 128, 69–72. [Google Scholar] [CrossRef] [PubMed]
- Gao, S.; Li, C.; Jia, C.; Zhang, H.; Guan, Q.; Wu, X.; Wang, J.; Lv, M. Health Risk Assessment of Groundwater Nitrate Contamination: A Case Study of a Typical Karst Hydrogeological Unit in East China. Environ. Sci. Pollut. Res. 2020, 27, 9274–9287. [Google Scholar] [CrossRef] [PubMed]
- Meenakshi; Maheshwari, R.C. Fluoride in Drinking Water and Its Removal. J. Hazard. Mater. 2006, 137, 456–463. [Google Scholar] [CrossRef]
- Boffetta, P.; Borron, C. Low-Level Exposure to Arsenic in Drinking Water and Risk of Lung and Bladder Cancer: A Systematic Review and Dose–Response Meta-Analysis. Dose-Response 2019, 17, 1559325819863634. [Google Scholar] [CrossRef]
- UN World Water Development Report 2020—Water and Climate Change|UNESCO. Available online: https://www.unesco.org/en/wwap/wwdr/2020 (accessed on 7 March 2024).
- Climate Change: Health Effects in the UK—GOV.UK. Available online: https://www.gov.uk/government/publications/climate-change-health-effects-in-the-uk (accessed on 27 February 2024).
- Technical Report (CCRA3-IA)—UK Climate Risk. Available online: https://www.ukclimaterisk.org/publications/technical-report-ccra3-ia/ (accessed on 3 March 2024).
- Zamora-Ledezma, C.; Negrete-Bolagay, D.; Figueroa, F.; Zamora-Ledezma, E.; Ni, M.; Alexis, F.; Guerrero, V.H. Heavy Metal Water Pollution: A Fresh Look about Hazards, Novel and Conventional Remediation Methods. Environ. Technol. Innov. 2021, 22, 101504. [Google Scholar] [CrossRef]


| Criteria | Justification |
|---|---|
| The paper should report the concentration of chemical contaminants, the country of study, the water origin (e.g., tap or bottled water), and the cause of contamination. |
|
| The paper should inform the risks to human health. |
|
| Chemical Contaminant | Country | Concentration | USA Standard [44] | WHO Standard [45] | Type of Water | Impact Factor | Number of Citations | Reference | ||
|---|---|---|---|---|---|---|---|---|---|---|
| Minimum | Maximum | Mean | ||||||||
| Arsenic (µg/L) | India | - | - | 0.083 | 10 | 10 | Untreated groundwater | 8.3 | 8 | [46] |
| 0.31 | 19.73 | 3.19 | Untreated groundwater | 4.6 | 8 | [17] | ||||
| Spain | 5.9 | 11.5 | - | Bottled | 6.1 | 14 | [47] | |||
| 11.1 | 35.8 | - | Drinking water treatment | 3.057 | 4 | [48] | ||||
| Poland | 0.24 | 27.8 | 2.39 | Bottled | 4.9 | 0 | [49] | |||
| 0.092 | 1.22 | 0.49 | Bottled | 4.4 | 8 | [50] | ||||
| Pakistan | 17 | 58.0 | 33 | Untreated groundwater | 4.4 | 17 | [51] | |||
| 2.5 | 7.9 | 4.2 | Untreated groundwater | 4.6 | 7 | [52] | ||||
| Thailand | 0.01 | 8.87 | 1.31 | Tap | 11.1 | 27 | [53] | |||
| Romania | 0.5 | 130.3 | 4.11 | Bottled and tap | 4.4 | 28 | [54] | |||
| Ecuador | 0.05 | 38.18 | - | Tap | - | 3 | [55] | |||
| Nitrate (mg/L) | Pakistan | 0.1 | 70 | 8.88 | 10 | 50 | Untreated groundwater | 6.18 | 7 | [56] |
| India | 2.84 | 81.5 | 37.55 | Untreated groundwater | 6.18 | 41 | [57] | |||
| 11.23 | 844.0 | 134.58 | Untreated groundwater | 6.18 | 80 | [58] | ||||
| Spain | 0.71 | 2.9 | - | Tap | 4.4 | 8 | [59] | |||
| Morocco | 1.0 | 270.1 | 63.7 | Untreated groundwater | 2.3 | 4 | [60] | |||
| Mali | 11.05 | 23.4 | - | Untreated groundwater | 8.8 | 20 | [61] | |||
| Saudi Arabia | 6.0 | 11.8 | 15.0- | Untreated groundwater | 3.39 | 8 | [62] | |||
| South Africa | 1.8 | 17.1 | 6.0 | Untreated groundwater | 6.18 | 127 | [63] | |||
| Fluoride (mg/L) | India | 0.079 | 4.0 | 1.5 | 4 | 1.5 | Untreated groundwater | 8.3 | 80 | [58] |
| - | - | 1.29 | Untreated groundwater | 6.18 | 8 | [46] | ||||
| Pakistan | 0.06 | 7.9 | 1.06 | Untreated groundwater | 3.251 | 7 | [56] | |||
| 0.5 | 30 | - | Untreated groundwater | 8.8 | 6 | [64] | ||||
| Saudi Arabia | 0.5 | 4.6 | 0.75 | Untreated groundwater | 6.18 | 8 | [62] | |||
Disclaimer/Publisher’s Note: The statements, opinions and data contained in all publications are solely those of the individual author(s) and contributor(s) and not of MDPI and/or the editor(s). MDPI and/or the editor(s) disclaim responsibility for any injury to people or property resulting from any ideas, methods, instructions or products referred to in the content. |
© 2024 by the authors. Licensee MDPI, Basel, Switzerland. This article is an open access article distributed under the terms and conditions of the Creative Commons Attribution (CC BY) license (https://creativecommons.org/licenses/by/4.0/).
Share and Cite
Jurczynski, Y.; Passos, R.; Campos, L.C. A Review of the Most Concerning Chemical Contaminants in Drinking Water for Human Health. Sustainability 2024, 16, 7107. https://doi.org/10.3390/su16167107
Jurczynski Y, Passos R, Campos LC. A Review of the Most Concerning Chemical Contaminants in Drinking Water for Human Health. Sustainability. 2024; 16(16):7107. https://doi.org/10.3390/su16167107
Chicago/Turabian StyleJurczynski, Yasemin, Robson Passos, and Luiza C. Campos. 2024. "A Review of the Most Concerning Chemical Contaminants in Drinking Water for Human Health" Sustainability 16, no. 16: 7107. https://doi.org/10.3390/su16167107
APA StyleJurczynski, Y., Passos, R., & Campos, L. C. (2024). A Review of the Most Concerning Chemical Contaminants in Drinking Water for Human Health. Sustainability, 16(16), 7107. https://doi.org/10.3390/su16167107