Abstract
Jiangsu Province is a region with a high concentration of economy and population in China, as well as a spatial unit with relatively concentrated carbon emissions. It is also the pioneer in achieving carbon peak. Analyzing the factors influencing carbon emissions and predicting the peak year of carbon emissions will help Jiangsu Province clarify the direction of carbon reduction and take the lead in achieving carbon peak. This article selects relevant data from Jiangsu Province from 2005 to 2020, uses the STIRPAT model to analyze the influencing factors of carbon emissions in Jiangsu Province, predicts the carbon emissions and peak times of 13 prefecture-level cities in four different scenarios, and constructs a carbon peak prediction model to calculate the carbon peak pressure, carbon emission reduction potential, and carbon peak driving force of each prefecture-level city. Research has found that the population size, wealth level, technological level, urbanization level, and industrial structure have significant impacts on carbon emissions in Jiangsu Province. The prediction results for carbon peak in 13 prefecture-level cities indicate that Nantong, Huai’an, Yancheng, Suzhou, Nanjing, and Wuxi can achieve carbon peak before 2030 in all four scenarios. Changzhou, Xuzhou, Yangzhou, Taizhou, Suqian, Lianyungang, and Zhenjiang are all able to achieve carbon peak between 2025 and 2029 under the low-growth, slow-consumption scenario (P2G2E1) and low-growth, fast-consumption scenario (P2G2E2), but they cannot achieve carbon peak before 2030 under the high-growth, slow-consumption scenario (P1G1E1) and high-growth, fast-consumption scenario (P1G1E2). Finally, based on the carbon peak prediction model, the prefecture-level cities are classified, and differentiated carbon peak implementation paths for different types of prefecture-level cities are proposed.
1. Introduction
Human activities are the main cause of rising CO2 concentrations and global warming []. The Paris Agreement proposes that the world should quickly peak greenhouse gas emissions, control the increase in the global average temperature compared to preindustrial periods to within 2 °C, and strive to limit it to within 1.5 °C. For this reason, the international community actively discusses scientific measures for carbon reduction, with over 130 countries or regions proposing carbon peak or carbon neutrality goals. In 2005, China surpassed the United States to become the country with the largest global carbon emissions []. According to BP data, in 2019, China’s primary energy consumption reached 141.7 EJ, with CO2 emissions reaching 9.83 billion tons, accounting for 24.3% and 28.8% of the global total, respectively. Energy consumption reduction and carbon reduction are facing enormous pressure []. China has made tremendous efforts to mitigate climate change and control greenhouse gas emissions. In terms of international commitments, in September 2020, the Chinese government announced at the 75th United Nations General Assembly that CO2 emissions would peak before 2030, and carbon neutrality would be achieved before 2060 []. In terms of policies, relevant departments have successively introduced macropolicies such as “the China National Plan to Address Climate Change”, clarifying the control of greenhouse gas emissions in industries, transportation, and energy [], and have launched three batches of national low-carbon pilot cities [] and the construction of a national carbon trading market.
To achieve the goal of peaking carbon emissions and achieving carbon neutrality, it is not only necessary to have top-level design at the national level, but also to adopt targeted carbon reduction measures at the regional level. As an economically developed and densely populated region, Jiangsu Province has a huge demand for energy in its living and production sectors, and the tasks of energy conservation and emission reduction are arduous. Therefore, analyzing the influencing factors of carbon emissions and predicting carbon peak in Jiangsu Province can be beneficial for formulating effective carbon reduction measures at the regional level.
The current existing research provided theoretical support for this article, but, due to the difficulty of the data acquisition and processing, most of the existing research provides guidance on carbon reduction at the macrolevel of the country and province, which cannot accurately reflect the spatiotemporal pattern characteristics of carbon emissions within the province, making it difficult to propose targeted carbon reduction measures. There are significant differences in the economic development levels, industrial structures, resource endowments, population distributions, and other factors among the different prefecture-level cities in Jiangsu Province [], as well as differences in the energy utilization efficiencies and carbon reduction efficiencies among the regions due to differences in the technological development levels []. In order to achieve the carbon peak target before 2030 in the “Jiangsu Province Carbon Peak Implementation Plan”, the goal of Jiangsu Province must be decomposed at the prefecture-level city level based on the principle of “common but differentiated responsibilities”. Therefore, how to fairly and effectively formulate carbon peak plans at the prefecture-level city level is an important issue that needs to be addressed at present.
This article takes 13 prefecture-level cities in Jiangsu Province as the research object, and it uses the STIRPAT model to analyze the impacts of factors such as the population size, wealth level, and technological level on carbon emissions. Firstly, based on the proportions of carbon emissions and the current carbon emission efficiencies of the three major industries in various prefecture-level cities in Jiangsu Province, we analyzed the key areas and tasks of carbon reduction in these cities. Secondly, stationary tests were conducted on imbalanced panel data (2005–2020), and the regression results were subjected to a Hausman test. Empirical analysis was conducted on the entire province and three major regions (southern, central, and northern Jiangsu) based on the test results. Subsequently, four different scenarios were set up to predict the carbon emissions and the time to peak carbon emissions for each prefecture-level city from 2021 to 2030 based on the regression results of the STIRPAT model in each scenario. Finally, a carbon peak prediction model was constructed to calculate the carbon peak pressures, carbon emission reduction potentials, and carbon peak driving forces of various prefecture-level cities. Based on the calculation results, differentiated carbon peak path models for different types of prefecture-level cities are proposed.
2. Literature Review
2.1. Factors Affecting Carbon Emissions
There are various factors that affect carbon emissions, mainly including economic growth [], population size [], industrial structure [], technological progress [], and urbanization []. The current main viewpoint is that economic growth has a strong dependence on coal []. As the total population increases, resource consumption increases, and carbon emissions increase. Using per capita GDP to characterize per capita income, research has found that population size and per capita income are the factors that have the greatest impacts on China’s per capita carbon emissions []. The carbon emissions of the secondary industry are relatively high, and reducing the proportion of the secondary industry is beneficial for reducing carbon emissions. Technological progress has led to a decrease in energy intensity []. The key to slowing down carbon emissions while maintaining sustained growth in per capita income is to further reduce energy intensity and adjust industries and energy structures [,]. Urbanization has a dual effect of inhibiting and promoting carbon emissions. In the early stages of urbanization, people’s demand for various materials and infrastructures increased, leading to an increase in carbon emissions. In the middle and later stages of urbanization, the level of management and technology improved, thereby reducing carbon emissions [].
Regarding the factors affecting carbon emissions, domestic and foreign scholars mainly use the STIRPAT model and LMDI model for quantitative analysis.
The LMDI model. Zheng et al. [] constructed an LMDI model based on the extension of Kaya’s identity and conducted a decomposition analysis of the greenhouse gas emission factors in Hangzhou, Zhejiang Province, from 2010 to 2021. The results showed that the population size, per capita GDP, urbanization level, and agricultural activity intensity were the main factors leading to an increase in carbon emissions. Peng et al. [] studied the contribution rates of the energy structure, energy intensity, economic development, and population size to carbon emissions from energy consumption in Huizhou, Guangdong Province, based on the LMDI model. The results indicate that economic development and population size are the main factors driving the increase in emissions. The decrease in energy intensity and the low-carbon energy structure are the main factors that suppress the increase in carbon emissions.
The STIRPAT model. Guo et al. [] conducted regression analysis on statistical data for Jiangsu Province from 2000 to 2019 based on the STIRPAT model. The results indicate that the increase in the population and urbanization level have promoted the increase in carbon emissions, and the higher the proportion of the tertiary industry in the total industry, the more significant the inhibitory effect on carbon emissions. Fei et al. [] used the inventory method to calculate the carbon emissions of 13 prefecture-level cities in Jiangsu Province from 1999 to 2020, and analyzed the impact of the economy, population, energy intensity, and energy structure on carbon emissions using the STIRPAT model. The results indicate that there are regional differences in the relationship between carbon emissions and the population, with a significant positive correlation between the per capita GDP, proportion of secondary industry, energy intensity, and total carbon emissions.
The STIRPAT model is a widely used model for analyzing environmental impact factors, with the advantage of being able to quantitatively analyze the degree of impact of different factors on the environment. This article uses the STIRPAT model to conduct factor decomposition research on carbon emissions in various cities in Jiangsu Province.
2.2. Carbon Emission Peak Prediction
The development of carbon emissions can be divided into three stages: the continuous accumulation of carbon emissions, the relative reduction in the carbon intensity, and the absolute reduction in carbon emissions []. Domestic and foreign scholars generally believe that peak carbon emissions generally exist in the second to third stages. There are three ways to predict peak carbon emissions []. The first approach is to use the EKC model to determine the presence or absence of turning points []. The second approach is to establish a systematic model that can intuitively predict carbon emissions. The grey prediction model and CGE model are the main applications of this method [,]. The third and most commonly used method in the current research is the STIRPAT model, which first decomposes the influencing factors of carbon emissions and then predicts future carbon emission trends through scenario analysis [].
Zhao et al. [] conducted a study on carbon emissions in Fujian Province, China, based on the EKC curve. The results showed that the carbon emission EKC curve in Fujian Province is a common “inverted U” shape, while the environmental pollution EKC curve has three types: “N”, “M”, and “inverted U”. Wang et al. [] applied the EKC theory to study the relationship between carbon emissions and the per capita GDP in 27 provinces of China from 2009 to 2014. The results show that both for the overall situation of the 27 provinces and for individual studies in the central, eastern, and western regions, the curve relationship between carbon emissions and economic development shows an “inverted U” shape. That is, in the initial stage, as economic development grows, carbon emissions also increase, but, to a certain extent, they actually decrease.
The grey prediction model is a development of grey system theory. Liu et al. [] listed energy intensity as the most important factor and used a grey prediction model to discuss the pressure of regional economic carbon reduction. The results show that before 2020, there was not much carbon reduction pressure, but due to the large proportion of industry and simple energy structures, regional economies will face greater carbon reduction pressure in the short term. Qiao et al. [] used data from 2014 to 2019 and the Discrete Grey Model (DGM) to predict the carbon emission targets of member countries of the APEC from 2020 to 2023. The results show that among the predicted 17 member countries, 13 countries have shown an upward trend in carbon emissions. Overall, the grey prediction model is widely used as a new method for studying carbon emission peaks, but it cannot analyze the rationality of these data by utilizing the factors affecting carbon emissions.
Xie et al. [] used the STIRPAT model and selected data from 2001 to 2019 to predict and analyze the carbon emissions and peak years in Jiangsu Province before 2030. The results show that the carbon peak in Jiangsu Province will occur between 2025 and 2028. Zhu [] constructed a STIRPAT model and set three scenarios to reasonably predict the industrial carbon emissions in Jiangsu Province from 2021 to 2035: the low-carbon scenario, baseline scenario, and strong-emission scenario. The results showed that the industrial carbon emissions under the three scenarios showed a trend of first increasing and then decreasing. The difference is that in the low-carbon scenario, Jiangsu Province will reach its peak in 2025, and in the baseline and strong-emission scenarios, it will reach its peak in 2030. Cao et al. [] selected four key emission industries through cluster analysis, constructed an extended STIRPAT model to analyze the influencing factors of carbon emissions in industries in Jiangsu Province, and then used scenario analysis to predict the carbon emissions of key industries in Jiangsu Province from 2019 to 2030. The results show that carbon emissions from key industries will approach their peak by 2030.
Research generally believes that under the scenario of a reasonable economic development speed and carbon emission intensity reduction, Jiangsu Province may achieve carbon peak earlier than 2030 []. Jiangsu Province should distinguish carbon emissions at the prefecture level and city level in order to clarify their respective responsibilities in energy conservation and emission reduction. This article uses the STIRPAT model to predict the future carbon emission trends of 13 prefecture-level cities in Jiangsu Province through scenario analysis.
2.3. Document Analysis
The existing research has explored the factors influencing carbon emissions and predicting carbon peak, but there are still shortcomings: firstly, the research focuses on national and provincial administrative regions, or individual cities. China has a vast territory, and there are significant differences in the economic development levels, industrial structures, and technological levels among its different regions. Each region should implement carbon peaking in batches. Using national and provincial administrative regions as research objects is too macro and cannot reflect regional differences. However, using a single city as the research object is too micro, and the implementation path can only be replicated and promoted in specific regions. Secondly, when analyzing the path to achieving carbon peak, only the potential for energy conservation and emission reduction was focused on, lacking a comprehensive consideration of the pressure of carbon peak. The study of carbon peak pathways that only consider the emission reduction potential is detached from the objective facts of the development statuses of various regions and cannot draw practical and feasible conclusions and suggestions.
3. Analysis of Carbon Emission Status
3.1. Sample Selection
In order to implement the State Council’s Opinions on “Fully Implementing the New Development Concept and Doing a Good Job in Carbon Peaking and Carbon Neutrality”, the Jiangsu Provincial Government issued the “Jiangsu Province Carbon Peak Implementation Plan” in 2022. The plan states that by 2030, carbon emissions per unit of GDP will decrease by more than 65% compared to 2005, and carbon emissions will peak before 2030, providing strong support for achieving carbon neutrality. Jiangsu Province is one of the potential regions to achieve carbon peak, including 13 prefecture-level cities: Nanjing; Wuxi; Xuzhou; Changzhou; Suzhou; Nantong; Lianyungang; Huai’an; Yancheng; Yangzhou; Zhenjiang; Taizhou; and Suqian. The economy of Jiangsu Province is mainly composed of manufacturing and service industries, which are highly representative in social and economic development and ecological environment governance. They not only bear the ecological pressure caused by extensive industrialization, but they also face a green transformation towards high-quality development. Therefore, conducting carbon peak research in various cities in Jiangsu Province can not only provide decision-making support, but can also be promoted as a case study to other cities.
3.2. Data Sources
This article takes relevant data from 13 prefecture-level cities in Jiangsu Province from 2005 to 2020 as the research sample. The carbon emission data of various cities were sourced from the “China Urban CO2 Emission Dataset (2005–2020)” compiled by the China Urban Greenhouse Gas Working Group. The data on the total resident population and per capita GDP of various cities were sourced from the “China Urban Statistical Yearbook (2005–2020)”. The energy consumption data were sourced from the “China Energy Statistical Yearbook (2005–2020)”, which ultimately merged terminal energy consumption into five categories: natural gas, electricity, liquefied petroleum gas, heat (hot water, steam), and raw coal. The standard coal conversion coefficients and carbon emission coefficients for various types of energy are shown in Table 1.

Table 1.
The standard coal conversion coefficients for various energy sources.
3.3. Situation Analysis
3.3.1. Overall and Regional Status
As shown in Figure 1, the total carbon emissions in Jiangsu Province showed a trend of first increasing and then stabilizing from 2005 to 2020. The changes in carbon emissions can be mainly divided into three stages: from 2005 to 2009, the total carbon emissions in Jiangsu Province increased, while the growth rate decreased. This was because Jiangsu Province began to focus on energy conservation and emission reduction work in accordance with the guidance of the “Eleventh Five Year Plan (2006–2010)”, resulting in a decrease in the growth rate. However, due to the large economic aggregate, the upward trend of carbon emissions remains unchanged. The total carbon emissions continued to rise from 2009 to 2011, with a rapid growth rate, mainly due to large-scale infrastructure construction and the expansion of high-energy-consuming industries after the financial crisis. Since 2011, the total carbon emissions have stabilized, and the growth rate has shown a downward trend. This is because the promulgation of the “Jiangsu Province Energy Conservation Regulations” has promoted the carbon reduction process in Jiangsu Province.
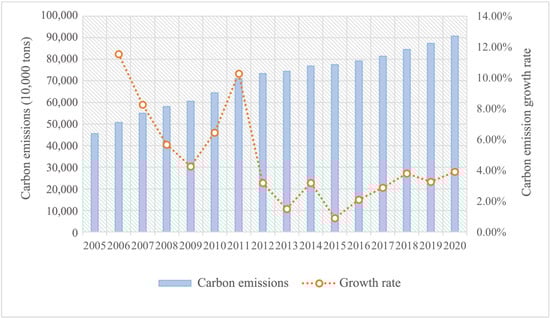
Figure 1.
Trend of total carbon emissions in Jiangsu Province from 2005 to 2020.
As shown in Figure 2, the carbon emissions of various prefecture-level cities in Jiangsu Province increased year by year from 2005 to 2020. The carbon emissions in southern Jiangsu account for about 60%, with an average annual growth rate of 4.31%. The proportions of carbon emissions in central and northern Jiangsu are about 15% and 25%, respectively, with average annual growth rates of 6.21% and 6.41%. The main reason for the differences among the three major regions is that the high-energy-consuming industries, urbanization level, and economic development in southern Jiangsu are more developed than those in central and northern Jiangsu. Suzhou has had the highest carbon emissions over the years, about eight times those of Suqian, but its annual growth rate is relatively low. Suqian has had the lowest carbon emissions in the province over the years, but its annual growth rate is the highest.
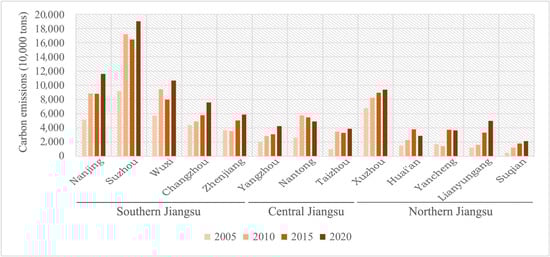
Figure 2.
Trends in total carbon emissions in the three major regions of Jiangsu Province (southern, central, and northern Jiangsu) from 2005 to 2020.
3.3.2. Current Situation of Various Prefecture-Level Cities
The specific changes in carbon emissions in the 13 prefecture-level cities are generally consistent with the trend of total carbon emissions in Jiangsu Province. After a rapid increase from 2005 to 2010, the evolutionary path diverged, as shown in Figure 3. Yancheng and Huai’an reached significant carbon peaks in 2015 and 2017, respectively. Cities that have not yet reached their peaks are also different. Wuxi, Suzhou, and others have experienced a slight decline, while Xuzhou and others have maintained relatively high growth rates. Despite being in similar socio-economic and policy environments, different cities exhibit differentiated evolutionary trends at different times. Therefore, it is necessary to set different scenarios based on the main variables that affect carbon emissions, and to use the STIRPAT model to explore the evolution trends of carbon emissions in different cities.
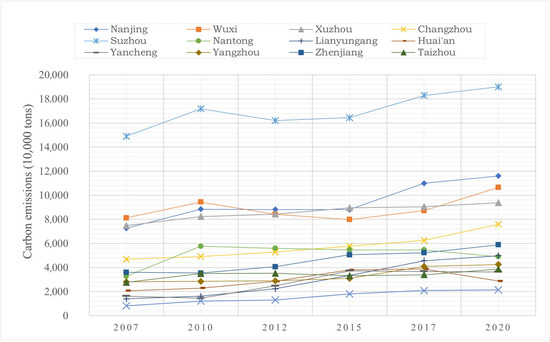
Figure 3.
Trends of carbon emissions in 13 prefecture-level cities in Jiangsu Province from 2005 to 2020.
The economic and social development stages and natural resource endowments of 13 prefecture-level cities in Jiangsu Province are different, resulting in significant differences in their carbon emissions. Suzhou, Nanjing, and Wuxi have significantly higher carbon emissions than the other cities, with carbon emissions exceeding 100 million tons in 2020, as shown in Figure 4. Xuzhou, Changzhou, and other cities have moderate carbon emissions, ranging from 40 million to 90 million tons, as shown in Figure 5. The carbon emissions of Taizhou, Yancheng, and other cities are much lower than those of the other cities, with no more than 40 million tons, as shown in Figure 6.
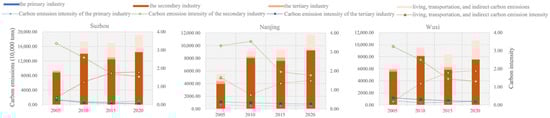
Figure 4.
Emission statuses of prefecture-level cities with high carbon emissions.
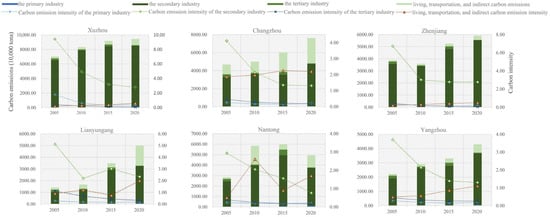
Figure 5.
Emission statuses of prefecture-level cities with moderate carbon emissions.
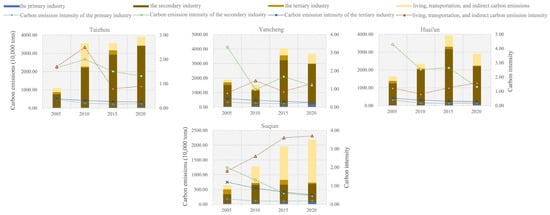
Figure 6.
Emission statuses of prefecture-level cities with lower carbon emissions.
The proportions of carbon emissions from the primary industry in various prefecture-level cities are very low, all less than 5%. The carbon emission intensity is also less than 0.5 tons/10,000 CNY. Therefore, the primary industry is not a key area for carbon reduction in cities at the local level.
Except for Suqian (28%), the proportions of carbon emissions from the secondary industry in various prefecture-level cities are very high, all exceeding 60%. In addition, the carbon emission intensities of the secondary industry in Xuzhou and Zhenjiang are relatively high, at 2.9 tons/10,000 CNY and 2.8 tons/10,000 CNY, respectively. The secondary industry is a key area for carbon reduction in these two prefecture-level cities.
The proportions of carbon emissions from the tertiary industry in various prefecture-level cities are also very low, all around 1%. Only Suqian has a slightly higher carbon emission intensity of 0.51 tons/10,000 CNY. Therefore, the tertiary industry is not a key area for carbon reduction in various prefecture-level cities.
The proportions of living, transportation, and indirect carbon emissions in various prefecture-level cities are generally high, with Changzhou, Lianyungang, and Suqian all exceeding 35%. And the carbon emission intensities are also relatively high, all exceeding 2.0 tons/10,000 CNY, which is a key emission reduction area for these three prefecture-level cities.
4. Analysis of Factors Affecting Carbon Emissions
4.1. Model Design
This article uses the STIRPAT model to analyze the impacts of factors such as the population size, economic and social development level, and energy consumption intensity on urban carbon emissions. The STIRPAT model is a variation of the IPAT model proposed by Ehrlich and Holdren []. The IPAT model quantitatively analyzes the impact of population, affluence, and technology on the environment (i.e., I = P × A × T).
However, the IPAT model assumes a linear relationship between the impacts of various factors on the environment, and the available influencing factors are limited. In order to overcome the limitations of the IPAT model, Dietz and Rosa [] proposed a stochastic model based on the IPAT model, namely, the STIRPAT model. The formula is as follows:
where a is a constant; b, c, and d represent the exponential terms of P, A, and T, respectively, representing their elastic coefficients; e is the error term. When examining the factors affecting urban carbon emissions, taking the logarithm of both sides of Formula (1) can represent Formula (2):
where C represents the urban carbon emissions; α is the model coefficient; P represents the number of permanent residents, representing the population size; G represents the per capita GDP, representing the level of wealth; EI represents the intensity of energy consumption, representing the level of technology; β1, β2, and β3 are the estimated coefficients of the explanatory variable; γ is the estimated coefficient of the control variable, representing the rate of change in carbon emissions (C) caused by a 1% change in the P, G, EI, and X; ε is a random error term.
I = a × Pb × Ac × Td × e
lnC = α + β1lnP + β2lnG + β3lnEI + γlnX + ε
This article selects urban carbon emissions as the dependent variable and the permanent population, per capita GDP, and energy consumption intensity as the explanatory variables. Firstly, the number of permanent residents (P) is an important factor in urban development. The population size can have an impact on resources, transportation, and other factors, thereby affecting urban carbon emissions. Secondly, the Environmental Kuznets Curve (EKC) explains the “inverted U”-shaped relationship between carbon emissions and income levels. Therefore, the per capita GDP (G) has always been considered an important factor affecting urban carbon emissions. Finally, the energy consumption intensity (EI), which is calculated based on the ratio of the total urban energy consumption to the local GDP, represents the energy consumption value of marginal output. Under the same level of technological conditions, a higher energy intensity corresponds to higher energy consumption, leading to an increase in total carbon emissions.
In addition, the STIRPAT model increases randomness and has better scalability. In this model, other factors that have an impact on the environment can be added, such as the urbanization rate, industrial structure, financial expenditure, etc. The report of the Intergovernmental Panel on Climate Change (IPCC) of the United Nations points out that, in addition to the number of permanent residents, per capita GDP, and energy consumption intensity, the urbanization level is another important factor affecting carbon emissions []. The relationship between the urbanization level and carbon emissions is complex, involving factors such as the urban form, development level, and infrastructure. Meanwhile, structural effects suggest that during the transition of regional pillar industries from agriculture to industry, the environmental quality will show a deteriorating trend, while during the transition from industry to the service industry, the environmental quality will show an optimization trend. Therefore, the industrial structure is also an important factor affecting carbon emissions. Furthermore, the indirect impact of financial expenditure on the environment cannot be ignored [,]. The increase in urban public financial expenditure, especially in energy conservation and environmental protection, will guide low-carbon production and lifestyles and promote urban carbon reduction []. Therefore, in addition to considering the impacts of the explanatory variables on carbon emissions, this article selects the urbanization rate, industrial structure, and financial expenditure as the control variables.
The urban carbon emission influencing factor model is constructed in this article, as shown in Formula (3):
where UR is the urbanization rate, which represents the level of urbanization; IS represents the proportion of the output value of the secondary industry to the GDP, representing the industrial structure; FE represents the general public budget expenditure of urban finance, representing the public financial expenditure; β4, β5, and β6 are the estimated coefficients of the control variable; μi is a factor that does not change with time for individuals. The descriptive statistics of each variable are shown in Table 2.
lnC = α + β1lnP + β2lnG + β3lnEI + β4lnUR + β5lnIS + β6lnFE + μi + ε
Table 2.
Variable definitions and descriptive statistics.
4.2. Empirical Results and Analysis
4.2.1. Empirical Results and Analysis of Overall Effects
Based on panel data from 13 prefecture-level cities for 2005, 2010, 2015, and 2020, we performed mixed OLS regression to estimate the random and fixed effects in Jiangsu Province. Subsequently, the model was selected based on the Hausman test results, and robustness tests were conducted on the model. According to Formula (3), in order to solve the problem of the inconsistent dimensions of each variable, the STIRPAT model constructed in this article takes the logarithm of the explanatory variable, the dependent variable, and the control variable.
(1) Model estimation results. The impacts of the population size, wealth level, and technological level on the overall carbon emissions of Jiangsu Province were tested using Formula (3). The model introduces fixed effects and random effects. The fixed-effects model solves the problem of omitted variables that do not change over time but vary with individuals. The random effects solve the autocorrelation of errors, and the test results are shown in Table 3. The regression in column (1) does not introduce control variables, random effects, or fixed effects. The impacts of the population size, wealth level, and technological level on carbon emissions are significant at the 1% level. The regression in column (2) introduces control variables and random effects. The impacts of the three control variables on carbon emissions are not significant, while the impacts of the other three explanatory variables on carbon emissions remain significant at the 1% level. The regression in column (3) includes control variables and fixed effects. Financial expenditure has no significant impact on carbon emissions, while the population size, wealth level, technology level, urbanization level, and industrial structure have significant impacts on carbon emissions at the 10%, 5%, 10%, 5%, and 5% levels, respectively, and the estimated coefficients are 1.267, 0.874, 0.419, −0.583, and 0.920, respectively.
Table 3.
Analysis of factors influencing carbon emissions in Jiangsu Province.
(2) The Hausman test. To ensure the reliability of the regression results and select appropriate model results for analysis, we conducted a Hausman test on the model results. The results indicate that the fixed-effects model performs better than the random-effects model and OLS regression. Therefore, the regression results of the fixed-effects model should be selected for analysis. The Formula (4) for calculating carbon emissions is as follows:
lnC = 1.267lnP + 0.874lnG + 0.419lnEI − 0.583lnUR + 0.920lnIS − 11.934
(3) Regression result analysis. As shown in column (3) of the table, the impacts of various factors on carbon emissions in Jiangsu Province vary. Among them, the increase in the population size, the proportion of the secondary industry, and the level of wealth are important factors leading to an increase in carbon emissions in Jiangsu Province. The advancement of the technological level, namely, the decrease in the energy consumption intensity, can play a certain role in reducing emissions. The increase in the urbanization level has a restraining effect on the increase in carbon emissions. The impact of public financial expenditure on carbon emissions is not significant;
(4) Robustness testing. To test the robustness of the fixed-effects model, this article adopts the method of changing the sample size for robustness testing. The fourth column of the regression results is the test result, and, according to the results, the significance and estimated coefficients of each explanatory variable and control variable have almost no change. Therefore, the model passed the robustness testing.
According to the data in Table 3, the influencing factors of carbon emissions in Jiangsu Province were analyzed. Firstly, the regression coefficients of the population size were positive in all the models, indicating that the increase in the permanent population had a significant positive impact on carbon emissions. For every 1% increase in the permanent population, carbon emissions increase by 1.267%. The elasticity coefficient of population growth on carbon emissions is greater than 1, indicating that the population size in Jiangsu Province is still on the rise, as well as the energy consumption level, leading to an increase in marginal carbon emissions generated by population growth.
The regression coefficient of the wealth level is positive in all the models, and economic growth is the main driving factor for carbon emission growth. For every 1% increase in the per capita GDP, carbon emissions will increase by 0.874%. The elasticity coefficient of economic growth on carbon emissions is slightly less than 1, indicating that Jiangsu Province’s economic growth focuses on optimizing and adjusting the energy structure, and it has entered a stage of high-quality green and low-carbon development, resulting in a decrease in marginal carbon emissions generated by economic growth.
The regression coefficient of the technological level is also positive in all the models, and the decrease in the energy consumption intensity promotes carbon reduction. For every 1% decrease in the energy consumption intensity, carbon emissions will decrease by 0.419%. The elasticity coefficient of the energy consumption intensity on carbon emissions is less than 0.5. The improvement in clean energy production technology in Jiangsu Province has reduced the energy consumption intensity, thereby reducing carbon emissions to a certain extent. However, the carbon reduction brought about by technological progress is very limited, and the marginal carbon reduction generated is decreasing, requiring further increases in investment in technology research and development.
The level of urbanization is not significant in the OSL and random-effects models, but it is significantly negative in the fixed-effects model, indicating that the urbanization process has a certain inhibitory effect on carbon emission growth. For every 1% increase in the urbanization rate, carbon emissions will decrease by 0.583%. The urban infrastructure in Jiangsu Province is relatively complete, and with the improvement in the urbanization level, the efficiency of public facility services will also improve, thereby suppressing carbon emissions.
The proportion of the secondary industry is not significant in the OSL and random-effects models, but it is significantly positive in the fixed-effects model, indicating that an increase in the proportion of the secondary industry will promote the growth of carbon emissions. For every 1% increase in the proportion of the secondary industry, carbon emissions will increase by 0.920%. The elasticity coefficient is slightly less than 1, indicating that Jiangsu Province focuses on industrial structure transformation and upgrading, resulting in a decrease in marginal carbon emissions generated by the increase in the proportion of the secondary industry.
4.2.2. Empirical Results and Analysis of the Three Major Regions
The previous section discussed the overall effects of the carbon emission influencing factors in Jiangsu Province. In this section, 13 prefecture-level cities are divided into three major regions based on their geographical locations: southern Jiangsu, central Jiangsu, and northern Jiangsu, and the impacts of the population size, wealth level, technological level, urbanization rate, and industrial structure on the three major regions are studied. The specific regression results are shown in Table 4.
Table 4.
Regression results of factors influencing carbon emissions in three major regions of Jiangsu Province.
The regression coefficients of the population size in the three major regions are also positive, consistent with the overall effect of Jiangsu Province, indicating that the population size has a promoting effect on carbon emissions in the three regions, but the degree of influence gradually weakens from south to north. There are two reasons: on the one hand, some prefecture-level cities have relatively small populations and relatively backward economic development levels, which have a weak impact on carbon emissions, such as Huai’an City and Yancheng City; on the other hand, although the populations of some prefecture-level cities are relatively large, the population distribution and infrastructure layout are relatively concentrated, which improves the energy utilization efficiency, such as in Xuzhou City.
Except for the negative value in northern Jiangsu, the per capita GDPs of the other two regions have a positive impact on carbon emissions, indicating significant spatial heterogeneity. The regions with negative values are mainly distributed in Xuzhou and Lianyungang in northern Jiangsu. The reason is that the level of economic development is relatively low, as is the level of energy consumption, resulting in lower carbon emissions. The per capita GDP of the central Jiangsu region is positive, and the elasticity coefficient is greater than 1, indicating that the economic growth of the region is mainly driven by traditional factors and has not fully utilized the carbon reduction effect of technological innovation. The current development model of cities is still relatively extensive, leading to an increase in marginal carbon emissions generated by economic growth.
The regions where the energy intensity has a positive impact on carbon emissions are mainly concentrated in southern and central Jiangsu. These regions have relatively high degrees of industrialization and can have a certain inhibitory effect on carbon emissions after adopting more advanced technologies and more efficient management methods. The regression coefficient of the energy intensity in northern Jiangsu is negative, indicating a decrease in the energy intensity but an increase in the total carbon emissions. This phenomenon may be due to the fact that during the process of industrial restructuring, some high-emission industries still account for a relatively large proportion, leading to an increase in carbon emissions.
The regression coefficient of the urbanization rate is negative in southern and central Jiangsu, indicating that the urbanization rate has a suppressive effect on carbon emissions in most areas of Jiangsu Province. The areas where the urbanization rate has a positive impact on carbon emissions are mainly concentrated in Yancheng, Xuzhou, and Huai’an in northern Jiangsu. The reason is that the urbanization process in these areas is relatively slow, and there is insufficient investment in infrastructure construction. With the increase in the urbanization rate, carbon emissions have actually increased.
The regions that are highly affected by their industrial structures are mainly in central Jiangsu, with an elasticity coefficient slightly greater than 1. This is because the secondary industry accounts for a relatively large proportion in the region, which promotes an increase in carbon emissions, with Nantong having the greatest positive impact. Nantong has a developed manufacturing industry, with high-energy-consumption manufacturing industries such as metal manufacturing and chemical manufacturing as the main types of industries, resulting in a high-carbon economy. The regions where the industrial structures have a negative impact on carbon emissions are mainly concentrated in the eastern coastal cities of Yancheng and Lianyungang in northern Jiangsu. Due to the abundant marine resources in coastal areas, clean and efficient green energy can be deployed. Moreover, for example, Lianyungang is focusing on promoting the development of new materials and high-end manufacturing in its industrial layout, creating a green industrial chain, and thereby reducing carbon emissions.
5. Research on Carbon Peak Prediction
5.1. Model Design
(1) Carbon peak pressure index. In response to the “Jiangsu Province Carbon Peak Implementation Plan” proposed by the Jiangsu Provincial Government, for various prefecture-level cities in Jiangsu Province, the time of carbon peak is the primary source of pressure to achieve carbon peak goals. Carbon emissions and the carbon emission growth rate are two other pressures. The prefecture-level cities with higher carbon emissions have achieved carbon peaking, making a greater contribution to achieving carbon peaking in Jiangsu Province. Therefore, they have a greater responsibility to be the first to achieve carbon peaking. For prefecture-level cities with higher carbon emission growth rates, there is greater resistance to controlling the growth rate of carbon emissions, and there is also greater pressure to achieve carbon peak in the short term. Therefore, the formula for the carbon peak pressure index of prefecture-level cities constructed is as follows:
where Ipi is the carbon peak pressure index; Itpi is a target pressure indicator that reflects the average year in which various prefecture-level cities achieve carbon peak under different scenarios, and that characterizes the pressure faced in achieving carbon peak goals; Irpi is a responsibility pressure indicator that reflects the relative magnitude of carbon emissions in four scenarios in various prefecture-level cities by 2030, representing the pressure brought about by the responsibility of helping Jiangsu Province achieve carbon peak; Ispi is the primary pressure indicator that reflects the relative magnitude of the average carbon emission growth rate in four scenarios for various prefecture-level cities from 2021 to 2030, and that characterizes the pressure faced by achieving carbon peak under their respective carbon emission growth rates. γ, δ, and θ represent the weights of each stress indicator separately;
Ipi = γItpi + δIrpi + θIspi
(2) Carbon emission reduction potential index. This article constructs a carbon reduction potential index for various prefecture-level cities from the perspectives of efficiency and fairness. From an efficiency perspective, the higher the carbon emission intensity, the lower the carbon emission efficiency, indicating a greater potential for reducing carbon emissions through technological upgrades and structural adjustments. From a fair perspective, everyone has the right to equal carbon emissions, and the higher the per capita carbon emissions, the greater the potential for reducing carbon emissions through economic regulation measures. Therefore, the constructed carbon emission reduction potential index for various prefecture-level cities is as follows:
where Ipo is the carbon emission reduction potential index; Iepo is an efficiency potential indicator that reflects the relative magnitude of the average carbon emission intensity in the four scenarios in various prefecture-level cities by 2030, and that characterizes the carbon emission reduction potential in terms of the carbon emission efficiency; Ifpo is a fairness potential indicator, reflecting the relative magnitude of the per capita carbon emissions in the four scenarios in various prefecture-level cities by 2030, and characterizing the emission reduction potential in terms of carbon emission fairness; ρ and σ, respectively, represent the weights of the Iepo and Ifpo potential indicators;
Ipo = ρIepo + σIfpo
(3) Carbon peak driving force index. Various prefecture-level cities need to comprehensively consider their carbon peak pressures and carbon reduction potentials in order to develop comprehensive and scientific emission reduction plans and carbon peak targets. Based on the above carbon peak pressure index and carbon emission reduction potential index, this article constructs a carbon peak driving force index, as shown below:
where Ipow is the carbon peak driving force index, and φ and ω represent the weights of the carbon peak pressure index and carbon emission reduction potential index, respectively.
Ipow = φIpi + ωIpo
5.2. Scenario Setting for Carbon Emission Prediction
According to the carbon peak judgment criteria proposed by the World Resources Institute [], carbon emissions in a certain region have already reached their peak if they show a downward trend for five years or more in the historical period after reaching their peak. In response to the Jiangsu Provincial Government’s proposed “Jiangsu Province Carbon Peak Implementation Plan”, this article sets different scenarios for the main explanatory variables affecting carbon emissions, and it predicts carbon emissions in 13 prefecture-level cities in Jiangsu Province from 2021 to 2030 based on the STIRPAT model.
Scenario analysis is a commonly used method in carbon emission prediction research. The rationality of scenario setting is crucial for accurately predicting carbon emissions. Setting up scenarios for changes in the population size, wealth level, technological level, urbanization rate, and industrial structure in 13 prefecture-level cities in Jiangsu Province, the closer this setting is to reality, the greater the reference significance for management decision making. According to the “14th Five Year Plan for National Economic and Social Development of Jiangsu Province and the Long Range Objectives for 2035”, Jiangsu Province expects to achieve an urbanization rate of 75% by 2025. Therefore, it is assumed that Jiangsu Province can achieve an urbanization rate of 80% by 2030. Based on this, it is set that the urbanization rate in Jiangsu Province will increase by 1.1% annually from 2020 to 2022, 1.0% annually from 2023 to 2025, and 0.9% annually from 2026 to 2030. Due to the announced urbanization rates of various prefecture-level cities in Jiangsu Province from 2020 to 2022, the scenario settings for the urbanization rates are basically equivalent to the actual situation. At the same time, assuming that the proportion of the tertiary industry in Jiangsu Province reaches 70% by 2030, it is set that the proportion of the tertiary industry in Jiangsu Province will increase by 3% annually from 2020 to 2030. In the scenario setting, only one scenario that is suitable for one’s own development will be designed for the urbanization rate and industrial structure proportion, while three scenarios will be set for the permanent population, per capita GDP, and energy consumption intensity for reference.
According to calculations, the average population growth rate of Jiangsu Province from 2017 to 2022 was 0.34%, and the future population growth in Jiangsu Province will tend to be stable []. Therefore, the population growth rate of Jiangsu Province from 2020 to 2030 is set as shown in Table 5.
Table 5.
Population development scenario setting in Jiangsu Province from 2020 to 2030.
After calculation, it was found that the growth rate of the per capita GDP in Jiangsu Province slowly decreased from 2001 to 2019. According to the “14th Five Year Plan for National Economic and Social Development of Jiangsu Province and the Long Range Objectives for 2035”, Jiangsu Province expects to maintain stable and healthy economic development in the future. Based on this, the per capita GDP growth rate of Jiangsu Province from 2020 to 2030 is set as shown in Table 6.
Table 6.
Per capita GDP development scenario setting in Jiangsu Province from 2020 to 2030.
The report “Jiangsu’s Effectiveness in Coping with Climate Change (2020–2021)” points out that the energy consumption intensity in Jiangsu Province has cumulatively decreased by 46.4% over the past decade, with an average annual decrease of 5.8%. According to the “14th Five Year Plan for National Economic and Social Development of Jiangsu Province and the Long Range Objectives for 2035”, the goal is to reduce the carbon emission intensity by more than 65% by 2030 compared to 2005, and an average annual decrease of 4% is required. Based on this, the rate of decrease in the energy consumption intensity in Jiangsu Province from 2020 to 2030 is set as shown in Table 7.
Table 7.
Energy consumption intensity development scenario setting in Jiangsu Province from 2020 to 2030.
5.3. Carbon Peak Prediction Results and Analysis
Based on the regression results of the STIRPAT model, four different scenarios were set up to predict the carbon emissions of various prefecture-level cities in Jiangsu Province from 2021 to 2030. In the high-growth, slow-consumption scenario (P1G1E1), the rapid development of the economy and society has led to a significant increase in carbon emissions, while the slow improvement in the technological level has slowed down the rate of carbon reduction, and the rate of carbon peaking in various prefecture-level cities is very slow. In the high-growth, fast-consumption scenario (P1G1E2), the rapid development of the economy and society has led to an increase in carbon emissions, and the rapid improvement in the technological level has promoted the rate of carbon reduction. The carbon peak in various prefecture-level cities depends on the balance between the two. In the low-growth, slow-consumption scenario (P2G2E1), the slow development of the economy and society leads to the slow growth of carbon emissions, and the slow improvement in the technological level slows down the rate of carbon reduction. The carbon peak in various prefecture-level cities depends on the balance between the two. In the low-growth, fast-consumption scenario (P2G2E2), the slow development of the economy and society has led to the slow growth of carbon emissions, while the rapid increase in the technological level has increased the rate of carbon reduction, and the rate of carbon peaking in various prefecture-level cities is very fast.
Among the 13 prefecture-level cities, Nantong, Huai’an, Yancheng, Suzhou, Nanjing, and Wuxi can achieve carbon peak before 2030 in all four scenarios, as shown in Figure 7. Due to the slowdown in economic and social development, the permanent population has continued to grow negatively. Nantong, Huai’an, and Yancheng achieved carbon peaking in 2010, 2015, and 2015, respectively, with peak emissions of 58 million tons, 38 million tons, and 37 million tons, respectively. Suzhou, Nanjing, and Wuxi will achieve carbon peak from 2024 to 2027, with average peak emissions of 212 million tons, 127 million tons, and 115 million tons for the four scenarios, respectively. These three prefecture-level cities have begun to shift from high-speed growth to high-quality growth, making it easier to achieve carbon peak.
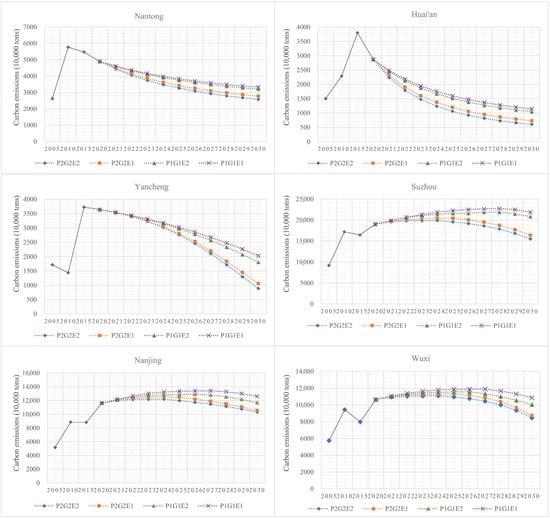
Figure 7.
Carbon emission prediction for prefecture-level cities with the first carbon peak.
Changzhou, Xuzhou, Yangzhou, Taizhou, Suqian, Lianyungang, and Zhenjiang are all able to achieve carbon peak between 2025 and 2029 under the low-growth, slow-consumption scenario (P2G2E1) and low-growth, fast-consumption scenario (P2G2E2), but they cannot achieve carbon peak before 2030 under the high-growth, slow-consumption scenario (P1G1E1) and high-growth, fast-consumption scenario (P1G1E2), as shown in Figure 8. The average peak emissions of these seven prefecture-level cities under the four scenarios are 85 million tons, 100 million tons, 49 million tons, 51 million tons, 66 million tons, 67 million tons, and 29 million tons, respectively. These seven prefecture-level cities are still in a stage of rapid economic growth and have taken on carbon-intensive industries transferred from developed cities; thus, it will be difficult for them to achieve carbon peak first.
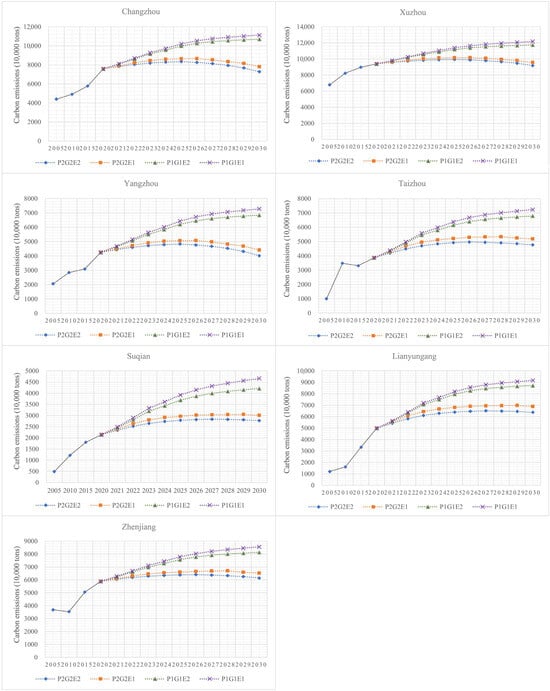
Figure 8.
Carbon emission prediction for prefecture-level cities with difficulty in carbon peaking.
5.4. Research on Carbon Peak Driving Force
5.4.1. Carbon Peak Pressure
According to Formula (5), a carbon peak pressure index model was constructed to calculate the carbon peak pressures of various prefecture-level cities in Jiangsu Province. The results are shown in Table 8. Target pressure originates from the target assessment of the superior department and belongs to external pressure. Responsibility pressure and primary pressure are internal pressures generated by the carbon emissions and growth rates of various prefecture-level cities. External pressure has the same priority as internal pressure; therefore, γ = δ + θ = 0.5. In addition, various prefecture-level cities should take a provincial perspective and prioritize their responsibility for achieving carbon peak throughout the province, before considering the pressure to slow down the growth rate of carbon emissions. Therefore, δ > θ. Considering the priority of different pressure indicators, the weights of the target pressure indicators, responsibility pressure indicators, and primary pressure indicators are set to 0.5, 0.3, and 0.2, respectively. From Table 8, it can be seen that among the 13 prefecture-level cities, Lianyungang, Suqian, Taizhou, and Zhenjiang face significant carbon peak pressures, with carbon peak pressure indices all exceeding 0.60. The carbon peak pressures in Nantong, Yancheng, and Huai’an are relatively low, with carbon peak pressure indices below 0.20. The carbon peak pressures in the other prefecture-level cities are moderate, with carbon peak pressure indices of around 0.40.
Table 8.
Assessment of carbon peak pressures in various prefecture-level cities in Jiangsu Province.
5.4.2. Carbon Reduction Potential
According to Formula (6), a carbon emission reduction potential index model was constructed to calculate the carbon emission reduction potentials of various prefecture-level cities. The results are shown in Table 9. When evaluating the potential for emission reduction, it is necessary to balance fairness and efficiency, so the weights of both the efficiency potential indicators and fairness potential indicators are set to 0.5. Among the 13 prefecture-level cities, Zhenjiang and Xuzhou have significant potential for carbon reduction, with indexes exceeding 0.80. The carbon reduction potential of Yancheng is relatively small, with an index of 0.12. The carbon reduction potentials of other prefecture-level cities are moderate, with indexes ranging from 0.30 to 0.80.
Table 9.
Evaluation of carbon emission reduction potential in various prefecture-level cities in Jiangsu Province.
5.4.3. Carbon Peak Driving Force
According to Formula (7), a carbon peak driving force index model was constructed to calculate the carbon peak driving forces of various prefecture-level cities. The results are shown in Table 10. Considering that carbon peak is a target assessment, various prefecture-level cities, regardless of their emission reduction potentials, must help achieve carbon peak throughout the province by 2030. Therefore, the priority of the pressure index should be higher than that of the potential index; that is, φ > ω, with the weights set to 0.6 and 0.4, respectively.
Table 10.
Evaluation of carbon peak driving forces in various prefecture-level cities of Jiangsu Province.
Among the 13 prefecture-level cities, Zhenjiang has the highest carbon peak driving force, and all three indices are relatively high. We need to focus on low-carbon transformation in industries such as energy extraction and processing and the chemical industry, introduce advanced low-carbon technologies, and achieve carbon peak as soon as possible.
The carbon peak driving forces in Lianyungang, Xuzhou, Changzhou, Yangzhou, Suqian, Taizhou, Suzhou, Nanjing, and Wuxi are moderate, with indices ranging from 0.45 to 0.65. Lianyungang, Suqian, and Taizhou face significant pressure to peak carbon emissions and have little potential for carbon reduction. They belong to low-carbon-nurturing cities and need to focus on the utilization of clean energy, optimize their energy consumption structures, and strengthen their carbon neutrality reserves.
The carbon peak pressures in Xuzhou, Changzhou, Yangzhou, Suzhou, Nanjing, and Wuxi are not significant, but the potential for carbon reduction is considerable. Xuzhou, Changzhou, and Yangzhou are high-quality transitional cities that need to focus on cultivating strategic emerging industries, achieving low-carbon industrial development and high-quality transformation. Suzhou, Nanjing, and Wuxi are demonstration cities for carbon peaking, and they need to focus on comprehensive emission reduction in construction, transportation, and daily life, build a low-carbon transportation network system, and increase research and development efforts in low-carbon technology. Through technology spillover effects, they can support and help other regions achieve carbon peaking as soon as possible.
The carbon peak driving forces of Nantong, Huai’an, and Yancheng are relatively small, and the three indices of these prefecture-level cities are all relatively low. As mentioned earlier, the economic and social development of Nantong, Huai’an, and Yancheng is slowing down, and carbon peak can be achieved as quickly as possible without taking any measures.
6. Discussion and Conclusions
Environmental issues related to global warming have become major challenges in the process of economic and social development, and developing a low-carbon economy is an effective way to address global climate change. Jiangsu Province has always been a major economic province in China, with prominent issues of high energy consumption and emissions. The task of controlling carbon emissions in Jiangsu Province is extremely challenging. Therefore, identifying the influencing factors of carbon emissions in Jiangsu Province and predicting the carbon peak time of each prefecture-level city is of great significance for proposing differentiated carbon peak implementation paths and effectively reducing carbon emissions.
This article selects relevant data from Jiangsu Province from 2005 to 2020 and uses the STIRPAT model to analyze the impacts of factors such as the population size, economic and social development level, and energy consumption intensity on carbon emissions in Jiangsu Province and the three major regions (southern, central, and northern Jiangsu). The results show that the population size, wealth level, technological level, urbanization level, and industrial structure can significantly affect carbon emissions in Jiangsu Province. Based on the regression results of the model, the carbon emissions and peak time of carbon emissions in 13 prefecture-level cities from 2021 to 2030 were predicted. Six prefecture-level cities, including Nantong, Huai’an, Yancheng, Suzhou, Nanjing, and Wuxi, can achieve carbon peak before 2030 under all four scenarios; Changzhou, Xuzhou, Yangzhou, Taizhou, Suqian, Lianyungang, and Zhenjiang are all able to achieve carbon peak between 2025 and 2029 under the low-growth, slow-consumption scenario (P2G2E1) and low-growth, fast-consumption scenario (P2G2E2), but they cannot achieve carbon peak before 2030 under the high-growth, slow-consumption scenario (P1G1E1) and high-growth, fast-consumption scenario (P1G1E2). The study finally calculated the carbon peak pressures, carbon emission reduction potentials, and carbon peak driving forces for various prefecture-level cities and found that the three indices in Zhenjiang were all relatively high. The carbon peak driving forces in Lianyungang, Xuzhou, Changzhou, Yangzhou, Suqian, Taizhou, Suzhou, Nanjing, and Wuxi are moderate. Nantong, Huai’an, and Yancheng have relatively low carbon peak driving forces, and the carbon peak pressures and carbon emission reduction potentials of these three prefecture-level cities are the lowest among all the prefecture-level cities. Based on this, relevant suggestions are proposed:
(1) Vigorously develop the tertiary industry and gradually reduce the proportion of the secondary industry. Economically developed prefecture-level cities within the province should take the lead in adjusting their industrial structures, while regions that rely on the development of the secondary industry should gradually transform their related secondary industries while maintaining stable economic development. Especially for some high-polluting and high-emitting secondary industries, strict governance should be implemented to embark on a low-carbon development path;
(2) Increase the research and development, promotion, and application of low-carbon technologies. In practice, due to high costs, most enterprises have low enthusiasm. Therefore, enterprises that actively respond to policies and use low-carbon technologies should be rewarded and supported, and regular supervision should be implemented;
(3) Strengthen the active promotion of low-carbon environmental protection concepts. The population size is a significant factor affecting carbon emissions in Jiangsu Province. Therefore, it is necessary to actively strengthen the promotion of low-carbon environmental protection concepts, and to encourage people to travel low-carbon and consume green.
Due to insufficient data on the industrial structure, urbanization, and other factors, the development of carbon emission scenario studies for 13 prefecture-level cities in Jiangsu Province was constrained to some extent. In the future, further research on urban carbon emission scenarios can be carried out in the following directions: (1) facing the policy background of carbon neutrality and 1.5 °C temperature control goals by 2060, incorporating factors such as industrial structures and urbanization, deepening the settings of the carbon emission scenarios and prediction parameters, and providing theoretical support for carbon reduction measures and path selection for China’s urban carbon peak and carbon neutrality; (2) further expanding the research scope, conducting more extensive research on urban carbon emission scenarios and comparing carbon peak paths, and exploring the universal and tailored urban carbon peak paths in China at the national scale.
Author Contributions
Methodology, Y.W.; Formal analysis, L.D.; Resources, L.D.; Data curation, Y.W.; Writing—original draft, Y.W.; Funding acquisition, L.D. All authors have read and agreed to the published version of the manuscript.
Funding
The authors are grateful for the Research Fund support of the Jiangsu Education Department (General Project for Philosophy and Social Science Research of Jiangsu Universities: Research on the Carbon Emission Reduction Benefits and Optimization Path of Energy Saving Renovation of Existing Public Buildings in Nanjing City, Grant no. 2023SJYB0217).
Institutional Review Board Statement
Not applicable.
Informed Consent Statement
Not applicable.
Data Availability Statement
The data presented in this study are available on request from the corresponding author.
Conflicts of Interest
The authors declare no conflict of interest.
References
- Lei, L.P.; Zhong, H.; He, Z.H.; Cai, B.F.; Yang, S.Y.; Wu, C.J.; Zeng, Z.C.; Liu, L.Y.; Zhang, B. Satellite remote sensing observation and evaluation of atmospheric CO2 concentration changes caused by anthropogenic emissions. Sci. Bull. 2017, 62, 2941–2950. [Google Scholar]
- Liu, K.; Lin, B. Research on Influencing Factors of Environmental Pollution in China: A Spatial Econometric Analysis. J. Clean. Prod. 2019, 206, 356–364. [Google Scholar] [CrossRef]
- BP. BP Statistical Review of World Energy 2020; White House Associates: London, UK, 2020. [Google Scholar]
- Xie, Z.H. Report of the State Council on the Work of Responding to Climate Change. In Proceedings of the Standing Committee of the 11th National People’s Congress, Beijing, China, 24 August 2009; Volume 6, pp. 585–590. [Google Scholar]
- Li, J.F.; Chai, Q.M.; Ma, C.M.; Wang, J.J.; Zhou, Z.Y.; Wang, T. China’s Climate Change Policy and Market Outlook. China Energy 2016, 38, 5–11+21. [Google Scholar]
- Zhang, H. Can low-carbon city pilot policies reduce carbon emissions—Evidence from quasi natural experiments. Econ. Manag. 2020, 42, 25–41. [Google Scholar]
- Li, Y.; Wei, Y.G.; Zhang, X.L.; Tao, Y. Regional and provincial CO2 emission reduction task decomposition of China’s 2030 carbon emission peak based on the efficiency, equity and synthesizing principles. Struct. Chang. Econ. Dyn. 2020, 53, 237–256. [Google Scholar] [CrossRef]
- Wu, H. Regional Carbon Reduction in China: Spatial and Temporal Patterns, Evolutionary Mechanisms, and Policy Suggestions: Theory and Methods Based on Spatial Econometrics. World Manag. 2015, 11, 3–10. [Google Scholar]
- Wang, Q.; Li, L.J. The effects of population aging, life expectancy, unemployment rate, population density, per capita GDP, urbanization on per capita carbon emissions. Sustain. Prod. Consum. 2021, 28, 760–774. [Google Scholar] [CrossRef]
- Du, H.B.; Wei, W.; Zhang, X.Y.; Ji, X.P. The spatiotemporal pattern evolution and influencing factors of carbon emissions from energy consumption in the Yellow River Basin: Based on DMSP/OLS and NPP/VIIRS nighttime light data. Geogr. Res. 2021, 40, 2051–2065. [Google Scholar]
- Zeng, H.Y.; Yue, H. Industrial Structure, Foreign Trade, and Carbon Emissions: An Empirical Analysis Based on 41 Prefectural Cities in the Yangtze River Delta Region. Ind. Technol. Econ. 2022, 41, 71–77. [Google Scholar]
- Xu, G.Q.; Cai, Z.; Feng, S.W. Research on spatiotemporal differences and influencing factors of carbon emissions based on two-stage LMDI model: A case study of Jiangsu Province. Soft Sci. 2021, 35, 107–113. [Google Scholar]
- Li, J.B.; Huang, X.J.; Chuai, X.W.; Yang, H. The impact of land urbanization on carbon dioxide emissions in the Yangtze River Delta, China: A multiscale perspective. Cities 2021, 116, 103275. [Google Scholar] [CrossRef]
- Yang, S.D.; Yang, X.; Wu, X.L.; Wu, Y.F.; Zhou, J. The impact of environmental regulations on regional carbon emission spatiotemporal differences: An empirical analysis based on 32 prefecture level cities in three northeastern provinces. J. Environ. Sci. 2021, 41, 2029–2038. [Google Scholar]
- Lin, B.Q.; Jiang, Z.J. Prediction of Environmental Kuznets Curve of CO2 in China and Analysis of Influencing Factors. Manag. World 2009, 4, 27–36. [Google Scholar]
- Xu, X.S.; Zhao, T.; Liu, N.; Kang, J.D. Changes of Energy-related GHG Emissions in China: An Empirical Analysis from Sectoral Perspective. Appl. Energy 2014, 132, 298–307. [Google Scholar] [CrossRef]
- Chen, J.D.; Xu, C.; Cui, L.B.; Huang, S.; Song, M.L. Driving Factors of CO2 Emissions and Inequality Characteristics in China: A Combined Decomposition Approach. Energy Econ. 2019, 78, 589–597. [Google Scholar] [CrossRef]
- Gu, S.; Fu, B.T.; Thriveni, T.; Fujita, T.; Ahn, J.W. Coupled LMDI and System Dynamics Model for Estimating Urban CO2 Emission Mitigation Potential in Shanghai, China. J. Clean. Prod. 2019, 240, 118034. [Google Scholar] [CrossRef]
- Li, Z.; Deng, X.; Peng, L. Uncovering Trajectories and Impact Factors of CO2 Emissions: A Sectoral and Spatially Disaggregated Revisit in Beijing. Technol. Forecast. Soc. Chang. 2020, 158, 120–124. [Google Scholar] [CrossRef]
- Zheng, S.W.; Li, J.; Lu, F.L.; Shen, J.W. Study on the Factors Influencing Urban Greenhouse Gas Emissions Based on LMDI Model: A Case Study of Hangzhou. Environ. Prot. Technol. 2023, 29, 6–11+18. [Google Scholar]
- Peng, J.X.; Li, X.A.; Mei, Y.K. Analysis of Factors Influencing Urban Carbon Emissions Based on LMDI Model. Energy Energy Conserv. 2023, 7, 61–64. [Google Scholar]
- Guo, C.L.; Xu, W.L. Research on the influencing factors of carbon emissions in Jiangsu Province based on the STIRPAT model. China For. Econ. 2022, 1, 89–93. [Google Scholar]
- Fei, J.; Yang, M.; Zhang, H.Y.; Yang, X.Y.; Xu, K.; Diao, Y.W.; Wu, D. Carbon emission accounting and influencing factors at the district and city scale in Jiangsu Province. Three Gorges Ecol. Environ. Monit. 2023, 8, 26–35. [Google Scholar]
- Wang, X.; Song, D.Y. Classification of carbon emission stages and international experience inspiration. China Popul. Resour. Environ. 2013, 23, 46–51. [Google Scholar]
- Zhang, Y.; Liu, C.; Chen, L.; Wang, X.; Song, X.; Li, K. Energy-related CO2 emission peaking target and pathways for China’s city: A case study of Baoding City. J. Clean. Prod. 2019, 226, 471–481. [Google Scholar] [CrossRef]
- Huang, Y.; Shen, L.; Liu, H. Grey relational analysis, principal component analysis and forecasting of carbon emissions based on long short-term memory in China. J. Clean. Prod. 2019, 209, 415–423. [Google Scholar] [CrossRef]
- Zhang, N. Research on Regional Allocation Method of National Carbon Emission Peak Target Based on CGE Model. Master’s Thesis, Tianjin University of Science and Technology, Hebei, China, 2017. [Google Scholar]
- Niu, S.; Liu, Y.; Ding, Y.; Qu, W. China’s energy systems transformation and emissions peak. Renew. Sustain. Energy Rev. 2016, 58, 782–795. [Google Scholar] [CrossRef]
- Zhao, L.; Pan, W.; Lin, H. Can Fujian Achieve Carbon Peak and Pollutant Reduction Targets before 2030? Case Study of 3E System in Southeastern China Based on System Dynamics. Sustainability 2022, 14, 11364. [Google Scholar] [CrossRef]
- Wang, F.; Yang, X.; Yang, T.; Wang, S. Empirical study on the relationship between carbon emissions and economic growth based on the EKC hypothesis. Ecol. Econ. 2018, 34, 19–23. [Google Scholar]
- Liu, J.N.; Huang, L.; Liu, Y. Analysis of Carbon Emission Reduction Pressure Based on Grey Model. Ind. Technol. Econ. 2013, 32, 150–155. [Google Scholar]
- Qiao, Z.; Meng, X.; Wu, L. Forecasting carbon dioxide emissions in APEC member countries by a new cumulative grey model. Ecol. Indic. 2021, 125, 107593. [Google Scholar] [CrossRef]
- Xie, Y.; Qin, W. Carbon Peak Prediction and Scenario Analysis in Jiangsu Province: Based on the STIRPAT Model. J. Nanjing For. Univ. 2023, 23, 54–62. [Google Scholar]
- Zhu, M.M. Prediction of Peak Industrial Carbon Emissions and Research on Carbon Reduction Strategies in Jiangsu Province. Anhui University of Technology: Anhui, China, 2022. [Google Scholar]
- Cao, G.X.; Zhang, L. Analysis of influencing factors and trend prediction of carbon emissions in key industries in Jiangsu Province under the carbon peak target. Yuejiang Acad. J. 2022, 14, 129–140+175. [Google Scholar]
- Fang, K.; Tang, Y.Q.; Zhang, Q.F.; Song, J.N.; Wen, Q.; Sun, H.P.; Ji, C.Y.; Xu, A.Q. Will China peak its energy-related carbon emissions by 2030? Lessons from 30 Chinese provinces. Appl. Energy 2019, 255, 113852. [Google Scholar] [CrossRef]
- Ehrlich, P.R.; Holdren, P. Impact of Population Growth. Science 1971, 171, 1212–1217. [Google Scholar] [CrossRef] [PubMed]
- Dietz, T.; Rosa, E.A. Rethinking the Environmental Impacts of Population, Affluence and Technology. Hum. Ecol. Rev. 1994, 1, 277–300. [Google Scholar]
- Pachauri, R.K.; Meyer, L.; Working Groups. Climate Change 2014: Synthesis Report; IPCC: Geneva, Switzerland, 2015. [Google Scholar]
- Zhao, Z.; Tan, J.L. Analysis of the dual effects of China’s fiscal expenditure on carbon emissions. J. Yunnan Univ. Financ. Econ. 2020, 36, 24–36. [Google Scholar]
- Liu, S.L.; Cao, Q.R.; Zheng, W. Analysis of Factors Influencing Government Expenditure and Carbon Emissions: A Panel Empirical Study Based on STIRPAT Extended Model. China Coal 2018, 44, 28–32. [Google Scholar] [CrossRef]
- Liu, L.L. The Impact of China’s Aging Population on Carbon Emission Intensity; Party School of the Jiangsu Provincial Committee of the Communist Party of China: Jiangsu, China, 2023. [Google Scholar]
- Rich, D.; Bhatia, P.; Finnegan, J.; Levin, K.; Mitra, A. Mitigation Goal Standard; World Resources Institute: Washington, DC, USA, 2014. [Google Scholar]
- Li, X.X. Simulation Study on Population Prediction in Jiangsu Province Based on System Dynamics. Manag. Obs. 2019, 9, 76–78. [Google Scholar]
Disclaimer/Publisher’s Note: The statements, opinions and data contained in all publications are solely those of the individual author(s) and contributor(s) and not of MDPI and/or the editor(s). MDPI and/or the editor(s) disclaim responsibility for any injury to people or property resulting from any ideas, methods, instructions or products referred to in the content. |
© 2024 by the authors. Licensee MDPI, Basel, Switzerland. This article is an open access article distributed under the terms and conditions of the Creative Commons Attribution (CC BY) license (https://creativecommons.org/licenses/by/4.0/).