Article

Geothermal Resource Assessment and Development Recommendations for the Huangliu Formation in the Central Depression of the Yinggehai Basin

1
College of Energy, Chengdu University of Technology, Chengdu 610059, China
2
State Key Laboratory of Oil and Gas Reservoir Geology and Development Engineering, Chengdu University of Technology, Chengdu 610059, China
3
College of Earth and Planetary Sciences, Chengdu University of Technology, Chengdu 610059, China
*
Author to whom correspondence should be addressed.
Sustainability 2024, 16(16), 7104; https://doi.org/10.3390/su16167104
Submission received: 13 May 2024 / Revised: 5 July 2024 / Accepted: 11 July 2024 / Published: 19 August 2024

Abstract

:
As a renewable resource, geothermal energy plays an increasingly important role in global and regional energy structures. Influenced by regional tectonic activities, multi-stage thermal evolution, and continuous subsidence, the subsurface temperatures in the Yinggehai Basin has been consistently rising, resulting in the formation of multiple geothermal reservoirs. The Neogene Huangliu Formation, with its high geothermal gradients, suitable burial depths, considerable thickness, and wide distribution, provides excellent geological conditions for substantial geothermal resources. However, the thermal storage characteristics and geothermal resources of this formation have not been fully assessed, limiting their effective development. This study systematically collected and analyzed drilling, geological, and geophysical data to examine these reservoirs’ geometric structures, thermal properties, and physical characteristics. Further, we quantitatively evaluated the geothermal resource potential of the Huangliu Formation and its respective reservoirs through volumetric estimation and Monte Carlo simulations, pointing zones with high geothermal prospects and formulating targeted development strategies. The findings indicate: (1) The Yinggehai Basin exhibits an average geothermal gradient of 39.4 ± 4.7 °C/km and an average terrestrial heat flow of 77.4 ± 19.1 mW/m2, demonstrating a favorable geothermal background; (2) The central depression of the Huangliu Formation harbors considerable geothermal resource potential, with an average reservoir temperature of 140.9 °C, and a total geothermal resource quantified at approximately 2.75 × 10²⁰ J, equivalent to 93.95 × 10⁸ tec. Monte Carlo projections estimate the maximum potential resource at about 3.10 × 10²⁰ J, approximately 105.9 ×10⁸ tec. (3) Additionally, the R14 and R23 reservoirs have been identified as possessing the highest potential for geothermal resource development. The study also proposes a comprehensive utilization model that integrates offshore geothermal power generation with multiple applications. These findings provide a method for the evaluation of geothermal resources in the Yinggehai Basin and lay a foundation for the sustainable development of resources.

1. Introduction

As the most significant active carbon reservoir on Earth, the ocean is a crucial component of the blue economy. It plays a significant role in sequestering more than half of the global carbon. China is a major maritime nation with 18,000 km and an island boundary line of 14,000 km. This indicates its enormous potential for marine carbon sink development and a solid foundation [1]. China has been progressively developing clean energy sources such as offshore wind power, photovoltaics, tidal energy, and geothermal energy in recent years. Exploring a multi-energy integration model for clean energy development in the ocean will be a critical pathway to achieving marine carbon neutrality [2]. Among these, the development and utilization of marine geothermal energy hold broad prospects and abundant reserves, making it an indispensable new force in marine carbon neutrality.
China’s nearby seas include the four major maritime areas: the Bohai Sea, the Yellow Sea, the South China Sea, and the East China Sea. Numerous basins, such as the Pearl River Mouth Basin, the Beibu Gulf Basin, the Qiongdongnan Basin, and the Yinggehai Basin, are developed within and adjacent to these maritime areas [3]. The seabed basins are influenced by the complex interplay of multiple tectonic plates, including the Eurasian Plate, the Indo-Australian Plate, and the Pacific Plate. The geotectonic background and the deep processes of the lithosphere are highly intricate. The seafloor spreading processes and the upwelling of heat from the asthenosphere collectively shape the current geothermal characteristics of submarine basins [3,4,5].
Previous studies have shown that the geothermal gradient and heat flow in the Yinggehai Basin are higher than the average values in mainland China. Thermal fluid activity is present in the basin. Many traces and evidence of thermal fluid activity can be seen along the paths and channels of thermal fluid intrusion in deep and shallow strata [6,7,8,9]. The Neogene Huangliu Formation is a crucial target layer for oil and gas exploration in the Yinggehai Basin, where significant breakthroughs have been made in natural gas exploration in recent years [7,10,11,12]. This stratum has a geothermal gradient exceeding 4 °C/100 m and a pressure coefficient greater than 1.6, providing a geothermal geological background conducive to forming superior thermal reservoirs. Additionally, after years of oil and gas exploration and development, the central depression of the Yinggehai Basin in the Huangliu Formation has accumulated a wealth of exploration, geological, and geophysical data, providing solid data support and technical foundations for the exploration and development of geothermal resources. The effective development of geothermal resources is of great significance for extending the service life of gas fields and contributing to the goals of the “dual carbon strategy” [13].
The effective development of geothermal resources requires clarity on two issues: where the geothermal resources are and what their potential is. Based on previous experiences evaluating geothermal resources, the volumetric method is often used to calculate resource quantities during the early stages of exploration. However, this approach has several issues: Firstly, the distribution of geothermal resources is often uneven, and the volumetric method does not effectively divide the thermal reservoirs, which may lead to inaccurate resource assessments. Secondly, during the calculation process, it is common to assign fixed values to the geometric and physical parameters of the thermal reservoirs. This approach may overlook the actual change and uncertainty of these parameters, thereby affecting the reliability of the assessment results and constraining the effective development and utilization planning of geothermal resources [14,15].
To address these issues, this study systematically collected and organized drilling, geological, and geophysical data based on previous research on geothermal field characteristics. This allowed for the delineation of the distribution of the Neogene Huangliu Formation geothermal reservoir in the central depression of the Yinggehai Basin. Subsequently, the reservoir characteristics were systematically analyzed from the aspects of reservoir geometry, reservoir temperature, and reservoir physical properties. On this basis, the volumetric method was first used to calculate the geothermal resource quantity, followed by the application of the Monte Carlo method for further evaluation to address the uncertainty of reservoir parameters. Finally, favorable target areas were selected based on reservoir conditions, and recommendations for development and utilization were proposed.

2. Geological and Geothermal Settings

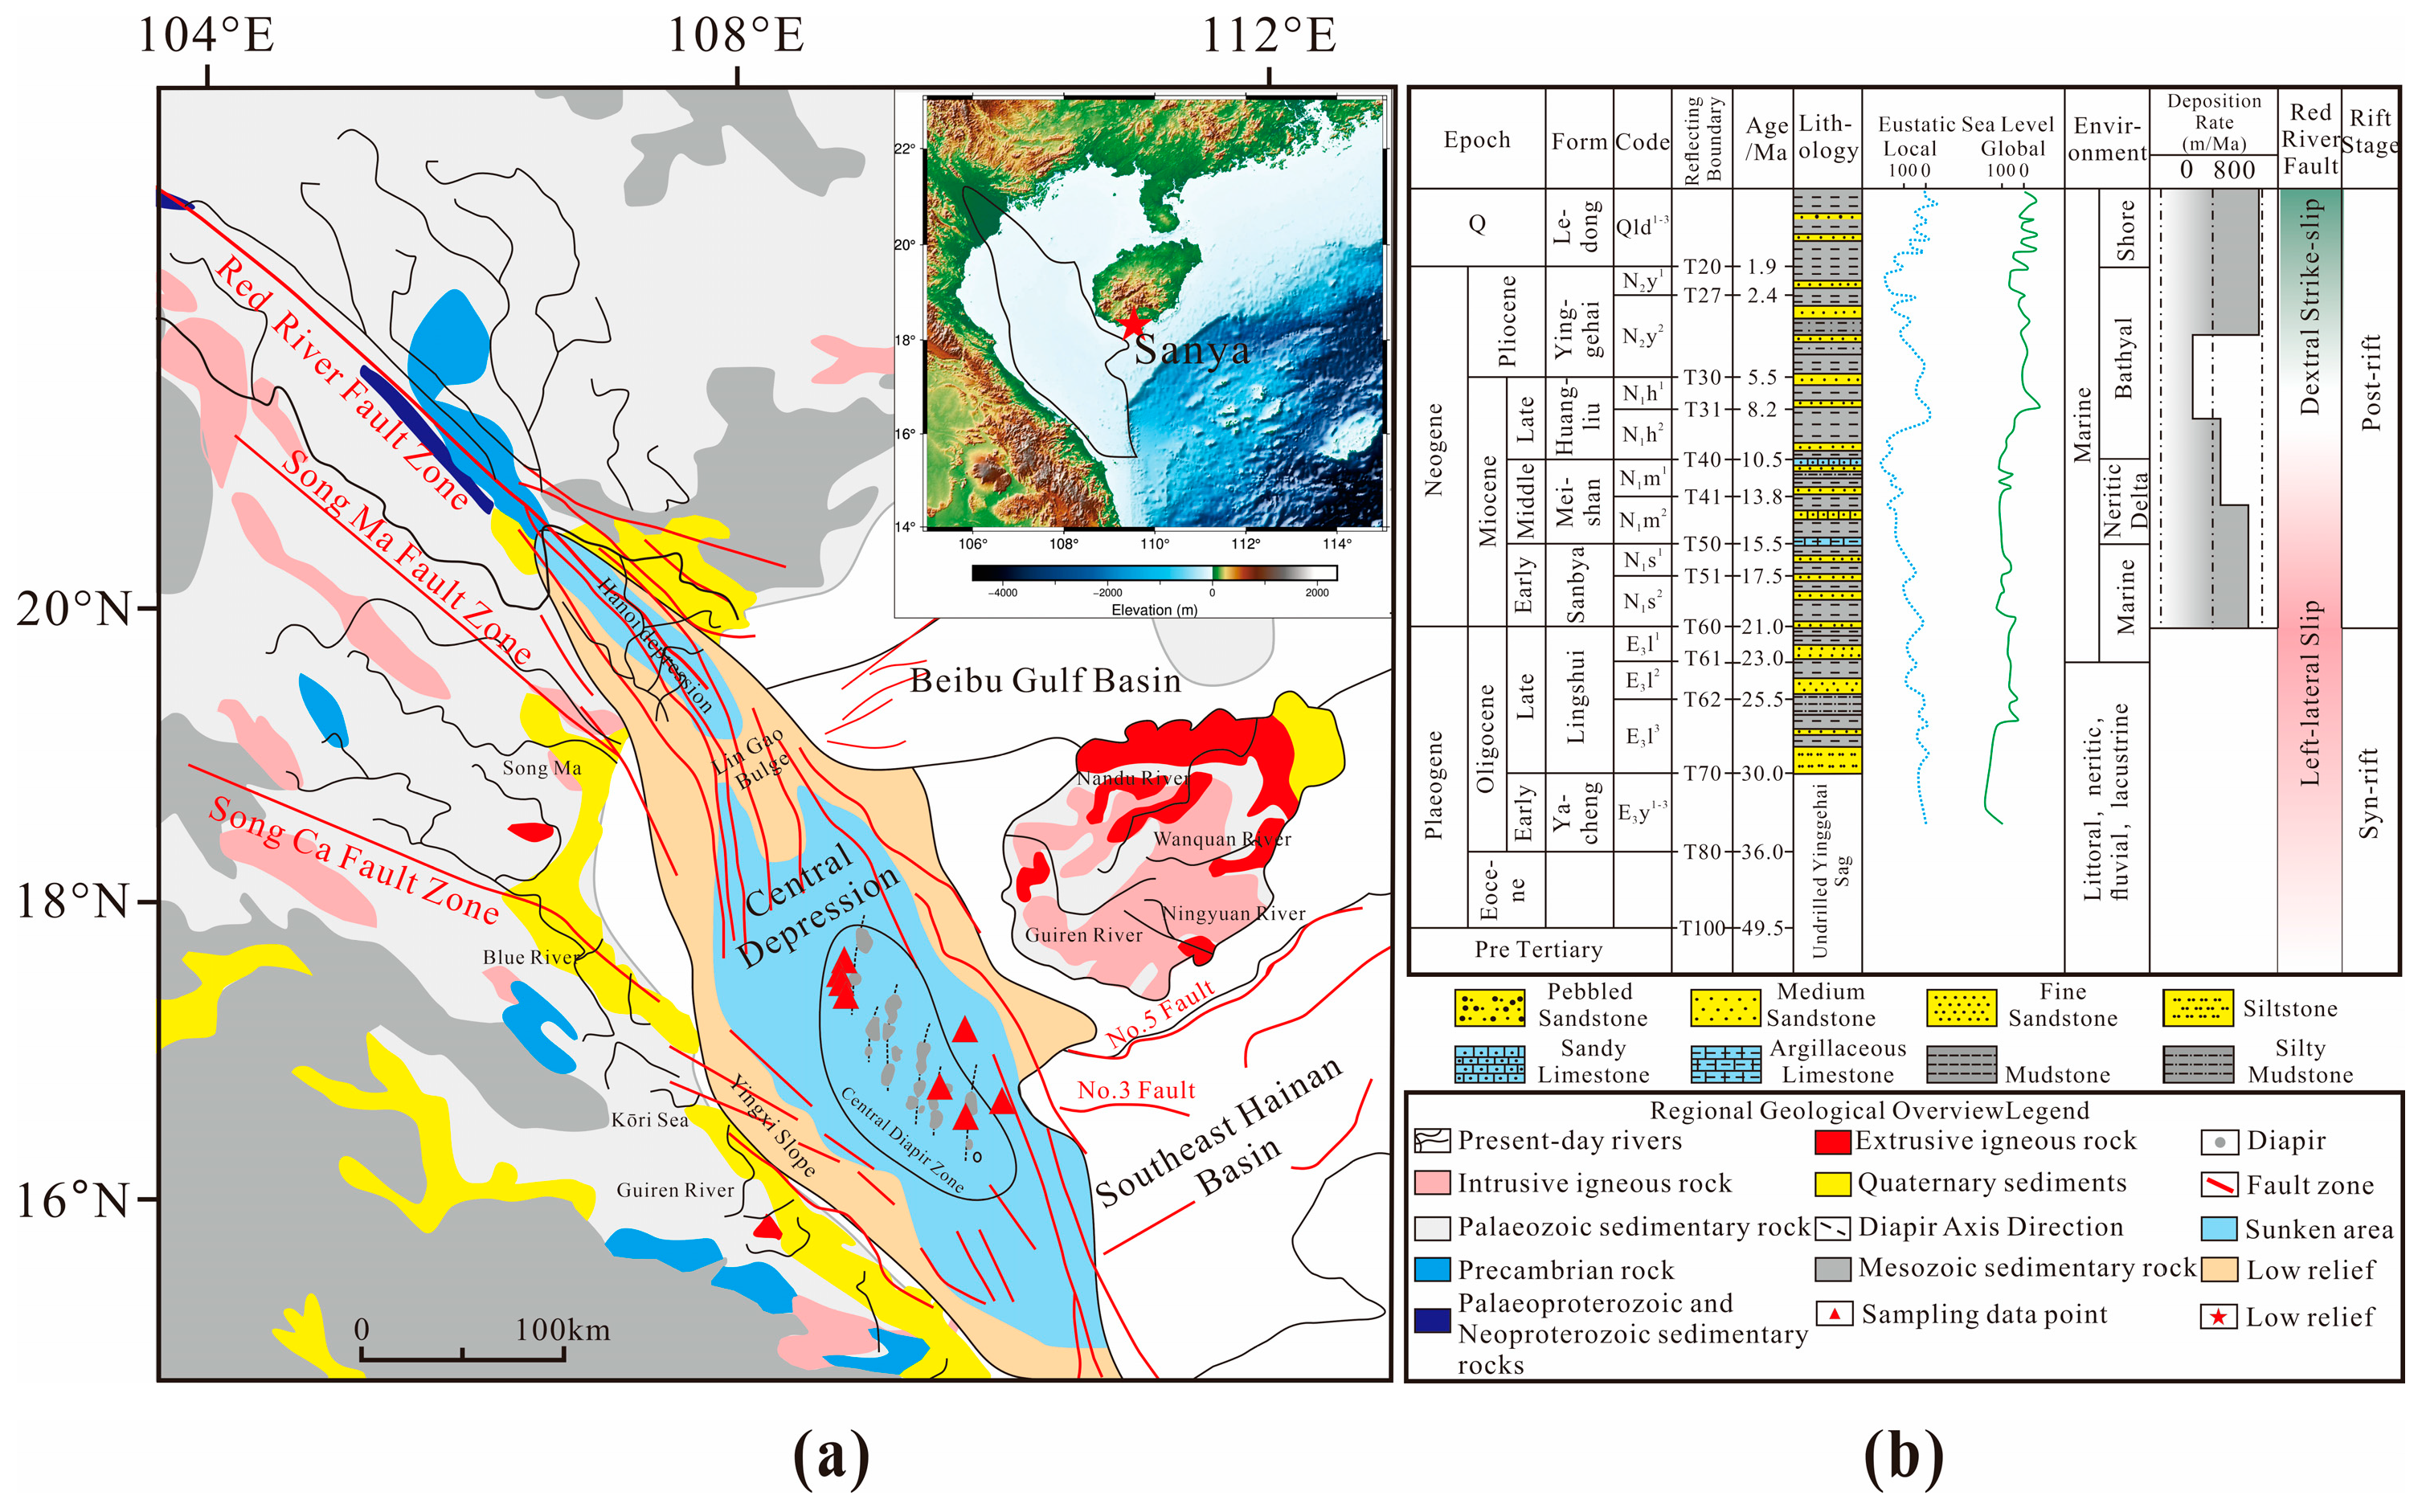
2.1. Tectonic Evolution

The Yinggehai Basin, located in the northern part of the South China Sea, lies at the collision boundary between the Indochina and South China plates. It is a Cenozoic extensional-transpressional basin [16,17]. The boundaries of the basin are defined by northwest-trending and nearly north-south trending faults, dividing it into three central tectonic units: the Yingxi Slope Zone, the Yingdong Slope Zone, and the Central Depression Zone. The Central Depression Zone is primarily characterized by the development of diapir structures [18,19,20].
Under the influence of multiple controlling factors such as the expansion of the South China Sea, the strike-slip kinematics of the Red River Fault Belt, and the compression from the Pacific Plate, the Yinggehai Basin has experienced four phases of regional tectonic movements from the Eocene to the Quaternary: (1) the rifting phase (Eocene to early Oligocene); (2) the faulting phase (late Oligocene); (3) the post-rifting thermal subsidence phase (early to middle Miocene); and (4) the post-rifting accelerated subsidence phase (late Miocene to Quaternary) [21]. The sedimentary fill sequence primarily consists of Paleogene–Quaternary deposits arranged from bottom to top (Figure 1).
  • Eocene Lingtou Formation (T100–T80): The lithology mainly consists of conglomeratic sandstone and mudstone.
  • Lower Oligocene Yacheng Formation (T80–T70): The lithology mainly includes mud conglomerate, mud gravel sandstone, and mudstone.
  • Upper Oligocene–Lower Miocene Lower Lingshui Formation (T70–T60): Subdivided into three sections (T60–T61, T61–T62, T62–T70), with lithology mainly comprising fine to coarse sandstone, gravel sandstone, and mudstone.
  • Lower Miocene Sanya Formation (T60–T50): Subdivided into two sections (T50–T51, T51–T60), with lithology mainly consisting of sandy mudstone, mudstone, gravel sandstone, and unsorted sandstone to fine sandstone.
  • Middle Miocene Meishan Formation (T50–T40): Subdivided into two sections (T40–T41, T41–T50), with lithology mainly comprising sandstone, siltstone, and mudstone.
  • Upper Miocene Huangliu Formation (T40–T30): Subdivided into two sections (T30–T31, T31–T40), with lithology mainly consisting of mudstone, silty mudstone, and muddy siltstone.
  • Pliocene Yinggehai Formation (T30–T20): The lithology mainly includes medium to fine sandstone and mudstone.
  • Quaternary Ledong Formation (T20–T0): The lithology mainly comprises gray clay and gravel sandstone.
Regional tectonic activity, multi-phase thermal evolution, and sustained long-term subsidence in the Yinggehai Basin have led to a continuous increase in the temperatures of sedimentary layers, resulting in the formation of various thermal reservoirs [25]. Among these, the Huangliu Formation features moderate burial depth, medium porosity, and medium to low permeability [26]. Additionally, it has high temperatures and pressures, considerable thickness, and extensive distribution [27], indicating significant potential for geothermal resource development.

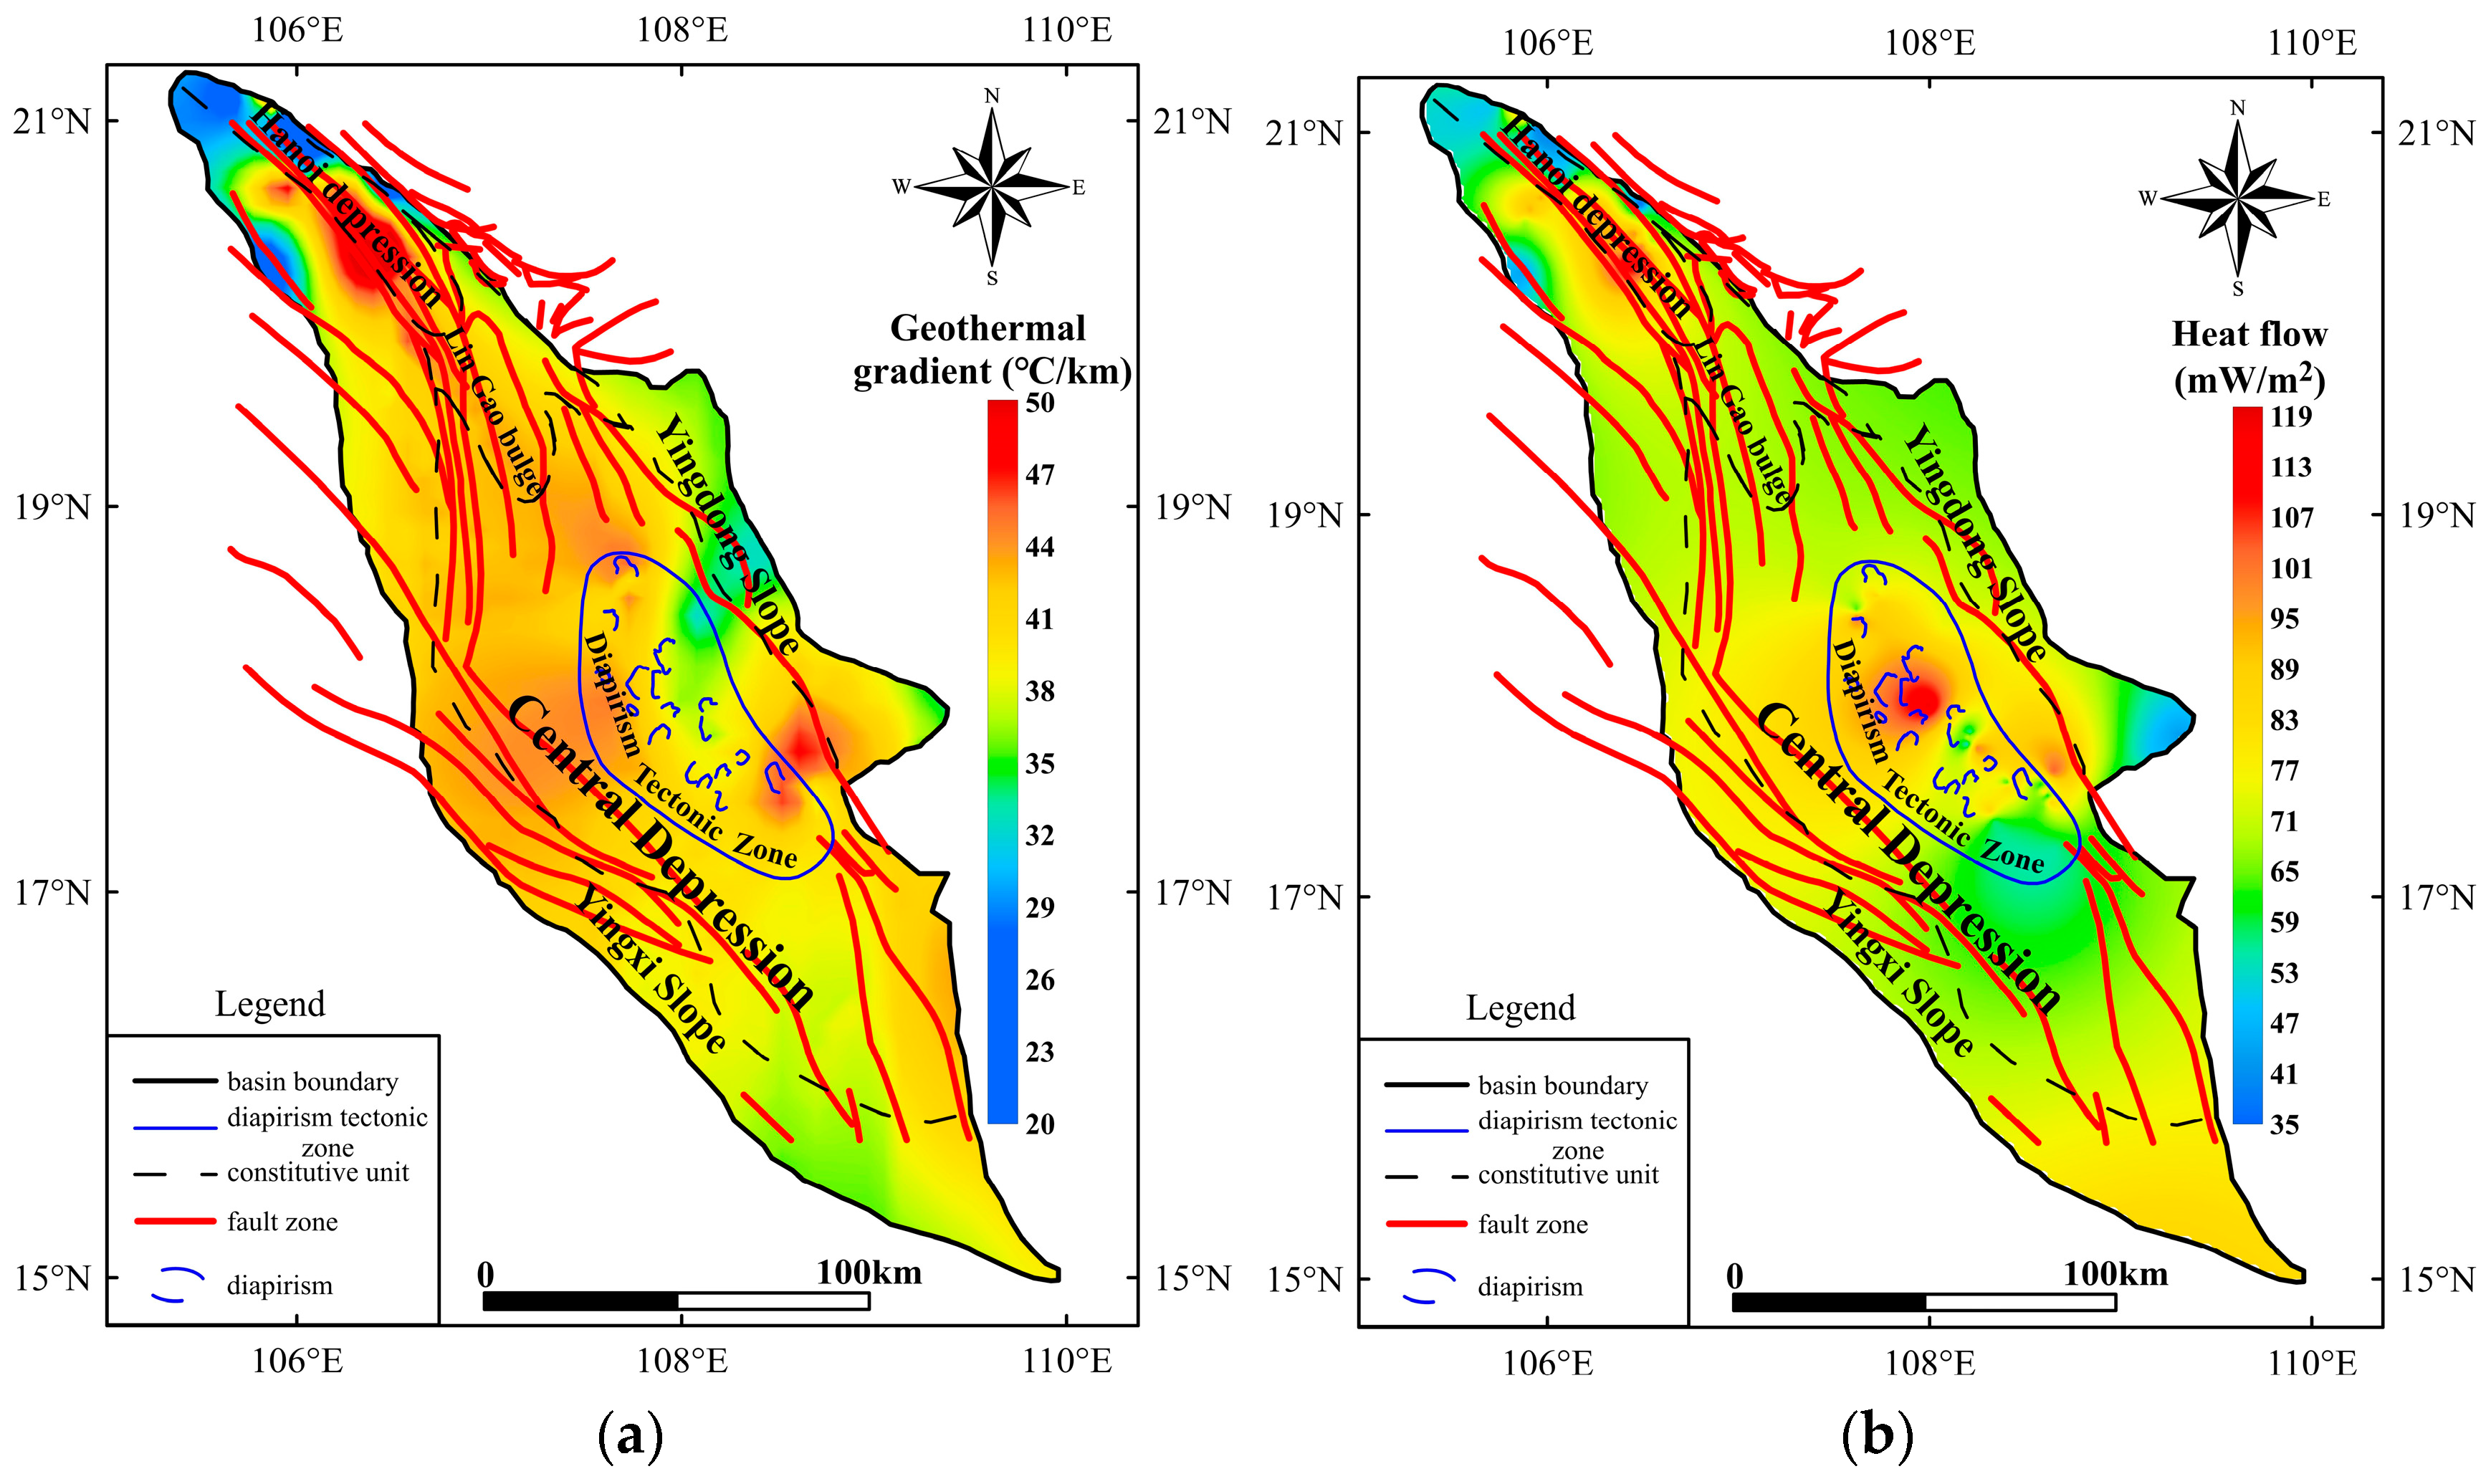
2.2. Geothermal Field Characteristics

2.2.1. Geothermal Gradient Distribution

The current geothermal field directly reflects the basin’s tectonic activity and lithospheric thermal state, playing a crucial role in understanding its deep structural thermal evolution and assessing geothermal resource potential [2,28]. In geothermal field studies, the geothermal gradient and terrestrial heat flow are fundamental parameters [29]. Building on previous research, this study integrates existing and newly acquired data, compiling 17 borehole temperature measurements. This dataset includes five Downhole Formation Tester (DST) and twelve Modular Formation Dynamics Tester (MDT) temperature data points. According to existing literature, DST data are widely recognized for accurately reflecting actual formation temperatures, while MDT data require appropriate correction before application [30,31]. For this reason, this study used the Horner correction method to adjust the MDT data [31,32,33]. The corrected MDT data were then included in the comprehensive analysis (Figure 2). The analysis showed that these data span a temperature measurement depth from 778.1 m to 4154.5 m, with formation temperatures ranging from 72.98 °C to 210.75 °C. The overall trend indicates that the formation temperature increases linearly with depth, typical of a conductive geothermal field.
In this study, we calculated the geothermal gradient using the mean value method from temperature measurement data. Using data compiled by the Global Heat Flow Data Assessment Group (2023), we obtained 103 geothermal gradient values [34]. To address data gaps, we applied the kriging interpolation method, enabling the creation of a geothermal gradient map of the Yinggehai Basin (see Figure 3a). Analysis indicates that the geothermal gradient in the Yinggehai Basin typically ranges from 31.9 to 49.7 mW/m2, with an average of 39.4 ± 4.7 °C/km, which is significantly higher than the average geothermal gradient of the Chinese mainland (30 °C/km), as well as those of the East China Sea (32.7 °C/km) and the Yellow Sea (2.86 °C/km).

2.2.2. Distribution of Heat Flow

The geothermal heat flow is a comprehensive reflection of the earth’s internal heat on the surface, and it can better reflect the geothermal field characteristics of a region than other parameters [35]. In this study, 93 geothermal heat flow data points in the Yinggehai Basin were obtained through the Global Geothermal Heat Flow Database, and the geothermal heat flow distribution map of the Yinggehai Basin was drawn based on this (Figure 3b). Statistical analysis revealed that the current terrestrial heat flow values in the Yinggehai Basin range from 35 to 119 mW/m2, with an average value of 74.7 ± 16.0 mW/m2. This value exceeds the average heat flow in mainland China (61.5 ± 13.9 mW/m2) and is also higher than those recorded in the nearby Pearl River Mouth Basin (68.7 ± 11 mW/m2), Beibu Gulf Basin (65.7 ± 8.9 mW/m2), and Qiongdongnan Basin (71.1 ± 13 mW/m2) [36,37,38,39]. Notably, higher heat flow values are observed in the central part of the diapiric structures and fault zones within the Yinggehai Basin, while relatively lower heat flow values are found in the northwestern margin of the central depression and parts of the Yingdong slope. These findings underscore the close relationship between the geothermal characteristics of the Yinggehai Basin and its geological structures and stratigraphic distribution.
It is important to note that offshore geothermal data (including geothermal gradient and heat flow data) are generally of lower quality compared to continental geothermal data. This is particularly true for seafloor probe data, which are often affected by shallow subsurface factors due to their limited measurement depth. Additionally, drilling measurement data are predominantly obtained from petroleum boreholes, with temperature measurements typically taken 5 to 6 h, and up to a maximum of 20 h, after mud circulation has ceased. At this stage, the borehole temperature may not have equilibrated with the surrounding rock. Consequently, the quality of offshore geothermal data is relatively low. However, statistical analysis and trend evaluation of multiple geothermal datasets can still effectively reflect regional geothermal characteristics [3].

2.2.3. Two-Dimensional Geothermal Field Characteristics of the Basin

The current geothermal field of the basin represents the culmination of the evolution of the ancient thermal field, intricately linked to the lithospheric thermodynamic processes and the basin’s tectonic evolution. During the Cenozoic, the Yinggehai Basin experienced three significant rifting events, which notably increased the basal heat flow to approximately 70 mW/m2 (around 1.9 Ma), as shown in Figure 4a. Particularly after the Pliocene, the basin underwent considerable subsidence due to dextral strike-slip stretching activities, resulting in the formation of a sedimentary cover up to about 17 km thick. This tectonic activity coincided with lithospheric thinning, asthenospheric upwelling, and Moho uplift, as depicted in Figure 4a. In the central depression of the Yinggehai Basin, the shallowest burial depth of the Moho reaches about 22 km, while the crust is at its thinnest at approximately 5 km [25].
In order to further study the distribution characteristics of deep thermal fields in the Yinggehai Basin, this study employed deep seismic profiles jointly mapped by the South China Sea Institute of the Chinese Academy of Sciences and Kiel University’s Marine Geosciences Research Center [40]. Building on this foundation, this paper employs rock radioactivity heat generation rate data derived from these profiles by Zheng Feng et al. [41] and incorporates thermal conductivity data from adjacent regions to address the absence of the direct measurements of thermal conductivity in the deep strata of the Yinggehai Basin (Table 1) [42]. This study employs a two-dimensional steady-state heat conduction equation (Equation (1)) to simulate the deep thermal field, yielding a simulated temperature field for the Yinggehai Basin’s central depression (Figure 4b). The specific equation, parameter values, and boundary conditions used are as follows:
k T + A x , z = 0
In the model, k represents the thermal conductivity of the rock (W•m−1•k−1), T is the temperature ( ), A is the heat source (radioactive heat production of rocks, μW•m−3), x is the horizontal distance along the profile (km), z is the vertical depth. The thermophysical parameters used in the simulation are presented in the following table:
The model spans 220 km in length, with the bottom boundary at −30 km. The boundary conditions are as follows:
T x , z 0 = T 0 x
T x x L , z = T x x R , z = 0
k x , z B T z x , z B = Q B ( x )
z 0 represents the top of the model, z B the bottom of the model, x L the left boundary of the model, and x R the right boundary. T 0 is the temperature at the top, and Q B is the heat flow at the bottom. Due to the considerable depth of the profile, surface drilling temperatures cannot be used to calibrate the model. Therefore, in this study, the heat flow parameter Q B was iteratively adjusted until the simulation results approached the actual calculated heat flow data, and, finally, the construction of the two-dimensional temperature field of the basin was completed (Figure 4b).
As shown in Figure 4b, the central depression of the Yinggehai Basin exhibits a higher vertical geothermal gradient between the sedimentary layers and the upper crust, characterized by densely packed isotherms. Below this level, the isotherms become sparser, indicating a decrease in the geothermal gradient with depth. Horizontally, the highest temperatures are recorded at the base of the central depression, reaching up to 650.6 °C at the Moho. The extent of Moho uplift, degree of crustal thinning, and thickness of sedimentary layers, influenced by Cenozoic lithospheric extension and rifting activities, collectively determine the basin’s geothermal field distribution.

3. Characteristics of the Huangliu Formation Geothermal Reservoir in the Central Depression of the Yinggehai Basin

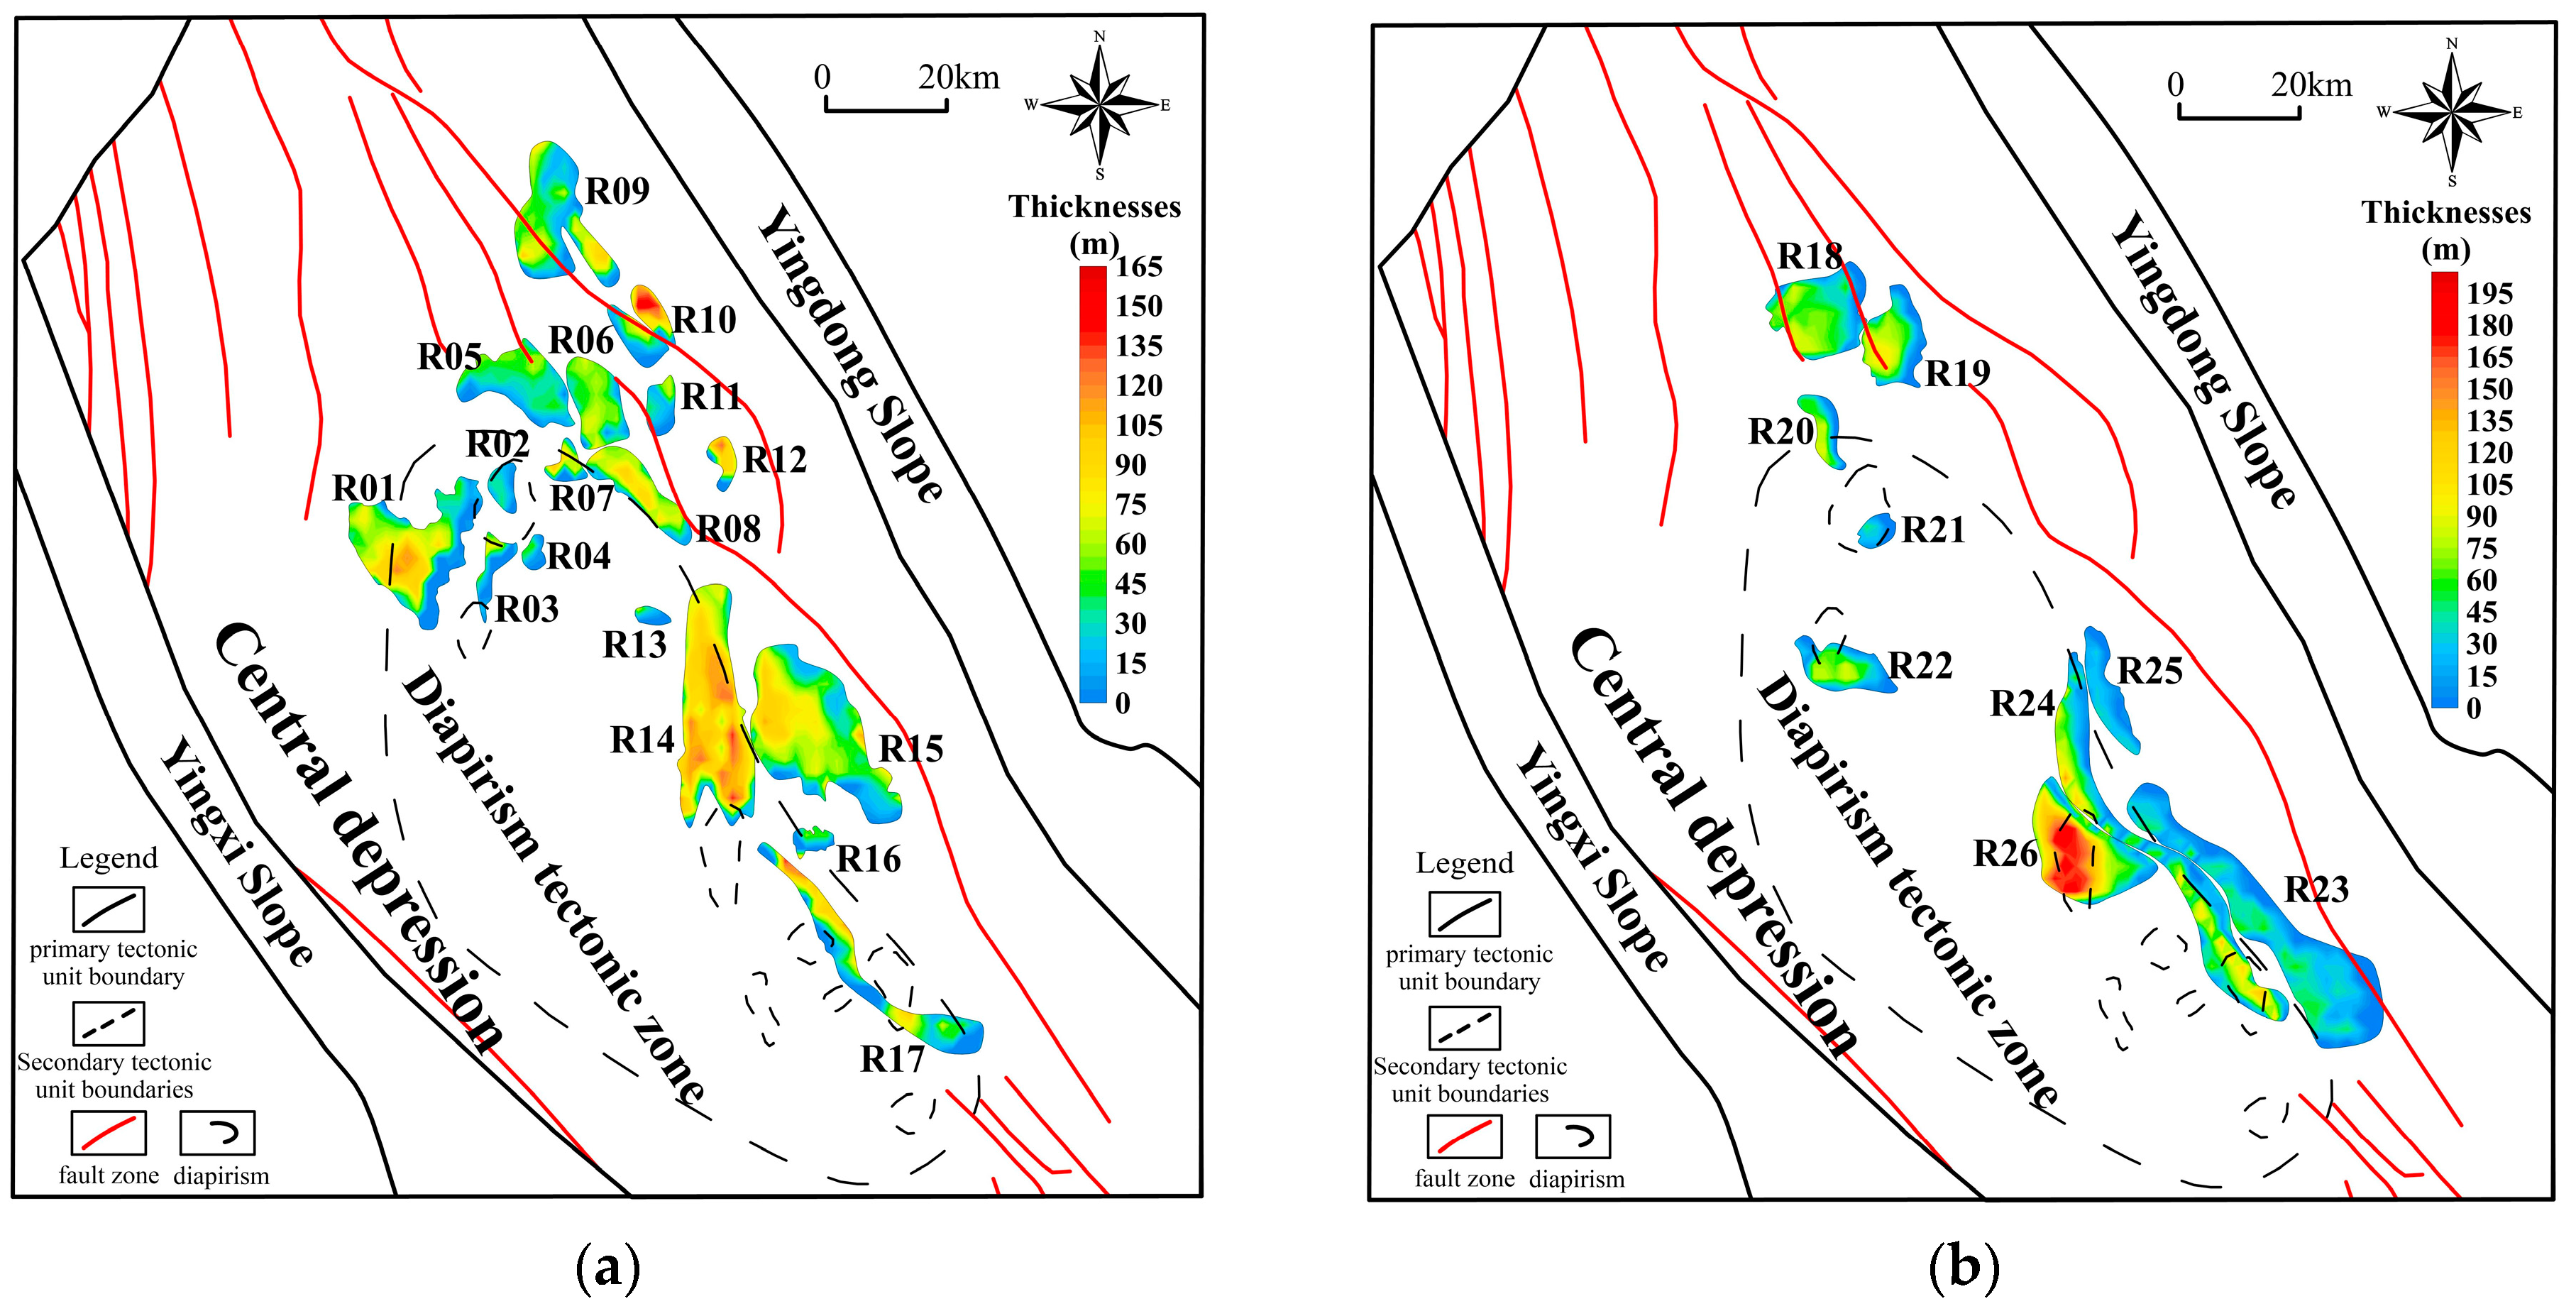
3.1. Depth and Thickness of the Top and Bottom of the Huangliu Formation Geothermal Reservoir

In this paper, 26 sandstone thermal reservoirs in the Huangliu Formation (including Members 1 and 2) in the central depression of the Yinggehai Basin were finely characterized by using well logging, seismic interpretation, and development data, and the depth and thickness of the top and bottom of each thermal reservoir were determined (Table 2). Results indicate that for Member 1 of the Huangliu Formation (T30–T31), burial depths range from 462.5 m to 4700.0 m at the top and from 567.7 m to 4805.1 m at the bottom, with average depths of 2576.8 m and 2723.6 m, respectively, and an average reservoir thickness of 50.7 m. For Member 2 of the Huangliu Formation (T31–T40), burial depths vary from 844.9 m to 4477.3 m at the top and from 2251.7 m to 5048.4 m at the bottom, with average depths of 3135.5 m and 3920.1 m, respectively, and an average reservoir thickness of 49.7 m. Additionally, a geothermal reservoir thickness map was created to visually depict the variations in reservoir thickness (Figure 5).

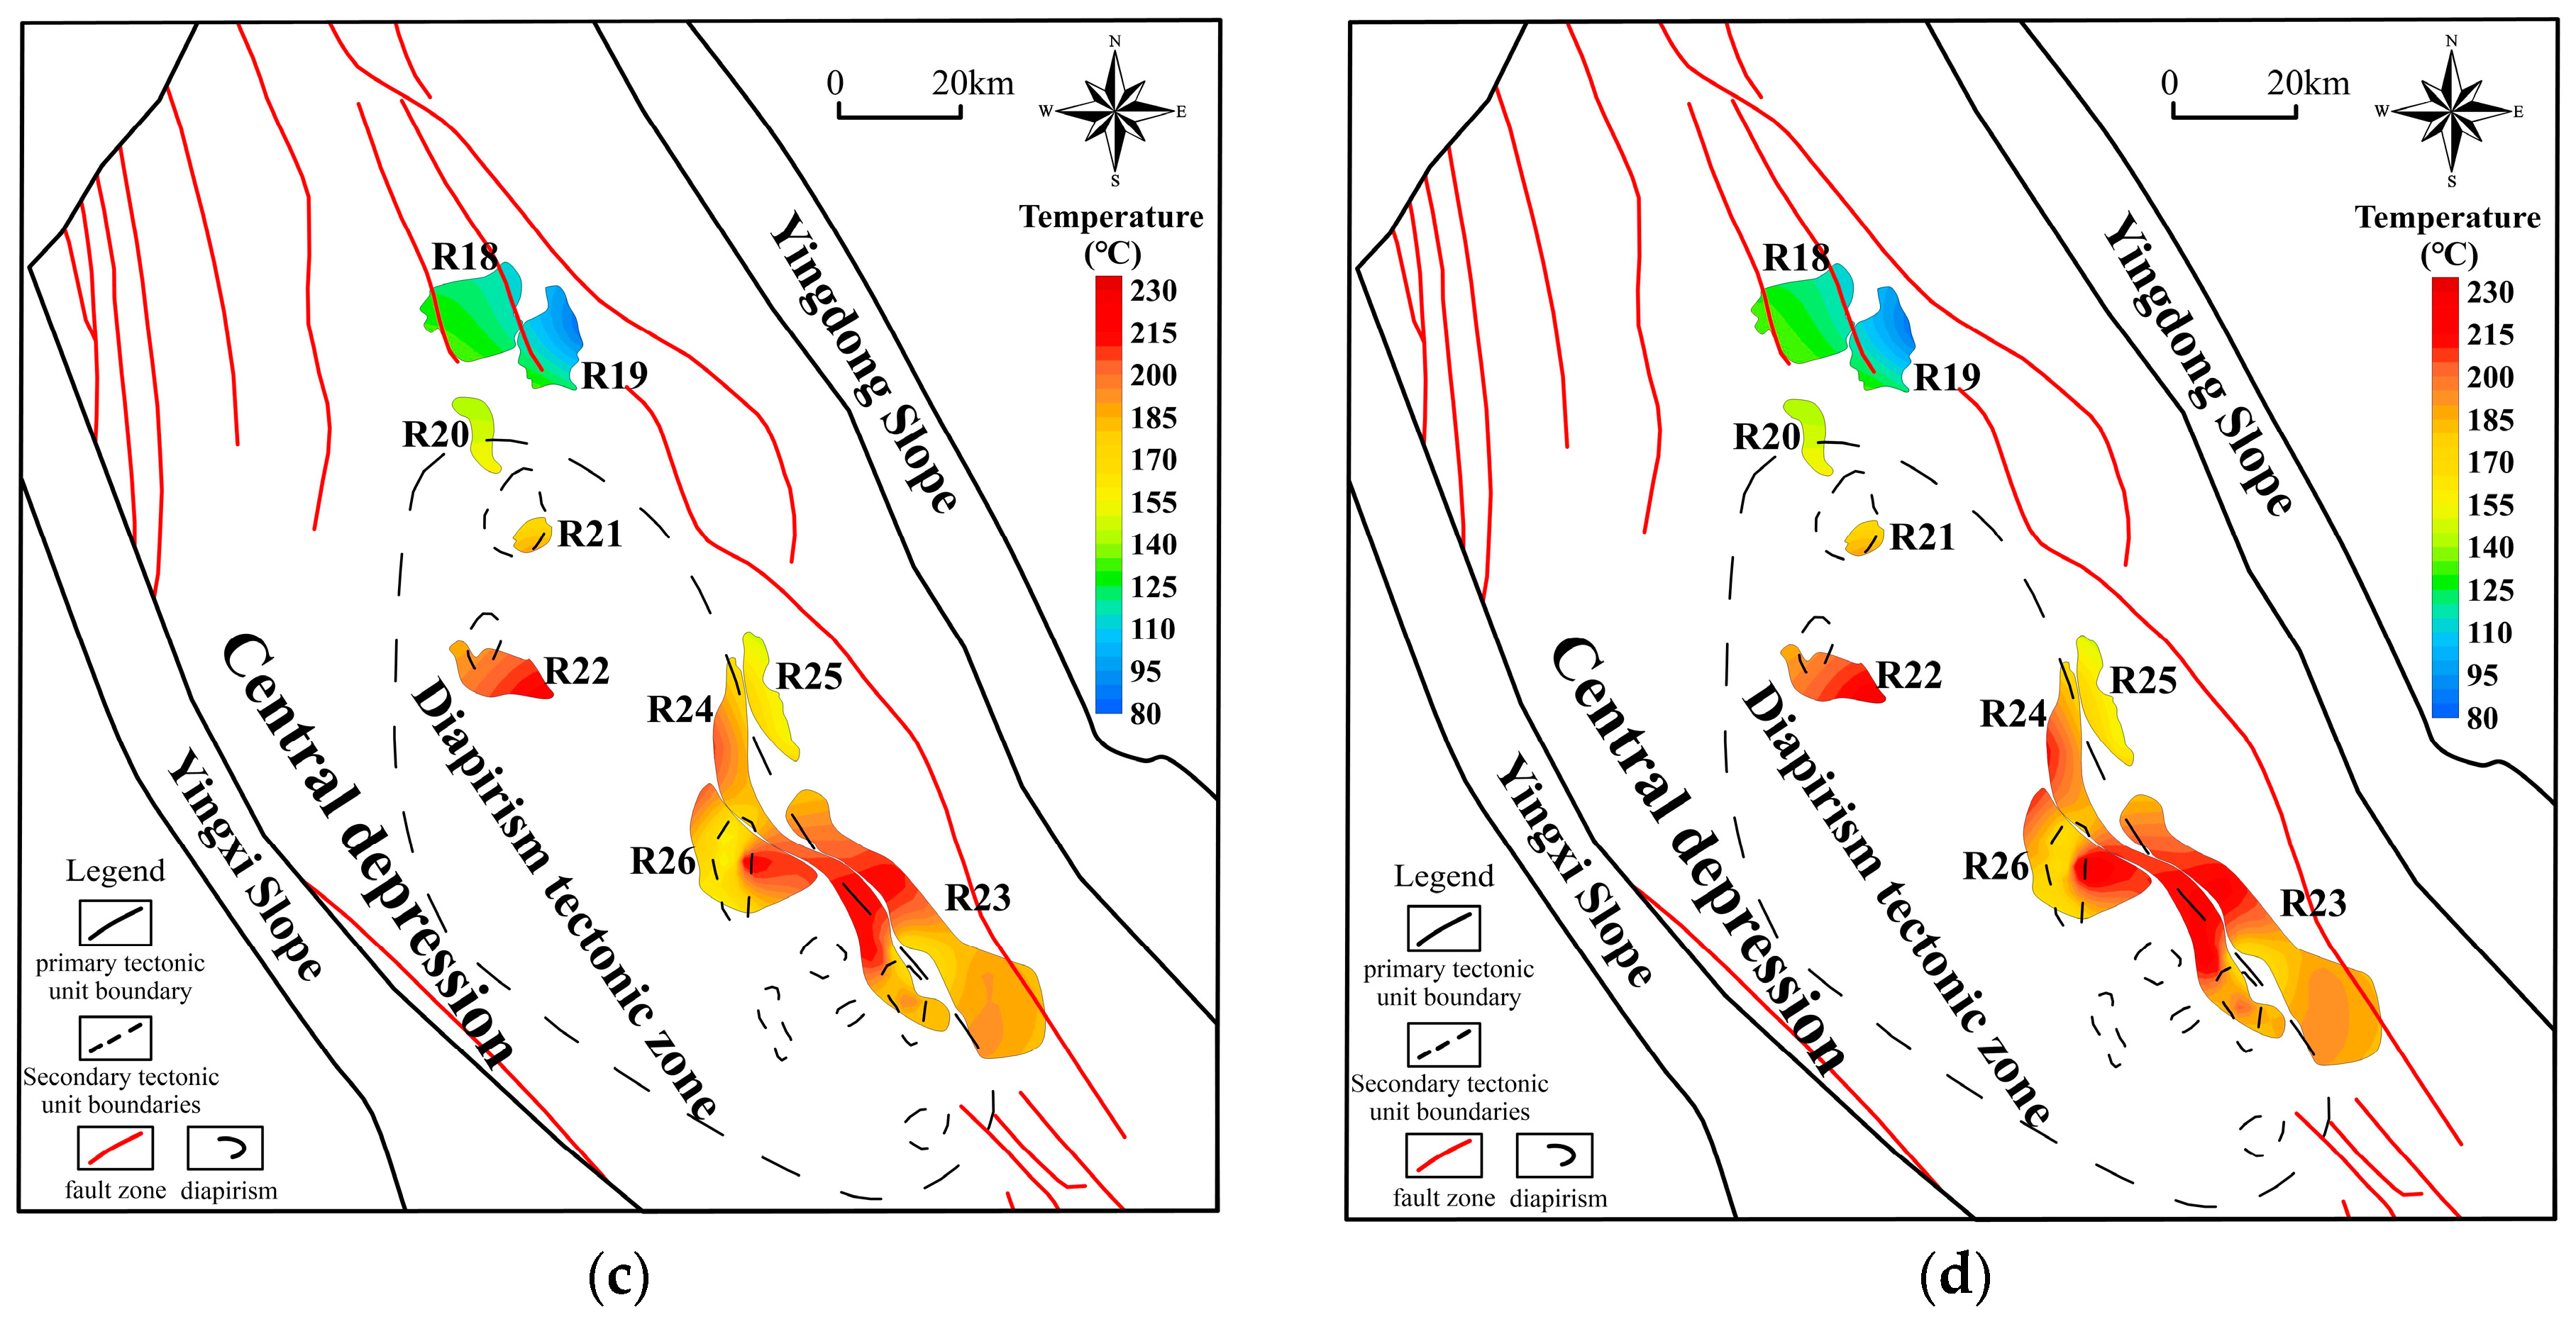
3.2. Temperature of the Huangliu Formation Geothermal Reservoir

The temperature of the geothermal reservoir is a critical element in assessing geothermal resources. Well logging data indicate that in the shallow part of the Huangliu Formation, within the central depression of the Yinggehai Basin, the geothermal field is primarily characterized by thermal conduction, with temperatures increasing linearly with the depth of geological strata. Additionally, calculations of temperature in the shallow strata of a sedimentary basin generally do not account for variations in the thermal properties of the rocks. Consequently, this study calculated the temperature of the geothermal reservoir using a one-dimensional steady-state formula, detailed as follows:
T z = T 0 + ( q × z ) / k ( A × z 2 ) / 2 k
In this study, the geothermal characteristics of Yinggehai Basin were comprehensively analyzed, focusing on the main rock types—mudstone and sandstone—as well as the data of radioactive heat generation and thermal conductivity of rocks. This involved compiling existing research data [38,43] and integrating additional data obtained during this study. In this research, the average value of 1.36 μW/m3 was used as the radiogenic heat production rate (A), and the average value of 1.97 W/(m•K) was taken for the rock thermal conductivity (k). Detailed information on the data used in these calculations can be found in Table 3.
Figure 6 depicts the planar distribution of the top and bottom temperatures for Members 1 and 2 of the Huangliu Formation’s geothermal reservoirs in the central depression of the Yinggehai Basin. The temperature distribution for the top of Member 1’s geothermal reservoir in the Huangliu Formation ranges from 41.2 to 209.9 °C, averaging 127.3 °C; at the bottom, it ranges from 45.0 to 210.6 °C, with an average of 130.6 °C. For Member 2 of the Huangliu Formation, the temperature distribution at the top of the geothermal reservoir ranges from 86.2 to 220.8 °C, averaging 152.6 °C; at the bottom, it ranges from 86.2 to 229.8 °C, with an average of 153.2 °C. High-temperature geothermal resources (T ≥ 90 °C) in Member 1 of the Huangliu Formation are concentrated around diapiric structures and fault zones within the Yinggehai Basin, especially in areas R1–R8, R13–R14, and R16–R17. The geothermal reservoir temperatures are relatively lower at the margins of the central depression, including areas R9–R12 and R15. In Member 2 of the Huangliu Formation, all geothermal reservoirs are characterized as medium to high-temperature resources, with temperatures consistently above 86 °C.

3.3. Characteristics of the Porosity of the Huangliu Formation Geothermal Reservoir

In geothermal resource evaluation, porosity is a key geological parameter directly related to the fluid storage capacity and therefore to the thermal potential of the reservoir [44]. Therefore, when assessing the quality of the geothermal reservoir in the central depression area of the Yinggehai Basin, particularly in the Huangliu Formation, the measurement and analysis of porosity become particularly important. This study conducted a systematic investigation of porosity in the Huangliu Formation within the Yinggehai Basin’s central depression, analyzing extensive well logging data, including the exploration well data from DF, LD, LT, HK, and other gas fields (see Figure 7). The result of the analysis indicates that the average porosity of the Huangliu Formation is 16.43%. In the shallow areas of the central depression of the basin, the Huangliu Formation predominantly exhibits characteristics of medium to high porosity, while lower porosity is observed in certain specific areas of the shallow layer. With increasing depth, towards the middle and deeper layers, the porosity tends to be low to medium and may further decrease.

4. Geothermal Resource Assessment of the Huangliu Formation

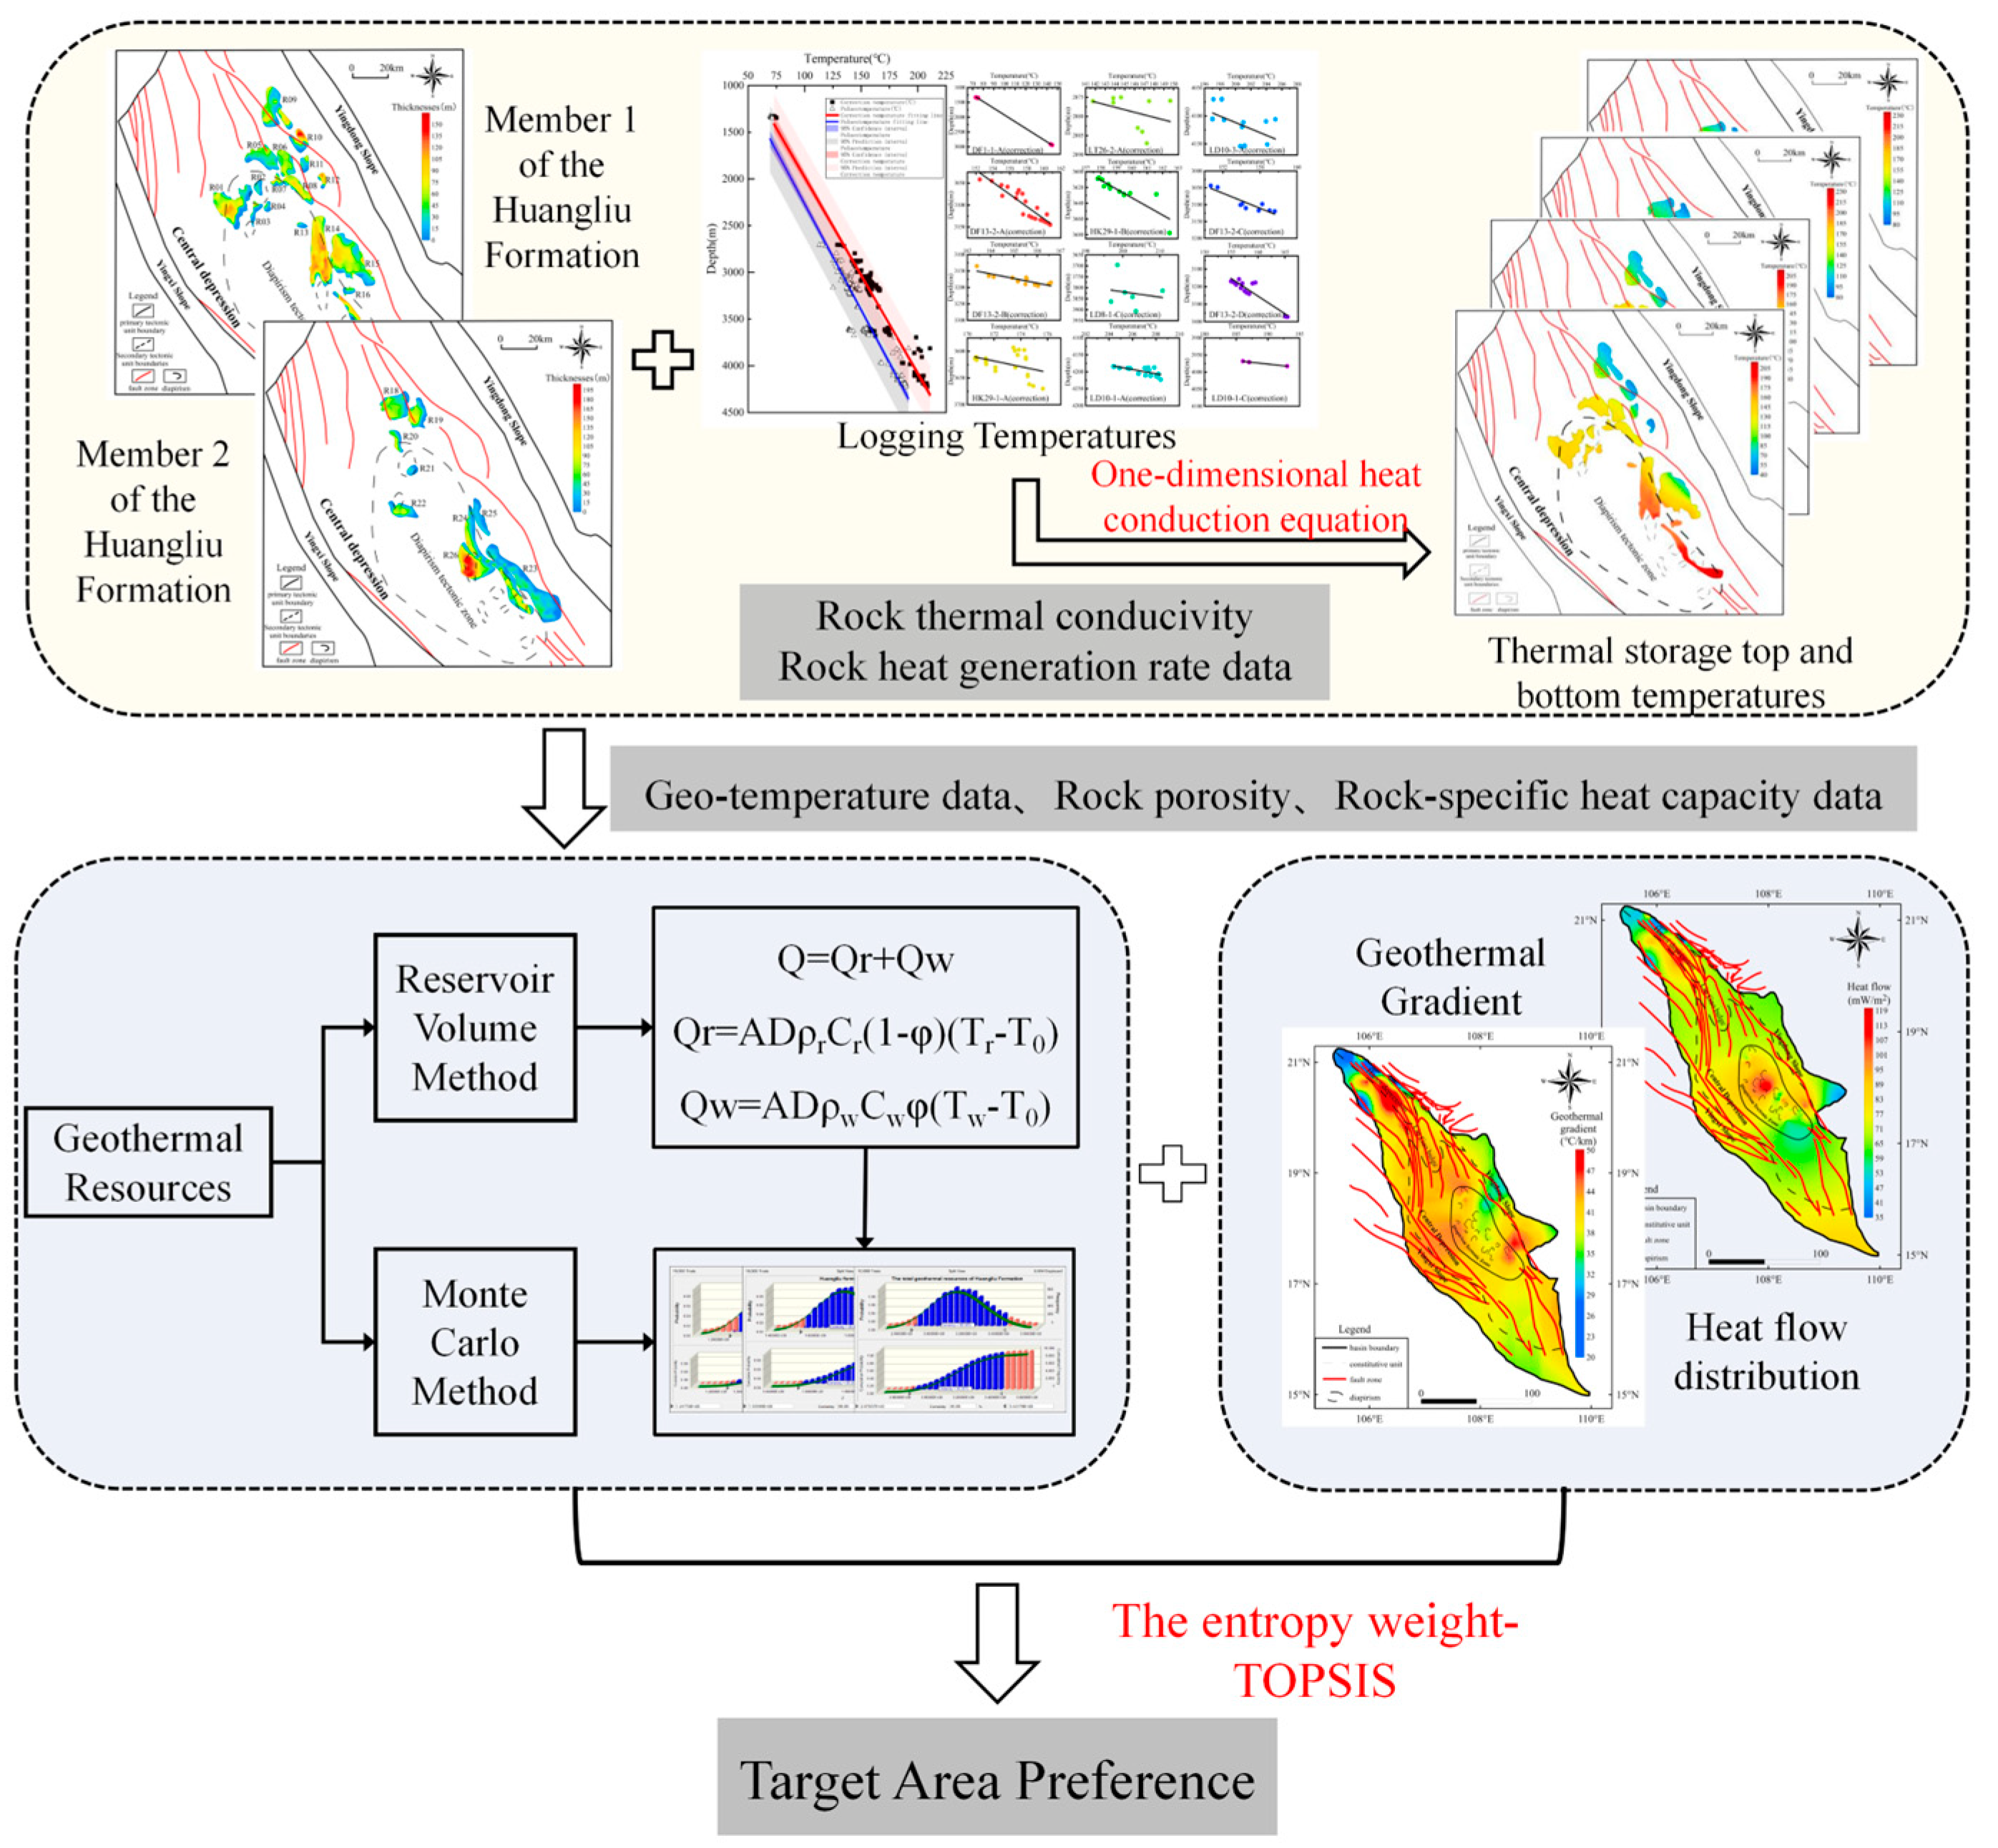
4.1. Methods and Parameters

In geothermal resource assessment, evaluation methods are primarily divided into two types: static and dynamic, depending on available data and the development stage of the geothermal field. Static evaluation methods include the heat flux volume method, geothermal reservoir volume method, and analogy method [45]. These methods are typically used during the exploration phase of geothermal resources. Conversely, dynamic evaluation methods, including numerical simulations and decay analysis, are suited for the development phase of geothermal fields [46,47].
Additionally, the Monte Carlo simulation method is widely utilized, particularly during the exploration phase of geothermal resources [48,49]. It significantly complements the geothermal reservoir volume method. Based on probability statistics, this method assigns variations to uncertain parameters like porosity, reservoir area, reservoir thickness, and temperature in the geothermal reservoir volume method using a mathematical model for random sampling [14]. Subsequently, statistical analysis is used to derive the expected curve and characteristic values of geothermal resource quantities [50]. Among these, resources with a 90% cumulative probability are considered proven, while those exceeding 50% are regarded as inferred [51].
Considering advances in geothermal research and data completeness within the evaluation area, this study combined the geothermal reservoir volume and Monte Carlo simulation methods to comprehensively assess geothermal resources in the Huangliu Formation of the Yinggehai Basin’s central depression zone (Figure 8). The choice of this methodological approach is aimed at enhancing the accuracy of the estimation of geothermal resource quantities and providing a scientific basis for further exploration and development of geothermal resources in the Yinggehai Basin.

4.1.1. Calculation of Geothermal Resource Quantity Based on the Reservoir Volume Method

The evaluation results comprise two components: the total heat in the rock framework and the fluid within the pores, relative to a reference temperature. According to the “Geothermal Resource Geological Exploration Specification” [52], the formula for the geothermal reservoir volume method is:
Q = Q r + Q w
Q r = A D ρ r C r ( 1 φ ) ( T r T 0 )
Q w = A D ρ w C w φ ( T w T 0 )
In the formula, Q (J) represents the total heat content; Q r ( J ) represents the heat contained in the rock framework; Q w (J) represents the heat contained in the pore fluid; A (m2) is the area of the geothermal reservoir; D (m) is the thickness of the geothermal reservoir; ρ r , ρ w (g·cm−3) are the densities of the rock framework and geothermal fluid, respectively; C r , C w (kJ·kg−1·°C−1) are the specific heat capacities of the rock framework and geothermal fluid, respectively; φ (%) is the porosity of the geothermal reservoir; T w (°C) is the temperature of the geothermal reservoir; and T 0 (°C) is the reference temperature (taken as the seabed temperature of 25 °C).

4.1.2. Calculation of Geothermal Resource Quantity Based on the Reservoir Volume Method

The Monte Carlo method, also called statistical simulation, is a stochastic simulation technique. Unlike traditional predictive models, Monte Carlo simulations forecast outcomes based on a range of estimated values. This method is particularly useful for variables with inherent uncertainties, using probability distributions like uniform, normal, and triangular to model potential outcomes. By generating random numbers between minimum and maximum values and repeating calculations thousands of times, this method produces numerous possible outcomes and their probabilities [53]. With increased discovery and development of geothermal fields, it has become clear that accurately determining the specific conditions of many reservoirs is often challenging. Consequently, Monte Carlo simulation has proven effective in simulating uncertainties across various parameters. The Monte Carlo-based geothermal resource calculation method integrates simulations with the volumetric method, significantly advancing beyond traditional approaches. It effectively addresses uncertain parameters, including ρ r , φ, T w , and C r   [54].

4.2. Calculation Parameters

In calculating geothermal resource volumes with the volumetric method, area (A) and depth (D) are critical variables. This study precisely delineated the boundaries of each geothermal reservoir using three-dimensional seismic data analysis, establishing fixed volume values instead of relying on averages. In addition to volume, other critical parameters like density and porosity are estimated using representative values according to relevant standards (Table 4). Furthermore, the geothermal fluid is assumed to be water, with a density ( ρ w ) of 1000 kg/m3 and specific heat capacity ( C w ) of 4180 J/(kg·°C) as stipulated by the geothermal resource evaluation methods [55].
Geothermal resource volumes were simulated using the Monte Carlo method with the Oracle Crystal Ball software [56], focusing on uncertainty parameters like ρ r , φ, T r , and C r . Triangular and uniform distribution probability models were selected based on the accuracy of available data. The values for ρ w and C w were consistent with those used in the volumetric method. Moreover, the number of iterations in the Monte Carlo method is crucial, as it substantially enhances result accuracy. Using the S26 thermal reservoir as an example, this study performed ten independent computations at intervals of 10,000 iterations (Table 5). The outcomes did not exhibit any regular patterns. Additionally, based on the principles of the Monte Carlo method, increasing the number of iterations is expected to improve the accuracy of the simulation results. Therefore, this research opts to conduct simulations with 10,000 iterations. Detailed records of chosen geothermal reservoir parameters and results are documented in Table 4.

4.3. Results

Calculations using the volumetric method for the Huangliu Formation in the central depression of the Yinggehai Basin indicate total geothermal resources of 2.75 × 10²⁰ J, equivalent to approximately 93.95 × 10⁸ tec. In the Huangliu Formation, Member 1 holds 1.22 × 10²⁰ J, equivalent to 41.75 × 10⁸ tec, and Member 2 comprises 1.53 × 10²⁰ J, equivalent to 52.2 × 10⁸ tec. The richness of geothermal resources, reflecting their ‘density’, is calculated by dividing the total resource by the reservoir area. In the evaluation of individual geothermal reservoirs, the R14 reservoir in Member 1 of the Huangliu Formation exhibits the highest richness at 2.67 × 10¹¹ J/m2, followed by the R23 reservoir in Member 2 with a geothermal richness of 6.00 × 10¹⁰ J/m2 (Table 6). Notably, the areas with higher resource richness are primarily concentrated along the diapiric structures in the central depression, suggesting that these structures may provide favorable conditions for the formation of geothermal reservoirs. Furthermore, the R1, R17, and R23 reservoirs are also located within two significant gas fields in the Yinggehai Basin, DF13 and LD10, confirming that these gas fields also contain substantial geothermal resources. According to oil field standards, these reservoirs are classified in the most favorable category for geothermal resources.
Monte Carlo simulations reveal that the total geothermal resources of the Huangliu Formation vary from 2.634 to 3.746 × 10²⁰ J, with an average of 3.142 × 10²⁰ J, equivalent to approximately 107.34 × 10⁸ tec. Estimates for Member 1 of the Huangliu Formation suggest geothermal resources ranging from 1.046 and 1.756 × 10²⁰ J, with an average of 1.392 × 10²⁰ J, equivalent to approximately 47.55 × 10⁸ tec. The most likely geothermal resource for Member 1 is estimated at 1.372 × 10²⁰ J, with an 11.36% probability, and there is a 90% chance that the resource quantity lies between 1.248 to 1.566 × 10²⁰ J (Figure 9). For Member 2 of the Huangliu Formation, geothermal resources are estimated to range from 1.275 to 2.297 × 10²⁰ J, with an average of 1.750 × 10²⁰ J, equivalent to approximately 59.79 × 10⁸ tec. The most likely geothermal resource for Member 2 is 1.745 × 10²⁰ J, with a probability of 12.06%, and there is a 90% likelihood that the resource quantity will be between 1.536 and 1.983 × 10²⁰ J. The simulation results for all reservoirs (R01–R26) are listed in Table 6. According to the maximum probability resource values, reservoir unit R23 exhibits the highest geothermal resources, followed by R24, R26, and R14. Further calculations of resource richness for each reservoir unit place R14 at the forefront, followed by R23, aligning with results obtained from volumetric resource estimation methods.

5. Geothermal Resource Advantage Area and Development Recommendations

Selecting sites for resource targets is fundamental in developing and utilizing geothermal resources. Previous research indicates that target area selections are typically based on local conditions and appropriate evaluation criteria [57,58]. In this study, an evaluation of potential geothermal resource advantage areas led to the selection of the following as the main evaluation parameters: the average geothermal flow of the reservoir (W/m2), rock density (kg/m3), reservoir temperature (°C), reservoir volume (m3), depth of burial of the reservoir (m), the porosity of the reservoir (%), geothermal resource abundance of the reservoir (J/m2), geothermal resource quantity contained in the reservoir’s pore fluid (J), and geothermal resource quantity contained in the reservoir’s rock framework (J). The entropy weight-TOPSIS (a method for ranking preferences by similarity to an ideal solution) method was employed, focusing on the potential of geothermal resources and the potential for geothermal resource development [59,60]. The specific evaluation process is as follows: (1) the system collects the above-mentioned evaluation index parameter data and normalizes the data; (2) the entropy weight method is used to confirm the index parameters; (3) the TOPSIS method is used to calculate the distance between the evaluation object (R01–R26) and the positive and negative ideal solution (D+ and D); (4) combined with the distance value, the comprehensive score is calculated and sorted, and the conclusion is drawn. It is important to note that, considering the primary utilization of geothermal resources is derived from pore fluids in the strata, this evaluation is divided into two parts: primary advantageous target areas and secondary advantageous target areas, with the latter focusing more on fluid resource content. The index weight calculation and final evaluation results are shown in Table 7 and Table 8, respectively.
The entropy weight method, based on information entropy theory, objectively determines weights. This method calculates the entropy value of each evaluation criterion, reflecting the degree of dispersion of the indicator data, thereby determining the weight of each indicator. The TOPSIS method is a multi-criteria decision-making method based on the sorting of ideal solutions. This method constructs ideal and negative ideal solutions, calculates the distance between each evaluation object and these ideal and negative ideal solutions, and thus evaluates the merits of each object [61]. The Entropy-TOPSIS method combines the entropy weight and TOPSIS methods for a comprehensive evaluation. This method initially employs the entropy weight method to assign weights to each criterion and subsequently uses the TOPSIS method to rank the evaluation objects accordingly. By incorporating the entropy weight method, the Entropy-TOPSIS method preserves the strengths of the TOPSIS method and addresses its weaknesses in determining indicator weights, leading to a more scientific and rational evaluation outcome [59].
Evaluation results identify the R14 reservoir as a prime target area under both scenarios, followed by the R23, R26, R24, and R16 reservoirs, all favorable for priority geothermal resource development. However, given the limited availability of offshore drilling platforms, establishing an integrated utilization model for offshore geothermal energy is crucial to maximize energy efficiency. The integrated utilization model primarily involves geothermal power generation and the combined use of “geothermal+” on offshore platforms. Geothermal power generation uses geothermal water or steam to drive power generators, while the “geothermal+” model integrates geothermal energy with other energy and resource uses (Figure 10).
With its substantial development potential and abundant resource reserves, offshore geothermal energy is increasingly becoming a key force in achieving marine carbon neutrality goals. Conducting in-depth assessments of geothermal resources in the Yinggehai Basin and formulating comprehensive geothermal energy utilization strategies will significantly enhance the development efficiency of geothermal resources and the effectiveness of energy utilization in this basin and promote the development of related industries. Moreover, it provides valuable references for other basins with similar geological conditions, thereby supporting the sustainable development of geothermal energy in China’s marine areas.

6. Conclusions and Insights

  • The Yinggehai Basin exhibits an excellent geothermal background with an average geothermal gradient of 39.4 ± 4.7 °C/km and an average terrestrial heat flow of 77.4 ± 19.1 mW/m2. The Huangliu Formation within the basin has optimally buried geothermal reservoirs with superior physical and thermal properties, exhibiting an average reservoir temperature of 140.9 °C, indicating substantial geothermal potential.
  • Calculated using the volumetric method, the total geothermal resources of the 26 reservoirs in the Huangliu Formation amount to 2.75 × 10²⁰ J, equivalent to 93.95 × 10⁸ tec. Specifically, the primary section accounts for 1.22 × 10²⁰ J, equivalent to 41.75 × 10⁸ tec, and the secondary section for 1.53 × 10²⁰ J, equivalent to 52.20 × 10⁸ tec. The analysis of geothermal richness underscores the concentration of these resources, with reservoirs R14 and R23 exhibiting the highest geothermal richness, at 2.67 × 10¹¹ J/m2 and 6.00 × 10¹⁰ J/m2, respectively.
  • The confidence interval for the geothermal resources of the Huangliu Formation, calculated using the Monte Carlo method, ranges from 2.634 to 3.746 × 10²⁰ J. The confidence interval for the primary section ranges from 1.046 to 1.756 × 10²⁰ J, with an average of 1.392 × 10²⁰ J (equivalent to approximately 47.55 ×10⁸ tec), and the most probable resource amount is 1.372 × 10²⁰ J (11.36%). For the secondary section, the confidence interval ranges from 1.275 to 2.297 × 10²⁰ J, with an average of 1.750 × 10²⁰ J (equivalent to approximately 59.79 × 10⁸ tec), and the most probable resource amount is 1.745 × 10²⁰ J (12.06%).
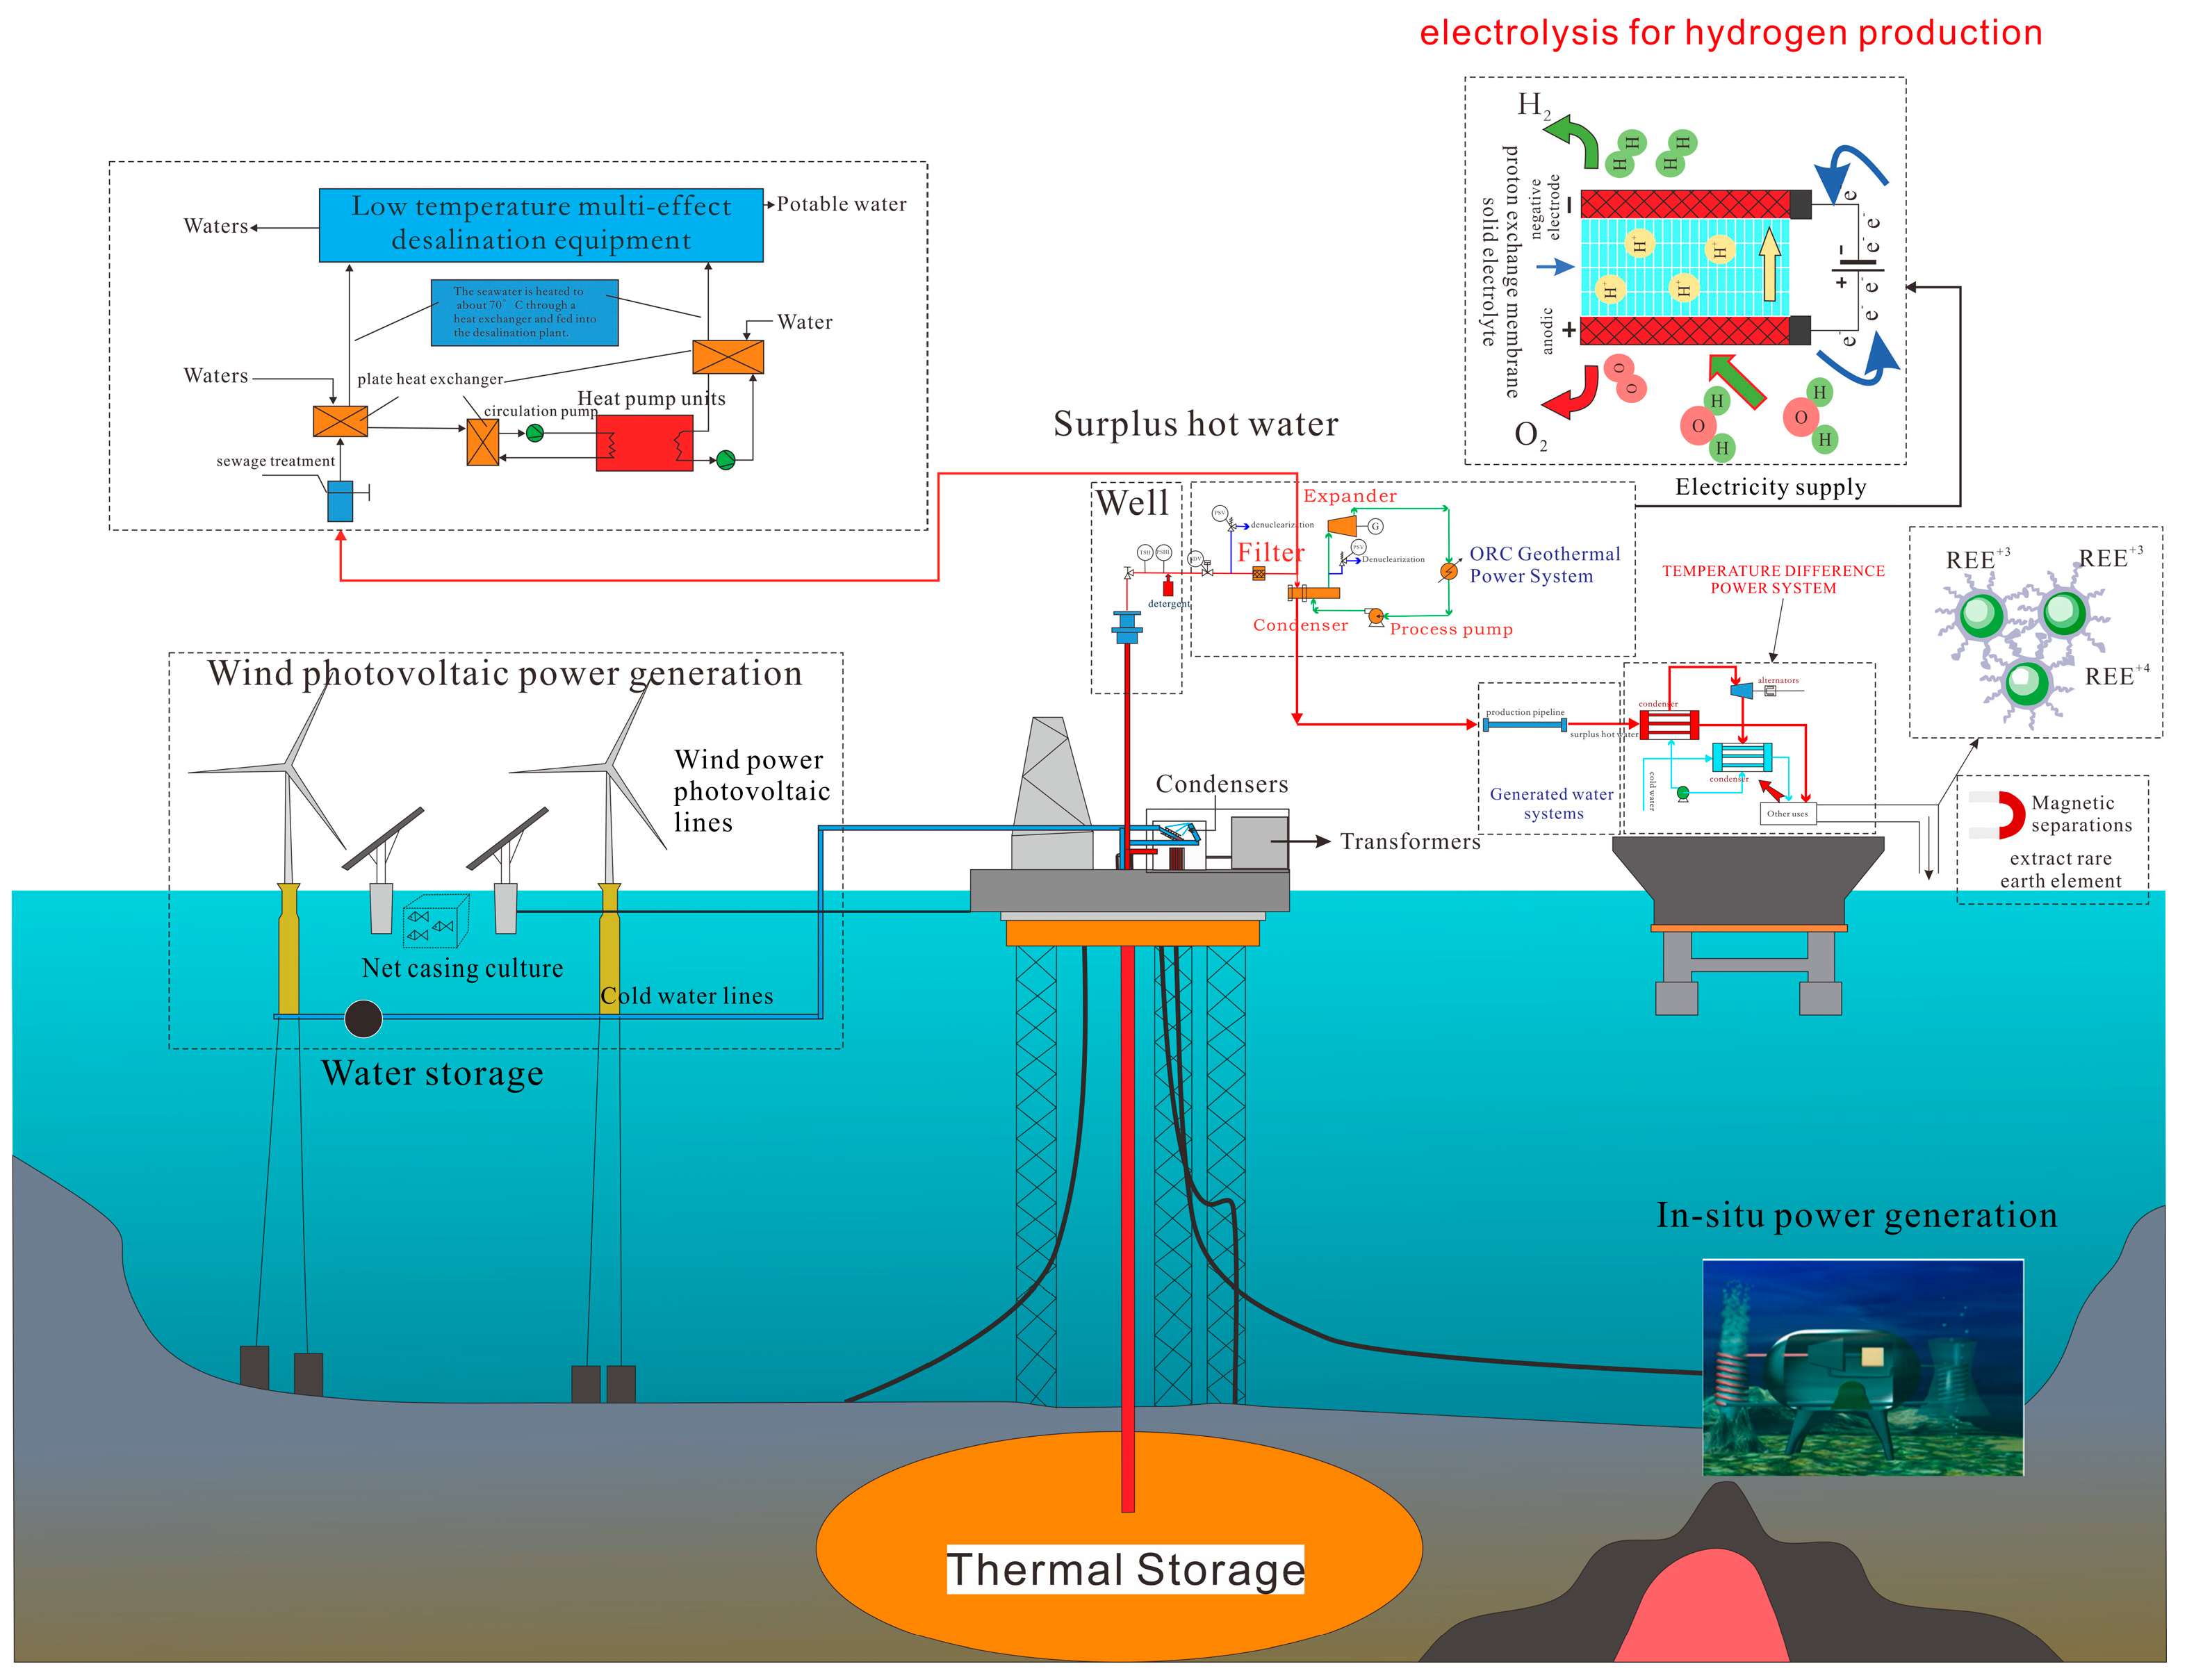
  • Employing the Entropy-TOPSIS method to evaluate key geothermal parameters, reservoir R14 is identified as the prime target area for development, followed by R23, R26, R24, and R16. Considering the limited resources of offshore drilling platforms, a comprehensive utilization model integrating geothermal power generation with multiple applications is proposed, aiming to optimize energy efficiency and provide new insights for the efficient development of geothermal resources in the Yinggehai Basin.
  • This study provides methodological insights for the assessment of geothermal resources in the Yinggehai Basin and establishes a solid foundation for resource development. However, due to the extensive and uneven drilling distribution in the central depression of the basin, the geothermal resource assessment data are somewhat limited. Despite exhaustive efforts to collect comprehensive drilling, geological, geophysical, and developmental data to evaluate the thermal storage characteristics and geothermal potential of the Huangliu Formation, the availability and completeness of data still constrain the scope and depth of the current study. Future work will focus on further enhancing and supplementing the dataset to achieve more systematic and comprehensive evaluations of geothermal resources.

Author Contributions

Conceptualization and design of the study, H.C.; data extraction and data curation, H.C., F.Z. and T.W.; formal analysis, H.C., B.D., J.Z. and Y.Z.; visualization, H.C., J.Z. and Y.Z.; validation, H.C., J.Z. and Y.Z.; writing—original draft, H.C.; writing—review and editing, R.S. and C.Z.; supervision, H.C., R.S. and C.Z. All authors have read and agreed to the published version of the manuscript.

Funding

This research was supported by the National Natural Science Foundation of China under Grant No. 52192622 and the Strategic Research and Consultancy Project of the Chinese Academy of Engineering, Grant No. 2022-HZ-18.

Institutional Review Board Statement

Not applicable.

Informed Consent Statement

Not applicable.

Data Availability Statement

The data supporting this study’s findings are available from the corresponding author upon reasonable request.

Acknowledgments

We express our heartfelt gratitude to all the individuals and institutions that directly or indirectly contributed to this research. Special thanks are extended to the Hainan Branch and Zhanjiang Branch of China National Offshore Oil Corporation (CNOOC) for their robust support in providing essential data and assistance during the sampling and testing of rock samples. We are also immensely grateful to the anonymous reviewers and editors whose constructive comments and suggestions have significantly improved the quality of this manuscript.

Conflicts of Interest

The authors declare no conflicts of interest or personal relationships that could have appeared to influence the work reported in this study.

References

  1. Dai, M.; Su, J.; Zhao, Y.; Hofmann, E.E.; Cao, Z.; Cai, W.-J.; Gan, J.; Lacroix, F.; Laruelle, G.G.; Meng, F.; et al. Carbon Fluxes in the Coastal Ocean: Synthesis, Boundary Processes, and Future Trends. Annu. Rev. Earth Planet. Sci. 2022, 50, 593–626. [Google Scholar] [CrossRef]
  2. Guo, H.; Li, C.; Peng, B.; Shan, X.; Xu, J.; Zhang, Z.; Chang, J. Present-Day Geothermal Regime and Thermal Evolution of the Fukang Sag in the Junggar Basin, Northwest China. Minerals 2024, 14, 260. [Google Scholar] [CrossRef]
  3. Tang, X.Y.; Zhong, C.; Yang, S.C.; Hu, S.B. Characteristics and influence factors of the present geothermal field for basins in China’s offshore and adjacent areas. Acta Geol. Sin. 2023, 97, 911–921. [Google Scholar]
  4. Yuan, J.; Yang, Z.; Deng, C.; Krijgsman, W.; Hu, X.; Li, S.; Shen, Z.; Qin, H.; An, W.; He, H.; et al. Rapid drift of the Tethyan Himalaya terrane before two-stage India-Asia collision. Natl. Sci. Rev. 2021, 8, nwaa173. [Google Scholar] [CrossRef]
  5. Zhan, H.W.; Suo, Y.H.; Zhu, J.J.; Li, S.Z.; Wang, P.C.; Wang, G.Z.; Zhou, J.; Wang, X.J. Closure mechanism of the South China Sea: Insights from subduction initiation along the Manila Trench. Acta Geol. Sin. 2023, 39, 2569–2582. [Google Scholar] [CrossRef]
  6. Huang, B.J.; Hui, T.; Huang, H.; Yang, J.H.; Xiao, X.M.; Li, L. Origin and accumulation of CO2 and its natural displacement of oils in the continental margin basins, northern South China Sea. AAPG Bull. 2015, 99, 1349–1369. [Google Scholar] [CrossRef]
  7. Huang, H.L.; Li, J.; Yang, H.W.; Zhang, G.; Gao, L.Y.; An, J.T.; Luo, M.; Li, W.T. Influence of diapir structure on formation and distribution of overpressure in the Yinggehai Basin, South China Sea. Energy Sci. Eng. 2022, 10, 1972–1985. [Google Scholar] [CrossRef]
  8. Lv, X.W.; Fu, M.Y.; Zhang, S.N.; Meng, X.H.; Liu, Y.; Ding, X.Q.; Zhang, Y.; Sun, T.J. Effect of Diagenesis on the Quality of Sandstone Reservoirs Exposed to High-Temperature, Overpressure, and CO2-Charging Conditions: A Case Study of Upper Miocene Huangliu Sandstones of Dongfang District, Yinggehai Basin, South China Sea. Front. Earth Sci. 2022, 10, 885602. [Google Scholar] [CrossRef]
  9. Xie, X.N.; Li, S.T.; Dong, W.L.; Hu, Z. Evidence for episodic expulsion of hot fluids along faults near diapiric structures of the Yinggehai Basin. South China Sea. Mar. Pet. Geol. 2001, 18, 715–728. [Google Scholar] [CrossRef]
  10. Fan, C.W.; Cao, J.J.; Luo, J.L.; Li, S.S.; Wu, S.J.; Dai, L.; Hou, J.X.; Mao, Q.R. Heterogeneity and influencing factors of marine gravity flow tight sandstone under abnormally high pressure: A case study from the Miocene Huangliu Formation reservoirs in LD10 area, Yinggehai Basin, South China Sea. Pet. Explor. Dev. 2021, 48, 1048–1062. [Google Scholar] [CrossRef]
  11. Wang, B.; Wang, Z.H.; Shen, B.; Tang, D.; Wu, Y.X.; Wu, B.H.; Li, S.; Zhang, J.F. Evaluation of Saturation Interpretation Methods for Ultra-Low Permeability Argillaceous Sandstone Gas Reservoirs: A Case Study of the Huangliu Formation in the Dongfang Area. Processes 2024, 12, 271. [Google Scholar] [CrossRef]
  12. Zhao, J.; Huang, Z.L.; Fan, C.W.; Xu, M.G.; Hou, J.X. Diagenetic and hydrothermal fluid influence on tight sandstone reservoir quality: Gravity-flow deposits from the Huangliu Formation, Ledong area, Yinggehai Basin, South China Sea. J. Pet. Sci. Eng. 2022, 215, 110633. [Google Scholar] [CrossRef]
  13. Song, G.F.; Li, G.S.; Song, X.D.; Shi, Y. Multi-objective balanced method of optimizing the heat extraction performance for hot dry rock. Nat. Gas Ind. 2022, B9, 497–510. [Google Scholar] [CrossRef]
  14. Li, Y.Y.; Long, X.T.; Lu, J. Evaluation of geothermal resources potential in the uplifted mountain of Guangdong province using the Monte Carlo simulation. Front. Earth Sci. 2023, 11, 1233026. [Google Scholar] [CrossRef]
  15. Wang, Y.B.; Wang, L.J.; Yang, B.; Wang, Z.T.; Hu, J.; Hu, D.; Wang, Y.Q.; Hu, S.B. Assessment of Geothermal Resources in the North Jiangsu Basin, East China, Using Monte Carlo Simulation. Energies 2021, 14, 259. [Google Scholar] [CrossRef]
  16. Luo, J.S.; Hu, G.W.; Xie, Z.H.; Duan, L.; Fu, X.F.; Sun, Y.H.; Wang, Y.G. Multiphase Palaeogene–Miocene deformation history and regional implications of the Yinggehai Basin, offshore Ailao Shan–red river shear zone. Mar. Pet. Geol. 2024, 162, 106731. [Google Scholar] [CrossRef]
  17. Zhu, M.Z.; Graham, S.; McHargue, T. The Red River Fault zone in the Yinggehai Basin, South China Sea. Tectonophysics 2009, 476, 397–417. [Google Scholar] [CrossRef]
  18. Xv, Z.H.; Wang, L.; Jiang, Q.C.; Li, Y.X. Differences between Yinggehai Basin and Qiongdongnan Basin. Inn. Mong. Petrochem. Ind. 2010, 36, 105–108. [Google Scholar]
  19. Yang, D.H. A Study on Tectonic Deformation Characteristics and Paleotectonic Environment of the Yinggehai Basin during Depression. Master’s Thesis, China University of Petroleum, Beijing, China, 2021. [Google Scholar]
  20. Han, B.Y. Structural Deformation Anatomy and Sandbox Simulation Experiment in Yinggehai Basin. Master’s Thesis, China University of Petroleum, Beijing, China, 2020. [Google Scholar]
  21. Liu, J.; Jia, D.; Yin, H.W.; Li, S.; Fan, X.G.; He, Z.Y.; Cui, J.; Yang, S.; Zhang, Y. Sandbox modeling of transrotational tectonics with changeable poles: Implications for the Yinggehai Basin. Front. Earth Sci. 2021, 9, 687789. [Google Scholar] [CrossRef]
  22. Li, C.; Lv, C.F.; Chen, G.J.; Zhang, G.C.; Ma, M.; Yang, H.Z.; Bi, G.X. Zircon U-Pb ages and REE composition constraints on the provenance of the continental slope-parallel submarine fan, western Qiongdongnan Basin, northern margin of the South China Sea. Mar. Pet. Geol. 2019, 102, 350–362. [Google Scholar] [CrossRef]
  23. Yang, Y.L.; He, Y.L.; Xie, X.N.; Li, S.S.; Cao, L.C.; Zhang, D.J.; Huang, C.; Xiao, H.Y. Zircon U–Pb age constraints on the provenance and response to tectonics: Lower Oligocene of the western Qiongdongnan Basin, South China Sea. Mar. Pet. Geol. 2023, 148, 106059. [Google Scholar] [CrossRef]
  24. Liu, R.; Liu, J.Z.; Zhu, W.L.; Hao, F.; Xie, Y.H.; Wang, Z.F.; Wang, L.F. In situ stress analysis in the Yinggehai Basin, northwestern South China Sea: Implication for the pore pressure-stress coupling process. Mar. Pet. Geolog. 2016, 77, 341–352. [Google Scholar] [CrossRef]
  25. He, L.J.; Xiong, L.P.; Wang, J.Y.; Yang, J.H.; Dong, W.L. Tectono-thermal modeling of the Yinggehai Basin, South China Sea. Sci. China Ser. D-Earth Sci. 2001, 44, 7–13. [Google Scholar] [CrossRef]
  26. Yang, C.Q.; Zhou, W.; Wang, Y.; Peng, X.; Mo, F.Y.; Liu, S.Q.; Li, H.; He, Y.B. Subdivision of the first member of Huangliu Formation in Dongfang area of Yinggehai Basin and the main factors controlling the sedimentary evolution of submarine fan. China Offshore Oil Gas 2022, 34, 55–65. [Google Scholar]
  27. Mao, Q.R.; Fan, C.W.; Luo, J.L.; Cao, J.J.; You, L.; Fu, Y.; Li, S.S.; Shi, X.F.; Wu, S.J. Analysis of sedimentary-diagenetic evolution difference on middle-deep buried sandstone reservoirs under overpressure background: A case study of the Miocene Huangliu Formation in Yinggehai Basin, South China Sea. J. Palaeogeogr. 2022, 24, 344–360. (In Chinese) [Google Scholar]
  28. Qiao, Y.; Zuo, Y.H.; Tu, S.Q.; Zhang, J.Z.; Yang, M.H.; Zhang, T. Strata temperatures and geothermal resource evaluation in the Dongpu Depression, Bohai Bay Basin, North China. Sci. Rep. 2023, 13, 3630. [Google Scholar] [CrossRef] [PubMed]
  29. Kolawole, F.; Evenick, J.C. Global distribution of geothermal gradients in sedimentary basins. Geosci. Front. 2023, 14, 101685. [Google Scholar] [CrossRef]
  30. Bédard, K.; Comeau, F.-A.; Raymond, J.; Malo, M.; Nasr, M. Geothermal Characterization of the St. Lawrence Lowlands Sedimentary Basin, Québec, Canada. Nat. Resour. Res. 2018, 27, 479–502. [Google Scholar] [CrossRef]
  31. Förster, A. Analysis of borehole temperature data in the Northeast German Basin: Continuous logs versus bottom-hole temperatures. Pet. Geosci. 2001, 7, 241–254. [Google Scholar] [CrossRef]
  32. Tang, X.Y.; Huang, S.P.; Yang, S.C.; Jiang, G.Z.; Hu, S.B. Correcting on logging-derived temperatures of the Pearl River Mouth Basin and characteristics of its present temperature field. Chin. J. Geophys. 2016, 59, 2911–2921. (In Chinese) [Google Scholar]
  33. Horner, D.R. Pressure build-up in wells. In Proceedings of the 3rd World Petroleum Congress, Hague, The Netherlands, 28 May–6 June 1951. [Google Scholar]
  34. Global Heat Flow Data Assessment Group; Fuchs, S.; Neumann, F.; Norden, B.; Beardsmore, G.; Chiozzi, P.; Anguiano Dominguez, A.P.; Duque, M.R.A.; Ojeda Espinoza, O.M.; Forster, F.; et al. The Global Heat Flow Database: Update 2023. V. 1; GFZ Data Services: Potsdam, Germany, 2023. [Google Scholar]
  35. Davies, J.H.; Davies, D.R. Earth’s surface heat flux. Solid Earth 2010, 1, 5–24. [Google Scholar] [CrossRef]
  36. Jiang, G.Z.; Gao, P.; Rao, S.; Zhang, L.Y.; Tang, X.Y.; Huang, F.; Zhao, P.; Pang, Z.H.; He, L.J.; Hu, S.B.; et al. Compilation of heat flow data in the continental area of China (4th edition). Chin. J. Geophys. 2016, 59, 2892–2910. (In Chinese) [Google Scholar]
  37. Wu, D.; Li, X.L.; Liu, S.W.; Zhu, X.D.; Li, X.D.; Xiong, X.F.; Yi, H.W. Geothermal Regime of the Deep Area of the Qiongdongnan Basin, Northern Continental Margin of the South China Sea. Geol. J. China Univ. 2022, 28, 933–942. [Google Scholar]
  38. Tang, X.Y.; Hu, S.B.; Zhang, G.C.; Liang, J.S.; Yang, S.C.; Shen, H.L.; Rao, S. Geothermal characteristics and hydrocarbon accumulation of the northern marginal basins. South China Sea. Chin. J. Geophys. 2014, 57, 572–585. [Google Scholar]
  39. Tang, X.Y.; Hu, S.B.; Zhang, G.C.; Yang, S.C.; Shen, H.L.; Rao, S.; Li, W.W. Characteristic of surface heat flow in the Pearl River Mouth Basin and its relationship with thermal lithosphere thickness. Chin. J. Geophys. 2014, 57, 1857–1867. [Google Scholar]
  40. Ji, S.C.; Wang, Q.; Salisbury, M.H.; Wang, Y.J.; Jia, D. Reprint of: P-wave velocities and anisotropy of typical rocks from the Yunkai Mts. (Guangdong and Guangxi, China) and constraints on the composition of the crust beneath the South China Sea. J. Asian Earth Sci. 2017, 141, 213–234. [Google Scholar] [CrossRef]
  41. Zheng, F.; Song, R.C.; Dong, G.Y.; Chen, H.W.; Wang, Y.C.; Zhang, C.; Wu, T.; Zheng, H.A.; Liang, Y.K. Study on present geothermal field and thermal structure in Yinggehai Basin. J. Chengdu Univ. Technol. 2023, 50, 661–672. [Google Scholar]
  42. Zhang, J.; Shi, Y.L. Thermal structure of central basin in South China Sea and their geodynamic implications. J. Univ. Chin. Acad. Sci. 2004, 407–412. [Google Scholar]
  43. He, L.P.; Xiong, L.P.; Wang, J.Y. Heat flow and thermal modeling of the Yinggehai Basin, South China Sea. Tectonophysics 2002, 351, 245–253. [Google Scholar] [CrossRef]
  44. Moeck, I.S. Catalog of geothermal play types based on geologic controls. Renew. Sustain. Energy Rev. 2014, 37, 867–882. [Google Scholar] [CrossRef]
  45. Ciriaco, A.E.; Zarrouk, S.J.; Zakeri, G. Geothermal resource and reserve assessment methodology: Overview, analysis and future directions. Renew. Sustain. Energy Rev. 2020, 119, 109515. [Google Scholar] [CrossRef]
  46. Li, M.; Wang, G.L.; Li, W.J.; Liu, Z.M.; Zhang, W.; Ma, F.; Zhu, X. Discussion on potential assessment method of geothermal resources under balanced production and reinjection: A case study for the carbonate reservoir in Xiong’an New Area. Acta Geologica Sinica. 2024, 98, 1928–1940. [Google Scholar]
  47. Wang, S.J.; Li, F.; Yan, J.H.; Hu, J.W.; Wang, K.H.; Ren, H.T. Evaluation methods and application of geothermal resources in oilfields. Acta Pet. Sin. 2020, 41, 553–564. [Google Scholar]
  48. Aravena, D.; Muñoz, M.; Morata, D.; Lahsen, A.; Parada, M.Á.; Dobson, P. Assessment of high enthalpy geothermal resources and promising areas of Chile. Geothermics 2016, 59, 1–13. [Google Scholar] [CrossRef]
  49. Trota, A.; Ferreira, P.; Gomes, L.; Cabral, J.; Kallberg, P. Power production estimates from geothermal resources by means of small-size compact climeon heat power converters: Case studies from Portugal (Sete Cidades, Azores and Longroiva Spa, Mainland). Energies 2019, 12, 2838. [Google Scholar] [CrossRef]
  50. Shah, M.; Vaidya, D.; Sircar, A. Using Monte Carlo simulation to estimate geothermal resource in Dholera geothermal field, Gujarat, India. Multiscale and Multidisciplinary Modeling, Experiments and Design. Exp. Des. 2018, 1, 83–95. [Google Scholar]
  51. Derakhshan, S.H.; Deutsch, C.V. Direct simulation of P10, P50 and P90 reservoir models. In Proceedings of the PETSOC Canadian International Petroleum Conference, Calgary, AB, Canada, 17–19 June 2008. PETSOC-2008-188. [Google Scholar]
  52. GB/T 11615-2010; Geologic Exploration Standard of Geothermal Resources: Inspection and Quarantine of the People’s Republic of China. Standardization Administration of the People’s Republic of China: Beijing, China, 2010.
  53. Luengo, D.; Martino, L.; Bugallo, M.; Elvira, V.; Särkkä, S. A survey of Monte Carlo methods for parameter estimation. EURASIP J. Adv. Signal Process. 2020, 2020, 25. [Google Scholar] [CrossRef]
  54. Iglesias, E.R.; Torres, R.J. Low-to medium-temperature geothermal reserves in Mexico: A first assessment. Geothermics 2003, 32, 711–719. [Google Scholar] [CrossRef]
  55. DZ-T 0331-2020; Specification for Estimation and Evaluation of Geothermal Resources. Ministry of Natural Resources, the People’s Republic of China: Beijing, China, 2020.
  56. Piris, G.; Herms, I.; Griera, A.; Colomer, M.; Arnó, G.; Gomez-Rivas, E. 3DHIP-calculator—A new tool to stochastically assess deep geothermal potential using the heat-in-place method from voxel-based 3D geological models. Energies 2021, 14, 7338. [Google Scholar] [CrossRef]
  57. Jiang, G.Z.; Wang, Y.Q.; Hu, J.; Zhang, C.; Wang, Y.B.; Zuo, Y.H.; Tang, X.C.; Ma, F.; Hu, S.B. Medium-high temperature geothermal resources in China: Exploration directions and optimizing prospecting targets. Sci. Technol. Rev. 2022, 40, 76–82. [Google Scholar]
  58. Rao, S.; Huang, S.D.; Hu, S.B.; Gao, T. Mechanism of Global Hot Dry Rock System Exploration Target Selection of Hot Dry Rock in Chinese Continent: Enlightenment from Genesis. Earth Sci. 2023, 48, 857–877. [Google Scholar]
  59. Li, Y.; Zhang, Y.; Zhang, X.; Zhao, J.; Huang, Y.; Wang, Z.; Yi, Y. Distribution of geothermal resources in Eryuan County based on entropy weight TOPSIS and AHP–TOPSIS methods. Nat. Gas Ind. B 2024, 11, 213–226. [Google Scholar] [CrossRef]
  60. Liang, Y.K.; Song, R.C.; Zheng, H.A.; Zhang, C.; Liang, Y.; Cheng, H.W.; Zheng, F. Comprehensive evaluation of reservoirs based on the entropy weight method, TOPSIS, and the gray correlation method: Taking the Huangliu Formation in Yinggehai Basin as an example. J. Chengdu Univ. Technol. 2024, 51, 91–101. [Google Scholar]
  61. Cambazoğlu, S.; Yal, G.P.; Eker, A.M.; Şen, O.; Akgün, H. Geothermal resource assessment of the Gediz Graben utilizing TOPSIS methodology. Geothermics 2019, 80, 92–102. [Google Scholar] [CrossRef]
Figure 1. (a) Regional geological overview of the Yinggehai Basin [22,23]; (b) comprehensive stratigraphic columnar diagram [24].
Sustainability 16 07104 g001
Figure 2. (a) The variation of measured and corrected temperature with depth in Yinggehai Basin; (b) the variation of corrected temperature with depth in each well.
Sustainability 16 07104 g002
Figure 3. (a) Geothermal gradient map; (b) terrestrial heat flow map of the Yinggehai Basin.
Sustainability 16 07104 g003
Figure 4. (a) Thermal evolution of the AA′ profile in the central depression [25]; (b) the simulation results of the deep temperature field. The white lines represent the simulated isotherms at different depths, while the black lines indicate the deep velocity structure of the basin obtained from the joint measurement taken by the South China Sea Institute of Oceanology, Chinese Academy of Sciences, and the Center for Marine Geological Research at the University of Kiel, Germany [40].
Sustainability 16 07104 g004
Figure 5. (a) The thickness of the thermal reservoir in Member 1 of the Huangliu Formation; (b) the thickness of the thermal reservoir in Member 2 of the Huangliu Formation.
Sustainability 16 07104 g005
Figure 6. (a) Temperature at the top of the thermal reservoir in Member 1 of the Huangliu Formation; (b) temperature at the bottom of the thermal reservoir in Member 1 of the Huangliu Formation; (c) temperature at the top of the thermal reservoir in Member 2 of the Huangliu Formation; (d) temperature at the bottom of the thermal reservoir in Member 2 of the Huangliu Formation.
Sustainability 16 07104 g006aSustainability 16 07104 g006b
Figure 7. Porosity of the Huangliu Formation in the central depression of the Yinggehai Basin.
Sustainability 16 07104 g007
Figure 8. The geothermal resource calculation process of Huangliu Formation in the central depression of Yinggehai Basin.
Sustainability 16 07104 g008
Figure 9. Monte Carlo simulation results for geothermal resources of Members 1 and 2, as well as the entire Huangliu Formation, in the central depression of the Yinggehai Basin.
Sustainability 16 07104 g009
Figure 10. Integrated offshore utilization model for geothermal energy.
Sustainability 16 07104 g010
Table 1. Thermal physical parameters and values of the model.
Geological StructureRock Thermal Conductivity (k)
(W/(m•k)) [42]
Rock Radioactive Heat Generation Rate (A)
(μW/m3) [41]
Sedimentary Cover1.721.77
Upper Upper Crust2.930.9
Low Velocity Zone of the Lower Upper Crust3.11.3
Lower Crust3.30.024
Table 2. Depth and average depth of the top and bottom of the reservoir in the central depression of the Yinggehai Basin.
StratumReservoirTop DepthAverage Top DepthBottom DepthAverage Bottom DepthAverage Thickness
mmmmm
Member 1 of the Huangliu FormationR012517.9–3223.32896.22493.6–3369.73047.559.6
R022537.5–2862.42697.22591.6–2895.22770.027.7
R032528.8–3030.22734.92587.7–3100.32904.767.5
R042999.5–3249.63121.13003.5–3331.43221.038.52
R052408.9–2847.02660.62508.8–2892.22785.241.6
R062233.8–2903.92548.82267.0–3014.12708.150.6
R072691.8–2903.92754.32807.3–3079.13001.086.7
R082108.0–2875.92564.62120.3–3008.72763.068.0
R09818.0–2243.51336.1846.2–2321.91443.953.5
R10577.0–2330.71043.4655.5–2408.31189.177.65
R11904.7–2054.01663.21046.5–2083.61733.228.8
R12462.5–962.5648.5567.7–1009.0826.898.2
R133355.3–3578.73436.13388.6–3607.23529.435.7
R142373.7–4190.43424.72409.2–4244.63657.826.0
R15844.9–4096.22419.1844.3–4133.52571.121.7
R163674.4–3849.33752.03675.7–4109.93888.742.9
R173642.7–4700.04104.83675.7–4805.14261.436.9
Member 2 of the Huangliu Formation R182549.9–2753.22622.02495.5–3316.03051.258.6
R192440.4–2760.12592.12251.7–3258.52877.522.0
R202700.7–2857.72766.93292.2–3753.93558.260.5
R212543.1–3168.52884.33295.0–3815.23634.226.1
R223582.4–3952.33722.33610.4–4056.03788.938.6
R232118.6–4700.03854.53606.1–5048.44400.646.9
R24844.9–4477.33130.02673.8–4906.94207.265.9
R251470.9–3831.92813.62673.8–4197.63301.927.1
R263620.0–4190.43833.43775.8–4718.94391.2101.5
Table 3. Parameter table of thermophysical properties of the Huangliu Group thermal reservoir.
LithologyRock Thermal Conductivity (k)
(W/(m•K))
Rock Radioactive Heat Generation Rate (A)
( μ W / m 3 )
Previous Measurement Data [38,43]Current Measurement DataPrevious Measurement Data [43]Current Measurement Data
Sandstone2.09 ± 0.622.30 ± 0.541.44 ± 0.401.15 ± 0.31
Mudstone1.66 ± 0.292.03 ± 0.04-1.75 ± 0.08
Overall1.87 ± 0.522.25 ± 0.491.44 ± 0.401.31 ± 0.38
Current value1.97 ± 0.541.36 ± 0.38
Table 4. Parameter table of thermal reservoir characteristics of Huangliu Group.
StratumReservoir ρ r (g·cm−3) C r * (kJ·kg−1·°C−1) T w (°C) φ (%)
MinMaxLikeliestMinMaxLikeliestMinMaxLikeliestMinMaxLikeliest
Member 1 of the Huangliu FormationR011.723.482.490.841.32-125.5142.7139.27.5020.7017.93
R022.222.872.450.841.32-130.0138.2133.510.720.215.55
R032.402.642.510.841.32-151.0163.0159.04.9011.6010.85
R041.825.002.540.841.32-160.5169.7166.06.3520.7811.66
R051.792.662.460.841.32-110.1125.0123.40.1022.700.30
R062.252.582.430.841.32-96.2132.2110.88.8529.3421.30
R072.352.572.480.841.32-128.6141.6135.110.6015.5015.22
R081.202.512.450.841.32-119.6139.5128.721.1026.5022.17
R092.022.642.400.841.32-56.797.667.110.9917.3213.5
R102.272.592.430.841.32-50.777.264.23.7228.8624.95
R112.212.542.420.841.32-68.7100.286.3029.2013.36
R121.232.342.150.841.32-41.276.156.71.8029.4017.78
R132.322.652.490.841.32-171.3177.9175.2020.0010.58
R141.892.512.270.841.32-123.1210.6171.27.4039.3025.84
R151.862.692.380.841.32-91.3173.1132.10.3042.106.41
R161.603.292.400.841.32-160.5201.6181.65.8236.521.04
R171.523.262.540.841.32-187.5196.4192.75.6022.0012.38
Member 2 of the Huangliu FormationR182.322.512.420.841.32-114.4135.8124.613.135.422.12
R192.252.582.440.841.32-86.2132.1106.08.8529.3419.79
R202.232.832.500.841.32-140.4157.1146.24.5029.8025.52
R211.825.002.520.841.32-170.2188.5177.56.3520.7811.66
R221.892.632.480.841.32-185.7222.5200.47.0025.5012.81
R231.523.262.550.841.32-168.5216.6189.55.6022.0012.28
R242.032.682.400.841.32-167.8217.5190.05.8236.5017.69
R252.502.792.700.841.32-151.7177.9163.60.9014.259.05
R262.372.422.400.841.32-159.3226.1187.411.2037.3027.92
* Indicates the use of a uniform distribution model; all others are modeled as triangular distributions.
Table 5. Experimental simulation for assessing iteration numbers in Monte Carlo methods: a case study based on the geothermal resource calculations of the S26 thermal reservoir.
Number of IterationsMin
(×1019 J)
Max
(×1019 J)
Mean
(×1019 J)
Medin
(×1019 J)
10002.21 5.00 3.40 3.39
20002.26 4.98 3.42 3.41
30002.25 4.86 3.41 3.40
40002.20 5.29 3.44 3.43
50002.23 5.05 3.42 3.41
60002.20 5.11 3.42 3.40
70002.18 5.06 3.41 3.40
80002.16 5.10 3.41 3.40
90002.22 5.14 3.42 3.41
10,0002.205.25 3.42 3.40
Table 6. Results of geothermal resource quantification using Monte Carlo and volume methods.
StratumReservoirMonte Carlo Calculation of Total Geothermal ResourcesVolumetric Method of Calculating Geothermal Resources (×1018 J)
Probability = 100%Probability = 90%Maximum Probability Q
(×1018 J)
Q r
(×1018 J)
Q w
(×1018 J)
Min
(×1019 J)
Max
(×1019 J)
Mean
(×1019 J)
Min
(×1019 J)
Max
(×1019 J)
Probability
%
Mean
(×1019 J)
Member 1 of the Huangliu FormationS0112.06 31.83 20.43 15.50 25.82 9.14 20.36 18.30 13.00 5.30
S020.94 1.67 1.28 0.42 1.46 7.11 1.31 1.09 0.81 0.28
S031.46 2.46 1.95 1.61 2.30 5.79 2.16 1.71 1.39 0.31
S040.47 1.52 0.85 0.60 1.20 9.08 0.83 0.62 0.50 0.12
S052.24 5.46 3.87 3.00 4.78 8.24 3.85 3.42 3.40 0.02
S062.22 4.90 3.42 2.74 4.19 9.24 3.24 2.98 1.96 1.02
S070.30 0.50 0.40 0.33 0.47 6.18 0.40 0.35 0.26 0.09
S082.71 6.02 4.35 3.44 5.33 8.71 4.36 4.27 2.78 1.50
S093.28 11.40 6.20 4.35 8.63 9.99 5.39 4.70 3.61 1.09
S101.25 3.63 2.29 1.67 2.95 8.83 2.25 2.11 1.29 0.82
S110.73 1.88 1.26 0.95 1.59 9.26 1.21 1.12 0.87 0.26
S120.13 0.71 0.36 0.22 0.53 10.01 0.32 0.34 0.23 0.11
S130.51 0.88 0.70 0.57 0.82 6.38 0.62 0.60 0.49 0.11
S1417.57 50.56 31.61 23.52 40.29 9.70 31.42 29.55 17.25 12.30
S1513.58 52.96 29.76 20.48 40.29 10.04 28.54 24.37 21.49 2.87
S1616.95 45.42 29.08 22.28 36.69 8.99 28.91 25.49 16.82 8.67
S170.79 2.00 1.35 1.02 1.72 7.53 1.35 1.20 0.96 0.25
Member 2 of the Huangliu FormationS185.51 9.65 7.53 6.32 8.76 9.14 7.41 6.60 4.27 2.33
S193.34 8.01 5.43 4.15 6.88 7.83 5.11 4.71 3.20 1.50
S201.61 3.11 2.38 1.97 2.79 7.83 2.24 2.13 1.30 0.83
S211.68 5.80 3.29 2.29 4.63 9.81 2.75 2.34 1.88 0.46
S226.11 12.66 9.27 7.50 11.16 8.46 8.86 8.19 6.42 1.77
S2338.21 112.63 70.42 51.85 90.92 10.33 66.49 61.64 49.12 12.52
S2423.27 55.91 39.49 31.86 47.74 9.45 38.28 34.11 24.09 10.02
S252.13 4.03 3.01 2.44 3.62 6.93 2.78 2.61 2.23 0.38
S2622.51 47.06 34.19 27.66 41.29 9.16 32.82 30.45 17.41 13.05
Table 7. Index weight calculation results.
ItemPrimary Advantageous Target AreaSecondary Advantageous Target Area
Weightage Percentage %Positive Ideal SolutionNegative Ideal SolutionWeightage Percentage %Positive Ideal SolutionNegative Ideal Solution
Rock Density (kg/m3)1.6580.988680.011322.0590.988680.01132
Reservoir Porosity (%)2.5480.998490.001513.1650.998490.00151
Depth of Reservoir Burial (m)3.7970.997430.002574.7170.997430.00257
Reservoir Temperature (°C)16.4300.999440.0005620.4120.999440.00056
Reservoir Volume (m3)24.5460.999730.0002630.4950.999730.00028
Geothermal Resource Abundance of the Reservoir (J/m2)3.3120.993920.006084.1150.993920.00608
Average Terrestrial Heat Flow of the Reservoir (mW/m2)20.8990.999600.0004026.5360.999400.00060
Resource Quantity Contained in the Reservoir’s Rock Framework (J)21.3590.999400.000606.7720.997790.00221
Resource Quantity Contained in the Reservoir’s Pore Fluid (J)5.4510.997790.002211.7290.999600.00040
Table 8. Geothermal reservoir evaluation results based on entropy weight-TOPSIS method.
ReservoirPrimary Advantageous Target AreaReservoirSecondary Advantageous Target Area
D+DComprehensive Score IndexRankingD+DComprehensive Score IndexRanking
R140.4170.760 0.64571R140.328 0.832 0.71731
R230.4590.805 0.63672R230.528 0.738 0.58282
R240.5710.550 0.49053R260.629 0.647 0.50713
R260.6360.597 0.48434R240.584 0.564 0.49134
R160.6290.481 0.43345R160.617 0.515 0.45515
R150.7020.391 0.35796R010.688 0.395 0.36446
R010.7030.363 0.34077R150.730 0.383 0.34417
R180.8360.275 0.24728R180.807 0.326 0.28808
R220.8340.265 0.24139R100.864 0.336 0.27999
R100.8940.278 0.237310R220.817 0.311 0.275510
R090.8570.252 0.227011R090.829 0.304 0.268211
R120.9410.268 0.221912R120.917 0.327 0.262712
R080.8680.237 0.214813R080.838 0.291 0.257913
R020.9090.247 0.213914R020.880 0.305 0.257214
R200.8980.237 0.208515R200.869 0.293 0.252315
R210.8910.230 0.205316R210.863 0.286 0.248716
R130.9250.239 0.205117R130.898 0.296 0.248117
R110.9150.229 0.200218R110.888 0.286 0.243918
R060.8900.220 0.198119R060.862 0.275 0.242119
R190.8660.213 0.197120R040.893 0.283 0.240820
R040.9210.226 0.196621R190.838 0.265 0.240421
R170.9270.226 0.196222R170.904 0.284 0.238822
R050.9070.216 0.192523R070.917 0.279 0.233323
R250.9200.217 0.190524R050.892 0.269 0.231424
R070.9410.221 0.190125R250.902 0.271 0.231325
R030.9210.196 0.175226R030.898 0.253 0.219626
Note: D+ and D values represent the distances (Euclidean distance) to the best or worst solution.
Disclaimer/Publisher’s Note: The statements, opinions and data contained in all publications are solely those of the individual author(s) and contributor(s) and not of MDPI and/or the editor(s). MDPI and/or the editor(s) disclaim responsibility for any injury to people or property resulting from any ideas, methods, instructions or products referred to in the content.

