1. Introduction
In the context of increasingly severe global climate change, energy conservation, emission reduction, and green sustainable development have become hot topics of widespread concern in the international community [
1,
2,
3,
4]. The signing of the Paris Agreement in 2016 marked a new stage in the global transition towards low-carbon development, with countries committing to take proactive measures to reduce greenhouse gas emissions [
5,
6]. In recent years, the global tourism industry has witnessed unprecedented growth, contributing significantly to economic development. However, this growth has also resulted in increased energy consumption and carbon emissions, raising concerns about environmental sustainability. The tourism industry is estimated to contribute approximately 8% of global greenhouse gas emissions, surpassing many other economic sectors. This has led to an urgent need to understand and mitigate the environmental impacts of tourism activities, particularly in major tourism markets like China [
7]. As the world’s largest domestic tourism market, China’s task of reducing carbon emissions in the tourism industry is particularly urgent [
8,
9].
In recent years, China’s tourism industry has developed rapidly [
9]. In 2022, the country hosted nearly 5 billion domestic and international tourists, and the contribution of tourism to economic growth has continued to rise [
10]. However, such a large scale of tourism has also led to significant energy consumption and carbon emissions, causing a series of negative impacts on the ecological environment [
11]. Against this backdrop, how to balance the development of the tourism economy with the protection of the ecological environment and promote the green and low-carbon transition of the tourism industry has become an important topic in contemporary tourism research [
12]. Assessing the energy consumption and carbon emissions of the tourism industry is fundamental to developing green and low-carbon tourism. Currently, scholars at home and abroad have conducted extensive carbon emission accounting for the tourism industry from both “bottom-up” and “top-down” approaches across different spatial scales, including global, national, provincial, and tourism destination levels [
11,
13,
14]. Additionally, some scholars have introduced economic indicators to evaluate the efficiency of carbon emissions in the tourism industry, exploring the relationship between tourism economic income and carbon emissions [
15]. These research findings provide crucial evidence for controlling and reducing carbon emissions in the tourism industry. However, many current studies mainly focus on the relationship between the tourism industry and socio-economic factors [
16,
17]. While they often analyze the carbon emissions generated by tourism and its various sectors, there is limited attention given to the extent of the pressure that these carbon emissions exert on the ecological environment [
18,
19].
Theoretical approaches to tourism and environmental sustainability have evolved over the years [
20]. The concept of sustainable tourism emerged in the late 20th century, emphasizing the need for environmentally responsible practices within the tourism industry. The tourism carbon footprint is a critical aspect of sustainable tourism, involving the measurement and analysis of carbon emissions generated by tourism activities [
21,
22]. Recent advancements in this field have introduced frameworks for evaluating the relationship between tourism development and environmental pressures, such as the Tourism Carbon Pressure Index (TCPI). This index provides a comprehensive assessment of the balance between tourism-related carbon emissions and the ecological capacity to absorb these emissions [
23].
To expand the theoretical framework, it is essential to consider the broader context of carbon carrying capacity and its implications for sustainable tourism. Carbon carrying capacity refers to the ability of a region’s ecosystem to absorb carbon emissions, and it is influenced by factors such as vegetation cover and land use. Integrating this concept into tourism studies allows for a more nuanced understanding of the environmental impacts of tourism and the potential for sustainable practices. Additionally, the use of geographic information systems (GIS) and remote sensing technologies has enhanced the ability to assess spatial patterns of carbon emissions and carrying capacity at finer scales.
China’s dual carbon goals of peaking carbon emissions by 2030 and achieving carbon neutrality by 2060 present new challenges for all industries, including tourism [
24,
25]. With the deepening of research, more scholars are focusing on tourism carbon carrying capacity, which refers to the capacity of vegetation within a region to fix CO
2 through photosynthesis [
26]. Studies have shown that carbon carrying capacity, including the carbon sequestration abilities of forests, grasslands, and farmland ecosystems, is an essential indicator for determining whether a region can withstand the carbon emissions from its tourism industry [
27]. This study systematically analyzes the spatiotemporal characteristics of carbon emissions and carbon carrying capacity of China’s tourism industry from 2000 to 2022, based on data from 31 provinces and cities. This comprehensive analysis not only reveals significant regional differences in carbon emissions and carrying capacity but also introduces the Tourism Carbon Pressure Index (TCPI) as a novel tool to quantify the balance between tourism carbon emissions and regional ecosystem capacities. By evaluating the impact of tourism development on the ecological environment, especially considering the effects of the COVID-19 pandemic, this research highlights the importance of tailored policy recommendations for different regions. The integration of diverse data sources ensures the robustness and accuracy of this analysis, aligning with China’s national carbon neutrality goals and providing a scientific basis for promoting sustainable tourism development. These findings contribute to the discourse on achieving a green transition in the tourism sector, offering practical strategies for reducing carbon emissions through green transportation, eco-friendly hotels, and green scenic spots.
By constructing models for tourism carbon carrying capacity and carbon pressure index, this study evaluates the impact of tourism development on the ecological environment in various regions and proposes corresponding policy recommendations. This research aims to provide a scientific basis and decision-making support for the green and low-carbon transition of China’s tourism industry, contribute to the achievement of the dual carbon goals and promote the sustainable development of the tourism sector.
3. Results
3.1. Spatiotemporal Characteristics of Tourism Carbon Emissions
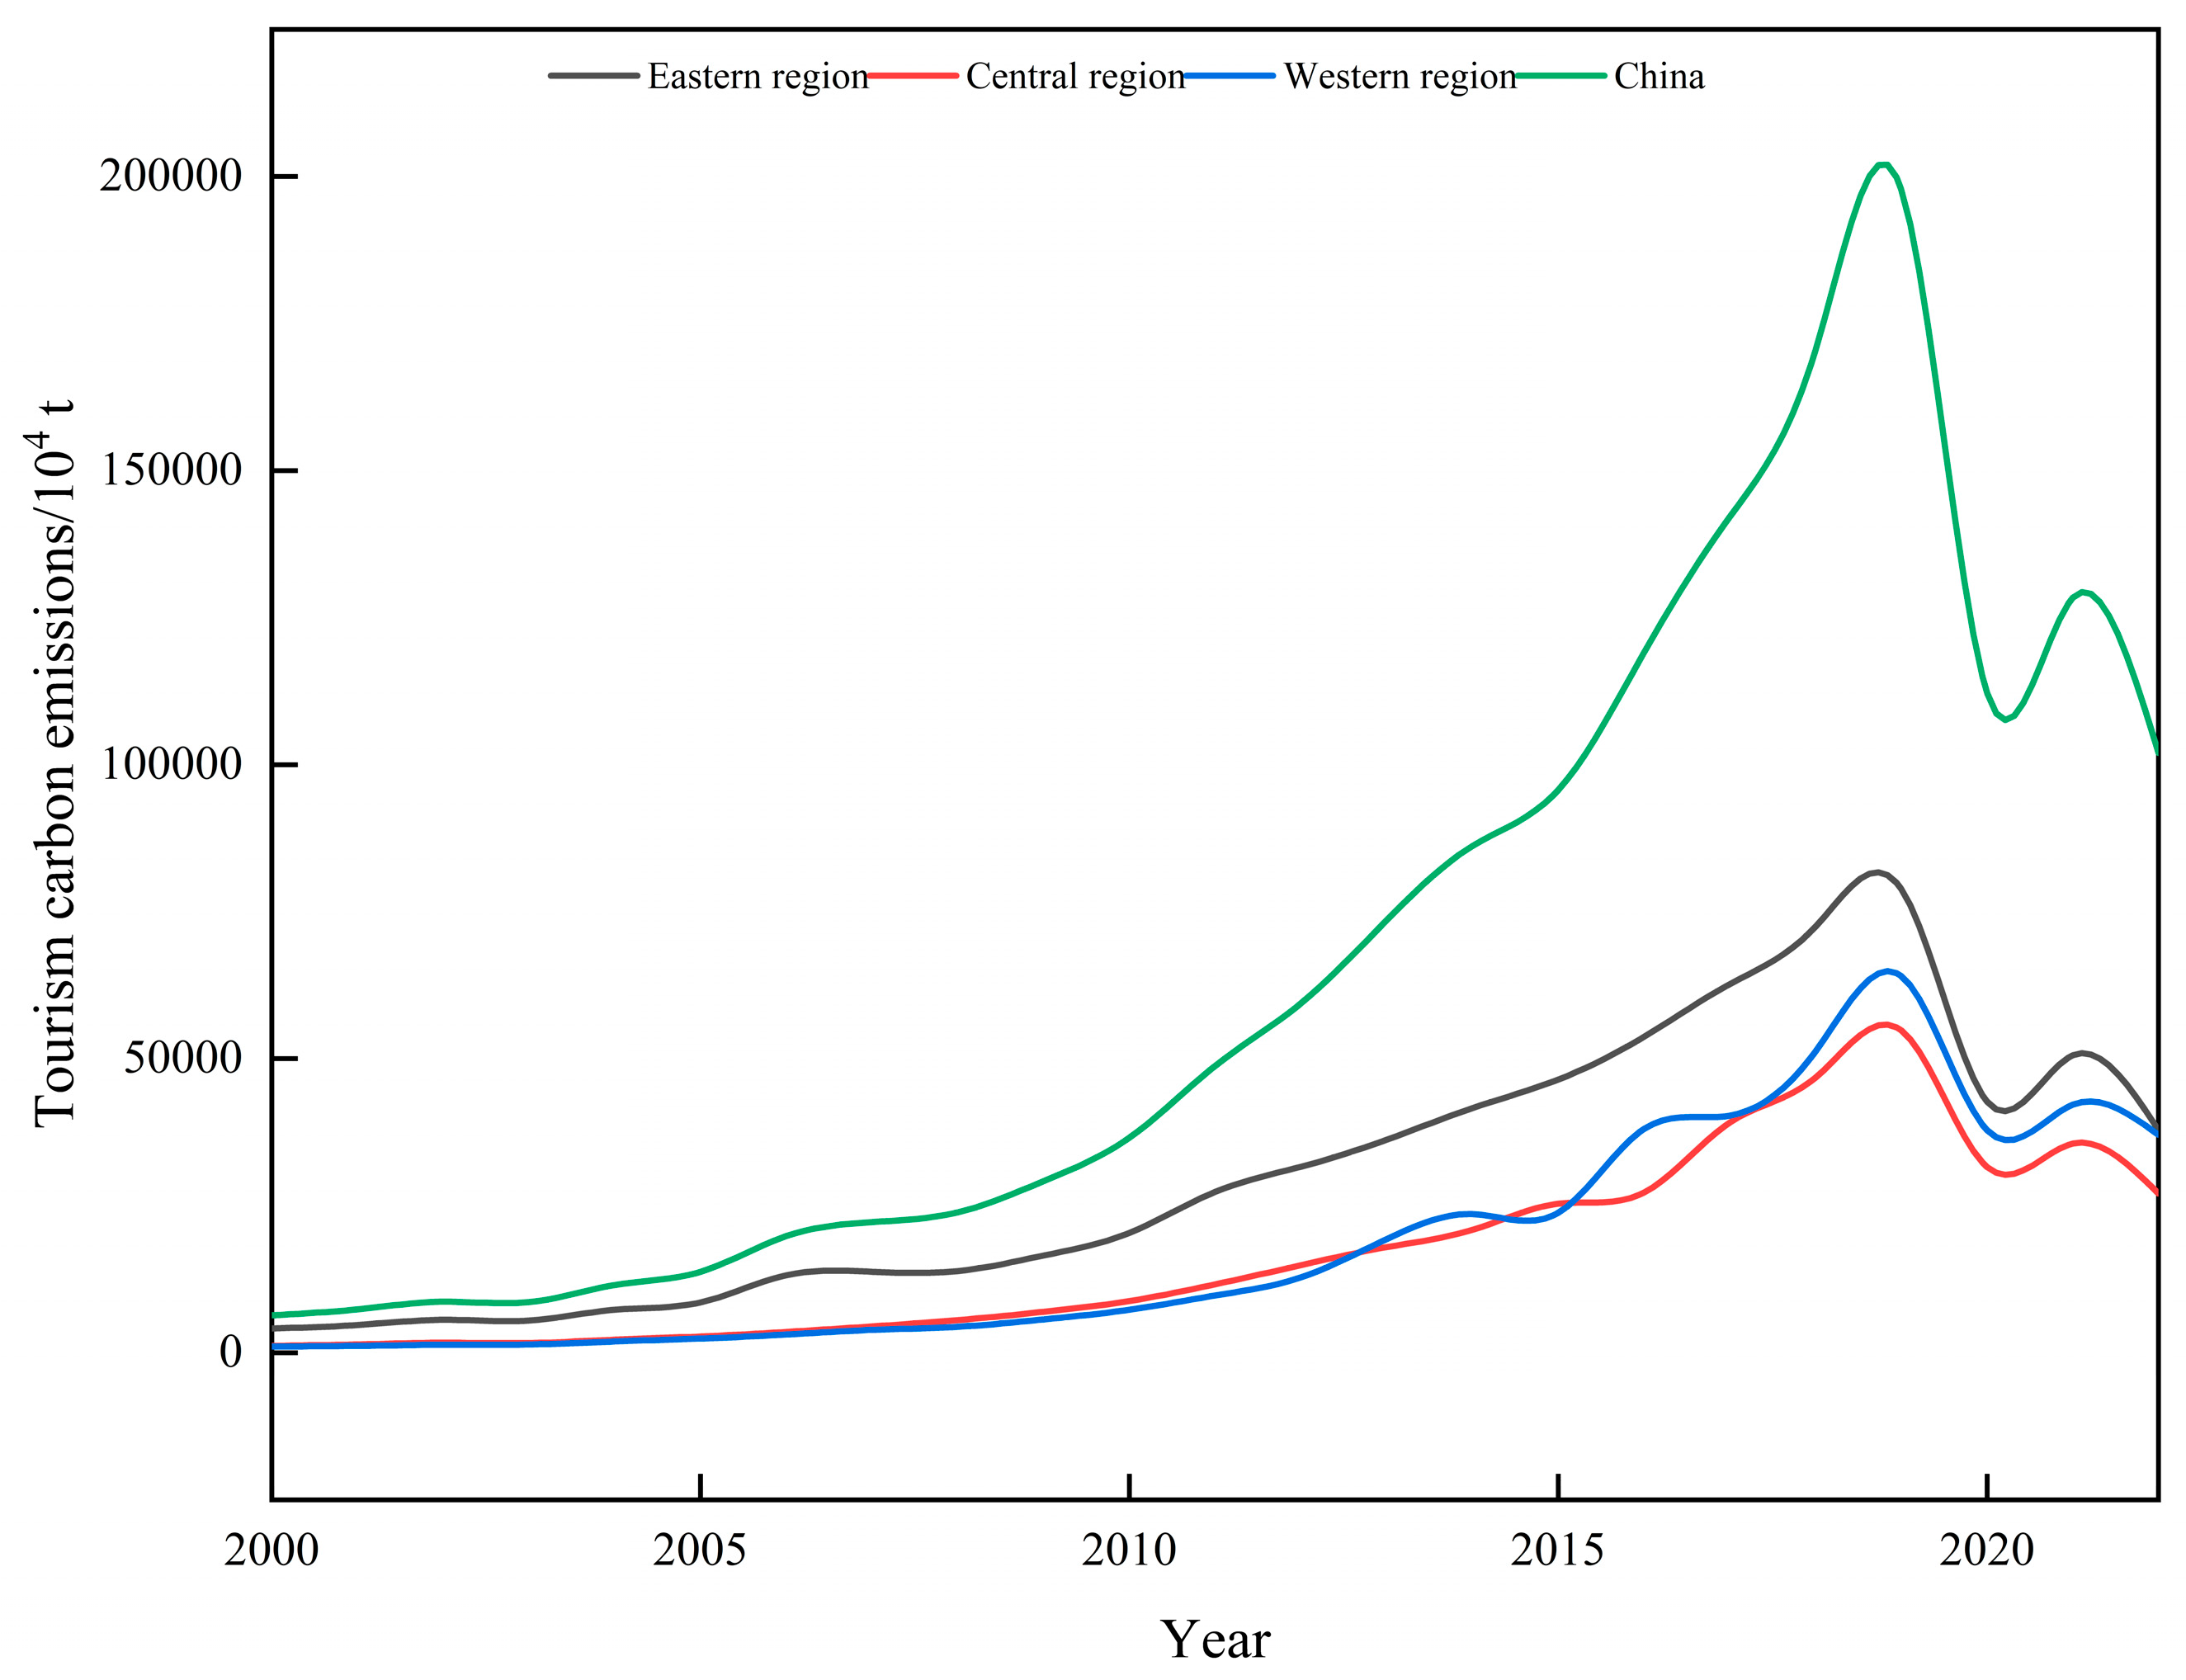
As shown in
Figure 2, from 2000 to 2022, carbon emissions from China’s tourism industry exhibited a significant upward trend. Nationwide, carbon emissions increased from 63.71 million tons in 2000 to 1978.89 million tons in 2019, representing more than a 30-fold increase. This growth was particularly rapid after 2016. However, the global COVID-19 pandemic in 2020 led to a sharp reduction in tourism activities, causing national carbon emissions to drop to 1121.28 million tons, highlighting the severe impact of the pandemic on the tourism industry. Although carbon emissions rebounded in 2021 and 2022, reaching 1284.16 million tons and 1019.99 million tons, respectively, they have not returned to pre-pandemic levels.
Regionally, carbon emissions in the eastern region increased from 41.23 million tons in 2000 to 789.47 million tons in 2019, approximately a 19-fold increase, making it one of the major contributors to national carbon emissions. The eastern region saw a significant decline in carbon emissions in 2020 due to the pandemic, but there was some recovery in 2021 and 2022. In the central region, carbon emissions rose from 11.83 million tons in 2000 to 548.64 million tons in 2019, about a 46-fold increase, indicating rapid development in the tourism industry. Despite a substantial drop in carbon emissions in 2020, the central region recovered quickly, with emissions rising to 356.17 million tons in 2021 and 270.90 million tons in 2022. The western region’s carbon emissions grew from 10.65 million tons in 2000 to 640.78 million tons in 2019, approximately a 60-fold increase, making it the fastest-growing region. Although the western region also saw a significant decline in carbon emissions in 2020, its recovery was relatively slow, with emissions of 421.88 million tons in 2021 and 370.46 million tons in 2022.
These regional differences reflect the varying impacts of economic development levels, tourism industry scale, and population mobility. In the eastern region, due to a stronger economic foundation and a more mature tourism industry, carbon emissions grew relatively steadily. In the central and western regions, rapid development in tourism led to a swift increase in carbon emissions, indicating strong growth potential. Furthermore, the global pandemic in 2020 had a marked impact on the tourism industry, resulting in a significant decline in carbon emissions across all regions. However, recovery varied by region, with the central region showing stronger recovery capability, while the western region’s recovery was slower.
3.2. Spatiotemporal Characteristics of Tourism Carbon Carrying Capacity
Analyzing the changes in tourism carbon carrying capacity in China’s eastern, central, and western regions from 2000 to 2022 reveals distinct trends and characteristics in each region. In the eastern region, the tourism carbon carrying capacity increased from 1287.73 wt in 2000 to 5052.64 wt in 2019, indicating rapid tourism development. However, due to the COVID-19 pandemic in 2020, the carbon carrying capacity significantly dropped to 2544.50 wt, with a slight recovery afterward, but not reaching pre-pandemic levels. In the central region, the carbon carrying capacity grew from 1680.72 wt in 2000 to 12,094.77 wt in 2019, with particularly notable growth after 2015, reflecting the rapid expansion of the tourism industry in this region. The pandemic also impacted the central region, reducing the carbon carrying capacity to 6794.41 wt in 2020. The western region saw the largest increase in tourism carbon carrying capacity, from 2384.10 wt in 2000 to 22,760.10 wt in 2019, primarily due to Western Development policies and abundant tourism resources. However, the pandemic caused a decrease to 12,451.89 wt in 2020.
The eastern, central, and western regions exhibit significant differences in economic development levels, policy support, and tourism resources. The eastern region is economically advanced with a mature tourism industry, but recent growth has been relatively modest. The central region is in a rapid development phase, with tourism infrastructure gradually improving. The western region, benefiting from policy support and resource advantages, has shown remarkable growth in carbon carrying capacity.
The impact of the COVID-19 pandemic on the tourism industry is evident, with significant decreases in tourism carbon carrying capacity across all regions in 2020. This change reflects not only the reduction in tourism activities but also the industry’s vulnerability to public health crises. To achieve sustainable tourism development, regions should vigorously promote green tourism and reduce carbon emissions. For example, they should promote green transportation, build eco-friendly hotels, and strengthen environmental protection in scenic spots. The eastern region should focus on enhancing the technological content of tourism infrastructure and improving resource utilization efficiency. The central and western regions should continue to improve infrastructure and enhance tourism service quality.
Governments should continue to strengthen policy support for the tourism industry, especially in the post-pandemic period, through measures such as tax incentives and financial subsidies to help tourism enterprises resume operations. Each region should leverage its resource advantages to promote diversified tourism development. For instance, the eastern region can develop urban tourism and conference economy, the central region can focus on ecological and cultural tourism, and the western region can promote adventure and ethnic tourism.
The analysis of China’s tourism carbon carrying capacity from 2000 to 2022 shows that the trends and characteristics vary across regions, reflecting the phased characteristics and regional differences in tourism development. The eastern region has developed relatively steadily, the central region is in a rapid development stage, and the western region has the fastest growth. However, the impact of the pandemic on the tourism industry is substantial, with significant decreases in carbon carrying capacity across all regions. In the future, regions should emphasize green tourism and sustainable development, enhance infrastructure construction, and strengthen policy support to promote the healthy development of the tourism industry (
Table 3).
3.3. Tourism Carbon Pressure Index
Based on the Tourism Carbon Pressure Index (TCPI) data from
Table 4, we can conduct an in-depth analysis of the changes in tourism carbon pressure and environmental risks in the eastern, central, and western regions of China from 2000 to 2022. In the eastern region, the TCPI increased from 0.72 in 2000 to 0.95 in 2022, indicating that the tourism carbon pressure in this region has been steadily increasing, along with a gradual rise in environmental risk. The TCPI value in the eastern region has remained above 0.5 and has been approaching 1 annually, reflecting the growing environmental pressure from the tourism industry and significant environmental risks.
In the central region, the TCPI increased from 0.42 in 2000 to 0.82 in 2022. Although the initial TCPI value in the central region was relatively low, it has grown rapidly, reaching 0.82 in 2022, indicating that tourism carbon pressure in this region has also been increasing annually, gradually approaching the levels observed in the eastern region. Since 2007, the TCPI in the central region has exceeded 0.5, entering the low-risk category, and has gradually moved into moderate and high-risk categories after 2010. In the western region, the TCPI increased from 0.32 in 2000 to 0.73 in 2022, demonstrating a significant upward trend. Although the initial TCPI value in the western region was the lowest, its growth rate has been notable, especially since 2010, with a rapid rise in the TCPI value, reaching 0.73 in 2021, entering the extreme-risk category. Nationally, the TCPI increased from 0.49 in 2000 to 0.83 in 2022, indicating a yearly increase in tourism carbon pressure. Since 2003, the national TCPI value has exceeded 0.5, entering the low-risk category, and reaching the extreme-risk category after 2019.
According to the environmental risk levels defined by TCPI values, the eastern region has been between high and extreme risk since 2000, reflecting significant environmental pressure from the tourism industry. The central region was in the safe category from 2000 to 2006, then gradually moved into the low, moderate, and high-risk categories, reaching high risk in 2022. The western region remained in the safe and low-risk categories from 2000 to 2011, then gradually moved into the moderate-risk category, and reached the extreme-risk category in 2022. The high TCPI values in the eastern region are due to its developed economy, dense population, rapid tourism development, high carbon emissions, and relatively limited carbon sequestration capacity of the ecological environment, leading to high environmental risks. Although the central and western regions initially had stronger carbon sequestration capacities, the increase in carbon emissions due to tourism development has gradually surpassed these capacities, resulting in rising TCPI values and increased environmental risks.
Data shows that despite reduced tourism activities due to the pandemic in 2020 and 2021, the TCPI values did not significantly decrease. This might be due to the rapid rebound in carbon emissions during the tourism recovery process, while the carbon sequestration capacity of the ecological environment did not catch up promptly. In the future, all regions should strengthen ecological protection and enhance the natural environment’s carbon sequestration capacity. Specific measures include afforestation, wetland protection, and ecological restoration. Promoting green transportation, building eco-friendly hotels and scenic spots, and strengthening green tourism promotion can reduce carbon emissions from the tourism industry. The government should implement relevant policies to support low-carbon and sustainable tourism development, provide financial and technical support, and encourage businesses and individuals to engage in green tourism. Advanced technologies should be utilized to enhance carbon absorption and monitoring capabilities, such as using remote sensing technology to monitor ecological changes and applying carbon capture and storage technologies.
The analysis of the TCPI values of the eastern, central, and western regions of China from 2000 to 2022 shows an upward trend, indicating increasing environmental pressure from the tourism industry. The eastern region has consistently been between high and extreme risk, while the central and western regions have seen rising risk levels. To achieve sustainable tourism development, regions need to strengthen ecological protection, promote green tourism, rely on policy support and technological innovation, reduce tourism carbon emissions, and enhance the environment’s carbon sequestration capacity, thereby achieving harmonious coexistence between humans and nature.
3.4. Provincial Tourism Carbon Pressure
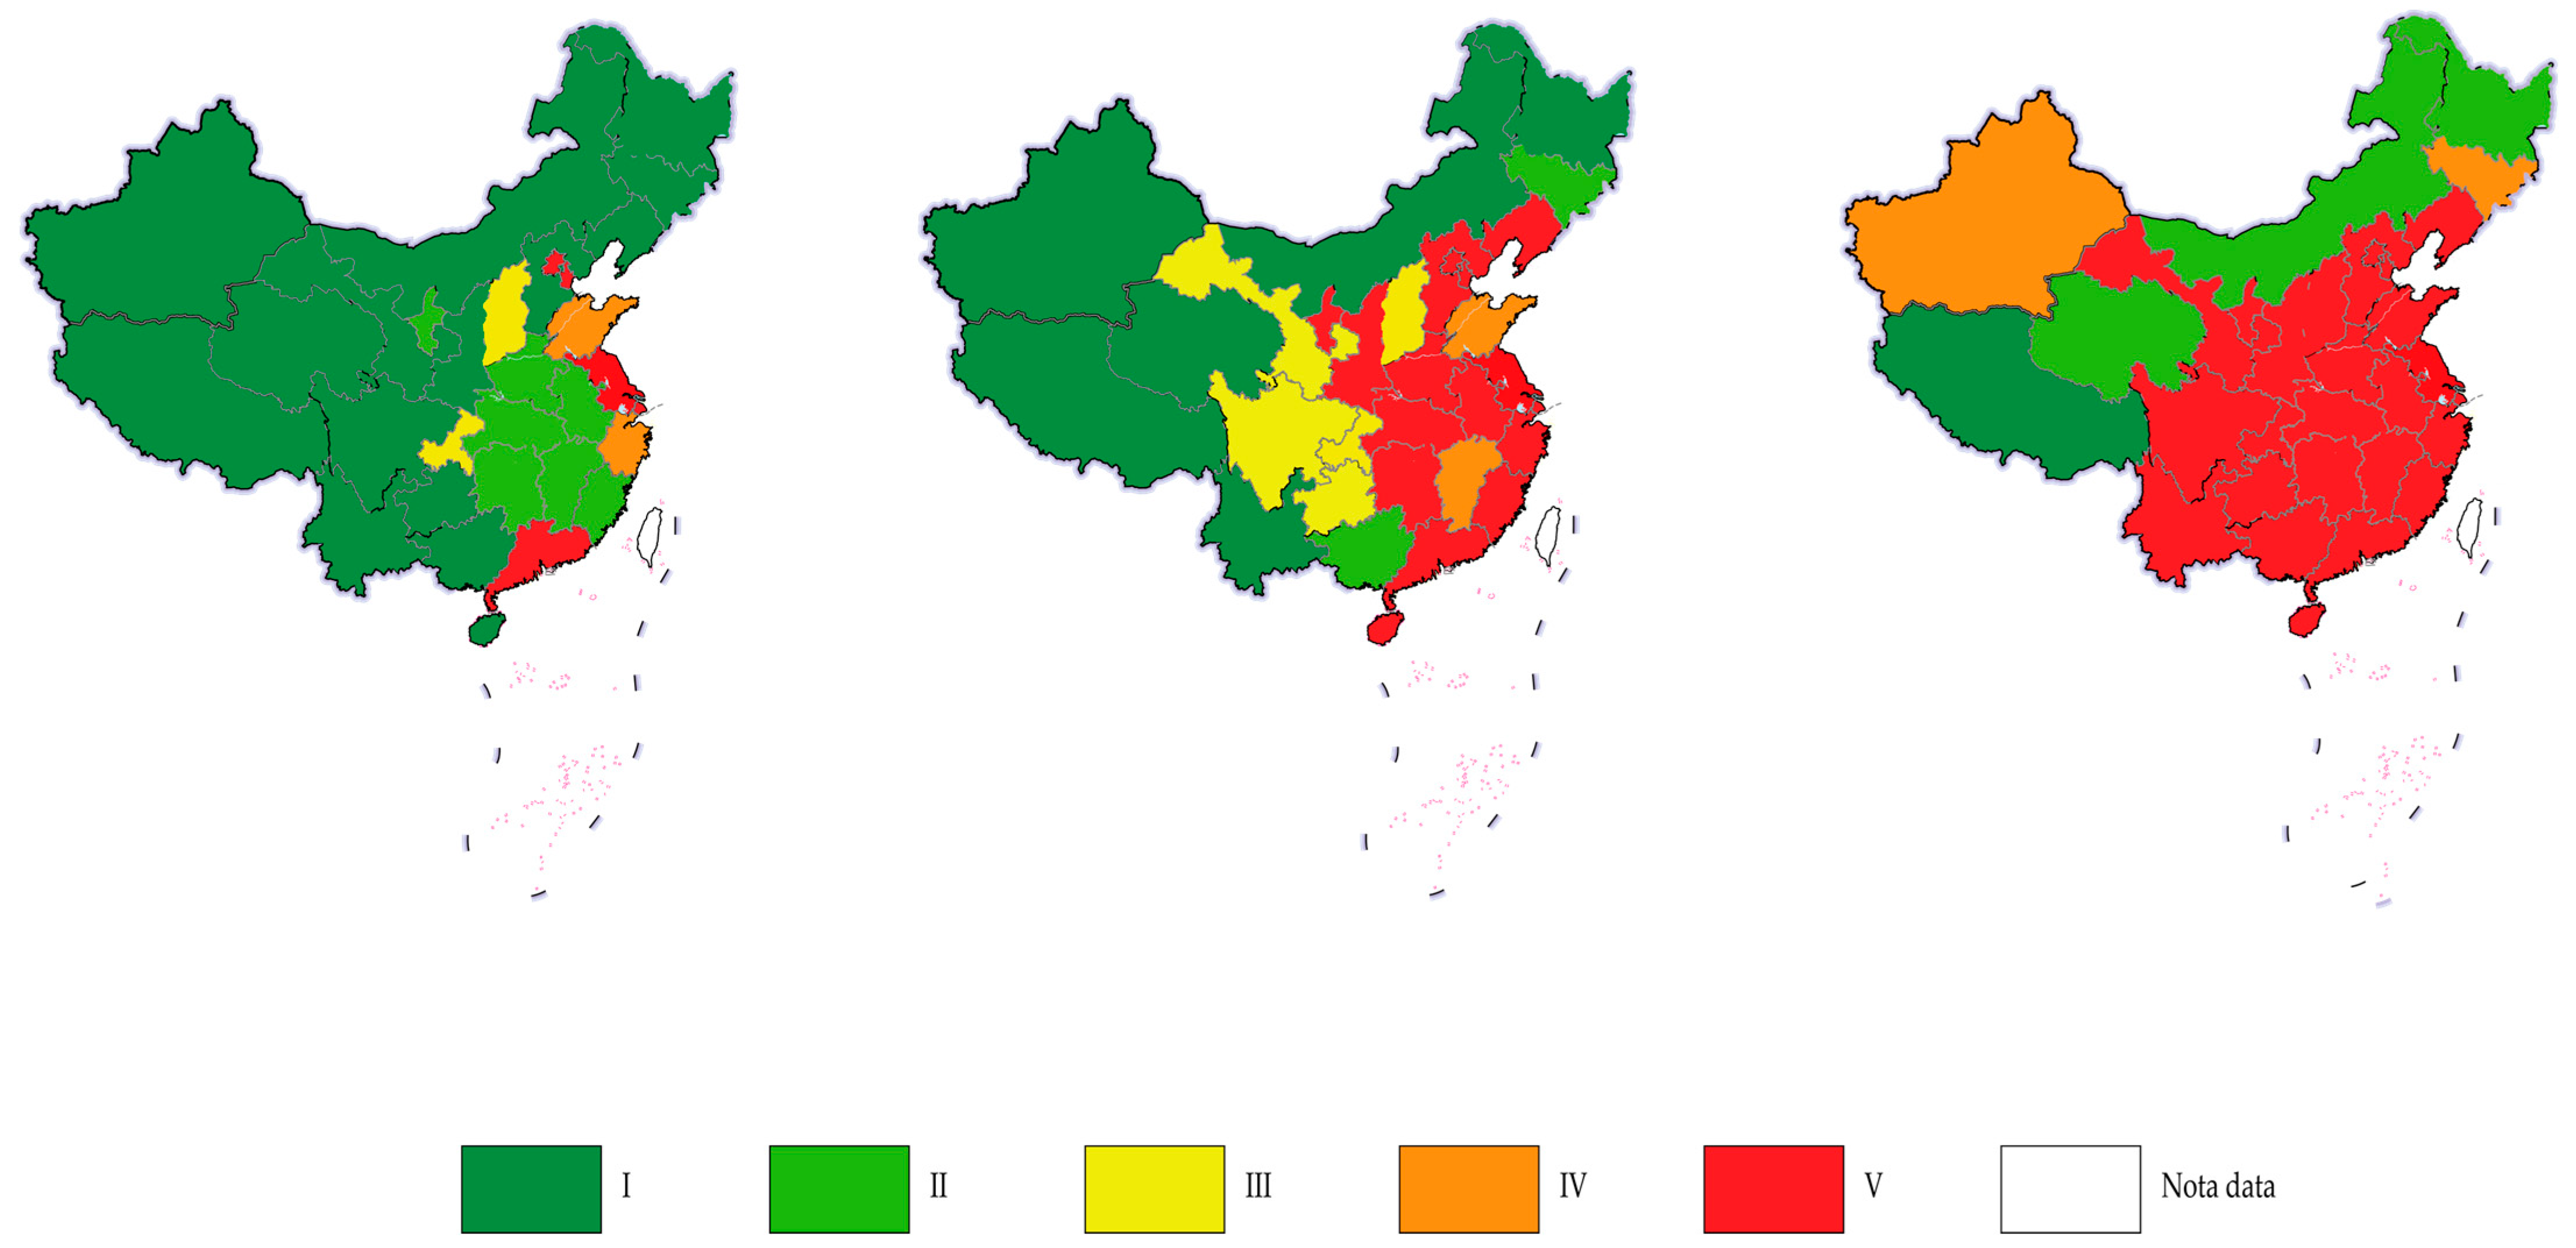
This study begins from the year 2000, and due to the large volume of data, we have selected 2010 and 2021 as comparison years. Overall, the Tourism Carbon Pressure Index (TCPI) for the 31 provinces in China shows an upward trend between 2000, 2010, and 2021 (
Figure 3). In 2000, most provinces had low TCPI values, falling into the safe or low-risk categories. However, by 2010, many provinces had significantly higher TCPI values, entering moderate and high-risk categories. By 2021, the TCPI values had further increased in most provinces, with many reaching the extreme risk category, indicating a significant rise in environmental pressure from the tourism industry.
Eastern regions include Beijing, Tianjin, Hebei, Liaoning, Shanghai, Jiangsu, Zhejiang, Fujian, and Shandong. The data indicate that these provinces had relatively high TCPI values in 2000, 2010, and 2021. Particularly, Beijing, Tianjin, Shanghai, and Jiangsu consistently fell into the high-risk and extreme-risk categories at all three time points, demonstrating substantial environmental pressure from the tourism industry in these economically developed areas. Central regions include Anhui, Jiangxi, Henan, Hubei, and Hunan. In 2000, the TCPI values for these provinces were relatively low, mostly in the safe or low-risk categories. However, by 2010 and 2021, the TCPI values had significantly risen, gradually entering the moderate and high-risk categories, reflecting the increasing environmental impact of the rapidly developing tourism industry in the central region. Western regions include Inner Mongolia, Guangxi, Chongqing, Sichuan, Guizhou, Yunnan, Tibet, Shaanxi, Gansu, Qinghai, Ningxia, and Xinjiang. In 2000, the TCPI values in the western region were generally low, with many provinces in the safe category. However, by 2010 and particularly in 2021, the TCPI values had significantly increased in many provinces, with some entering the moderate and high-risk categories. This indicates that as the tourism industry develops in the western region, environmental pressure is also intensifying.
Beijing, Tianjin, and Shanghai, the three directly governed municipalities, had TCPI values in the extreme-risk category in 2000, 2010, and 2021, with Shanghai reaching a TCPI value of 0.9977 in 2021. These provinces are economically developed, with highly concentrated tourism industries, large carbon emissions, and limited ecological carrying capacity, resulting in very high tourism carbon pressure. Guangdong, Jiangsu, and Zhejiang, economically advanced coastal provinces, also had high TCPI values at all three time points, especially in 2021, where they fell into the extreme-risk category. These provinces have rapidly growing economies, rich tourism resources, and frequent tourism activities, leading to significant environmental pressure. Sichuan, Guizhou, and Yunnan, representative provinces in the western region, had relatively low TCPI values in 2000, but these values significantly increased in 2010 and 2021, particularly in Sichuan, which reached a TCPI value of 0.8347 in 2021. These provinces attract a large number of tourists due to their beautiful natural landscapes, and as tourism develops, environmental pressure has gradually increased.
From 2000 to 2021, with the development of China’s economy and the prosperity of the tourism industry, the TCPI values in many provinces have risen year by year, with risk levels gradually increasing. In 2000, most provinces were in the safe or low-risk categories, but by 2010, many had entered the moderate and high-risk categories, and by 2021, even more provinces had entered the extreme-risk category. This trend reflects the increasing environmental pressure from the tourism industry, necessitating heightened attention and response.
4. Discussion
This study examines the changes in carbon emissions and carbon carrying capacity in China’s tourism industry from 2000 to 2022, revealing significant spatiotemporal characteristics and regional differences. Overall, carbon emissions from China’s tourism industry have shown a notable upward trend, especially after the signing of the Paris Agreement in 2016, which led to a more rapid increase in carbon emissions. Although the COVID-19 pandemic caused a temporary decline in emissions in 2020, data from 2021 and 2022 indicate a rebound, although not yet returning to pre-pandemic levels. Regarding carbon carrying capacity, the eastern, central, and western regions exhibit different growth patterns. The eastern region’s tourism carbon carrying capacity has grown relatively steadily but is limited by the ecological carrying capacity, resulting in smaller growth margins. In contrast, the central and western regions, due to their rich tourism resources and policy support, have shown more significant growth in carbon carrying capacity. Some scholars argue that tourism carbon carrying capacity is not only influenced by natural conditions but also closely related to regional economic development and the structure of the tourism industry. Therefore, although the eastern region is economically developed, its carbon carrying capacity growth is relatively slow.
The Tourism Carbon Pressure Index (TCPI) proposed in this study provides a new tool for assessing the environmental pressure from the tourism industry. The TCPI values in the eastern region have increased year by year, indicating growing environmental pressure from tourism. The TCPI values in the central and western regions, though initially low, have rapidly increased, reflecting the environmental pressures brought by the rapid development of tourism in these areas. Economically developed provinces such as Beijing, Tianjin, Shanghai, and Jiangsu have consistently high TCPI values, highlighting the environmental pressures from highly concentrated tourism activities. Conversely, the TCPI values in western provinces such as Inner Mongolia, Guangxi, and Chongqing have significantly increased in recent years, indicating rising environmental pressures alongside tourism development.
To achieve sustainable development in the tourism industry, regions should vigorously promote green tourism and reduce carbon emissions. Firstly, promoting green transportation is a crucial step in reducing carbon emissions from the tourism industry [
32]. Local governments should increase the promotion of electric and hybrid vehicles to gradually replace traditional fuel vehicles, especially in tourist attractions and city centers. Additionally, governments should accelerate the construction of charging infrastructure to ensure that electric vehicle users can conveniently charge their vehicles, thereby increasing the use of green transportation. Developing efficient and convenient public transportation systems is also key. Governments should expand the coverage and frequency of buses, subways, and light rail, encouraging tourists to choose low-carbon travel methods and reducing the use of private cars.
Secondly, building eco-friendly hotels and green scenic spots is an important means of promoting green development in the tourism industry [
33,
34]. Promoting the use of energy-saving materials and technologies, such as solar and wind energy, in tourism-related buildings can effectively reduce energy consumption [
35,
36]. Environmental protection in scenic spots is equally important. Strictly controlling development activities within scenic spots, implementing ecological restoration projects, and protecting the natural ecological environment can enhance the carbon absorption capacity of these areas. Governments should also promote green certification systems, certifying hotels, restaurants, and scenic spots according to environmental standards, and provide policy support and financial subsidies to certified enterprises to encourage more businesses to participate in green transformation.
Improving resource utilization efficiency is also an effective way to reduce carbon emissions [
37]. Promoting the use of efficient water-saving and energy-saving equipment in the tourism industry can reduce the waste of water resources and energy. Comprehensive promotion of waste sorting and resource recycling in tourist attractions and hotels can reduce carbon emissions from waste treatment [
38]. Governments and enterprises should use various channels to promote environmental protection and low-carbon concepts, raising public awareness and encouraging tourists to minimize their environmental impact during their travels, such as reducing the use of disposable products and advocating green consumption.
Policy support and technological innovation are important guarantees for promoting green development in the tourism industry [
39]. Governments should formulate a series of incentive policies, such as tax breaks and financial subsidies, to encourage tourism enterprises and related industries to undergo green transformation. Additionally, increasing support for the research and development of green and environmental technologies and promoting the application of new technologies, such as carbon capture and storage technologies and intelligent management systems, can greatly enhance the environmental performance of the tourism industry. Establishing and improving carbon emission monitoring and management systems for the tourism industry, with real-time monitoring and assessment of carbon emissions, can ensure the effective implementation of various emission reduction measures.
In terms of regional development, different regions should pursue differentiated development based on their characteristics. The eastern region should focus on enhancing the technological content of tourism infrastructure, improving resource utilization efficiency, and developing high-end tourism and convention economies. These regions are economically developed and have well-established infrastructure, allowing for green transformation through technological innovation and management optimization. The central region should continue to improve infrastructure construction, enhance tourism service quality, and develop eco-tourism and cultural tourism. These regions have abundant natural resources and deep cultural heritage, which can attract more tourists while emphasizing environmental protection. The western region should fully utilize its rich natural and cultural resources to develop adventure tourism and ethnic tourism while focusing on ecological protection and sustainable development. The unique tourism resources of the western region offer great development potential, but it is also essential to balance development and conservation.
In summary, by promoting green transportation, building eco-friendly hotels and green scenic spots, improving resource utilization efficiency, strengthening policy support and technological innovation, and pursuing differentiated development based on regional characteristics, China’s tourism industry can achieve rapid development while effectively controlling carbon emissions and ensuring environmental sustainability. These measures will not only facilitate the green transformation of the tourism industry but also contribute significantly to achieving the national carbon neutrality goals.
5. Conclusions
This study provides a comprehensive analysis of the carbon emissions dynamics and environmental sustainability in China’s tourism sector from 2000 to 2022. The findings indicate a significant upward trend in carbon emissions across all regions. The Tourism Carbon Pressure Index (TCPI) highlights the growing environmental pressure from tourism activities, particularly in economically developed eastern provinces, which consistently show high TCPI values, indicating severe environmental risks. In contrast, the central and western regions, while having lower initial TCPI values, have experienced rapid increases, reflecting the environmental impact of tourism development in these areas.
The eastern region, although economically advanced, shows limited growth in carbon carrying capacity, resulting in higher environmental risks. The central and western regions, supported by policy initiatives and abundant tourism resources, demonstrate significant growth in carbon carrying capacity, albeit accompanied by rising carbon emissions. The COVID-19 pandemic caused a temporary reduction in carbon emissions; however, the rapid rebound in tourism activities in 2021 and 2022 has increased environmental pressures. Economically developed provinces like Beijing, Tianjin, Shanghai, and Jiangsu face significant environmental challenges due to high tourism activity concentration, while provinces like Sichuan, Guizhou, and Yunnan are experiencing increased environmental pressures alongside tourism development.
Despite these insights, this research encountered several obstacles. Data limitations posed challenges, as comprehensive and consistent data were not always available across all provinces and years. Additionally, the complexity of isolating tourism-related carbon emissions from other sectors required meticulous methodology, which may have introduced uncertainties in the findings. Moreover, the regional diversity in tourism development necessitated tailored approaches for analysis, complicating direct comparisons across different areas.
For future research, it is imperative to focus on enhancing data accuracy and coverage to improve the robustness of carbon emission assessments. Longitudinal studies that incorporate more granular data on specific tourism activities and their environmental impacts will be invaluable. Additionally, exploring the effectiveness of green tourism policies and initiatives at the provincial level will provide deeper insights into sustainable tourism practices. Collaborative research involving stakeholders from government, academia, and industry can foster innovative solutions to mitigate tourism’s carbon footprint and advance environmental sustainability goals.
By promoting green transportation, building eco-friendly hotels and scenic spots, improving resource utilization efficiency, and strengthening policy support and technological innovation, China’s tourism industry can achieve sustainable growth. These measures will not only facilitate the green transformation of the tourism sector but also contribute significantly to achieving national carbon neutrality goals.
_Li.png)


