Article

Continuous UV/H2O2 Process: A Sustainable Wastewater Treatment Approach for Enhancing the Biodegradability of Aqueous PVA

Department of Chemical Engineering, Toronto Metropolitan University, 350 Victoria Street, Toronto, ON M5B 2K3, Canada
*
Author to whom correspondence should be addressed.
Sustainability 2024, 16(16), 7060; https://doi.org/10.3390/su16167060
Submission received: 29 June 2024 / Revised: 8 August 2024 / Accepted: 14 August 2024 / Published: 17 August 2024

Abstract

:
Implementing efficient and cost-effective wastewater treatment methods in wastewater treatment plants (WWTPs) is crucial for ensuring sustainable development in contemporary societies. This study explores the feasibility of a continuous UV/ H 2 O 2 tubular photoreactor as a pre-treatment to enhance the biodegradability of aqueous polyvinyl alcohol (PVA) solutions, known as a nonbiodegradable wastewater. Using a combination of a Box–Behnken design (BBD) and the response surface methodology (RSM), three main process variables, including the PVA feed concentration, the inlet H 2 O 2 concentration, and the PVA feed flow rate, are studied within ranges of 500–1500 mg/L, 390–780 mg/L, and 50–150 mL/min, respectively. The results show significant interaction effects between the PVA feed and inlet H 2 O 2 concentrations on the effluent B O D 5 /COD ratio. The optimal operating conditions are determined using the RSM, with a PVA feed concentration of 665 mg/L, an inlet H 2 O 2 concentration of 390 mg/L, and a PVA feed flow rate of 59 mL/min. Operating at this point leads to an increase in the effluent B O D 5 /COD ratio from 0.15 to 0.53, which is validated experimentally with a ±5% error. Under these conditions, the effluent demonstrates an enhanced biodegradability, allowing for redirection to a subsequent biological post-treatment phase. This study demonstrates that using the UV/ H 2 O 2 process to enhance the biodegradability of an aqueous PVA solution is more economical than focusing on the complete removal of total organic carbon (TOC). Also, a comparison of these results with those of our previous study indicates that wastewater becomes more biodegradable by progressing the UV/ H 2 O 2 process due to the breakdown of polymer molecules, which reduces their molecular weight and makes them more consumable for biomass.

Graphical Abstract

1. Introduction

Polyvinyl alcohol (PVA) is widely recognized as a biodegradable polymer that is favoured over nonbiodegradable polymers for its potential to mitigate the issue of plastic waste [1,2,3]. However, it should be noted that PVA-containing wastewater is not classified as biodegradable. This distinction arises from the difference in the definition of biodegradability between the polymer and the wastewater treatment fields. Although Shah et al. [4] emphasized the ongoing need for the global standardization of biodegradation testing methods, in the polymer realm, a biodegradable polymer is generally defined as a synthetic or natural polymer that can degrade over time through the action of enzymes or microorganisms. This degradation process involves four distinct steps: fragmentation, depolymerization, assimilation, and mineralization. Fragmentation and depolymerization entail the breakdown of large polymer molecules into smaller units, while assimilation and mineralization refer to the digestion stage of the small, fragmented chains by microorganisms, resulting in the generation of simple mineral by-products such as carbon dioxide and water [1,5,6,7,8,9]. The duration of the degradation process varies from a few weeks to several years, contingent upon factors such as the polymer’s structural and chemical characteristics, environmental temperature, relative humidity, and the presence of specific microorganisms [1]. Alternatively, the biodegradability of wastewater is assessed using biodegradability indices (BIs). A key BI is the ratio of the wastewater’s five-day biochemical oxygen demand ( B O D 5 ) to its chemical oxygen demand (COD). A B O D 5 /COD of 0.5 or greater indicates that the wastewater is biodegradable [10,11,12,13]. Conventional aerobic biological processes are effective in treating this biodegradable wastewater. Zhang et al. examined 195 activated sludge samples and determined that an optimal influent B O D 5 /COD ratio of 0.5 maximizes the removal efficiency of the activated sludge process while minimizing adverse effects on microbial biomass, noting that even a higher ratio might negatively impact biomass properties [14]. Regarding wastewater containing PVA, it is considered nonbiodegradable due to its low B O D 5 /COD ratio, reported to be approximately 0.11 [15,16,17]. Therefore, an efficient wastewater treatment approach beyond conventional biological processes is required to effectively degrade nonbiodegradable water-soluble polymers such as PVA.
The unique physicochemical properties of PVA have resulted in its widespread utilization across various industrial sectors. Notably, PVA is used in the textile industry as a sizing material and in PVA-based polymer composite adsorbents for removing dye from wastewater [18]. Additionally, the use of PVA extends to other consumer products, including cosmetics, cleansers, and solvents, as well as the packaging of detergents and medicines. Due to its wide-range consumption and applications, a significant quantity of PVA is inevitably discharged into wastewater systems. Also, urban growth and industrial development escalate wastewater generation, underscoring the critical need for sustainable treatment solutions to address its environmental and societal consequences [19].
The requirement for the removal of PVA from wastewater, prior to its discharge into the environment, is not driven by its inherent toxicity but rather by the potentially adverse ecological consequences that may arise from its environmental fate through alternative pathways. It is worth noting that PVA exhibits low acute oral toxicity, with a lethal dose 50% ( L D 50 ) of 15–20 g/kg, demonstrates minimal gastrointestinal absorption, lacks bioaccumulation potential, and does not exhibit mutagenic or clastogenic effects. Moreover, high-dose studies on animals have revealed no significant adverse effects, thus leading to the consensus that PVA is considered safe for oral ingestion [20,21,22]. In fact, PVA has applications in producing material packaging, medicine pills, and capsule coating, further underscoring its established safety profile [1]. Despite the absence of toxicity in PVA for human and animal digestive systems, it is classified as a xenobiotic, as it does not exist naturally in the environment or within human bodies. Consequently, the discharge of PVA into the environment can challenge ecosystems. One notable issue is the propensity of PVA to form films and foams, leading to the depletion of dissolved oxygen (DO) in water bodies through surface coverage. This property poses a threat to aquatic organisms by endangering their survival. Furthermore, the presence of PVA contributes to environmental concerns by promoting the mobilization of heavy metals from lake and ocean sediments. Consequently, these materials can accumulate in underground water resources or agricultural fields, adversely affecting water quality and crop productivity [18]. Additionally, PVA-containing water can harm agricultural fields, resulting in septic conditions and pH imbalances. Moreover, the presence of PVA in wastewater treatment plants (WWTPs) can present challenges to treatment units. For instance, it can lead to oxygen depletion in biological treatment tanks or membrane fouling, impeding the treatment process’s overall efficiency [23].
Advanced oxidation processes (AOPs) are recognized as sustainable technologies for treating challenging wastewaters [24]. Various AOPs, such as (photo)-Fenton oxidation [25,26,27,28,29], (catalytic) ozonation [30,31,32], UV/ H 2 O 2 [33,34,35], UV/ S 2 O 8 2 [34,36], photocatalytic oxidation [37,38], wet air oxidation [39,40], and others [41,42,43,44,45], have been effectively employed for the degradation of PVA-containing wastewater. Among these processes, UV/ H 2 O 2 stands out as the most favourable option for PVA degradation due to its use of readily available reactant materials, the absence of specific operating temperature and pressure requirements, and the lack of generation of sludge or other by-products necessitating further separation. Regardless of the promising outcomes of studies on PVA degradation using the UV/ H 2 O 2 process, its operation for complete PVA removal remains financially burdensome. This problem could potentially be addressed by partially oxidizing aqueous PVA in the UV/ H 2 O 2 pre-treatment stage, followed by a post-biological treatment [46]. Before implementing such a treatment, it is essential to investigate and ensure the sufficient biodegradability of the effluent from the pre-treatment stage. The successful employment of different AOPs to enhance the biodegradability of various types of wastewaters in several studies motivates this research [47,48,49,50,51,52,53].
Thus, this study aims to assess the feasibility of enhancing the biodegradability of aqueous PVA through a continuous UV/ H 2 O 2 pre-treatment in a tubular photoreactor. The investigation further explores the impacts of various process variables, including the PVA feed concentration, inlet H 2 O 2 concentration, and feed flow rate, on the process effluent BI. The other objective of this study is to determine the optimum operating conditions that yield a B O D 5 /COD ratio of 0.5 or higher, indicating a biodegradable wastewater. The response surface methodology (RSM) in conjunction with a Box–Behnken design (BBD) is employed to help locate the optimal conditions, provide a statistical analysis of the experimental data, and develop a black-box model from the experimental data. Furthermore, the outcomes of optimizing the pre-treatment stage are compared with those of the full-treatment study to evaluate the proposed approach’s efficacy and relative operating costs.

2. Materials and Methods

2.1. Chemicals

Analytical-grade aqueous PVA (5% aqueous, Ward’s Science, Rochester, NY, USA) and H 2 O 2 (30% stabilized ACS, VWR Chemicals BDH®, Rouses Point, NY, USA) were purchased from VWR Canada. Table S1 in Supplementary Information presents the chemicals utilized in the formulation of the nutrient broth for the respirometry tests, along with their respective manufacturers. Potassium hydroxide (KOH) flakes (Ward’s Science), 1 N sulfuric acid ( H 2 S O 4 , VWR Chemicals BDH®) and allylthiourea (98%, Thermo Scientific Chemicals, Waltham, MA, USA) were purchased from VWR Canada to serve as a C O 2 scrubber, electrolyte, and nitrification inhibitor, respectively, in the respirometry tests. Catalase from Micrococcus lysodeikticus (140,191 U/mL, Sigma Aldrich, St. Louis, MI, USA) was used to quench residual H 2 O 2 . The necessary seed culture in the respirometry bioreactors was established using fresh activated sludge, obtained from one of the main WWTPs in Toronto, ON, Canada. The activated sludge was aerated for 24 h before being used in respirometry tests. The aeration was carried out to ensure the microbial mass had consumed the residual nutrients originating from the WWTP and reached its endogenous respiration stage [45]. Additionally, the 1.5 N phosphate buffer employed in the respirometry tests was prepared by dissolving potassium phosphate monobasic crystals ( K H 2 P O 4 , Ward’s Science) in distilled water. For pH adjustments, H 2 S O 4 (99%, Anachemia, Radnor, PA, USA) and sodium hydroxide (NaOH, 99%, EMD, Mississauga, ON, Canada) were used. Distilled water was used to prepare all aqueous solutions, including PVA solution, H 2 O 2 solution, and stock nutrient broth.

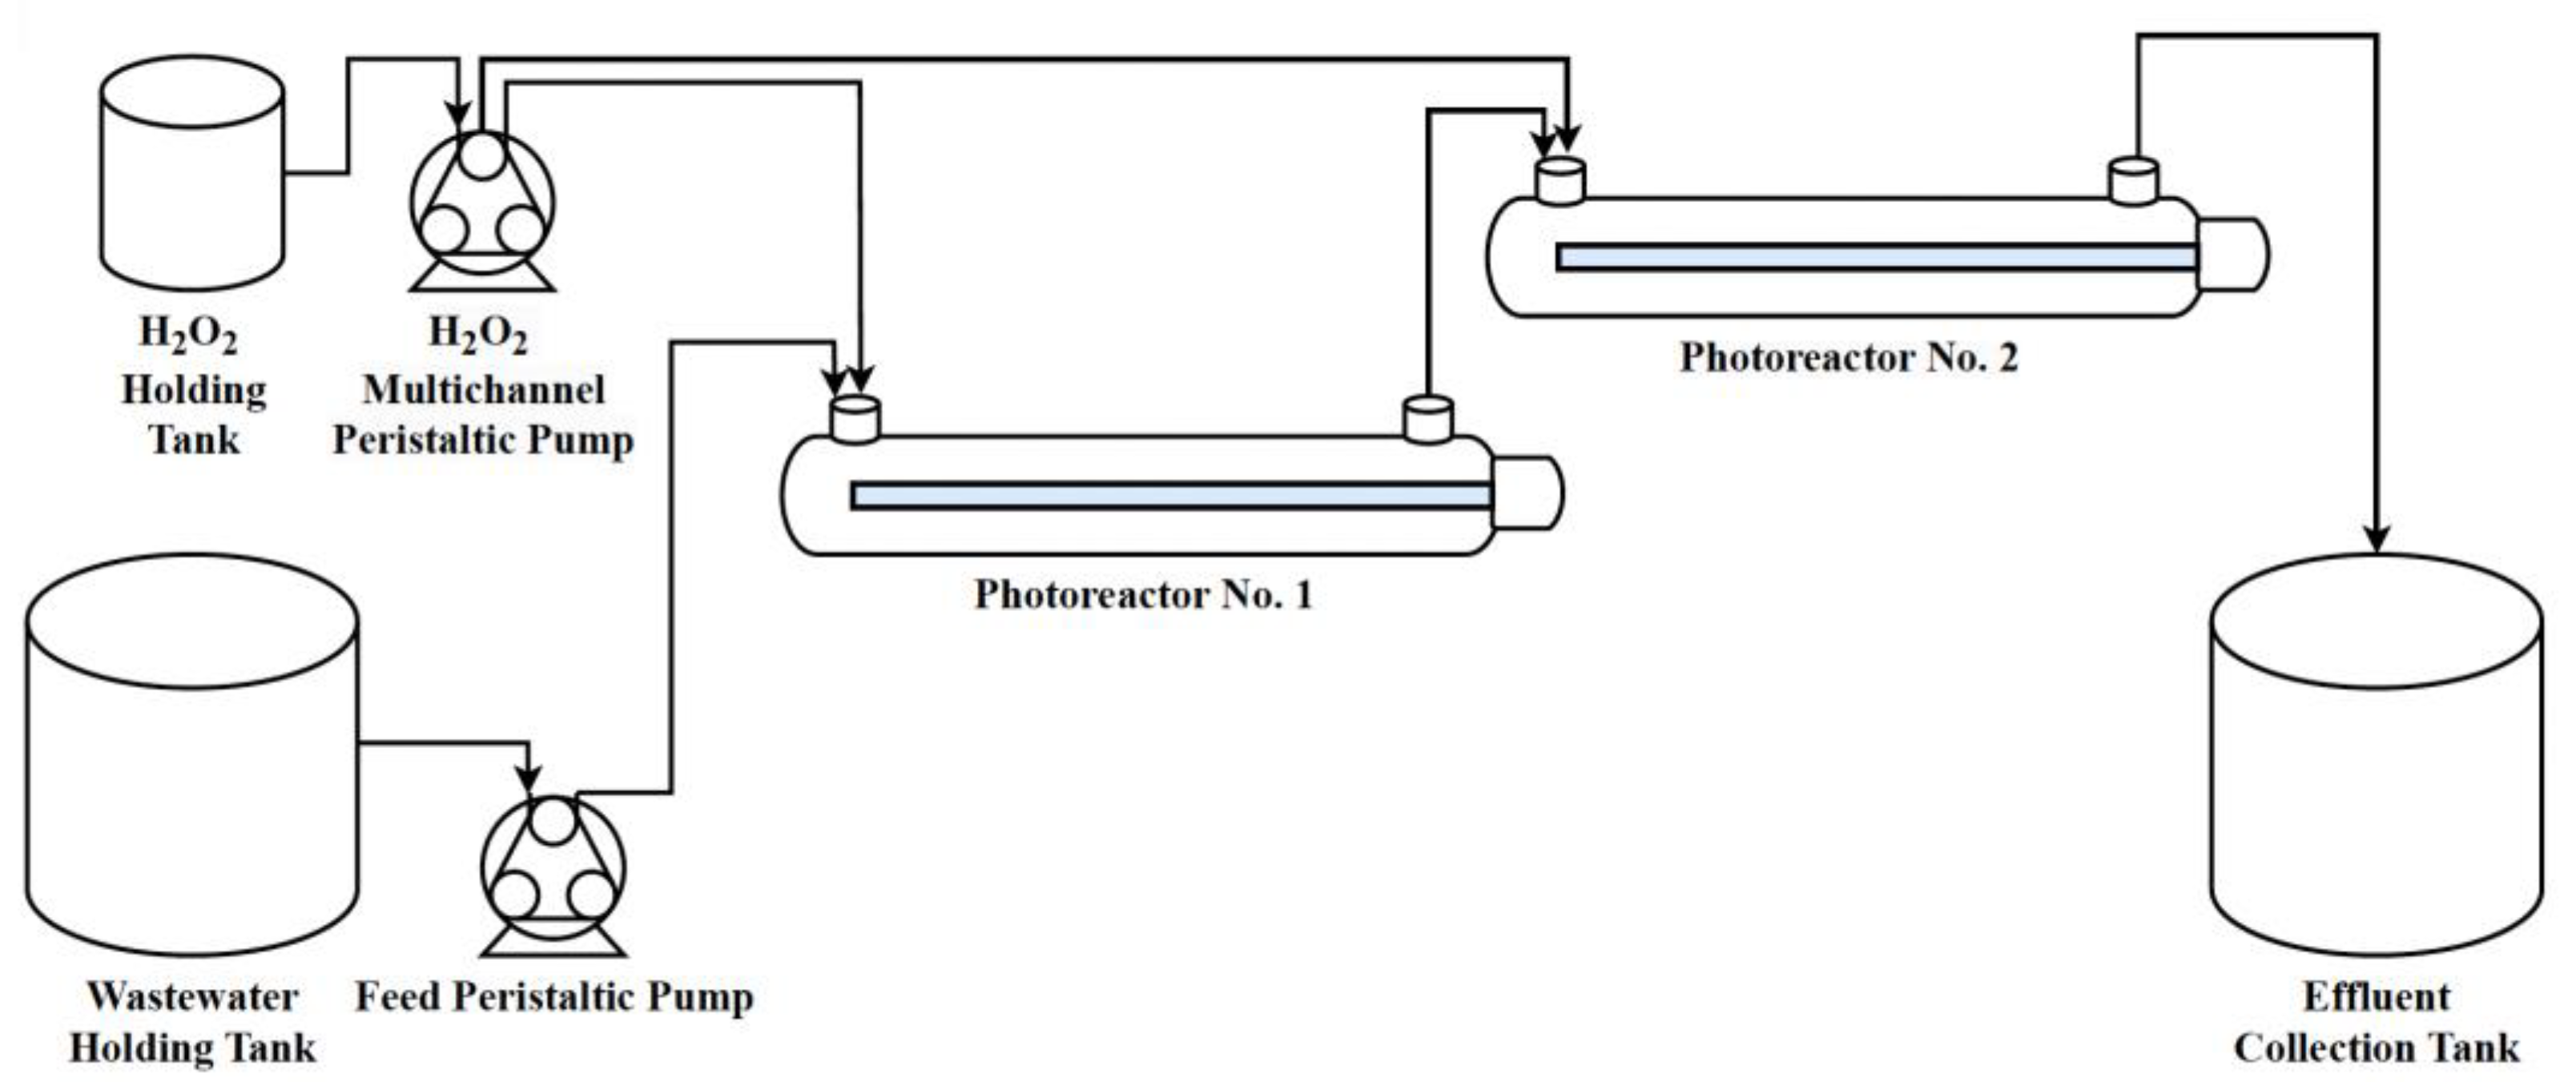
2.2. Experimental Setup and Procedure

The experimental setup utilized in this study is shown in Figure 1. Two horizontally oriented stainless-steel photoreactors (Siemens Inc., Munich, Germany, Model SL-LAB2) in series were operated continuously. Each photoreactor has an effective volume of 460 mL. A germicidal UV lamp (Siemens Inc., Model LP4130) emitting UV radiation at a peak wavelength of 254 nm is centrally positioned inside each photoreactor to facilitate the desired photoreaction. The lamp is enclosed inside a quartz sleeve to safeguard it from fouling and keep the radiation efficiency high. Each lamp has input and output powers of 14 and 3.6 W, respectively.
In this study, the impact of three process variables, namely PVA feed concentration (mg/L), inlet H 2 O 2 concentration (mg/L), and PVA feed flow rate (mL/min), on the process response, effluent BOD5/COD ratio, is investigated. The process variables, along with their levels, are presented in Table S2, in the Supplementary Information. The chosen levels for the PVA feed concentration (mg/L), set at 500, 1000, and 1500 mg/L, were carefully selected such that they not only cover the typical range of PVA concentrations in textile wastewater [16,28,42,43,54,55,56,57,58] but also allow for meaningful comparisons with our previous study [35]. The proposed experiments using the design of experiments, which will be explained in the next section, are presented in Table S3. For each experiment in Table S3, a 3 L aqueous PVA solution was prepared by diluting stock aqueous PVA solution in distilled water using a suitable dilution factor. Subsequently, the prepared solution was placed into the wastewater holding tank and continuously fed to the first photoreactor inlet for each experiment, in which PVA feed flow was attained through a peristaltic pump (Thermo Scientific Inc., Series Manostat, Model 72-315-00). For each experiment, the required flow rate of H 2 O 2 was determined using mass balance based on the information of the required inlet concentrations of H 2 O 2 , PVA, and PVA feed flow rate and the known concentration of H 2 O 2 in the H 2 O 2 holding tank. Then, H 2 O 2 with half of the calculated required flow rate was continuously fed to the inlet of each photoreactor using a multichannel peristaltic pump (Thermo Scientific, Model FH100M). The operation kept running for twice the duration of the hydraulic retention time (HRT) corresponding to each experiment to ensure the process had reached a steady state. Then, samples were collected from the outlet of the second photoreactor. Immediately, catalase was added to the collected samples (0.15 mL per liter of the collected sample) and stirred for 1 h to quench the residual H 2 O 2 . These samples were then analyzed to measure their COD and BOD5 contents. The photoreactors were thoroughly rinsed before and after each experimental run by recirculating distilled water to ascertain no residual chemicals were left from previous experiments. Additionally, the UV lamps were activated for 30 min before each experiment to ensure that the lamps had reached their optimal effectiveness.

2.3. Analytical Methods

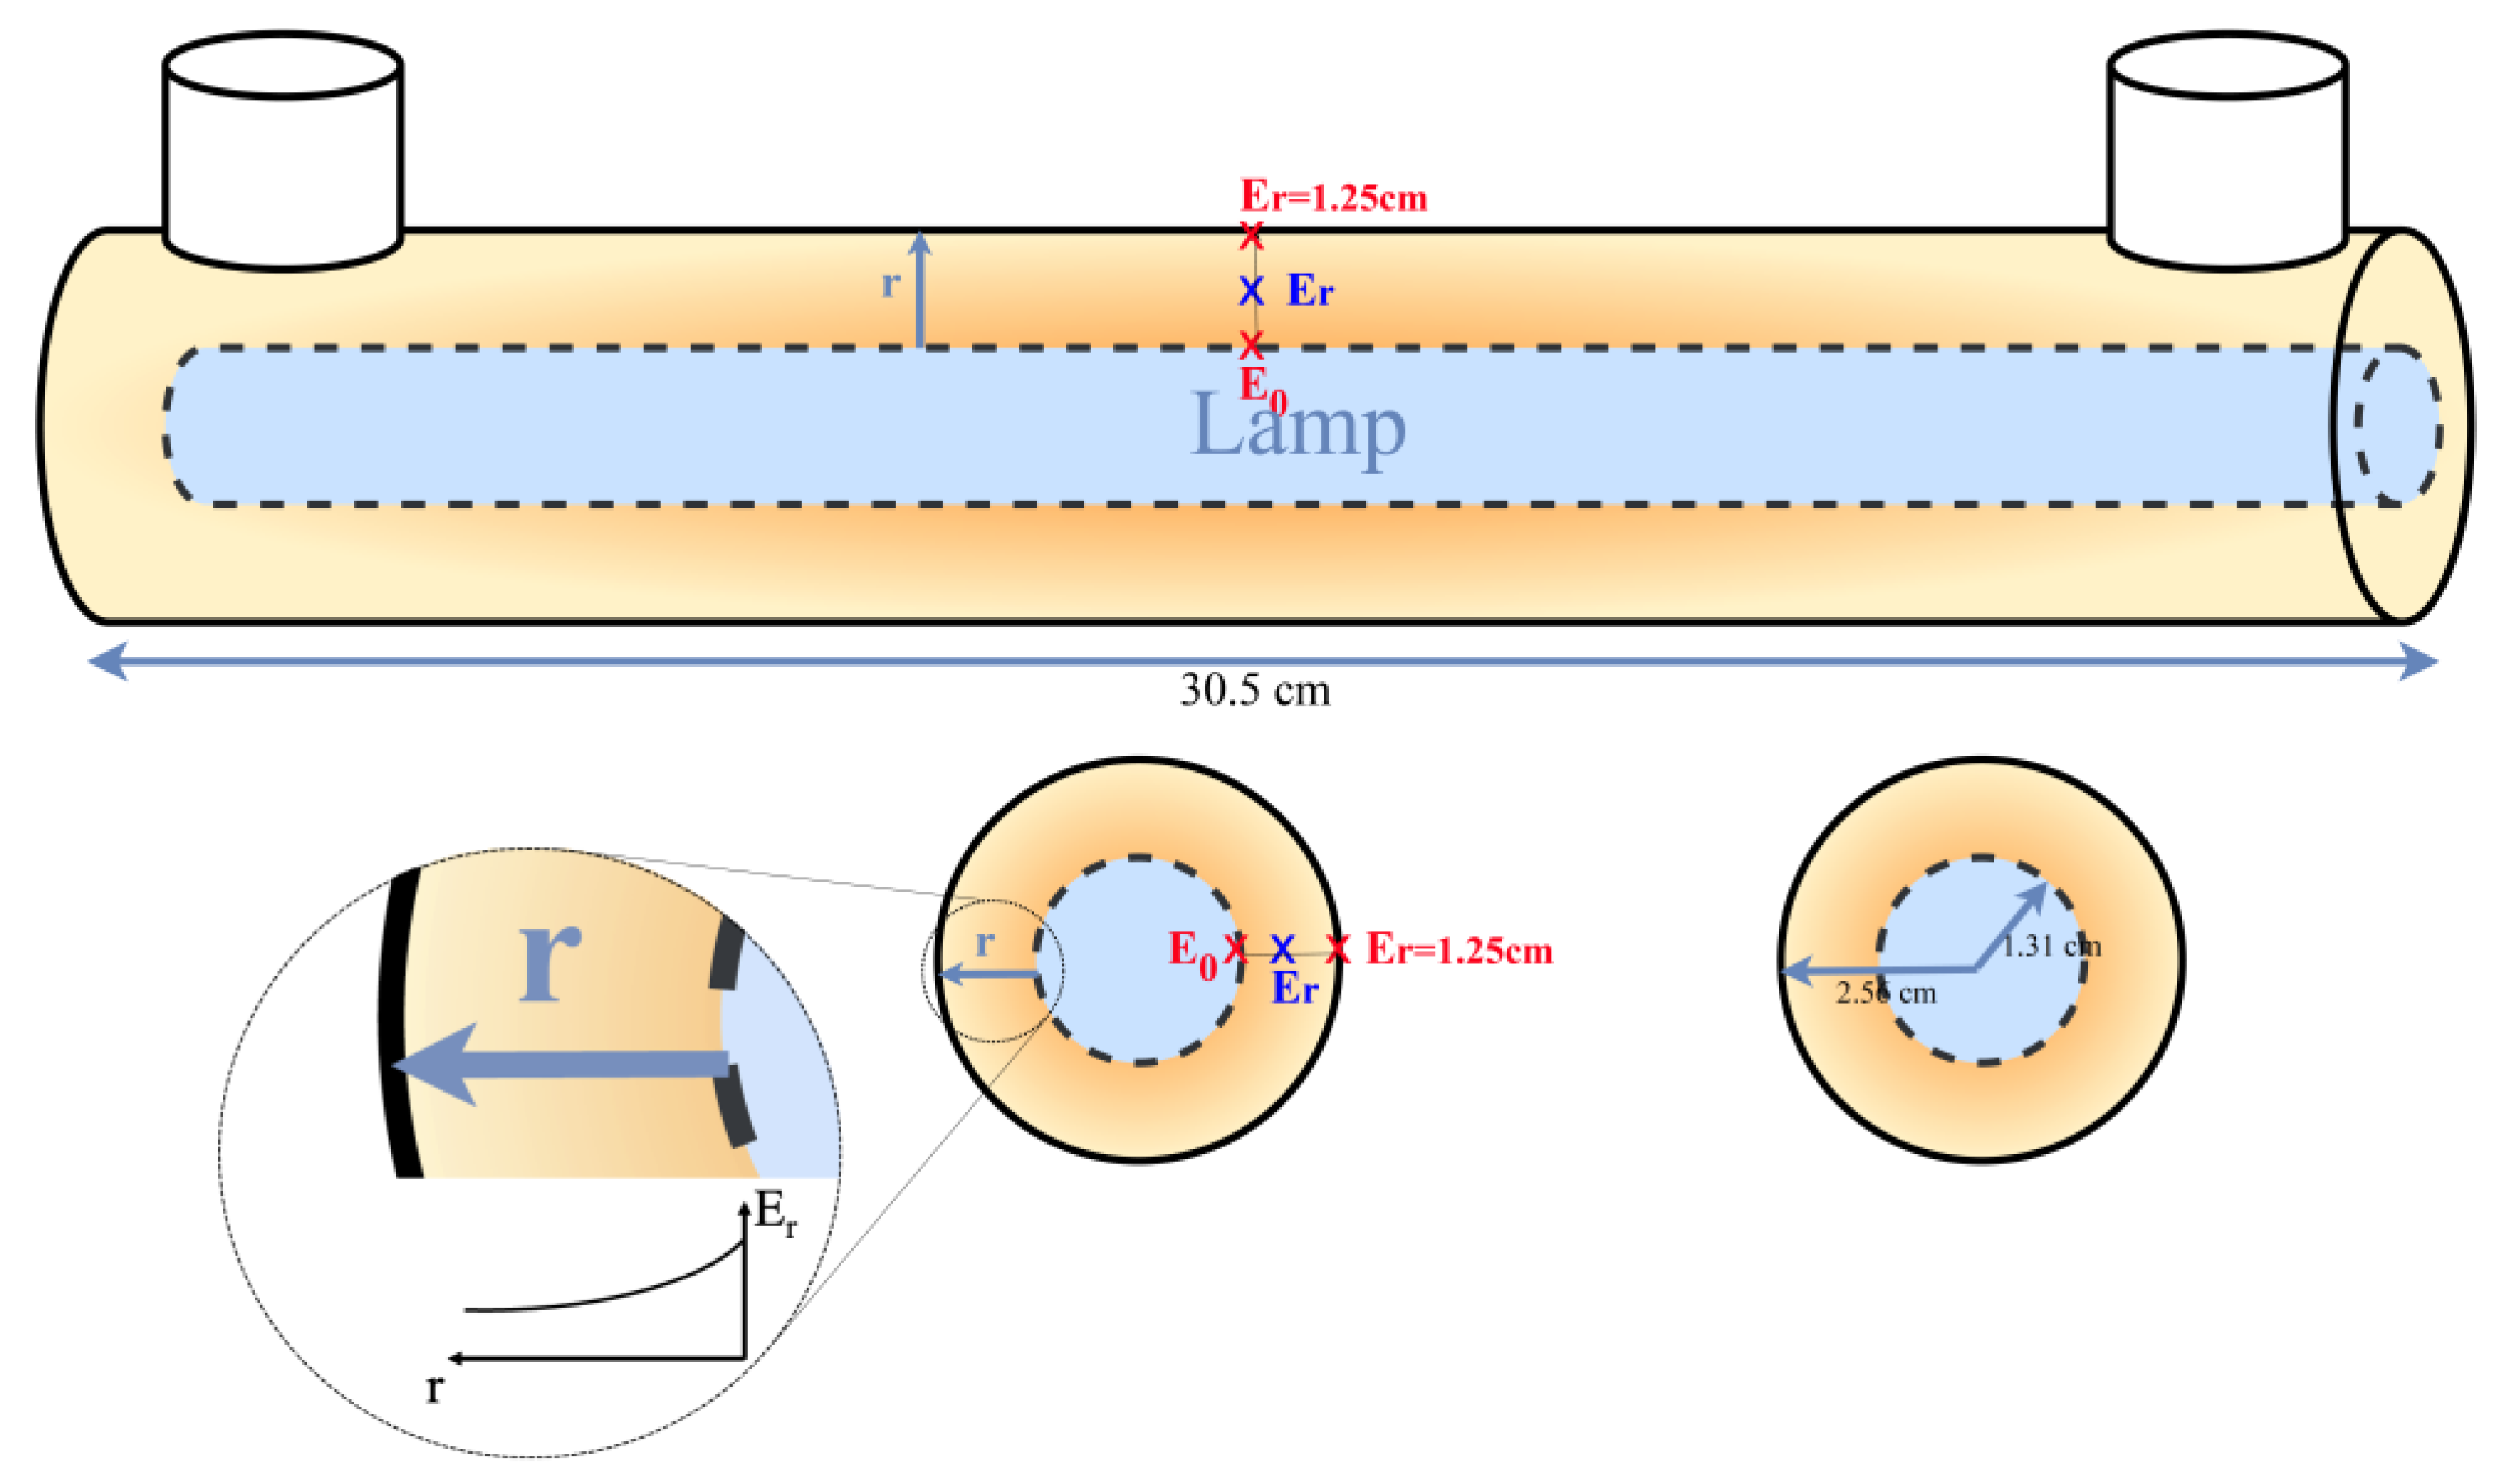
2.3.1. UV Lamp Irradiance Measurement

UV-C 254 nm irradiance was measured using a digital radiometer (Spectronics Corporation, Westbury, NY, USA, Model Spectroline DM-254XA) with a measuring range of 0–19,990 µW/cm2. The radiometer operates based on a sensor that produces an electrical current proportional to the irradiance experienced at a defined plane coinciding with the sensor face. The generated current signal is amplified, converted to voltage, and then displayed appropriately on the device.

2.3.2. Respirometry

The wastewater biodegradability enhancement was evaluated by comparing the influent and effluent B O D 5 /COD. The B O D 5 content in untreated aqueous PVA solutions and the samples collected from the effluent of the process were quantified using the respirometry technique. This method involves measuring the accumulated oxygen uptake (mg/L) utilized by microorganisms over time. Low-rate aerobic batch tests were performed using an electrolytic respirometer (Bioscience, Inc., Allentown, PA, USA, Model BI-2000) to evaluate the B O D 5 . Samples were introduced into 1 L test vessels (bioreactors) without any dilution. To establish a population of degrading microorganisms in the test vessels, activated sludge obtained from a WWTP in Toronto, Ontario, Canada was utilized as the seed culture of microorganisms. The activated sludge, collected in the form of mixed liquor (ML), had its volatile suspended solids (MLVSSs) measured as a representative of the microorganisms’ concentration (biomass). An appropriate amount of ML was added to each bioreactor, ensuring that the concentration of MLVSS did not exceed 30 mg/L. Also, 10 mL of the nutrient broth was added to each 1 L test vessel to provide the necessary nutrients for the growth of microorganisms. Furthermore, allylthiourea (ATU) was incorporated into each vessel to inhibit nitrification and ensure that the measurement specifically targeted carbonaceous B O D 5 . Additionally, to maintain a neutral pH in the bioreactor while organic acids are formed due to the biodegradation, appropriate amounts of a 1.5 N phosphate buffer were added to each vessel. The required amount of phosphate buffer was calculated based on the COD content of each sample. For every 50 mg/L of COD, 1 mL of 1.5 N phosphate buffer was added to each liter of respirometry solution [59,60]. At the top of the bioreactor vessel, the electrolysis cell holds a 1 N sulfuric acid solution as its electrolyte. The electrodes, which are embedded in the cell cap, make direct contact with the electrolyte. When the headspace pressure inside the bioreactor vessel drops due to microorganism oxygen consumption, a slight vacuum within the vessel is created. The generated vacuum results in the loss of contact between the electrolyte and switch electrode. This disconnection triggers the cell to pass current between the electrodes. The current passing through the electrolyte initiates water hydrolysis, resulting in the production of oxygen and hydrogen. The generated oxygen replenishes the oxygen consumed in the bioreactor. In addition, a 45% KOH solution is placed inside the inner part of the cell to scrub the generated carbon dioxide resulting from microorganisms’ respiration. The tests were conducted for 6 to 7 days while the bioreactors were kept agitated, and the temperature was maintained at 20 °C using a water bath [59,60,61]. During the respirometry test, the rate of oxygen consumption was recorded every 15 min by a computer. After each test, the difference in accumulated oxygen consumption between the sample and the control during the first 120 h was considered as the B O D 5 content of the sample. Some tests were replicated. Observing a standard deviation of <5% for the replicated tests confirms the repeatability and reproducibility of the measured data.

2.3.3. COD Measurement

The COD contents of treated and non-treated wastewater samples were measured using closed reflux, a colorimetric method described in APHA standard methods, section 5220-D [59]. This method involves the addition of the wastewater sample to COD vials containing potassium dichromate ( K 2 C r 2 O 7 ) and sulfuric acid ( H 2 S O 4 ). The vials are heated at 150 °C for 2 h. During the heating process, the chemical reaction given below occurs, which results in the oxidation of the organic compounds in the sample:
C r 2 O 7 2 + 6 e + 14 H + 2 C r 3 + + 7 H 2 O
Once the reaction is completed and the COD vials have cooled, the amount of K 2 C r 2 O 7 remaining in the solution is analyzed using spectroscopy, specifically through a multiparameter colorimeter (Orbeco-Hellige Inc., Sarasota, FL, USA, Model MC500). By determining the concentration difference between the sample and a blank, the consumed amount of K 2 C r 2 O 7 can be calculated. The instrument then uses this information to determine and report the COD value (mg COD/L), indicating the amount of chemically oxidizable material in the wastewater sample.

2.4. Experimental Design and Statistical Analysis

A combination of RSM and BBD was employed to investigate how different process variables affect the BI of aqueous PVA solutions treated with the UV/ H 2 O 2 process. The primary aim was to determine the optimal operating conditions for producing a biodegradable effluent. The design of experiments offers several advantages over traditional full experimentation methods as it requires a smaller number of experiments, which results in saving time and materials. Additionally, the design of experiments accounts for interactions between variables, leading to more accurate predictions and optimization of the process response. The number of experiments designed using the BBD can be estimated using the following equation [62]:
N = 2 k k 1 + c p
where N represents the total number of experiments, k denotes the number of process variables being studied, and c p signifies the number of replications performed at the central point. Considering the selected design of experiment approach, independent variables, and their studied levels, presented in Table S2, the proposed experimental set consists of 15 trials, including three replications at the central point, as shown in Table S3. The purpose of repeating the central point experiment is to assess both the procedural error and the consistency of the results.
Following the completion of the experiments and the measurement of the effluent B O D 5 /COD ratio, the collected data were fitted to the second-order polynomial equation given below:
y ^ = b 0 + i = 1 n b i x i + i = 1 n b i i x i 2 + i = 1 n 1 j = 2 n b i j x i x j +
where y ^ stands for the predicted process output variable, n is the number of variables, x i and x j are independent process variables, b 0 is regression coefficient at the intercept, b i is linear regression coefficient for each x i , b i i is quadratic regression coefficient for each x i 2 , b i j is interaction regression coefficient for each x i x j , and is the discrepancy between the observed and predicted data that the regression model may not capture. The regression coefficients are estimated using the least squares method, which minimizes the sum of squared differences between the observed and predicted process response. The primary motivation for implementing BBD and fitting the experimental data to a second-order polynomial model is to effectively capture the curvature behaviour of data within the system and account for the interactions among the variables that influence the process response [63]. Previous studies have consistently shown the advantages of utilizing the quadratic polynomial structure for data fitting. The results of this study further affirm the appropriateness of this selection, as they align with the findings of prior research and validate the effectiveness of the quadratic model in explaining the experimental data. Once the model was developed, it was used to optimize operating conditions, with the statistical model serving as the objective function within the constraints of the experimental domain. The optimization goal was to achieve an effluent B O D 5 /COD ratio equal to 0.5. Design Expert software (Stat-Ease, Version 22.0.1) was employed to facilitate the experimental design, parameter estimation, statistical analysis of the developed model, and optimization of the operating conditions.

3. Results and Discussion

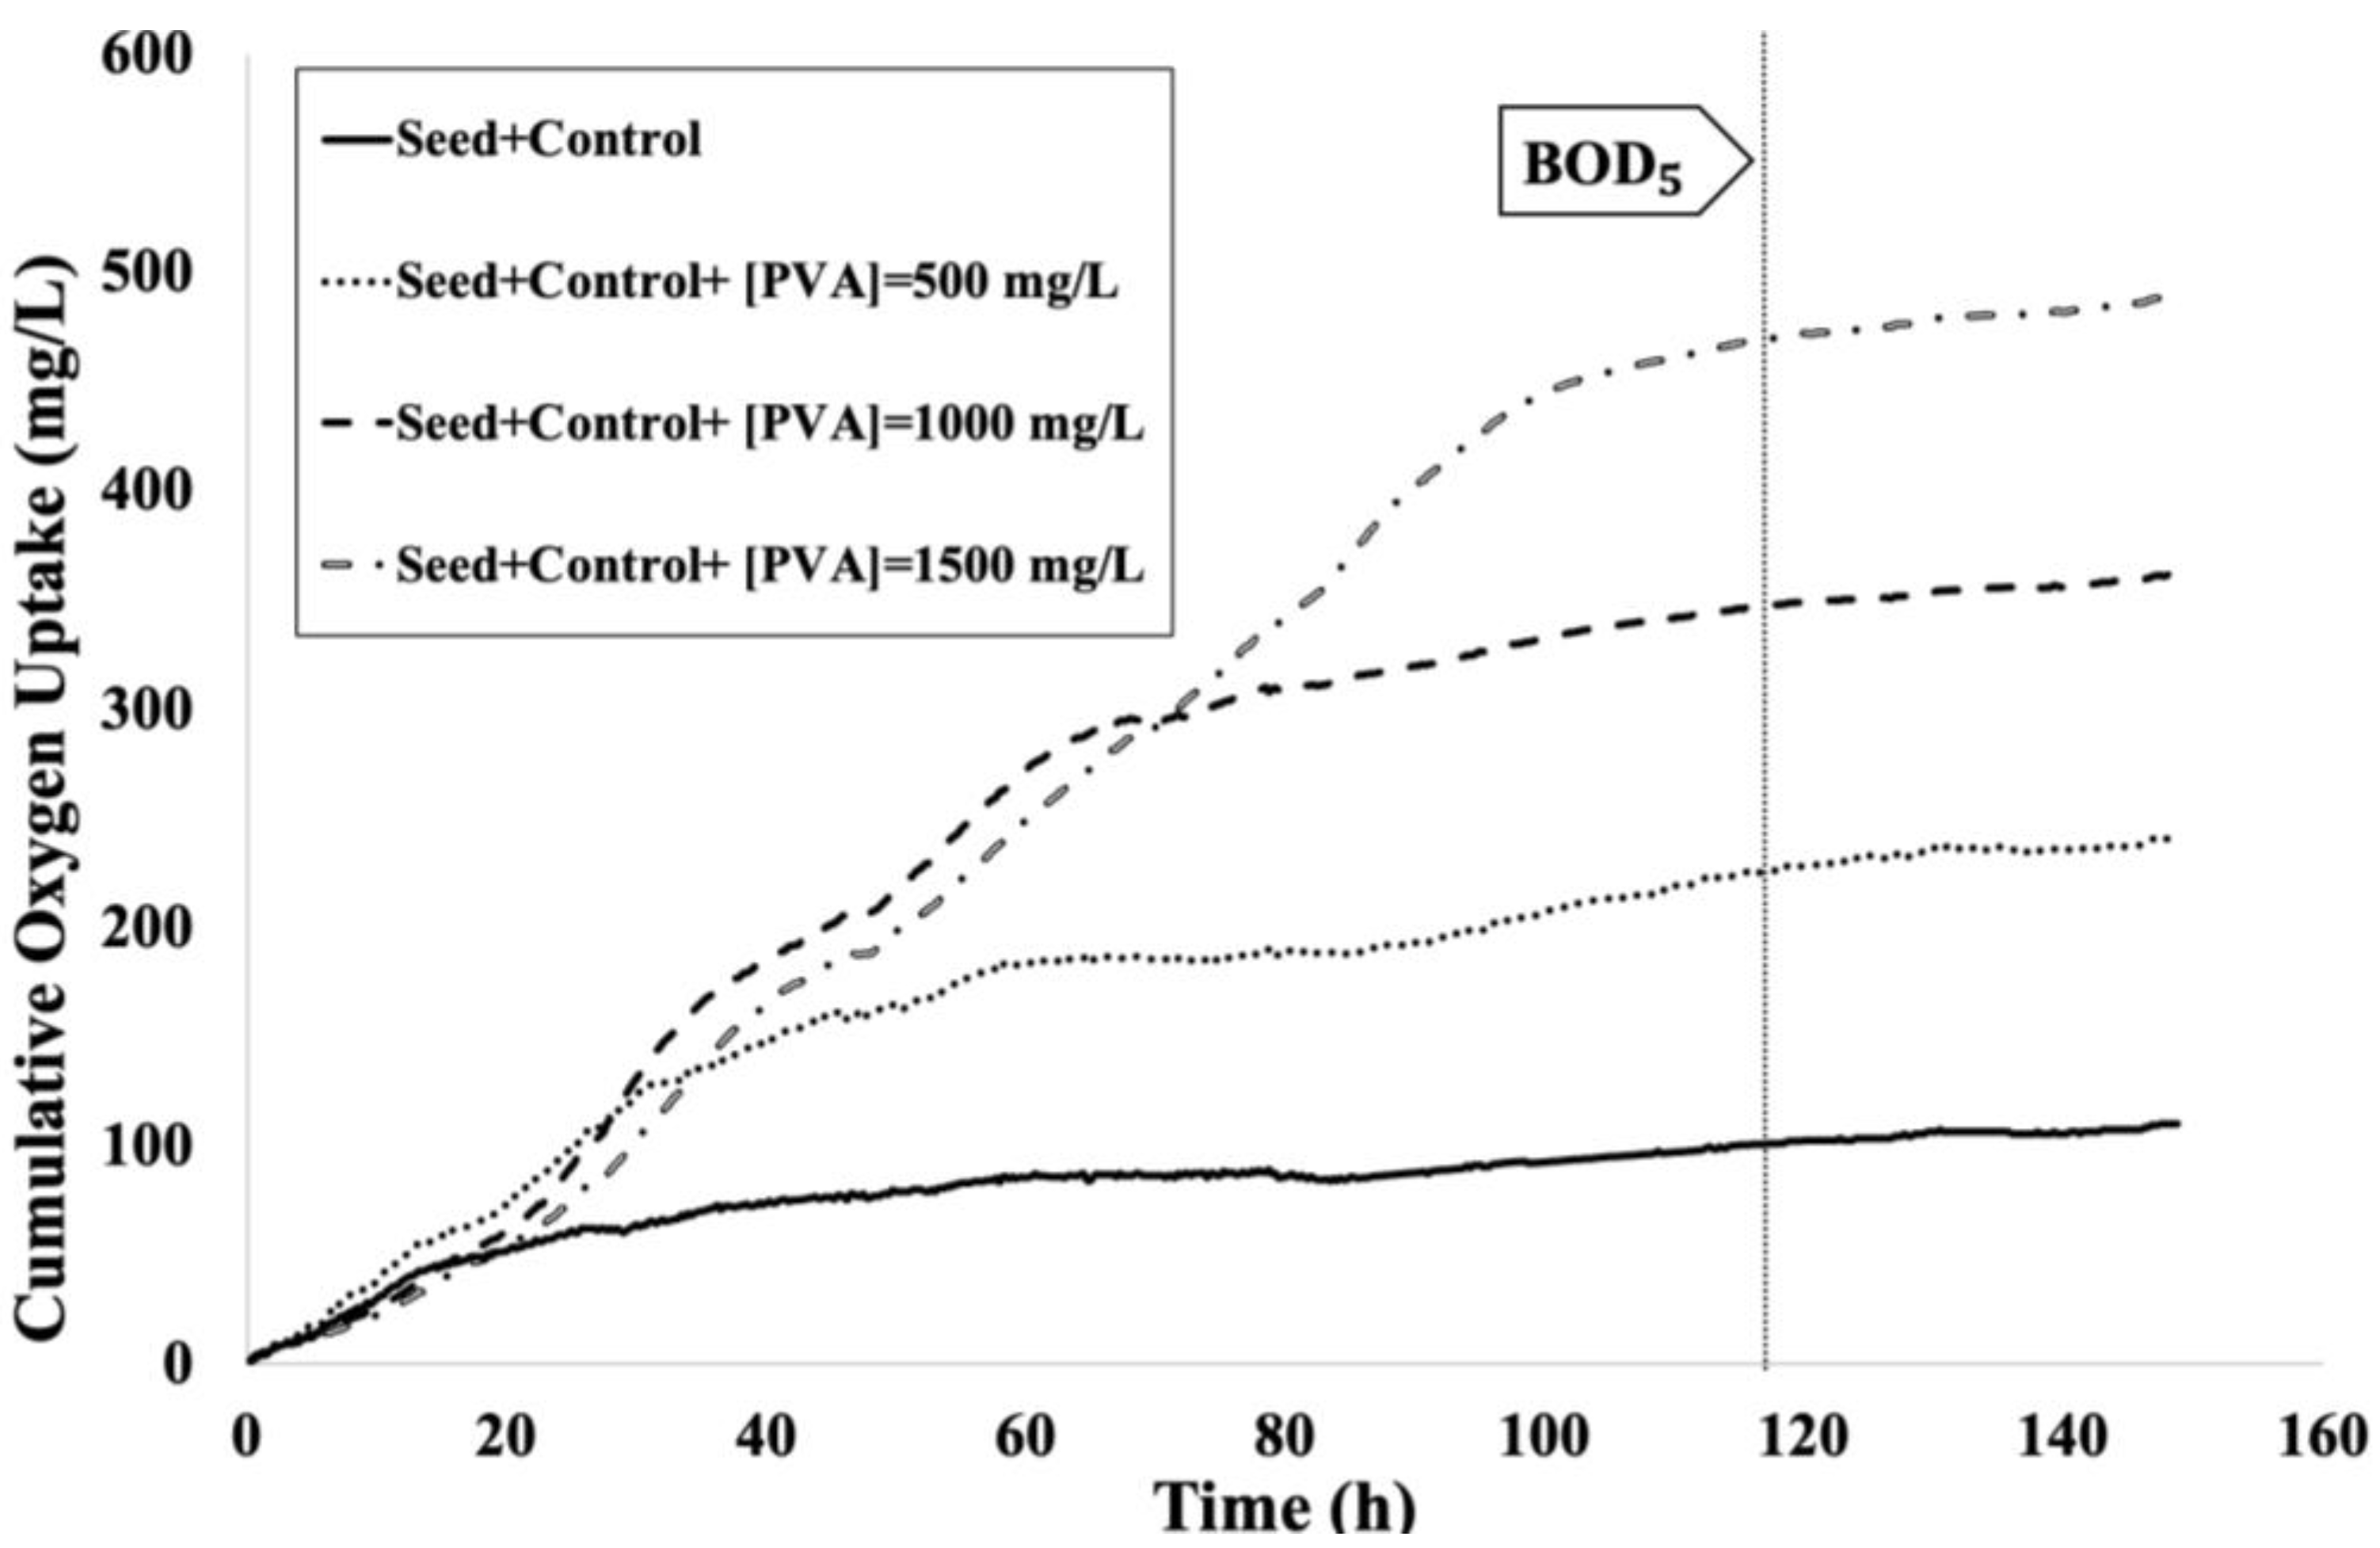
3.1. Biodegradability Evaluation of Untreated Aqueous PVA Solutions

It has been reported in the open literature that wastewater containing PVA is nonbiodegradable [15,16,17]. In this study, the analysis of untreated aqueous PVA solutions at concentrations of 500, 1000, and 1500 mg/L, as detailed in Table 1, reveals BOD5/COD ratios ranging from 0.15 to 0.16, which are significantly below the threshold of 0.5. These results strongly support the fact that aqueous PVA solutions are nonbiodegradable.
The shape and trend of the plots in Figure 2, which are derived from the respirometry test, indicate that the solution requires acclimation rather than showing inhibition behavior [60]. Comparing the plots of different PVA concentrations with that of the seed and control shows that the PVA solution with a concentration of 500 mg/L exhibits a minimal or no inhibition effect on the seed culture. This is indicated by the fact that the oxygen uptake rate consistently is equal to or exceeds that of the seed culture throughout the experiment. For this solution, acclimation, indicated by the slope variation in the oxygen uptake plot, occurs within the first 10 h. Furthermore, solutions with PVA concentrations of 1000 and 1500 mg/L exhibit a slight inhibitory effect on the seed culture during the first 20 h of the respirometry test, evident from a cumulative oxygen uptake less than that for the seed and control. However, the acclimation gradually takes place before and slightly after the 20 h mark for PVA solutions with concentrations of 1000 and 1500 mg/L, respectively.

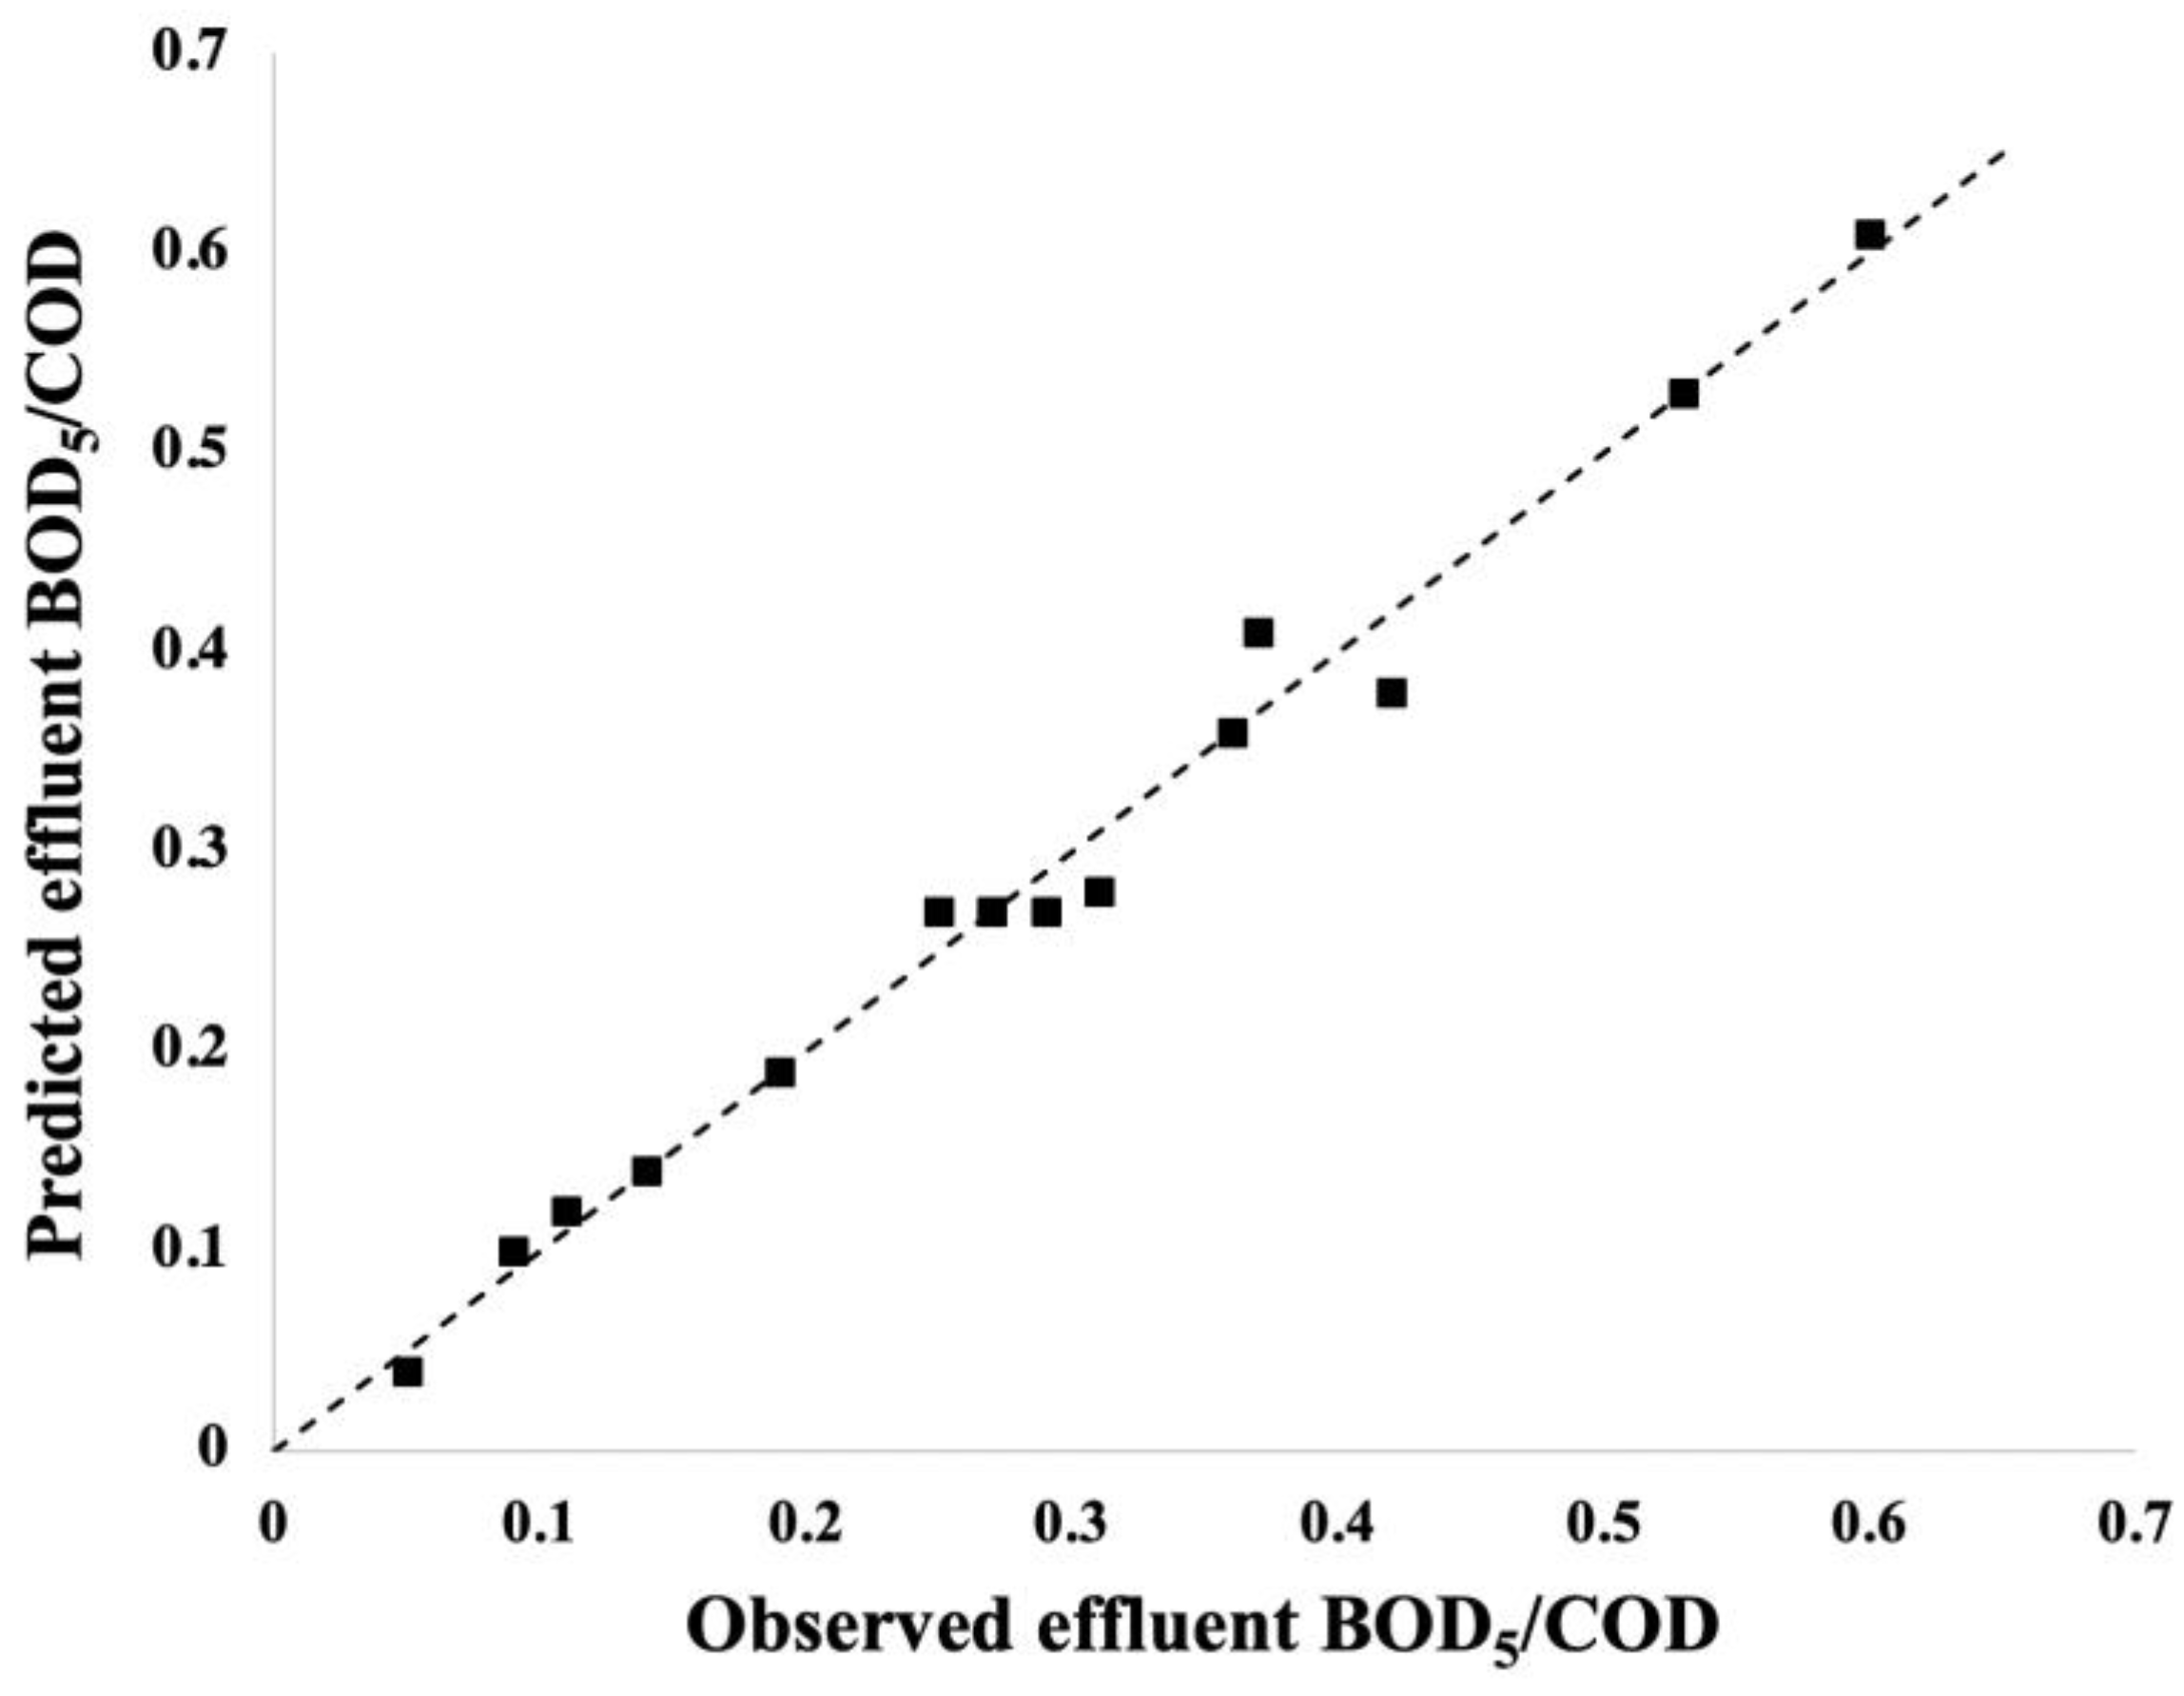
3.2. Data-Driven Prediction Model and Analysis of the Variance (ANOVA)

As described in the previous sections, the statistical predictive model was constructed by fitting the experimental input/output data to the quadratic model described in Equation (3). Mathematical transformations are occasionally used in data analysis to adjust the dependent variable distribution, making it more suitable for analysis. This helps stabilize variance and improve the data fitting to the statistical model. These mathematical transformations include the square root, natural logarithm, inverse square root, power, logit, etc. Accordingly, achieving a satisfactory fit proved elusive when attempting to model the effluent B O D 5 / C O D ratio as a quadratic expression of the independent variables. Consequently, its logit transformation was selected to be modelled rather than modelling the effluent B O D 5 / C O D ratio. This transformation was chosen for its effectiveness in managing data that suit a ratio or proportion, particularly when bounded within a specific range, such that the B O D 5 / C O D ratio is constrained between 0 and 1. Consequently, employing the transformation contributed to improving the overall fit of the model, described by the following equation:
l n y ^ 1 y ^ = 0.9962 0.4518 x 1 + 0.1064 x 2 0.4975 x 3 + 1.145 x 1 x 2 0.0474 x 1 x 3 + 0.0760 x 2 x 3 + 0.3148 x 1 2 0.6912 x 2 2 + 0.2065 x 3 2
where y ^ stands for the process effluent B O D 5 / C O D . Also, x 1 , x 2 , and x 3 stand for the coded values of the PVA feed concentration (mg/L), inlet H 2 O 2 concentration (mg/L), and feed flow rate (mL/min), respectively.
The adoption of dimensionless coded values for independent variables, rather than their actual values, is driven by the aim to mitigate the impact of their scales on the model. This normalization strategy ensures that variables with larger magnitudes do not exert disproportionately more significant effects on the process response than those with smaller magnitudes [62].
Figure 3 illustrates the observed values for the effluent B O D 5 /COD in each experiment versus the corresponding predicted values of the model. The positioning of data points in the vicinity of the 45 ° line serves as a validation measure for assessing the effectiveness and accuracy of the model predictions.
In addition, an essential model development step involves the assessment of a model’s statistical goodness using an analysis of variance (ANOVA). Subsequently, the model quality can be refined by retaining only the significant parameters. This process ensures that the final model consists of the most influential factors while eliminating non-significant ones. The ANOVA results have been summarized in Table 2. Based on these findings, an R2 value of 0.9872, indicating a close approximation to 1, signifies that the defined model in this study can effectively be used to explain a significant portion of the data. Furthermore, the adjusted R2 value of 0.9641 provides a more conservative measure of the model quality and robustness. Moreover, the predicted R2 estimates the model predictive capability for the operating conditions within the defined ranges, albeit not precisely matching the conducted experimental values. According to the Design Expert software, a reasonable agreement has been achieved in which the difference between the adjusted R2 and predicted R2 is less than 0.2. This recommendation stems from the observation that if the predicted R2 is too low, it implies that the model’s performance in explaining new observations within the experimental ranges may be inadequate, rendering it unsuitable as a general model. Furthermore, a high adjusted R2 in such a scenario suggests an overfitting of the model. In the present study, obtaining a difference between the predicted R2 (0.8192) and the adjusted R2 (0.9641) less than 0.2 indicates that the model can be employed as a reliable and robust prediction tool within the selected experimental range, and the risk of overfitting is suppressed. Additionally, the adequate precision value of 24.87, much higher than the threshold of 4, further confirms the model’s efficiency in understanding and predicting the behaviour of process parameters within the BBD design space.
The validity of the regression model is assessed using the model F-test and p-value, indicating the level of importance of the independent variables on the response. In this study, an F-test of 42.74 (p-value = 0.0003) proves a substantial influence of the independent variables on the process response. Conversely, a low F-test of 4.137 (p-value = 0.2008) indicates a non-significant lack of fit. Desirably, this rejects the possibility of the fit being attributed to random noise, reinforcing the significance of the model. In addition, a p-value less than 0.0500 indicates the statistical significance of the corresponding factor. Based on the ANOVA, the variables x 1 , x 3 , x 1 x 2 , x 1 2 , and x 2 2 have been indicated to be statistically significant terms. Consequently, the derived model described by Equation (4) can be simplified by excluding the non-significant terms. Despite the ANOVA results suggesting the exclusion of variable x 2 from the model due to its low significant value, it is kept in the reduced model described in Equation (5). The rationale behind the inclusion of variable x 2 will be elucidated in the subsequent sections. Therefore, the modified model is given below:
l n y ^ 1 y ^ = 0.9962 0.4518 x 1 + 0.1064 x 2 0.4975 x 3 + 1.145 x 1 x 2 + 0.3148 x 1 2 0.6912 x 2 2

3.3. Overall Process Response Behaviour

As demonstrated in Section 3.1, the aqueous PVA solution exhibits a notably low B O D 5 /COD ratio. The COD factor indicates the amount of chemically oxidizable matter in the sample, primarily comprising organic materials. However, since microorganisms are sometimes unable to degrade the entire organic portion present in the sample completely, B O D 5 represents only the fraction of COD that is biodegradable. In this study, approximately 15 to 16% of the untreated synthetic wastewater is proven to be biodegradable. Our previous study [33] demonstrated the degradation of PVA in the UV/ H 2 O 2 process involves two simultaneous processes: the cleavage or breakdown of long PVA macromolecules into shorter fragments, leading to a mineralization of subsequent shorter molecules. This claim is supported by analyzing the average molecular weight of untreated and treated aqueous PVA solutions using gel permeation chromatography (GPC). The percentage reduction in average molecular weight and its behaviour in response to changes in process variables are illustrated in Figure S1, based on the results and data from [35]. In the current study, upon analyzing the alterations in B O D 5 /COD ratios, it was noted that the ratio consistently increased for almost all experiments, with only a few exceptions. As degradation progresses, the COD content decreases due to the breakdown of contaminants. On the other hand, the observed increase in the B O D 5 /COD ratio suggests that a greater proportion of the remaining COD is biodegradable, which can be attributed to the findings of the previous study. Indeed, considering the observations of both studies, the partially degraded wastewater contains cleaved and shorter molecules that biomass can more easily consume. Consequently, these shorter molecules are more biodegradable than the original wastewater, leading to a higher proportion of biologically oxidizable components in the remaining COD and an elevated B O D 5 /COD ratio. It should be noted that the maximum attainable B O D 5 /COD is one, as this represents the scenario in which the COD content is perfectly equal to the B O D 5 content for an ideally biodegradable effluent. If the treatment process continues for a sufficient duration, the final stages witness mineralization, resulting in the formation of some residual compounds with a very low COD content. As these compounds cannot undergo further degradation, the B O D 5 content becomes even lower than the COD content, leading to a reduced B O D 5 /COD. However, this explanation does not apply to experiments 4, 5, 6, and 9, in which the B O D 5 /COD ratios either remained almost unchanged or decreased. The overall reaction time in the conducted experiments was relatively short, which may not allow for the occurrence of complete mineralization. The experimental analyses and their operating conditions showed that a decrease in B O D 5 /COD in experiments 4 and 9 was due to the inadequate amount of inlet H 2 O 2 . This resulted in a lesser reduction in nonbiodegradable COD than the biodegradable portion. Additionally, experiments 5 and 6 were influenced by the scavenging effect of H 2 O 2 , which will be elaborated on in the following sections, while the short HRTs intensified the undesired outcomes. Based on the experimental observations, the effect of the operating parameters on the process response is thoroughly discussed in the following sections.

3.4. Effect of Individual Variables on the Effluent B O D 5 /COD

While the magnitude of interactions amongst some process variables cannot be overlooked, it is essential to examine the effects of each variable on the process response to capture valuable insights about the process behaviour. Analyzing the influence of individual variables on the process response entails examining one variable at a time while keeping other variables constant at their central design point. Experimental data and the statistically developed model using Design Expert are utilized to facilitate this examination. Figure 4 illustrates the effects of each process independent variable, including the PVA feed and inlet H 2 O 2 concentrations (mg/L) and PVA feed flow rate (mL/min) on the effluent B O D 5 /COD.

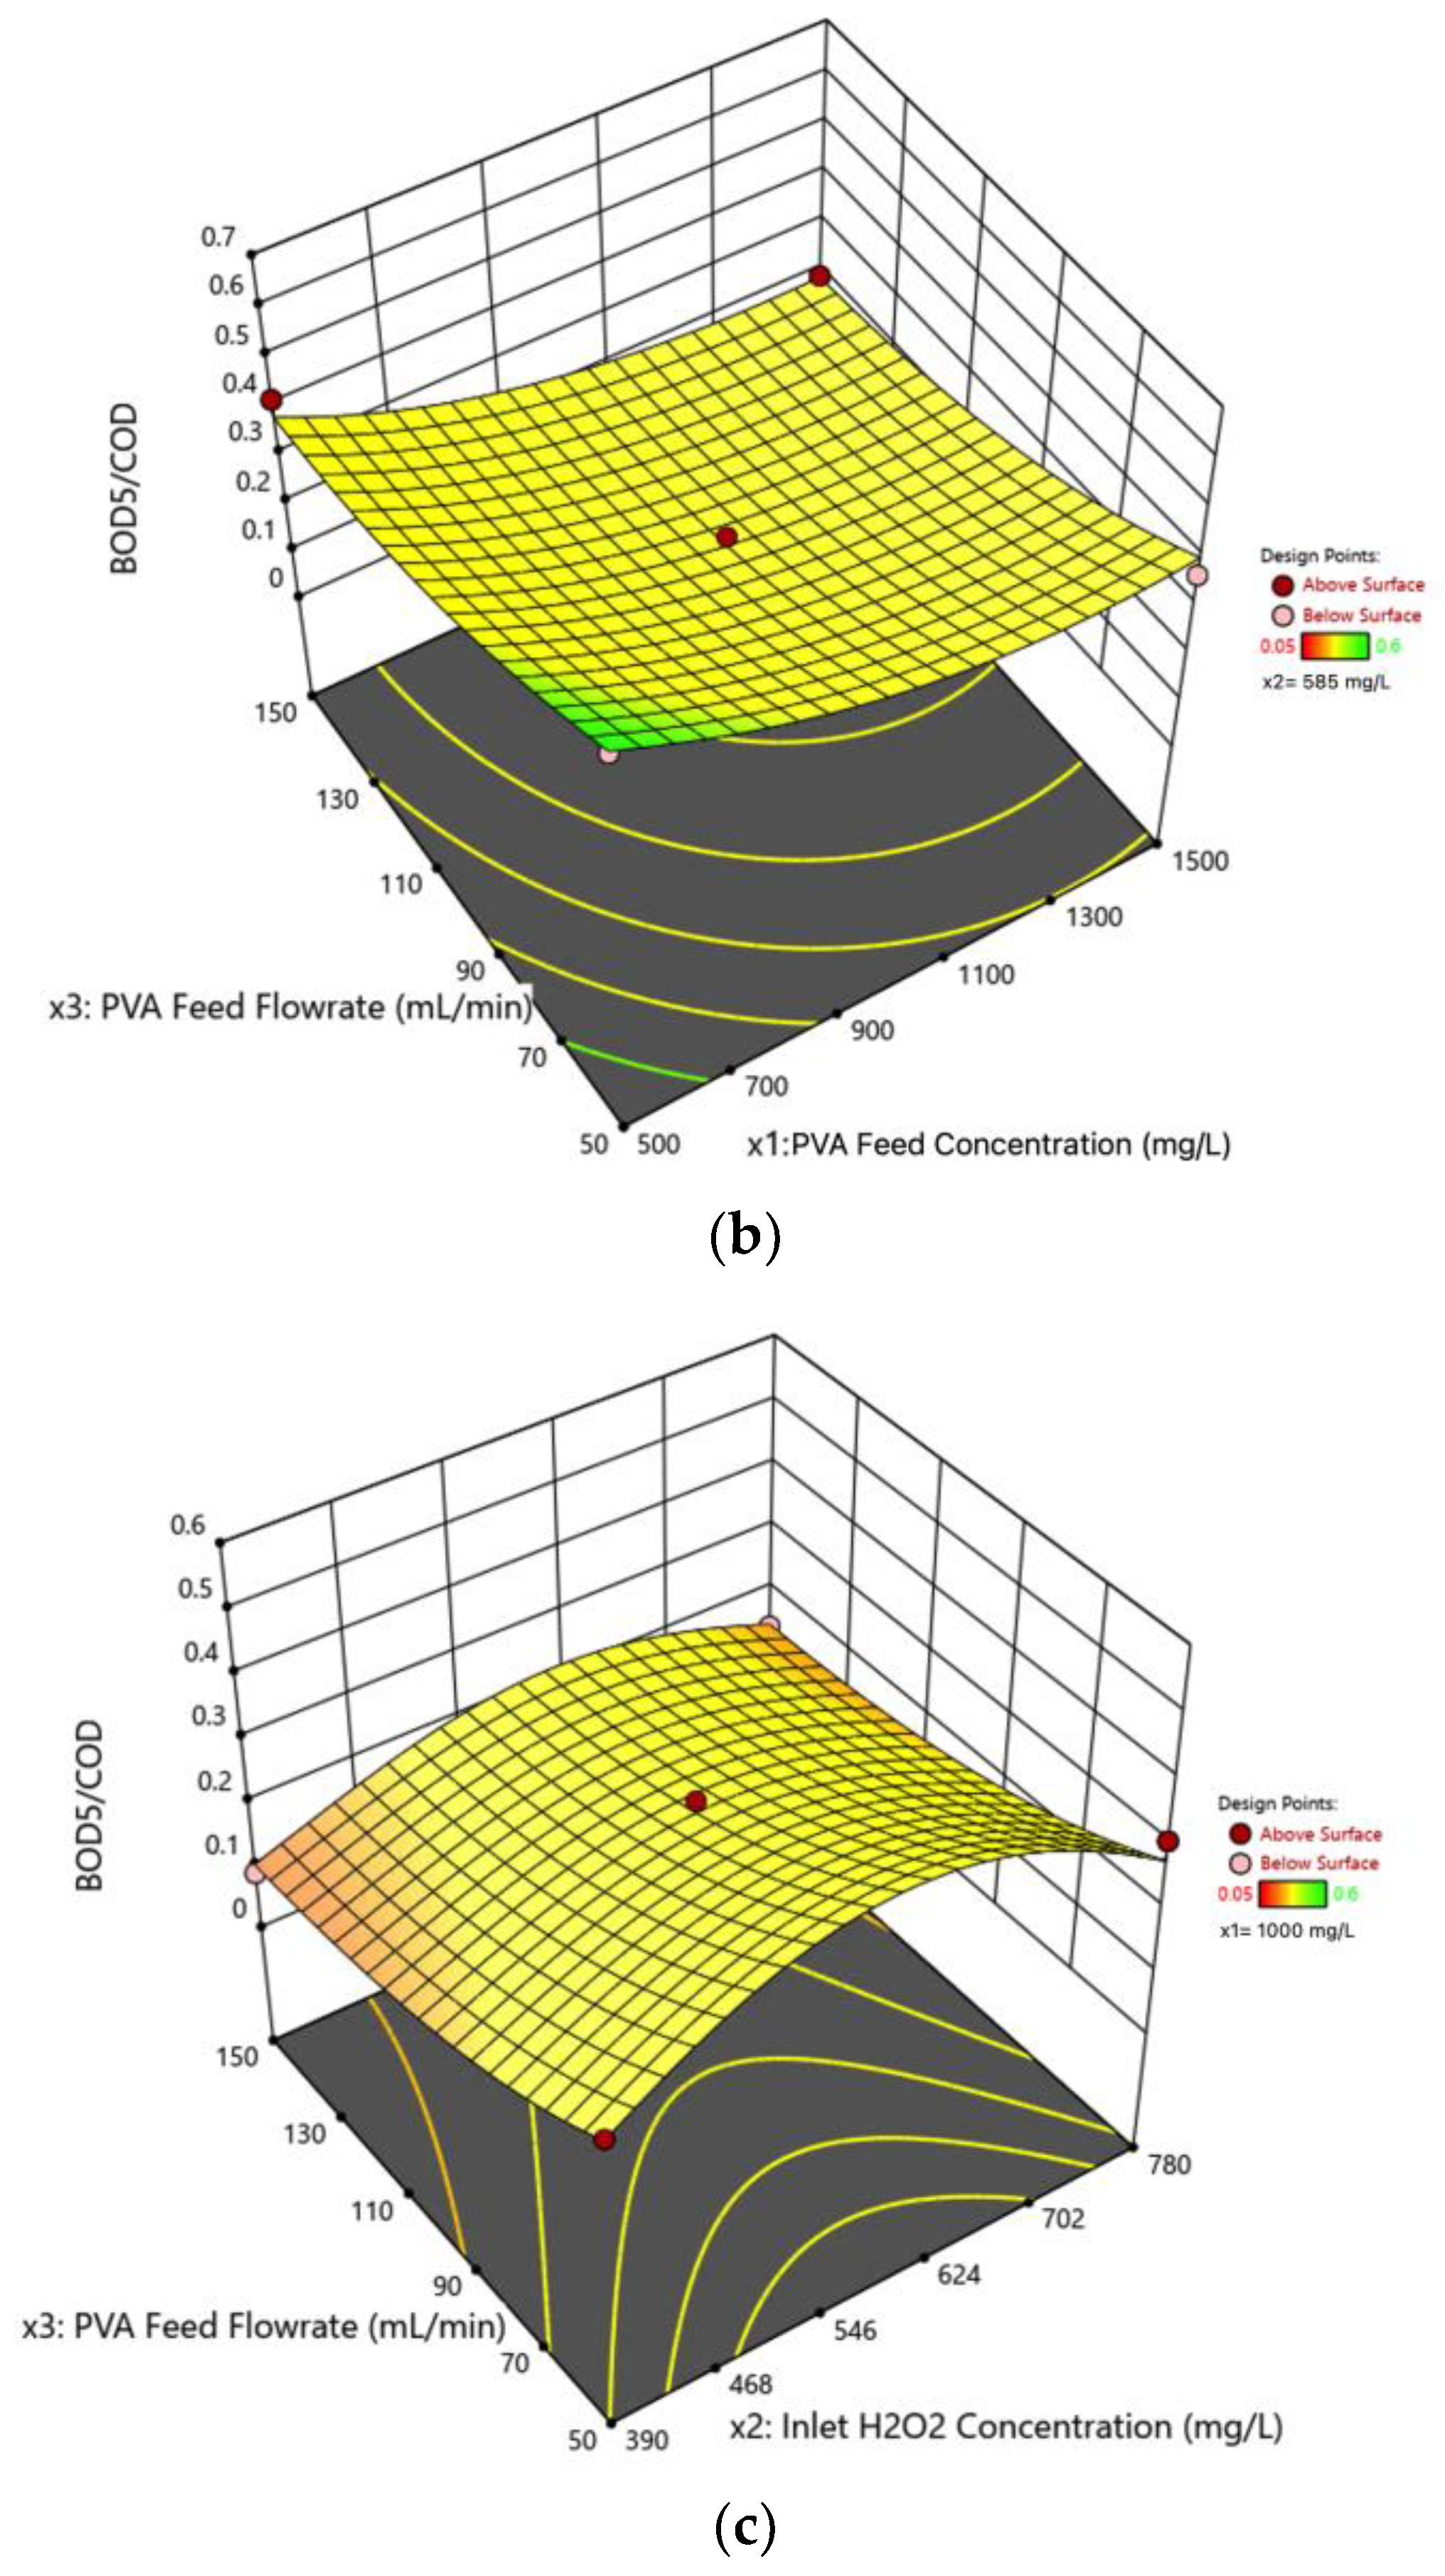
3.4.1. Effect of PVA Feed Concentration

Figure 4a exhibits the impact of the PVA feed concentrations on the effluent B O D 5 /COD. The observed trend reveals a decrease in the effluent B O D 5 /COD from 0.44 to 0.24 as the PVA feed concentration increases from 500 to 1500 mg/L. Before delving into the reasons behind this behaviour, it is essential to note that in the UV/ H 2 O 2 process, polymer macromolecules degrade through oxidation reactions by hydroxyl radicals.
These radicals are formed through the direct photolysis of H 2 O 2 upon exposure to the UV light. The fundamental reactions are outlined below:
H 2 O 2 h ν 2 H O
P r + H O P r + H 2 O
where h, ν , H O , P r , and P r are Planck’s constant, the light frequency, hydroxyl radical, undegraded polymer, and polymer radical, respectively.
Considering the above degradation mechanism, one plausible explanation for the behaviour observed in Figure 4a is that the higher PVA content in the wastewater leads to increased absorption of UV light by PVA molecules in the mixture. Consequently, the UV absorption by H 2 O 2 molecules is reduced. This implies that smaller amounts of hydroxyl radicals, responsible for the degradation of PVA, are generated, leading to a reduction in oxidation reactions. The impeded oxidation process results in an incomplete breakdown of macromolecules into smaller oligomers, dimers, and monomers. The observed decrease in the average molecular weight reduction with increasing PVA feed concentration, as depicted in Figure S1a, corroborates this explanation. Therefore, the effluent contains a more significant proportion of macromolecules, with only a smaller fraction of their COD being biodegradable. This ultimately leads to a lower B O D 5 /COD. It is noteworthy to point out that even at the highest concentration of PVA feed, the B O D 5 /COD of the wastewater exhibits an increase from 0.15 to 0.24. This observation suggests that although there is a decrease in the production of radicals, the effluent containing the generated compounds from the breakdown of PVA molecules exhibits a higher degree of biodegradability than the influent.

3.4.2. Effect of Inlet H 2 O 2 Concentration

The impact of elevating the inlet H 2 O 2 concentration on the effluent B O D 5 /COD is illustrated in Figure 4b, demonstrating an upward trend in the effluent B O D 5 /COD, from 0.14 to 0.27, as the inlet H 2 O 2 concentration rises from 390 to 585 mg/L. However, as the inlet H 2 O 2 concentration is subsequently elevated from 585 to 780 mg/L, the B O D 5 /COD diminishes to 0.17. Under UV exposure, increasing the inlet H 2 O 2 concentration from 390 to 585 mg/L leads to the generation of more hydroxyl radicals, as shown by Equation (6). Consequently, there is an enhanced degradation and cleavage of PVA molecules, leading to the production of shorter molecules and more biodegradable compounds in the effluent, resulting in the enhancement of the B O D 5 /COD ratio.
The decrease in the effluent B O D 5 /COD that was observed when increasing the inlet H 2 O 2 concentration from 585 to 780 mg/L can be attributed to the scavenging effect of excess H 2 O 2 [33,64,65]. When the amount of H 2 O 2 in the medium is relatively high, as described in Equation (8), H 2 O 2 scavenges hydroxyl radicals, leaving fewer to target and degrade the pollutant molecules. By surpassing the reaction described in Equation (8) relative to that delineated in Equation (7), hydroperoxyl radicals ( H O 2 ) are generated. Although hydroperoxyl radicals, as explicated in Equation (9), engage in attacking polymer macromolecules, they exhibit diminished efficacy in the degradation and fragmentation of these molecules due to their lower oxidation-reduction potential compared to that of hydroxyl radicals [66]. Consequently, the effluent contains longer and less degraded molecules, leading to a lower average molecular weight reduction, as shown in Figure S1b, and thus exhibits reduced biodegradability.
H 2 O 2 + H O H O 2 + H 2 O
P r + H O 2 P r + H 2 O 2

3.4.3. Effect of PVA Feed Flow Rate

Figure 4c shows a notable decrease in the effluent B O D 5 /COD from 0.43 to 0.22 as the PVA feed flow rate was increased from 50 to 150 mL/min. This observation is attributed to a shorter HRT resulting from a higher PVA feed flow rate. Consequently, the degradation and fragmentation processes have less time to occur. As a result, the effluent contains a higher proportion of undegraded macromolecules, leading to lower biodegradability. The decrease in the average molecular weight reduction with higher feed flow rates, illustrated in Figure S1c, provides additional evidence for this statement. Furthermore, according to [33], prolonging the reaction time leads to both a decrease in PVA molecular weight and the emergence of a broader molecular weight distribution (MWD). This broader MWD is indicated by a higher polydispersity index (PDI). These outcomes align with the notion that an extended reaction time allows for more extensive degradation and fragmentation, resulting in effluents with a higher biodegradability and elevated B O D 5 /COD.

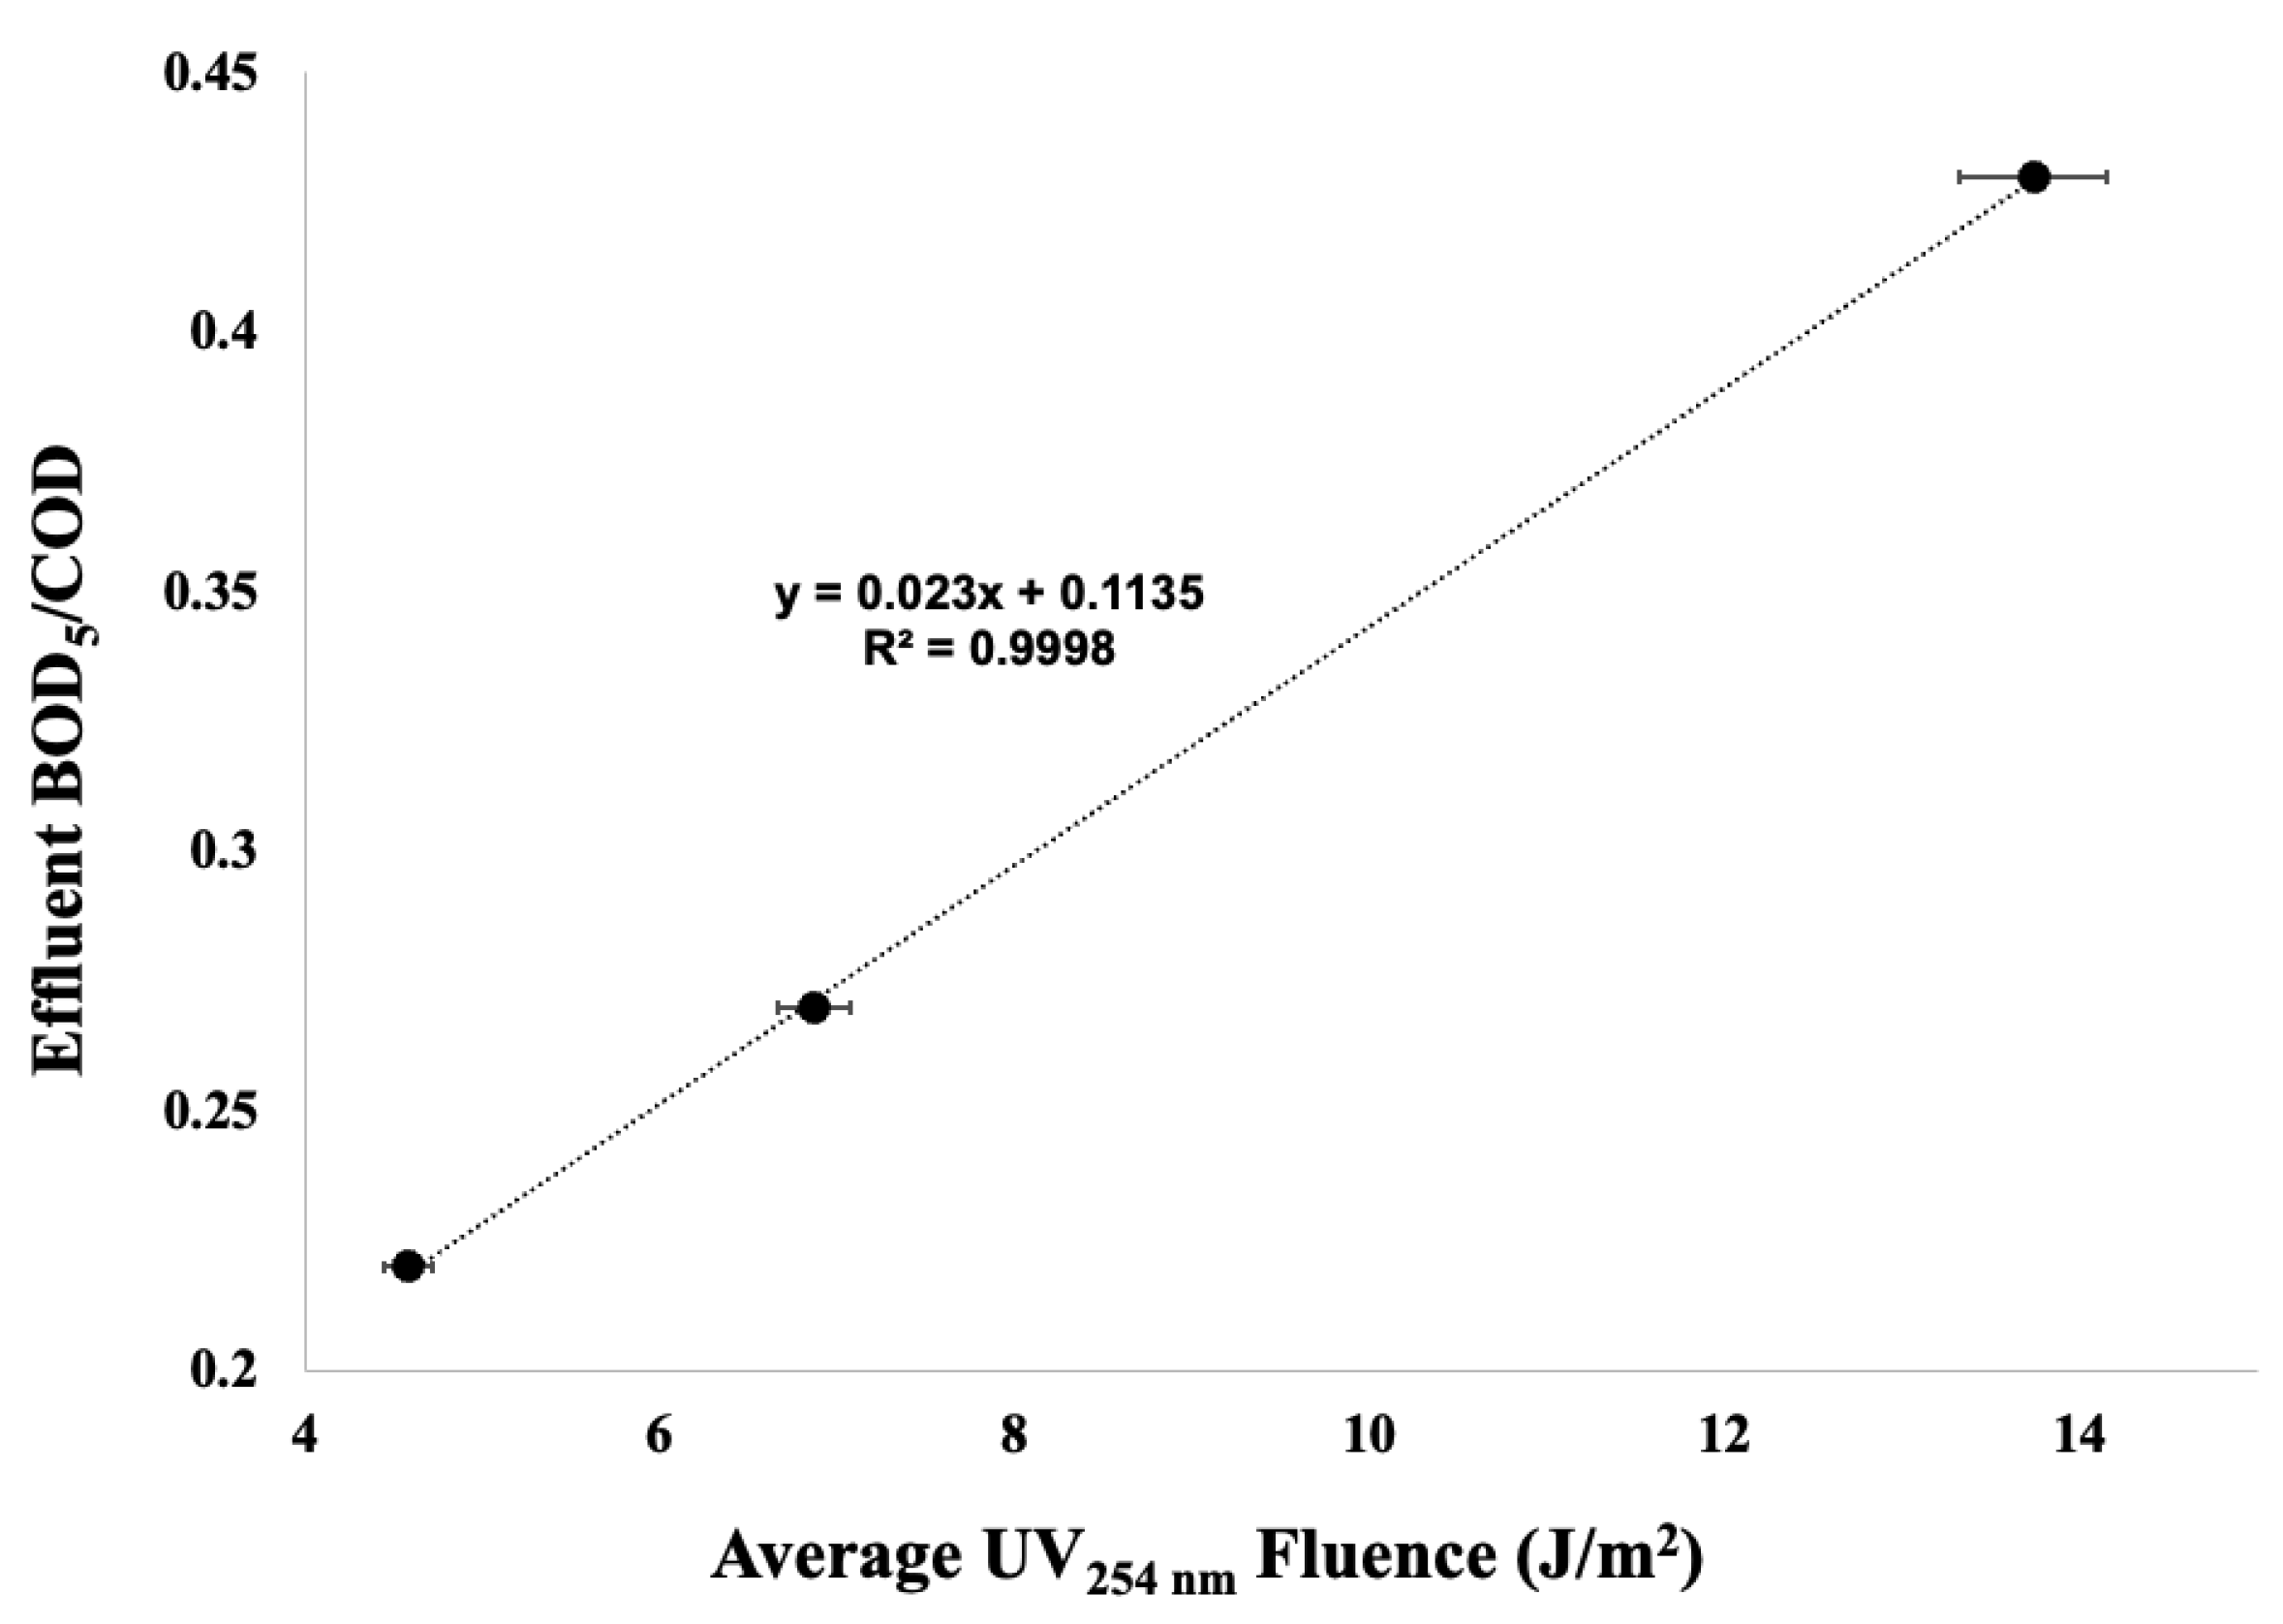
3.4.4. Importance of UV Fluence over Reaction Time

In several photo-oxidation studies, the importance of medium exposure to UV radiation is overlooked. This oversight sometimes causes inconsistencies in the published data. These inconsistencies are probably due to the differences in photoreactor characteristics and UV lamp specifications that have been neglected sometimes. To overcome this limitation and provide more comprehensive insights, it is essential to consider the fluence, also known as radiant exposure, a key parameter solely relying on the aqueous PVA feed flow rate and the residence time [67]. The fluence refers to the total radiant energy per unit surface area that passes through a small imaginary sphere. The fluence, H 0 (J/m2), is expressed by Equation (10), where E 0 (W/m2) represents the fluence rate, and t (s) denotes the irradiation duration [68]:
H 0 = E 0 d t
Assuming a constant fluence rate over time, the fluence is given as follows:
H 0 = E 0 t
Additionally, suppose the irradiated beams are parallel, perpendicular to the target surface, and not scattered or reflected by the target or surroundings. In this case, the fluence is equivalent to the radiant exposure, which is defined by the following equation [68]:
H = E d t
where H (J/m2) is the radiant exposure, and E (W/m2) and t (s) are the irradiance and exposure time, respectively. Assuming constant irradiance over time, this equation can be further simplified as follows:
H = E t
In this study, the flow regime is determined by calculating the Reynolds number (Re) for the flow through the annular space using the equation below [69]:
R e = 2 r o ( 1 r i r o ) v z ¯ ρ μ
where r o and r i are the outer and inner radii (m) of the annular tube, respectively, v z ¯ (m/s) is the average velocity of the aqueous medium through the annular space, and ρ (kg/m3) and μ (Pa.s) are the density and viscosity of the aqueous medium, respectively. Based on the inlet flow rate of approximately 50–150 mL/min and considering the dimensions of the photoreactor shown in Figure 5, the calculated range of Re is 15–46. Since this is lower than 2000, it indicates a laminar flow regime. In laminar flow, the fluid tends to flow in parallel layers with different velocities without mixing with the adjacent layers. These layers slide past each other smoothly. Considering the laminar flow and assuming the UV light is uniformly emitting with constant irradiance in parallel rays, the light irradiates the target molecules perpendicularly. By assuming negligible scattering and reflection due to the lack of solid particles in the medium [70], the conditions for the equivalence of fluence and radiant exposure, or the equivalence of Equations (11) and (13), are satisfied. Consequently, the effect of fluence, which is equivalent to radiant exposure, on the process response is investigated, while the PVA feed and inlet H 2 O 2 concentrations are kept at their central levels.
Assuming a constant irradiance at any point on the cylindrical UV lamp, as depicted in Figure 5, the irradiance decreases gradually when moving radially outward from the lamp towards the wall of the photoreactor. In this study, E a v g , 254 n m , representing the average irradiance at 254 nm at any point within the photoreactor, was determined by calculating the integral as shown below:
E a v g , 254 n m = 1 r 0 r E r , 254 n m d r
where r is the radial distance from the lamp, and E r , 254 n m is the irradiance at that distance. E r , 254 n m is determined utilizing the Beer–Lambert law. The application of the Beer–Lambert law to elucidate the light absorbance at a wavelength of 254 nm as it passes through a multi-component mixture along a path length of r yields the equation below [71]:
A 254 n m = log E 0 , 254 n m E r , 254 n m = r i = 1 i = n ε i , 254 n m c i
where A 254 n m and ε i , 254 n m are the light absorbance and the molar extinction coefficient of compound i at 254 nm. E 0 , 254 n m is the incident irradiance of the lamp. Also, c i is the molar concentration of substance i in the mixture. Using Equation (16), E r , 254 n m can be calculated using the following equation:
E r , 254 n m = E 0 , 254 n m 10 r i = 1 i = n ε i , 254 n m c i
In this study, given the presence of two primary substances within the medium, PVA and H 2 O 2 , Equation (17) can be reformulated as follows:
E r , 254 n m = E 0 , 254 n m 10 r ( ε P V A , 254 n m × c P V A + ε H 2 O 2 , 254 n m × c H 2 O 2 )
where the inlet concentrations of H 2 O 2 and PVA were assumed for c i s, and molar extinction coefficients of the compounds at 254 nm were obtained from the literature as listed in Table S4. The measurement of E 0 , 254 n m was performed using a Spectroline DM-254XA digital radiometer. The UV lamps were removed from the photoreactors for the radiometry and mounted securely on a laboratory stand using appropriate clamps. To prevent light exposure to the surrounding area, a cubic portable wooden enclosure was placed around the setup. After equipping personal protective equipment, the radiometer sensors were positioned adjacent to the lamps’ surface. The lamps were turned on for 30 min prior to the measurements to ensure a stable radiation level. Using this information, E a v g , 254 n m was calculated with Equation (15). Details of these calculations are provided in the Supplementary Information.
Utilizing Equation (13) to calculate H a v g , 254 n m , the average exposure time was equal to the average HRT, which was derived by dividing the volumes of the photoreactors by the constant inlet flow rate. The following equation shows the final relationship:
H 0 a v g , 254 n m = H a v g , 254 n m = E a v g , 254 n m H R T a v g
Accordingly, the variation in the average fluence ( J / m 2 ) was calculated by maintaining constant values for the PVA feed and inlet H 2 O 2 concentrations at their central levels of 1000 and 585 (mg/L), respectively, while altering the PVA feed flow rate. Consequently, Figure 4c was reconfigured as Figure 6. It was observed that as the PVA feed flow rate increased from 50 to 150 mL/min, the average fluence decreased from 12.48 to 4.16   J / m 2 . This reduction in fluence correspondingly resulted in a decline in the effluent B O D 5 /COD ratio from 0.43 to 0.22. The underlying explanation is that since UV exposure is crucial for photo-oxidation reactions, a reduction in fluence (UV exposure) results in decreased degradation and photo-oxidation processes. Consequently, this produces an effluent with larger, less degraded molecules, as illustrated in Figure S1c, leading to reduced biodegradability. Given the differences in lamp characteristics and photoreactor configurations across various studies, Figure 6 offers more reliable insights for future research. This figure is preferred over Figure 4c, because it provides a more accurate representation of the experimental conditions, allowing researchers to consider the specific attributes of the lamps and photoreactors used.

3.5. Interaction Effects of Process Variables on the Effluent B O D 5 /COD

In the Supplementary Information, the two-dimensional plots illustrating the interaction effects of each pair of input variables on the effluent B O D 5 /COD are shown in Figures S2–S4. By extending the developed data-driven model to encompass the entire experimental range, comprehensive three-dimensional response graphs were generated to visually depict the influence of the variable interactions on the process response. In this study, with three process variables under investigation, the effluent B O D 5 /COD was plotted as a surface in a three-dimensional plot, in which each point on this surface was determined by the values of two interacting variables while keeping the third variable constant at its central point. Figure 7 presents these response surface graphs, in which the surface is colour-coded to represent variations in the process response resulting from changes in the interacting variables. Additionally, colour-coded contour lines are depicted on the bottom gray plane of these graphs, highlighting regions associated with varying B O D 5 /COD, ranging from low to high. These surface response graphs are valuable tools for identifying optimal operating points by visually analyzing the contour lines and observing the graphs’ trends.
Furthermore, the ANOVA results indicate that the interactions between the PVA feed and inlet H 2 O 2 concentrations have the most significant impact on the process response, with the lowest p-value of <0.0001. Additionally, this interaction is the only significant one among the process variables. Figure 7a demonstrates that variations in the PVA feed concentration within the experimental range can either increase or decrease the effluent B O D 5 /COD, depending on the concentration of inlet H 2 O 2 . Indeed, when the inlet H 2 O 2 concentration is at its lowest level of 390 mg/L, increasing the PVA feed concentration from 500 to 1500 mg/L decreases the effluent B O D 5 /COD from 0.53 to 0.05. Conversely, when the inlet H 2 O 2 concentration is at its highest, 780 mg/L, varying the PVA feed concentration from 500 to 1500 mg/L enhances the effluent B O D 5 /COD from 0.11 to 0.36. In predicting this behaviour, the PVA feed flow rate was assumed to be constant at its central value of 100 mL/min. This behaviour can be explained by considering that at lower concentrations of H 2 O 2 , fewer hydroxyl radicals are generated, resulting in a limited degradation of PVA. Thus, as the concentration of PVA increases, the degradation and improvement in biodegradability are less pronounced. Conversely, at higher concentrations of H 2 O 2 , the abundance of hydroxyl radicals effectively degrades the higher concentrations of PVA, significantly enhancing its biodegradability. However, when the concentration of PVA decreases, the excess H 2 O 2 becomes dominant, leading to scavenging effects that generate hydroperoxyl radicals. As mentioned in previous sections, these radicals are less effective in degrading aqueous PVA and enhancing its biodegradability.
In addition to the interaction between the PVA feed and inlet H 2 O 2 concentrations, the squared terms of these two input variables are also significant, with p-values of 0.0172 and 0.0006, respectively. This implies that the relationship between the effluent B O D 5 /COD and these independent variables exhibits a curvature rather than a linearity. This curvature is particularly pronounced in the relationship of the process response with the inlet H 2 O 2 concentration, as indicated by the significantly lower p-value for its squared term. It should be noted that although the ANOVA results for the individual effect of the inlet H 2 O 2 concentration on the process response renders it insignificant, it is essential to retain this term in the reduced mathematical model. This is because the interaction between the inlet H 2 O 2 and the PVA feed concentrations, as well as its squared term, significantly impact the process response. Thus, the inclusion of the inlet H 2 O 2 concentration term ( x 2 ) in Equation (5) allows for a better representation of the process.
Although the interactions of other variables on the process response are not statistically significant, their behaviours are elucidated as follows. Figure 7b shows that increasing the PVA feed concentration and flow rate decreases biodegradability. This can be attributed to the limited availability of H 2 O 2 for degradation when the PVA is more concentrated. Moreover, the residence time is reduced at higher flow rates, resulting in less degradation and fragmentation. Consequently, its biodegradability is diminished.
Furthermore, Figure 7c shows that regardless of the feed flow rate level, increasing the inlet H 2 O 2 concentration initially improves the effluent’s biodegradability; however, further increases result in a decreased biodegradability. The shorter residence time further reduces its relative biodegradability as the feed flow rate rises. These interpretations and the observed response surfaces align well with the results of our previously published paper, which discussed the molecular weight reduction [35].

3.6. Optimal Operating Conditions, Experimental Validation, and Comparision with Previous Studies

This study focuses on investigating the feasibility of implementing the UV/ H 2 O 2 process to enhance the biodegradability of aqueous PVA solutions. Additionally, by comparing the required chemical and power consumption at optimal operating points, it was assessed whether implementing the process as a pre-treatment to enhance biodegradability or as a full treatment to remove TOC content is more economical. The optimization objective in this study is to achieve an effluent with an enhanced B O D 5 /COD of 0.5, indicating a readily biodegradable effluent. Such an effluent is suitable to be subject to subsequent post-biological treatment [14]. Thus, Equation (4) served as the objective function, and the optimization goal was attaining a B O D 5 /COD of 0.5, while the optimal solution was constrained within the experimental space. The Design Expert software incorporates the optimization tool, enabling the manual definition of the optimization objective and constraints. In a previous study conducted in our research group, the optimal operating conditions for achieving the maximum TOC removal were 665 mg/L, 460 mg/L, and 50 mL/min for the PVA feed, inlet H 2 O 2 concentrations, and PVA feed flow rate, respectively [35]. To compare the results of this study with those of the previous one, one equality constraint was imposed to maintain the PVA feed concentration at 665 mg/L. After solving the optimization problem using the software, the optimal operating point listed in Table 3 was selected among the suggested solutions. The selection of optimal operating conditions was conducted based on the high desirability of the solution, indicated by a value of 1, coupled with a low required inlet H 2 O 2 concentration and PVA feed flow rate, resulting in the minimization of material and power consumption costs. The experiment under optimal operating conditions resulted in an effluent B O D 5 /COD within ±5% of the predicted value, validating the suggested optimal solution.
Furthermore, a simple comparison between the optimal operating conditions in Table 3 reveals that the pre-treatment stage requires a lower inlet H 2 O 2 concentration (390 mg/L compared to 460 mg/L) and a shorter HRT (higher PVA feed flow rate), indicating reduced material and power consumption. This underscores the lower operating cost of employing the UV/ H 2 O 2 process as a pre-treatment stage rather than utilizing it as a full treatment.

4. Conclusions

A combination of a BBD and the RSM was employed to investigate the impact of PVA feed concentration, inlet H 2 O 2 concentration, and PVA feed flow rate on the effluent biodegradability of a UV/ H 2 O 2 photoreactor. The findings demonstrated the capability of the UV/ H 2 O 2 process to improve the biodegradability of an aqueous PVA solution, as evidenced by an increase in the B O D 5 /COD within the experimental domain (up to 0.53).
It was also concluded that increasing the PVA feed concentration decreases the process effluent biodegradability. This phenomenon is attributed to partial degradation, resulting from a reduction in the concentration of hydroxyl radicals. This reduction occurs due to the limitation of light absorbance by H 2 O 2 molecules because of the overabundance of PVA, which blocks and absorbs light. Similarly, when the inlet H 2 O 2 concentration rises, it initially improves the effluent’s biodegradability. However, an excessive amount of H 2 O 2 leads to a scavenging effect, causing a decrease in effluent biodegradability at higher concentrations of H 2 O 2 . Additionally, an increase in the PVA feed flow rate leads to reduced photo-oxidation, resulting in decreased effluent biodegradability due to decreased HRT and UV exposure (fluence). The ANOVA analysis illustrated the significance of the process variables, particularly the interaction between the PVA feed and inlet H 2 O 2 concentrations, in influencing the process response.
Comparing the results of this study and those of our previous research revealed that the enhancement of aqueous PVA biodegradability using the UV/ H 2 O 2 process is due to the reduction in molecular weight because of the generation of shorter molecules from molecular cleavage and breakdown. Accordingly, the poor biodegradability of aqueous PVA was attributed to its initial high molecular weight.
This optimization study aimed for an effluent B O D 5 /COD of 0.5 while the PVA feed concentration was 665 mg/L, consistent with a prior optimization effort for maximal TOC removal. It was determined that the optimization target can be achieved by employing a lower inlet H 2 O 2 concentration, 390 mg/L compared to 460 mg/L, and a higher PVA feed flow rate, 59 mL/min compared to 50 mL/min. Consequently, the study results suggest that not only can the biodegradability of aqueous PVA be enhanced through the UV/ H 2 O 2 process, but it is also more economical than implementing the process for complete PVA removal. It should be noted that despite this conclusion, a detailed cost analysis of combining UV/ H 2 O 2 with post-biological treatment is still required. This analysis should be compared with other novel methods to assess its overall cost-effectiveness relative to that of various available alternatives. Also, it is worth mentioning that this study enhanced the biodegradability of the PVA solution for activated sludge and wastewater treatment purposes. The respirometry results show that the activated sludge consumes the treated solution more efficiently than the untreated one. However, this finding does not extend to the wastewater toxicity evaluation. To assess whether the effluent is less toxic to specific microbes, conducting other appropriate tests, such as ISO 11348, ISO 15522, OECD [72,73,74], or their modified versions, [75,76] is recommended.

Supplementary Materials

The following supporting information can be downloaded at: https://www.mdpi.com/article/10.3390/su16167060/s1, Table S1. Formulation and concentration of chemicals in 1 L respirometry stock nutrient broth, with a BODu of 20,000 mg/L. The solvent is distilled water, and the solution must be stored in a dark place at 4 °C after its pH is adjusted to 7.5. Table S2. Process independent variables, their representative symbols, and their coded and actual ranges utilized in BBD. Table S3. BBD design for three-factor three-level experiments alongside the observed and predicted effluent BOD5/COD for each run. Table S4. Values of molar extinction coefficients (L/mol cm) for PVA and H2O2. Figure S1. Influence of a) PVA feed concentration, b) inlet H2O2 concentration, and c) the PVA feed flow rate on the reduction in molecular weight, while the other two variables are kept constant at their central design values. Figure S2. Interaction of PVA feed and inlet H2O2 concentrations for PVA degradation by continuous UV/H2O2 process and their effects on the effluent’s BOD5/COD, while PVA feed flow rate is kept constant at its central level, 100 mL/min. Figure S3. Interaction of PVA feed concentration and flow rate for PVA degradation in a continuous UV/H2O2 process and their effects on the effluent’s BOD5/COD, while inlet H2O2 concentration is kept constant at its central level, 585 mg/L. Figure S4. Interaction of inlet H2O2 concentration and PVA feed flow rate for PVA degradation in a continuous UV/H2O2 process and their effects on the effluent’s BOD5/COD, while PVA feed concentration is kept constant at its central level, 1000 mg/L. Section S2.1. Calculation of the Average Irradiance (Eavg,254nm).

Author Contributions

Conceptualization, M.M. and R.D.; methodology, experiments, software, validation, data analysis, modelling, Z.P. while guided by M.M. and R.D.; writing—original draft preparation, Z.P.; writing—review and editing, Z.P., M.M. and R.D. All authors have read and agreed to the published version of the manuscript.

Funding

This research was funded by the Natural Sciences and Engineering Research Council of Canada (NSERC), Toronto Metropolitan University Graduate Scholarship (TMUGS), and Toronto Metropolitan University Faculty of Engineering and Architectural Science. The authors would like to thank these institutions for their financial support.

Institutional Review Board Statement

Not applicable.

Informed Consent Statement

Not applicable.

Data Availability Statement

The data are contained within the article.

Conflicts of Interest

The authors declare no conflicts of interest. The funders had no role in the design, execution, interpretation, or writing of the study.

References

  1. Abdullah, Z.W.; Dong, Y.; Davies, I.J.; Barbhuiya, S. PVA, PVA Blends, and Their Nanocomposites for Biodegradable Packaging Application. Polym-Plast. Technol. Eng. 2017, 56, 1307–1344. [Google Scholar] [CrossRef]
  2. Hoffmann, J.; Řezníčková, I.; Kozáková, J.; Růžička, J.; Alexy, P.; Bakoš, D.; Precnerová, L. Assessing Biodegradability of Plastics Based on Poly(Vinyl Alcohol) and Protein Wastes. Polym. Degrad. Stab. 2003, 79, 511–519. [Google Scholar] [CrossRef]
  3. Patil, R.; Bagde, U.S. Development of Novel Bacterial Strains for Enhanced of Plastic Polymers by Protoplast. Asian J. Microbiol. Biotechnol. Environ. Sci. 2016, 18, 239–249. [Google Scholar]
  4. Shah, A.A.; Hasan, F.; Hameed, A.; Ahmed, S. Biological Degradation of Plastics: A Comprehensive Review. Biotechnol. Adv. 2008, 26, 246–265. [Google Scholar] [CrossRef]
  5. Vroman, I.; Tighzert, L. Biodegradable Polymers. Materials 2009, 2, 307–344. [Google Scholar] [CrossRef]
  6. Lim, B.K.H.; Thian, E.S. Biodegradation of Polymers in Managing Plastic Waste—A Review. Sci. Total Environ. 2022, 813, 151880. [Google Scholar] [CrossRef]
  7. Ghatge, S.; Yang, Y.; Ahn, J.H.; Hur, H.G. Biodegradation of Polyethylene: A Brief Review. Appl. Biol. Chem. 2020, 63, 27. [Google Scholar] [CrossRef]
  8. Matjašič, T.; Simčič, T.; Medvešček, N.; Bajt, O.; Dreo, T.; Mori, N. Critical Evaluation of Biodegradation Studies on Synthetic Plastics through a Systematic Literature Review. Sci. Total Environ. 2021, 752, 141959. [Google Scholar] [CrossRef]
  9. Wang, D.; Zheng, Y.; Deng, Q.; Liu, X. Water-Soluble Synthetic Polymers: Their Environmental Emission Relevant Usage, Transport and Transformation, Persistence, and Toxicity. Environ. Sci. Technol. 2023, 57, 6387–6402. [Google Scholar] [CrossRef] [PubMed]
  10. Tchobanoglous, G.; Stensel, H.D.; Tsuchihashi, R.; Burton, F.; Abu-Orf, M.; Bowden, G.; Pfrang, W.; Metcalf & Eddy, Inc. Wastewater Engineering: Treatment and Resource Recovery, 5th ed.; McGraw-Hill Education: New York, NY, USA, 2014. [Google Scholar]
  11. Al-Sulaiman, A.M.; Khudair, B.H. Correlation Between BOD5 And Cod for Al-Diwaniyah Wastewater Treatment Plants to Obtain the Biodegradability Indices. J. Biotechnol. 2018, 15, 423–427. [Google Scholar]
  12. Malik, S.N.; Khan, S.M.; Ghosh, P.C.; Vaidya, A.N.; Kanade, G.; Mudliar, S.N. Treatment of Pharmaceutical Industrial Wastewater by Nano-Catalyzed Ozonation in a Semi-Batch Reactor for Improved Biodegradability. Sci. Total Environ. 2019, 678, 114–122. [Google Scholar] [CrossRef] [PubMed]
  13. Padoley, K.V.; Saharan, V.K.; Mudliar, S.N.; Pandey, R.A.; Pandit, A.B. Cavitationally Induced Biodegradability Enhancement of a Distillery Wastewater. J. Hazard. Mater. 2012, 219–220, 69–74. [Google Scholar] [CrossRef] [PubMed]
  14. Zhang, B.; Ning, D.; Yang, Y.; Van Nostrand, J.D.; Zhou, J.; Wen, X. Biodegradability of Wastewater Determines Microbial Assembly Mechanisms in Full-Scale Wastewater Treatment Plants. Water Res. 2020, 169, 115276. [Google Scholar] [CrossRef] [PubMed]
  15. Sun, W.; Chen, L.; Zhang, Y.; Wang, J. Synergistic Effect of Ozonation and Ionizing Radiation for PVA Decomposition. J. Environ. Sci. 2015, 34, 63–67. [Google Scholar] [CrossRef] [PubMed]
  16. Bian, H.; Cao, M.; Wen, H.; Tan, Z.; Jia, S.; Cui, J. Biodegradation of Polyvinyl Alcohol Using Cross-Linked Enzyme Aggregates of Degrading Enzymes from Bacillus Niacini. Int. J. Biol. Macromol. 2019, 124, 10–16. [Google Scholar] [CrossRef] [PubMed]
  17. Dong, Y.; Bian, L.; Wang, P. Accelerated Degradation of Polyvinyl Alcohol via a Novel and Cost Effective Heterogeneous System Based on Na2S2O8 Activated by Fe Complex Functionalized Waste PAN Fiber and Visible LED Irradiation. Chem. Eng. J. 2019, 358, 1489–1498. [Google Scholar] [CrossRef]
  18. Zeeshan, M.H.; Ruman, U.E.; He, G.; Sabir, A.; Shafiq, M.; Zubair, M. Environmental Issues Concerned with Poly (Vinyl Alcohol) (PVA) in Textile Wastewater. In Polymer Technology in Dye-Containing Wastewater. Sustainable Textiles: Production, Processing, Manufacturing & Chemistry; Khadir, A., Muthu, S.S., Eds.; Springer: Singapore, 2022; pp. 225–236. [Google Scholar] [CrossRef]
  19. Obaideen, K.; Shehata, N.; Sayed, E.T.; Abdelkareem, M.A.; Mahmoud, M.S.; Olabi, A.G. The Role of Wastewater Treatment in Achieving Sustainable Development Goals (SDGs) and Sustainability Guideline. Energy Nexus 2022, 7, 100112. [Google Scholar] [CrossRef]
  20. Demerlis, C.C.; Schoneker, D.R. Review of the Oral Toxicity of Polyvinyl Alcohol (PVA). Food Chem. Toxicol. 2003, 41, 319–326. [Google Scholar] [CrossRef]
  21. Julinová, M.; Vaňharová, L.; Jurča, M. Water-Soluble Polymeric Xenobiotics–Polyvinyl Alcohol and Polyvinylpyrrolidon–And Potential Solutions to Environmental Issues: A Brief Review. J. Environ. Manag. 2018, 228, 213–222. [Google Scholar] [CrossRef]
  22. Nigro, L.; Magni, S.; Ortenzi, M.A.; Gazzotti, S.; Della Torre, C.; Binelli, A. Are “Liquid Plastics” a New Environmental Threat? The Case of Polyvinyl Alcohol. Aquat. Toxicol. 2022, 248, 106200. [Google Scholar] [CrossRef]
  23. Samal, K.; Maiti, K.; Mohanty, K.; Das, C. Ultrafiltration of Aqueous PVA Using Spinning Basket Membrane Module. Water Air Soil Pollut. 2018, 229, 96. [Google Scholar] [CrossRef]
  24. Manna, M.; Sen, S. Advanced Oxidation Process: A Sustainable Technology for Treating Refractory Organic Compounds Present in Industrial Wastewater. Environ. Sci. Pollut. Res. 2023, 30, 25477–25505. [Google Scholar] [CrossRef]
  25. Bossmann, S.H.; Oliveros, E.; Göb, S.; Kantor, M.; Göppert, A.; Lei, L.; Yue, P.L.; Braun, A.M. Degradation of Polyvinyl Alcohol (PVA) by Homogeneous and Heterogeneous Photocatalysis Applied to the Photochemically Enhanced Fenton Reaction. Water Sci. Technol. 2001, 44, 257–262. [Google Scholar] [CrossRef]
  26. Bossmann, S.H.; Oliveros, E.; Göb, S.; Kantor, M.; Göppert, A.; Braun, A.M.; Lei, L.; Lock Yue, P. Oxidative Degradation of Polyvinyl Alcohol by the Photochemically Enhanced Fenton Reaction. Evidences for the Formation of Super-Macromolecules. Prog. React. Kinet. Mech. 2001, 26, 113–137. [Google Scholar] [CrossRef]
  27. Lin, C.C.; Hsu, S.T. Performance of NZVI/H2O2 Process in Degrading Polyvinyl Alcohol in Aqueous Solutions. Sep. Purif. Technol. 2018, 203, 111–116. [Google Scholar] [CrossRef]
  28. Bae, W.; Won, H.; Hwang, B.; de Toledo, R.A.; Chung, J.; Kwon, K.; Shim, H. Characterization of Refractory Matters in Dyeing Wastewater during a Full-Scale Fenton Process Following Pure-Oxygen Activated Sludge Treatment. J. Hazard. Mater. 2015, 287, 421–428. [Google Scholar] [CrossRef]
  29. Giroto, J.A.; Guardani, R.; Teixeira, A.C.S.C.; Nascimento, C.A.O. Study on the Photo-Fenton Degradation of Polyvinyl Alcohol in Aqueous Solution. Chem. Eng. Process. Process Intensif. 2006, 45, 523–532. [Google Scholar] [CrossRef]
  30. Cataldo, F.; Angelini, G. Some Aspects of the Ozone Degradation of Poly(Vinyl Alcohol). Polym. Degrad. Stab. 2006, 91, 2793–2800. [Google Scholar] [CrossRef]
  31. Yan, Z.; Zhu, J.; Hua, X.; Liang, D.; Dong, D.; Guo, Z.; Zheng, N.; Zhang, L. Catalytic Ozonation for the Degradation of Polyvinyl Alcohol in Aqueous Solution Using Catalyst Based on Copper and Manganese. J. Clean. Prod. 2020, 272, 122856. [Google Scholar] [CrossRef]
  32. Sun, W.; Chen, L.; Wang, J. Degradation of PVA (Polyvinyl Alcohol) in Wastewater by Advanced Oxidation Processes. J. Adv. Oxid. Technol. 2017, 20, 20170018. [Google Scholar] [CrossRef]
  33. Hamad, D.; Mehrvar, M.; Dhib, R. Photochemical Kinetic Modeling of Degradation of Aqueous Polyvinyl Alcohol in a UV/H2O2 Photoreactor. J. Polym. Environ. 2018, 26, 3283–3293. [Google Scholar] [CrossRef]
  34. Lin, C.C.; Lee, L.T. Degradation of Polyvinyl Alcohol in Aqueous Solutions Using UV/Oxidant Process. J. Ind. Eng. Chem. 2015, 21, 569–574. [Google Scholar] [CrossRef]
  35. Hamad, D.; Dhib, R.; Mehrvar, M. Photochemical Degradation of Aqueous Polyvinyl Alcohol in a Continuous UV/H2O2 Process: Experimental and Statistical Analysis. J. Polym. Environ. 2016, 24, 72–83. [Google Scholar] [CrossRef]
  36. Lin, C.C.; Lee, L.T.; Hsu, L.J. Degradation of Polyvinyl Alcohol in Aqueous Solutions Using UV-365 Nm/S2O82− Process. Environ. Sci. Technol. 2014, 11, 831–838. [Google Scholar] [CrossRef]
  37. Chen, Y.; Sun, Z.; Yang, Y.; Ke, Q. Heterogeneous Photocatalytic Oxidation of Polyvinyl Alcohol in Water. J. Photochem. Photobiol. A Chem. 2001, 142, 85–89. [Google Scholar] [CrossRef]
  38. Hsu, L.J.; Lee, L.T.; Lin, C.C. Adsorption and Photocatalytic Degradation of Polyvinyl Alcohol in Aqueous Solutions Using P-25 TiO2. Chem. Eng. J. 2011, 173, 698–705. [Google Scholar] [CrossRef]
  39. Won, Y.S.; Back, S.O.; Tavakoli, J. Wet Oxidation of Aqueous Polyvinyl Alcohol Solution. Ind. Eng. Chem. Res. 2001, 40, 60–66. [Google Scholar] [CrossRef]
  40. Chen, G.; Lei, L.; Yue, P.L.; Cen, P. Treatment of Desizing Wastewater Containing Poly(Vinyl Alcohol) by Wet Air Oxidation. Ind. Eng. Chem. Res. 2000, 39, 1193–1197. [Google Scholar] [CrossRef]
  41. Kim, S.; Kim, T.-H.; Park, C.; Shin, E.-B. Electrochemical Oxidation of Polyvinyl Alcohol Using a RuO2/Ti Anode. Desalination 2003, 155, 49–57. [Google Scholar] [CrossRef]
  42. Huang, K.Y.; Wang, C.T.; Chou, W.L.; Shu, C.M. Removal of Polyvinyl Alcohol in Aqueous Solutions Using an Innovative Paired Photoelectrochemical Oxidative System in a Divided Electrochemical Cell. Int. J. Photoenergy 2015, 2015, 623492. [Google Scholar] [CrossRef]
  43. Deogaonkar, S.C.; Wakode, P.; Rawat, K.P. Electron Beam Irradiation Post Treatment for Degradation of Non Biodegradable Contaminants in Textile Wastewater. Radiat. Phys. Chem. 2019, 165, 108377. [Google Scholar] [CrossRef]
  44. Zhang, S.J.; Yu, H.Q.; Ge, X.W.; Zhu, R.F. Optimization of Radiolytic Degradation of Poly(Vinyl Alcohol). Ind. Eng. Chem. Res. 2005, 44, 1995–2001. [Google Scholar] [CrossRef]
  45. Sun, W.; Tian, J.; Chen, L.; He, S.; Wang, J. Improvement of Biodegradability of PVA-Containing Wastewater by Ionizing Radiation Pre-treatment. Environ. Sci. Pollut. Res. 2012, 19, 3178–3184. [Google Scholar] [CrossRef]
  46. Asheghmoalla, M.; Mehrvar, M. Integrated and Hybrid Processes for the Treatment of Actual Wastewaters Containing Micropollutants: A Review on Recent Advances. Processes 2024, 12, 339. [Google Scholar] [CrossRef]
  47. Dhanke, P.; Wagh, S. Treatment of Vegetable Oil Refinery Wastewater with Biodegradability Index Improvement. Mater. Today Proc. 2020, 27, 181–187. [Google Scholar] [CrossRef]
  48. Ganzenko, O.; Trellu, C.; Oturan, N.; Huguenot, D.; Péchaud, Y.; van Hullebusch, E.D.; Oturan, M.A. Electro-Fenton Treatment of a Complex Pharmaceutical Mixture: Mineralization Efficiency and Biodegradability Enhancement. Chemosphere 2020, 253, 126659. [Google Scholar] [CrossRef] [PubMed]
  49. Phan, L.T.; Schaar, H.; Saracevic, E.; Krampe, J.; Kreuzinger, N. Effect of Ozonation on the Biodegradability of Urban Wastewater Treatment Plant Effluent. Sci. Total Environ. 2022, 812, 152466. [Google Scholar] [CrossRef]
  50. Gharibian, S.; Hazrati, H. Towards Practical Integration of MBR with Electrochemical AOP: Improved Biodegradability of Real Pharmaceutical Wastewater and Fouling Mitigation. Water Res. 2022, 218, 118478. [Google Scholar] [CrossRef]
  51. Ledezma Estrada, A.; Li, Y.Y.; Wang, A. Biodegradability Enhancement of Wastewater Containing Cefalexin by Means of the Electro-Fenton Oxidation Process. J. Hazard. Mater. 2012, 227–228, 41–48. [Google Scholar] [CrossRef]
  52. Ulucan-Altuntas, K.; Ilhan, F. Enhancing Biodegradability of Textile Wastewater by Ozonation Processes: Optimization with Response Surface Methodology. Ozone Sci. Eng. 2018, 40, 465–472. [Google Scholar] [CrossRef]
  53. Martins, R.C.; Rossi, A.F.; Quinta-Ferreira, R.M. Fenton’s Oxidation Process for Phenolic Wastewater Remediation and Biodegradability Enhancement. J. Hazard. Mater. 2010, 180, 716–721. [Google Scholar] [CrossRef] [PubMed]
  54. Yamatsu, A.; Matsumi, R.; Atomi, H.; Imanaka, T. Isolation and Characterization of a Novel Poly(Vinyl Alcohol)-Degrading Bacterium, Sphingopyxis sp. PVA3. Appl. Microbiol. Biotechnol. 2006, 72, 804–811. [Google Scholar] [CrossRef] [PubMed]
  55. Chung, J.; Kim, S.; Choi, K.; Kim, J.O. Degradation of Polyvinyl Alcohol in Textile Waste Water by Microbacterium barkeri KCCM 10507 and Paenibacillus amylolyticus KCCM 10508. Environ. Technol. 2016, 37, 452–458. [Google Scholar] [CrossRef] [PubMed]
  56. Měrková, M.; Julinová, M.; Houser, J.; Růžička, J. An Effect of Salt Concentration and Inoculum Size on Poly(Vinyl Alcohol) Utilization by Two Sphingomonas Strains. J. Polym. Environ. 2018, 26, 2227–2233. [Google Scholar] [CrossRef]
  57. Wei, Y.; Fu, J.; Wu, J.; Jia, X.; Zhou, Y.; Li, C.; Dong, M.; Wang, S.; Zhang, J.; Chen, F. Bioinformatics Analysis and Characterization of Highly Efficient Polyvinyl Alcohol (PVA)- Degrading Enzymes from the Novel PVA Degrader Stenotrophomonas rhizophila QL-P4. Appl. Environ. Microbiol. 2017, 84, e01898-17. [Google Scholar] [CrossRef] [PubMed]
  58. Aldaher, M.; Gengec, E. A Comparative Study among the Technology Classic Fenton and Electro-Fenton for the Degradation of Polyvinyl Alcohol in Textile Industrial Wastewater. J. Water Chem. Technol. 2023, 45, 446–454. [Google Scholar] [CrossRef]
  59. American Public Health Association (APHA). Standard Methods for the Examination of Water and Wastewater, 24th ed.; Lipps, W.C., Braun-Howland, E.B., Baxter, T.E., Eds.; American Water Works Association: Washington, DC, USA, 2022. [Google Scholar]
  60. Young, J.C.; Cowan, R.M. Respirometry for Environmental Science and Engineering; SJ Enterprises: Springdale, AR, USA, 2004. [Google Scholar]
  61. Bioscience Inc. BI-2000 Electrolytic Respirometer User’s Reference Manual and Troubleshooting Guide; Bioscience Inc.: Allentown, PA, USA, 2018. [Google Scholar]
  62. Bezerra, M.A.; Santelli, R.E.; Oliveira, E.P.; Villar, L.S.; Escaleira, L.A. Response Surface Methodology (RSM) as a Tool for Optimization in Analytical Chemistry. Talanta 2008, 76, 965–977. [Google Scholar] [CrossRef] [PubMed]
  63. Montgomery, D.C.; Runner, G.C. Applied Statistics and Probability for Engineering, 6th ed.; Wiley: Hoboken, NJ, USA, 2014. [Google Scholar]
  64. Hoang, N.T.; Mwazighe, F.M. The Various Effects of Hydrogen Phosphate and Bicarbonate in the Degradation of Some Pollutants in the UV/Chlorine and the UV/H2O2 Processes. J. Water Proc. Eng. 2024, 57, 104646. [Google Scholar] [CrossRef]
  65. La Manna, P.; De Carluccio, M.; Iannece, P.; Vigliotta, G.; Proto, A.; Rizzo, L. Chelating Agents Supported Solar Photo-Fenton and Sunlight/H2O2 Processes for Pharmaceuticals Removal and Resistant Pathogens Inactivation in Quaternary Treatment for Urban Wastewater Reuse. J. Hazard. Mater. 2023, 452, 131235. [Google Scholar] [CrossRef]
  66. Mulai, T.; Kumar, J.E.; Kharmawphlang, W.; Sahoo, M.K. Exploring a Substitute for Hydrogen Peroxide in Fenton Process—A Case Study on the COD Removal of Acid Orange 8. Acta Chim. Slov. 2024, 71, 99–109. [Google Scholar] [CrossRef]
  67. Banayan Esfahani, E.; Mohseni, M. Fluence-Based Photo-Reductive Decomposition of PFAS Using Vacuum UV (VUV) Irradiation: Effects of Key Parameters and Decomposition Mechanism. J. Environ. Chem. Eng. 2022, 10, 107050. [Google Scholar] [CrossRef]
  68. Oppenländer, T. Photochemical Purification of Water and Air: Advanced Oxidation Processes (AOPs), 1st ed.; Wiley-VCH: Weinheim, Germany, 2003. [Google Scholar]
  69. Bird, R.B.; Stewart, W.E.; Lightfoot, E.N. Transport Phenomena, 2nd ed.; John Wiley and Sons: New York, NY, USA, 2002. [Google Scholar]
  70. Elyasi, S.; Taghipour, F. Simulation of UV Photoreactor for Degradation of Chemical Contaminants: Model Development and Evaluation. Environ. Sci. Technol. 2010, 44, 2056–2063. [Google Scholar] [CrossRef] [PubMed]
  71. Bolton, J.R.; Cotton, C.A. The Ultraviolet Disinfection Handbook; American Water Works Association: Denver, CO, USA, 2008; ISBN 1583215840. [Google Scholar]
  72. ISO 15522; Water Quality—Determination of the Inhibitory E Ect of Water Constituents on the Growth of Activated Sludge Microorganisms. International Organisation for Standardization: Geneva, Switzerland, 1999.
  73. ISO 11348; Water Quality—Determination of the Inhibitory E Ect of Water Samples on the Light Emission of Vibrio Fischeri (Luminescent Bacteria Test); Part 1: Method Using Freshly Prepared Bacteria; Part 2: Method Using Liquid-Dried Bacteria; Part 3: Method Using Freeze-Dried Bacteria. International Organisation for Standardization: Geneva, Switzerland, 2007.
  74. OECD. Test No. 209: Activated Sludge, Respiration Inhibition Test (Carbon and Ammonium Oxidation), OECD Guidelines for the Testing of Chemicals, Section 2; OECD Publishing: Paris, France, 2010; ISBN 9789264070080. [Google Scholar]
  75. Strotmann, U.; Flores, D.P.; Konrad, O.; Gendig, C. Bacterial Toxicity Testing: Modification and Evaluation of the Luminescent Bacteria Test and the Respiration Inhibition Test. Processes 2020, 8, 1349. [Google Scholar] [CrossRef]
  76. Strotmann, U.; Thouand, G.; Pagga, U.; Gartiser, S.; Heipieper, H.J. Toward the Future of OECD/ISO Biodegradability Testing-New Approaches and Developments. Appl. Microbiol. Biotechnol. 2023, 107, 2073–2095. [Google Scholar] [CrossRef] [PubMed]
Figure 1. Schematic diagram of the lab-scale continuous UV/H2O2 system.
Sustainability 16 07060 g001
Figure 2. Cumulative oxygen uptake (mg/L) by degrading microorganisms over time (h) in low-rate batch respirometry tests for solutions containing different concentrations of PVA compared to a control reference in the presence of activated sludge at 20 °C and in agitated condition.
Sustainability 16 07060 g002
Figure 3. Comparison of observed effluent BOD5/COD with the predicted values by the model.
Sustainability 16 07060 g003
Figure 4. Influence of (a) the PVA feed concentration, (b) the inlet H2O2 concentration, and (c) the PVA feed flow rate on the effluent BOD5/COD, while the other two variables are kept constant at their central design values.
Sustainability 16 07060 g004
Figure 5. Inner dimensions of the photoreactor: E0: UV light incident irradiance adjacent to the lamp (sleeve is neglected); and Er: UV light irradiance adjacent to the photoreactor’s wall at a radial distance of r = 1.25 cm from the UV lamp.
Sustainability 16 07060 g005
Figure 6. Influence of average UV fluence at 254 nm (J/m2) on the effluent BOD5/COD, while PVA feed and inlet H2O2 concentrations were kept constant at 1000 and 585 mg/L, respectively, corresponding to their central design values.
Sustainability 16 07060 g006
Figure 7. Response surface plots of process variables in UV/H2O2 process. Interaction effects of (a) PVA feed and inlet H2O2 concentrations, (b) PVA feed concentration and flow rate, and (c) inlet H2O2 concentration and PVA feed flow rate on the effluent BOD5/COD.
Sustainability 16 07060 g007aSustainability 16 07060 g007b
Table 1. Analyzed COD and BOD5 contents and corresponding BOD5/COD ratios for different concentrations of aqueous PVA solutions.
TrialPVA Concentration
(mg/L)
COD
(mg/L)
B O D 5
(mg/L)
B O D 5 /COD
1500850125.810.15
210001570247.150.16
315002443370.10.15
Table 2. ANOVA results for effluent BOD5/COD prediction for continuous degradation of aqueous PVA in the UV/H2O2 process.
SourceSS adf bMS cF-Valuep-ValueNote
Model11.4591.27242.740.0003Significant
x 1 1.63311.63354.850.0007Significant
x 2 9.053 × 10 2 19.053 × 10 2 3.0420.1416
x 3 1.98011.98066.530.0005Significant
x 1 x 2 5.24415.244176.2<0.0001Significant
x 1 x 3 8.983 × 10 3 18.983 × 10 3 0.30180.6064
x 2 x 3 2.308 × 10 2 12.308 × 10 2 0.77540.4189
x 1 2 0.365910.365912.290.0172Significant
x 2 2 1.76411.76459.270.0006Significant
x 3 2 0.157510.15755.2900.0698
Residual 0.148852.976 × 10 2
Lack of fit0.128234.272 × 10 2 4.1370.2008Not significant
Pure error2.065 × 10 2 21.033 × 10 2
Cor total d11.6014
R2 = 0.9872
Adjusted R2 = 0.9641
Predicted R2 = 0.8192
Adequate precision = 24.87
a sum of squares, b degree of freedom, c mean square, d corrected total sum of squares.
Table 3. Calculated optimum operation conditions with the objective of obtaining an effluent B O D 5 /COD of 0.5 compared to the optimum operating point in [35] with the objective of maximizing TOC removal.
ReferenceOptimization ObjectivePVA Feed
Concentration (mg/L)
Inlet   H 2 O 2
Concentration (mg/L)
PVA Feed Flow Rate (mL/min)Response Result
This study Effluent   B O D 5 /COD = 0.566539059 ± 5% of the prediction
[35]Maximizing TOC removal %66546050 ± 5% of the prediction
Disclaimer/Publisher’s Note: The statements, opinions and data contained in all publications are solely those of the individual author(s) and contributor(s) and not of MDPI and/or the editor(s). MDPI and/or the editor(s) disclaim responsibility for any injury to people or property resulting from any ideas, methods, instructions or products referred to in the content.

