Article

Rural Industry Revitalization Can Be Energized by Land Transfer: A Case Study in Guangxi Zhuang Autonomous Region, China, 2013–2022

1
The Research Base for Humanity Spirit and Social Development of Revolutionary Areas in Guizhou, Yunnan, Guangxi, and Their Border Areas, Baise University, Baise 533000, China
2
College of Agriculture and Food Engineering, Baise University, Baise 533000, China
3
College of Life Sciences and Oceanography, Shenzhen University, Shenzhen 518071, China
4
School of Science and Technology, The Hong Kong Metropolitan University, Ho Man Tin, Kowloon, Hong Kong 999077, China
5
School of Politics and Public Administration, Guangxi Minzu University, Nanning 530006, China
6
Department of Real Estate and Planning, Henley Business School, University of Reading, Reading RG6 6UD, UK
*
Authors to whom correspondence should be addressed.
These authors contributed equally to this work.
Sustainability 2024, 16(16), 6999; https://doi.org/10.3390/su16166999
Submission received: 8 July 2024 / Revised: 6 August 2024 / Accepted: 13 August 2024 / Published: 15 August 2024

Abstract

:
The Chinese government has vigorously promoted the transfer of land use rights, aiming to promote the scale, intensification, and efficiency of agricultural operations and achieve rural industry revitalization (RIR). However, whether and how land transfer energizes RIR remains unclear. Taking five representative cities (Nanning, Guigang, Baise, Fangchenggang, and Guilin) in Guangxi Zhuang Autonomous Region as a case study, we quantificationally characterized RIR during 2013–2022 using eleven variables and land transfer using three difference indices. We evaluated the contribution of land transfer to RIR and compared it among cities. Results showed that all five cities in Guangxi displayed an increasing trend of land transfer and RIR over the last decade. The increase in RIR was largely contributed by the improvement in infrastructure construction and industry convergence, and, to a lesser extent, by the enhancement in agricultural production efficiency. There was a strong city-specific correlation between RIR and the land transfer indices, indicating a beneficial role of land transfer in RIR. Structural equation modeling further indicated that land transfer promoted RIR, likely through facilitating infrastructure construction, enhancing industry convergence, and improving agricultural production efficiency. These results provide strong evidence that the transfer of land use rights can promote RIR and practical reference for advancing farmers’ well-being and the overall goal of rural revitalization in the future. The framework and the methodology proposed here are applicable elsewhere in China and other countries where scattering allocation of land resources represents a key limitation to agricultural production and economic development.

1. Introduction

At present, the Chinese resource distribution under the dual structure of urban and rural areas is extremely unbalanced, and its relative poverty in rural regions is dramatically higher than that in urban places [1,2]. Hence, winning the battle against poverty is China’s top priority in building a moderately prosperous society in an all-round way, particularly in rural areas. It should be certain that evolutionary thoughts and methods are always the unchanging cornerstone of anti-poverty developments. Rural revitalization is the vital key measure for China to solve the issues of “agriculture, countryside, and farmers”; however, as the core content of rural revitalization, rural industry revitalization can function for solving rural economic and social problems [3]. During the celebration of the centenary of the Communist Party of China’s birthday, General Secretary Xi Jinping declared that the strategy of rural revitalization is the basis to achieve higher level and quality development in China. What is the exact significance of rural industry revitalization? First and foremost, rural industry is the main way for farmers to achieve local employment and increase income, and it is also an essential medium to motivate the multiple functional values of agriculture and countryside [4,5]. With the deepening reform in Chinese rural regions, the development of rural industries is apt to move away from grain farming and agriculture, which largely increases the development of farmers’ livelihoods [6,7]. In addition, rural industry revitalization can strengthen rural revitalization [3]. To a certain extent, the revitalization of rural industries is conducive to promoting rural cultural construction and social governance [3]. Nevertheless, in reviewing the literature, we found that with the rapid development and large-scale reform, rural industries suffer various problems simultaneously. Specifically, firstly, small peasant economies still exist, resulting in inefficient agricultural outputs. Secondly, the loss of the rural labor force leads to a lack of endogenous impetus for the development of rural industries. Thirdly, the lack of development of supporting industries, such as the rural service industries, has restricted the upgrading and improvement of the industrial structure [8]. Therefore, we consider that the current society obviously lacks the capacity of exploring innovative representations of rural industries and analyzing what can notably impact the industrial development in rural areas for the nourishment of rural industries and the healthy and sustainable development of farmers’ livelihoods in developing countries.
Land, which is an indispensable source of human society development, can also serve as an important material carrier for fighting against poverty [9]. In China, land in rural areas is under collective ownership and the farmers’ contracted management system. With the reform of the property rights system and land management rights in China, land transfer, as an important aspect of this reform, has been paid more attention because of its key impact on the rural economy, especially on solving the issue of farmer poverty [10]. Land transfer-in involves renting land from someone else to farm, paying rent to the landowner, and raising income by farming additional land. On the contrary, land transfer-out involves renting their own land to farm, charging rent, and allowing farmers to work elsewhere [10]. The Chinese government first raised the conception of rural land transfer rights in the No. 1 Central Document of 1984. After that, the scale of land transfer has remained stable, and gradually elicited a trend of accelerated development with the reinforcing of the rapid influx of external capital and central policy of benefiting farmers [9]. For instance, for facilitating further rural land transfer, the Chinese regional governments encourage the flow of contracted management rights to professional investors, family farms, farmers’ specialized cooperatives, and agricultural enterprises, and eventually form various patterns of large-scale operations [11,12]. As a result, the average growth rate of the land transfer area was around 12.95% from 2006 to 2014 in China. By the end of 2020, the area of national rural land transferred reached 532 million ha, covering 34.08% of the family contracted land area, which can bring great wealth to Chinese local farmers [9,13]. Indeed, using the propensity score matching (PSM) model, Wang and Wang (2022) found that the contribution of participation in rural land transfer to enhancing household income can account for 28.6%, while the household income of non-participating farmers’ families would be 29.9% higher if they participated in land transfer [14]. Thus, it can be seen that rural land transfer possesses great significance, which can be an important decision-making mechanism for farmers to enhance resource allocation efficiency, promote capital mobility, and develop modern agriculture in China [15].
Rural development is closely connected with land management. The plan of rural land use is the key to the realization of the rural revitalization strategy, which is to the benefit of the better implementation of beautiful rural construction and modernization [16]. Indeed, in recent years, we discovered that various scholars focused on the relationships between rural land transfer and other factors of farmers’ livelihoods, such as agricultural income [17], agricultural sustainable development [18], food production [19,20,21], household labor productivity [22], etc. For example, using model analysis of ordinary least square and mediation, Yu et al. (2022) discovered that land transfer-in and social capital can dramatically and directly help to enhance agricultural income; moreover, the behavior of land transfer-in has a positive role in influencing social capital on agricultural income as an indispensable medium in China [17]. Furthermore, using the continuous difference–indifference method, Huo and Chen (2024) found that land transfer can significantly promote the level of agricultural sustainable development based on the panel data from 30 regions in China from 2006 to 2020 [18]. In addition, land transfer in rural areas also has a positive effect on the yield of grain crops by influencing the planting structure of cultivated land and efficiency of technological utilization and management in agricultural process [19,20,21]. Based on field survey data of 1368 farmer households in Shandong in 2019, Cui et al. (2023) reported that land transfer can positively affect the overall labor productivity of farmer households that are involved in land transfer through the analysis of the average treatment effect and propensity score matching [22]. Nevertheless, to the best of our knowledge, how land transfer affects rural industry revitalization in China, particularly the remote minority area, is still paid less attention and remains to be elucidated elaborately.
In the present study, we focused on Guangxi Zhuang Autonomous Region as a case study. Guangxi has a very high proportion of rural population (45.8% in 2020, ranked 5th in the mainland China), and its primary sector has developed very rapidly in recent years (5% in 2022, ranked 6th). To be specific, from the perspective of geographical location and ecological environment, Guangxi is located in the subtropical monsoon climate zone, with complex and diverse terrain, and rich geographical units, such as mountains, hills, plains, and waters, forming a diversified agro-ecological environment, providing suitable growth conditions for a variety of crops and breeding varieties. From the perspective of crop varieties, Guangxi has rich resources of characteristic crops, such as sugar cane, mango, lychee, longan, and other tropical and subtropical fruits, as well as high-quality rice varieties, which is unique in terms of crop diversity and characteristic varieties. From the perspective of the agricultural industrial structure, Guangxi’s agriculture not only covers planting, animal husbandry, and fishery, but also has certain characteristics in forestry, the agricultural product-processing industry, and other fields, forming a more complex and diversified industrial structure system. From the perspective of agricultural resource utilization, due to the particularities of its climate and terrain, Guangxi faces unique challenges and opportunities in water resources management, land use, and agricultural ecological protection, and needs to take targeted measures to achieve sustainable development. Hence, based on the panel data from five typical cities, e.g., Nanning, Baise, Guilin, Guigang, and Fangchenggang, in Guangxi during 2013–2022, we firstly and quantitatively evaluated the influences of land transfer on rural industry revitalization in detail using principal component analysis (PCA), correlation analysis, and partial least squares structural equation modeling (PLS-SEM) in these five rural regions, which would be the innovation of this work. The meaningful hypothesis is that through the activation of land transfer in Guangxi region, the rural land can be effectively organized, the land utilization rate can be improved, and the integrated development of rural industries can be promoted, thereby promoting the rural industry revitalization. Since the present study area of Guangxi is a relatively smaller-scaled region, we considered that the results of this work cannot explain the overall relationships between land transfer and rural industry revitalization, which is the main limitation of this case study. However, we still cordially hope that this study, as a typical case, can provide theoretical references for advancing farmers’ well-being, rural economic development, and the overall goal of rural revitalization in the future.

2. Materials and Methods
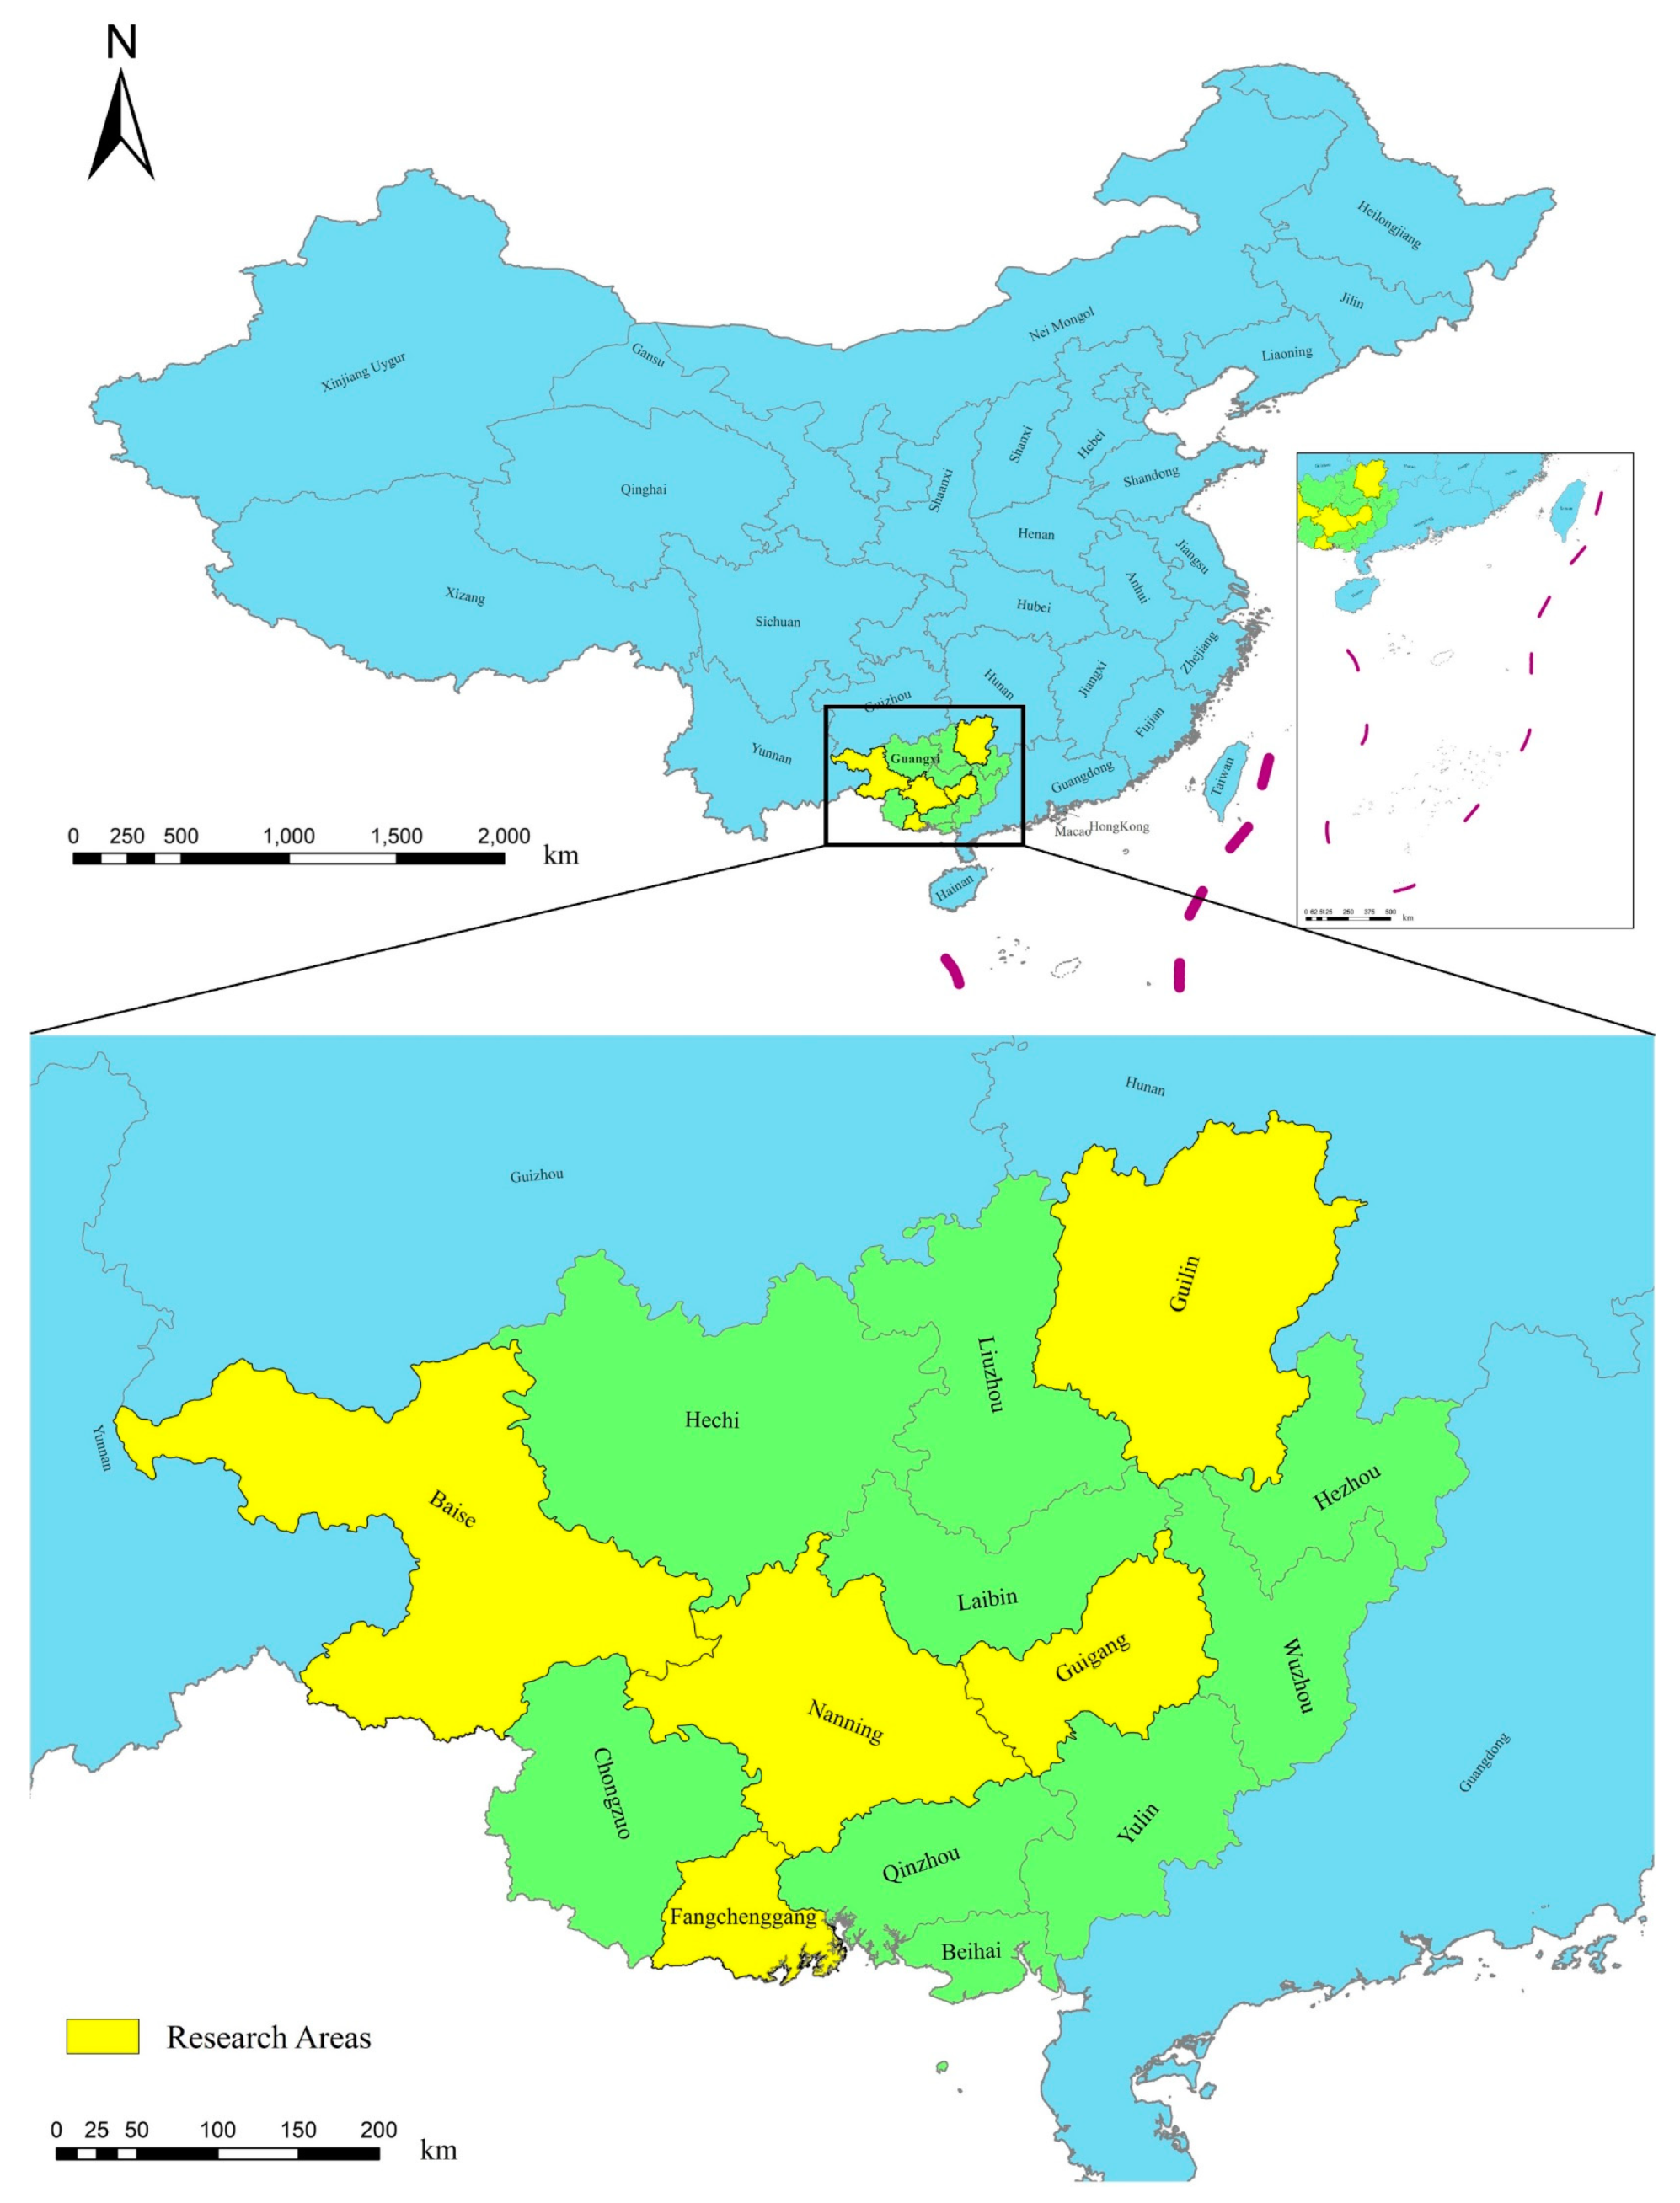
2.1. Study Area

Guangxi is economically divided into five regions, namely, the east, west, southern, northern, and central regions, each with its own competitive industries (Figure 1). The central region, where the provincial capital Nanning (NN) is located, prioritizes light industrials. The east region is next to Guangdong and Hunan, the two provinces more economically developed than Guangxi, and with its convenient transportation, developed an export-oriented economy. Modern agriculture thrives here, with many township and village enterprises involved. The hilly west region is a major agricultural region in Guangxi, and is, therefore, competitive in farming, livestock breeding, and mining. The southern region is bounded by Beibu Gulf (Gulf of Tonkin) and thus serves as an important convenient gateway for the hinterland of China to enter ASEAN. This is exemplified by Fangchenggang (FCG), the largest port in western China, which attracts a group of Fortune 500 companies to do business there and expands processing trade very rapidly. By contrast, the northern region is world famous for its stunning karst landscapes. According to Guilin Municipal Administration of Culture and Tourism, Guilin (GL) attracted approximately 140 million tourists in 2023. Therefore, tourism and agriculture contribute greatly to GDP in the northern region. Considering these essential differences between the five regions, this study focused on the following cities as representatives for each region: Guigang (GG, east region), FCG (southern region), Baise (BS, west region), GL (northern region), and NN (central region). Basic information for each selected city is provided in Table 1.

2.2. Index System Construction

Previous studies differ substantially in the index to measure the development level of rural industry revitalization [23,24,25]. Combining with previous studies and considering the data availability, we comprehensively evaluated the development level of rural industry revitalization (RIR) by establishing a new index system. Specifically, we considered eleven variables that capture the infrastructures and production efficiency for the primary sector and industry convergence, as listed in Table 2. Irrigation, machinery usage, and electric power are basic infrastructures that facilitate agricultural production [26,27,28,29]. Here, they are represented using agricultural fiscal expenditures (AFE), effective irrigation area (EIA), total power of farm machinery (TPFM), and electric power consumption (EPC), respectively. For the production efficiency, we considered the grain yield per unit area (GYA), timber harvests (TH), garden fruit output (GFO), and growth rate of the value added of the primary sector (GRVP) [30,31]. With the land transferred, rural residents can start up rural tourism resorts (RTR) to attract visitors and thereby increase their incomes [32]. Thus, we used the proportion of the service industries that are related to primary industries (PSI), the number of RTR, and retail sales of rural consumer goods (RS) to reflect the industry convergence [32,33,34]. The land transfer was quantified using transferred land per capita (TL), proportion of the transferred land (PTL), and the number of farmer cooperatives (FC) [32,35].

2.3. Data Sources

The People’s Government of Guangxi Zhuang Autonomous Region has issued a series of policies and measures to promote land transfer since the early 2010s. Considering that part of the data for the early 2010s were inaccessible, this study focused on data spanning from 2013 to 2022. The data of the eleven variables at the city level during 2013–2022 were mostly drawn from the Statistical Yearbook and statistical communiqué on the national economic and social development of China, Guangxi, and the studied cities. Parts of the data were derived from the Department of Agriculture and Rural Affairs and the Bureau of Statistics of Guangxi Zhuang Autonomous Region, as well as those of each studied city.

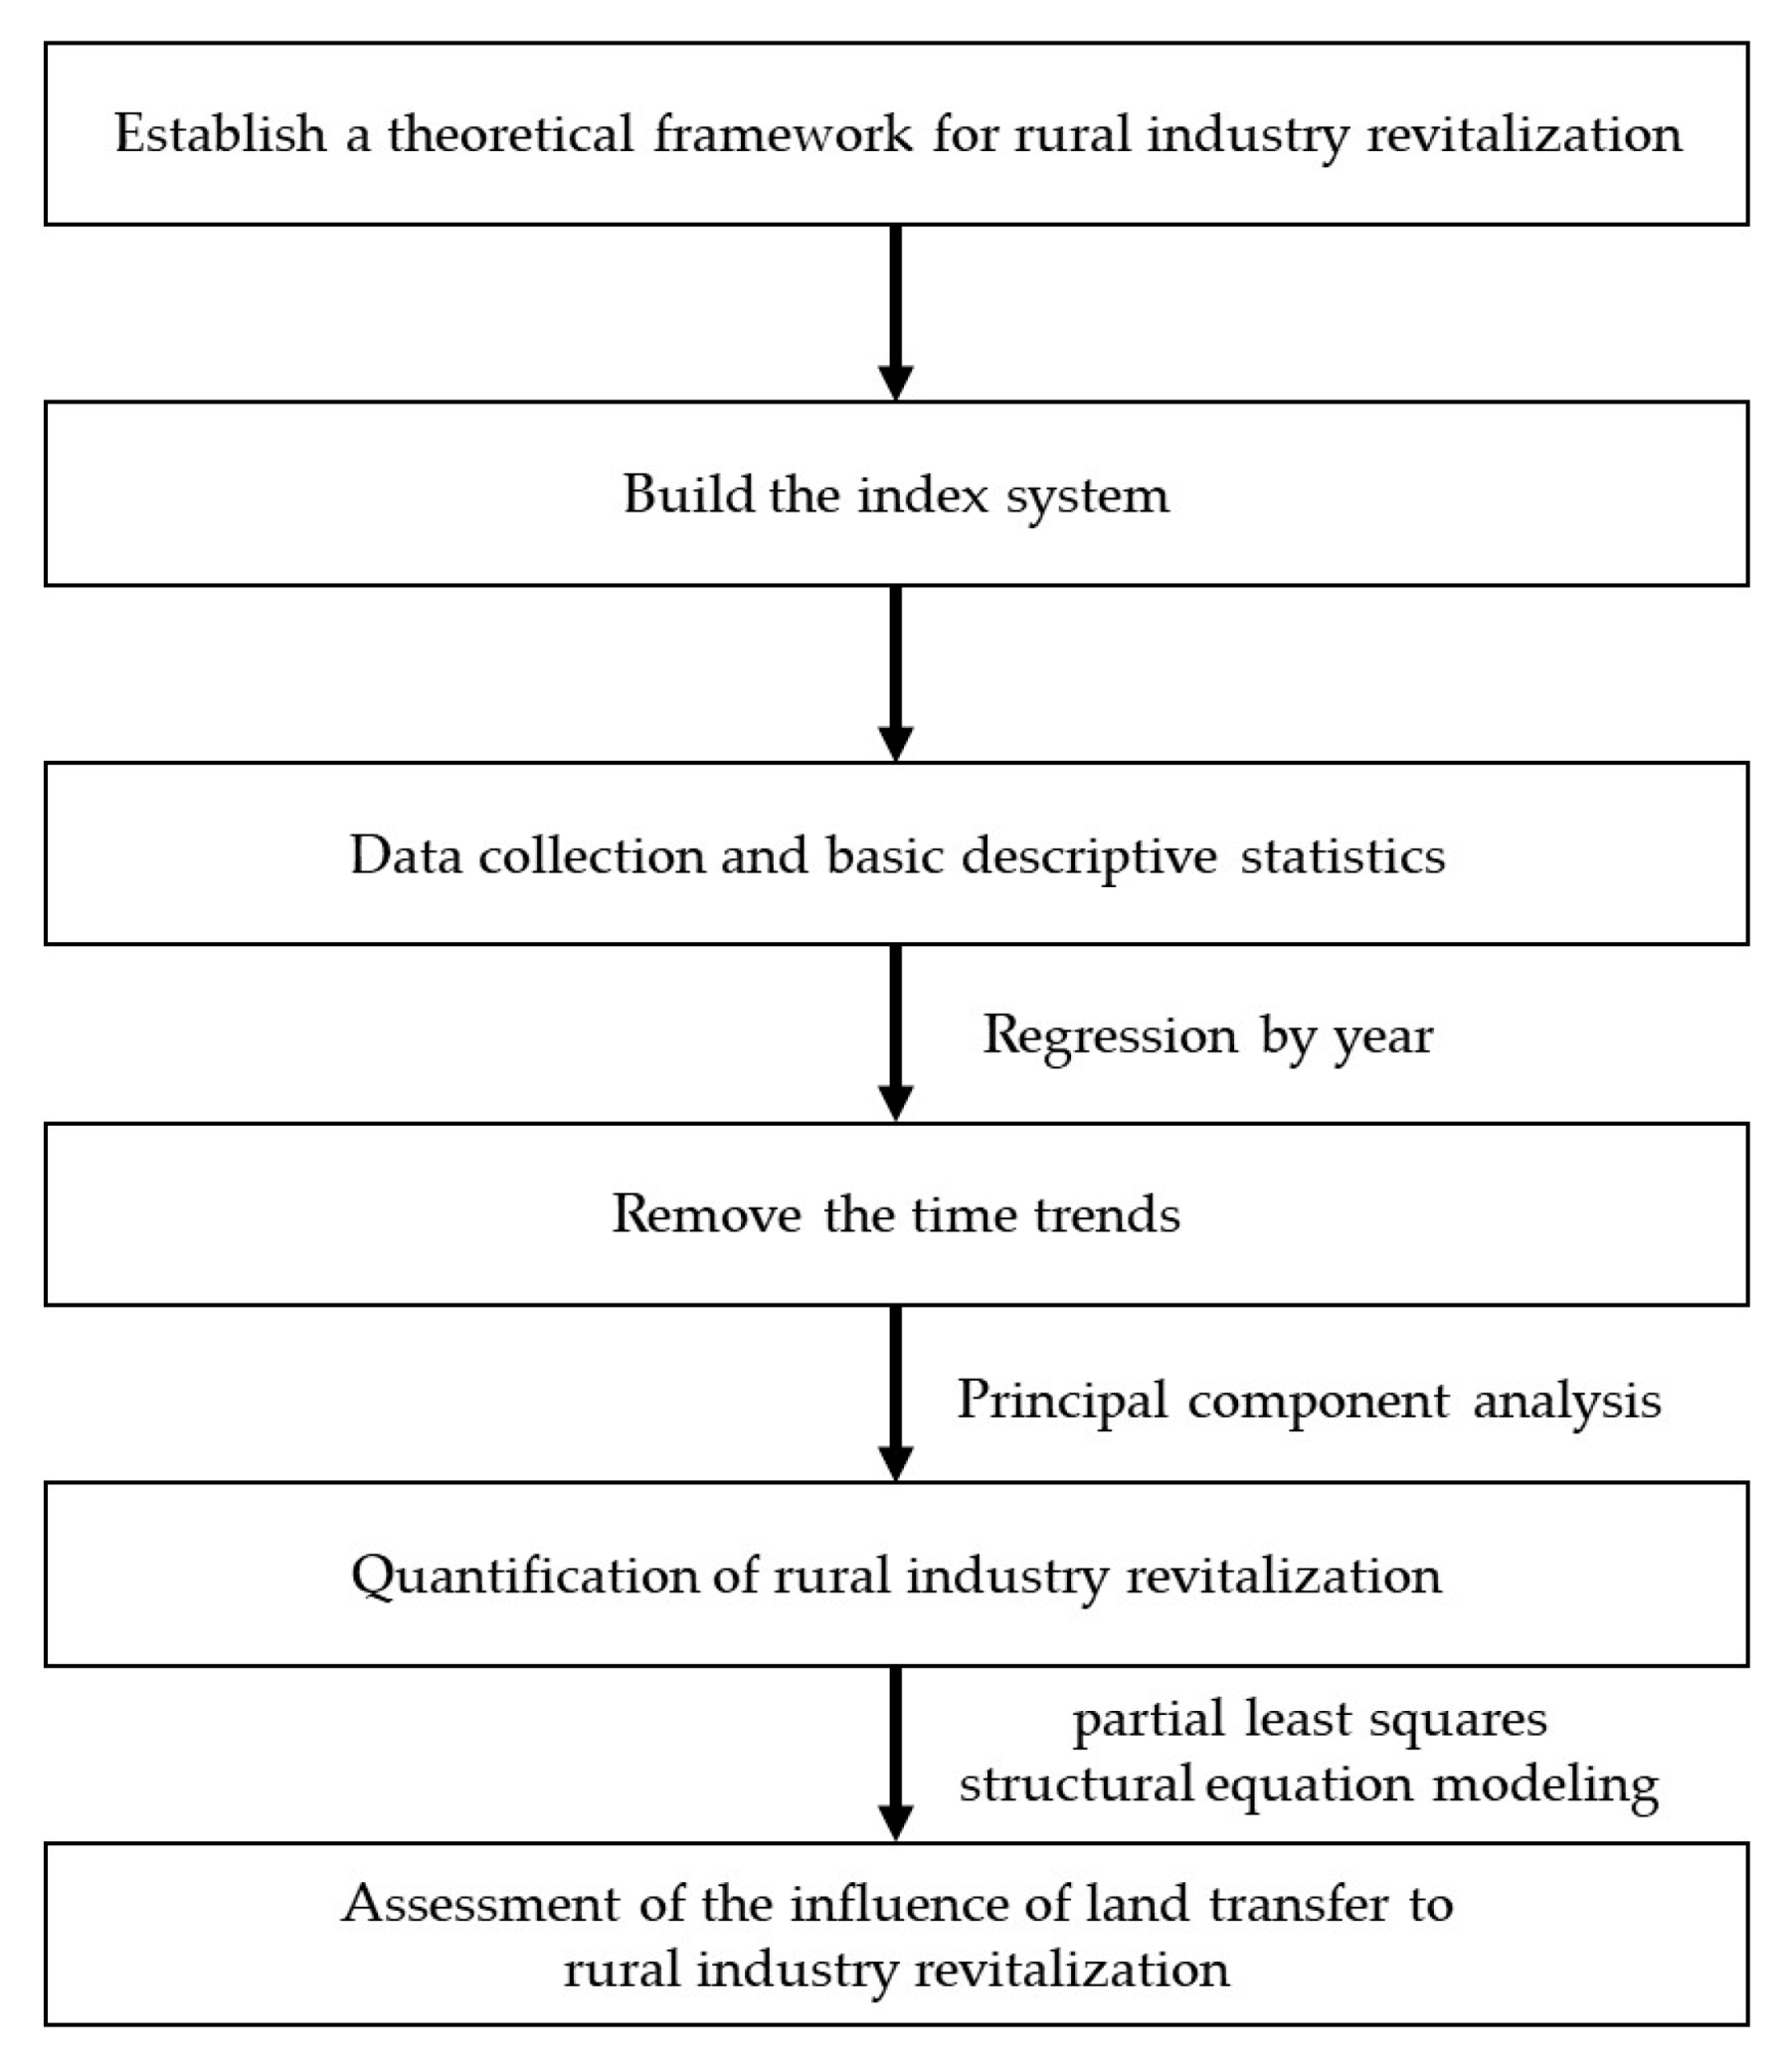
2.4. Statistical Analysis

We used principal component analysis (PCA) to reduce the dimensionality of our dataset and to condense the eleven variables into RIR. Since we aimed to perform a comparison among all five cities, the PCA was applied to the global dataset that merged the data for each of the five cities. Before extraction of the principal components, we standardized the eleven variables for the five cities during 2013–2022. Four principal components with an eigenvalue larger than 1 were extracted. The cumulative contribution of variance of the four principal components was 79.9%. The factor loading of each variable on the four principal components is shown in Figure 2. The first principal component was primarily contributed by EIA, TPFM, and RS, while the second principal component was primarily driven by EPC. The factor loadings were used to compute the score value of each principal component, as follows:
S j = i = 1 11 λ i j X i
where Sj is the score value of the jth principal component, λij is the factor loading of the variable i on the jth principal component, and Xi is the standardized value of the variable i. Then, RIR, specific for each city–year combination, was determined as:
R I R = j = 1 X α j S j j = 1 X α j
where αj is the variance contribution of the jth principal component.
We also employed Pearson’s correlation coefficient to examine the relationship between the variables used to evaluate RIR and those to indicate the land transfer. To distinguish the city-specific contribution of land transfer indices to RIR, we employed a fixed-effects model:
RIR = β0 + β1X + β2Y + μ
where β0, β1, and β2 are the city-specific intercept and slope, X is land transfer indices, Y is the time, and μ is the residual.
PLS-SEM is a statistical analysis technique suitable for small-sized multivariate datasets. It employs non-parametric estimation methods and requires no assumption that the data follow a multivariate normal distribution. Thus, it is widely used in economic and social research. Here, we adopted PLS-SEM to model the full set of variables. We first built a SEM model with all fourteen variables (eleven RIR variables and three land transfer indices). We specified the eleven RIR variables and three land transfer indices as the observed variables, and infrastructures, production efficiency, and industry convergence as the latent variables. All variables were standardized before running the model. Then, we adjusted the model by adopting 0.7 as the critical value of loading factor, which is a common practice for PLS-SEM [36]. That is, we omitted the variables when (a) the factor loading was less than 0.7, or (b) the cross-loading was less than that of the latent variables from other groups. After omission, the goodness of fit for the model was 0.786, compared to 0.632 when no variables were omitted. Thus, we reported the model that has been adjusted.
The flow chart of this study is shown in Figure 3.

3. Results

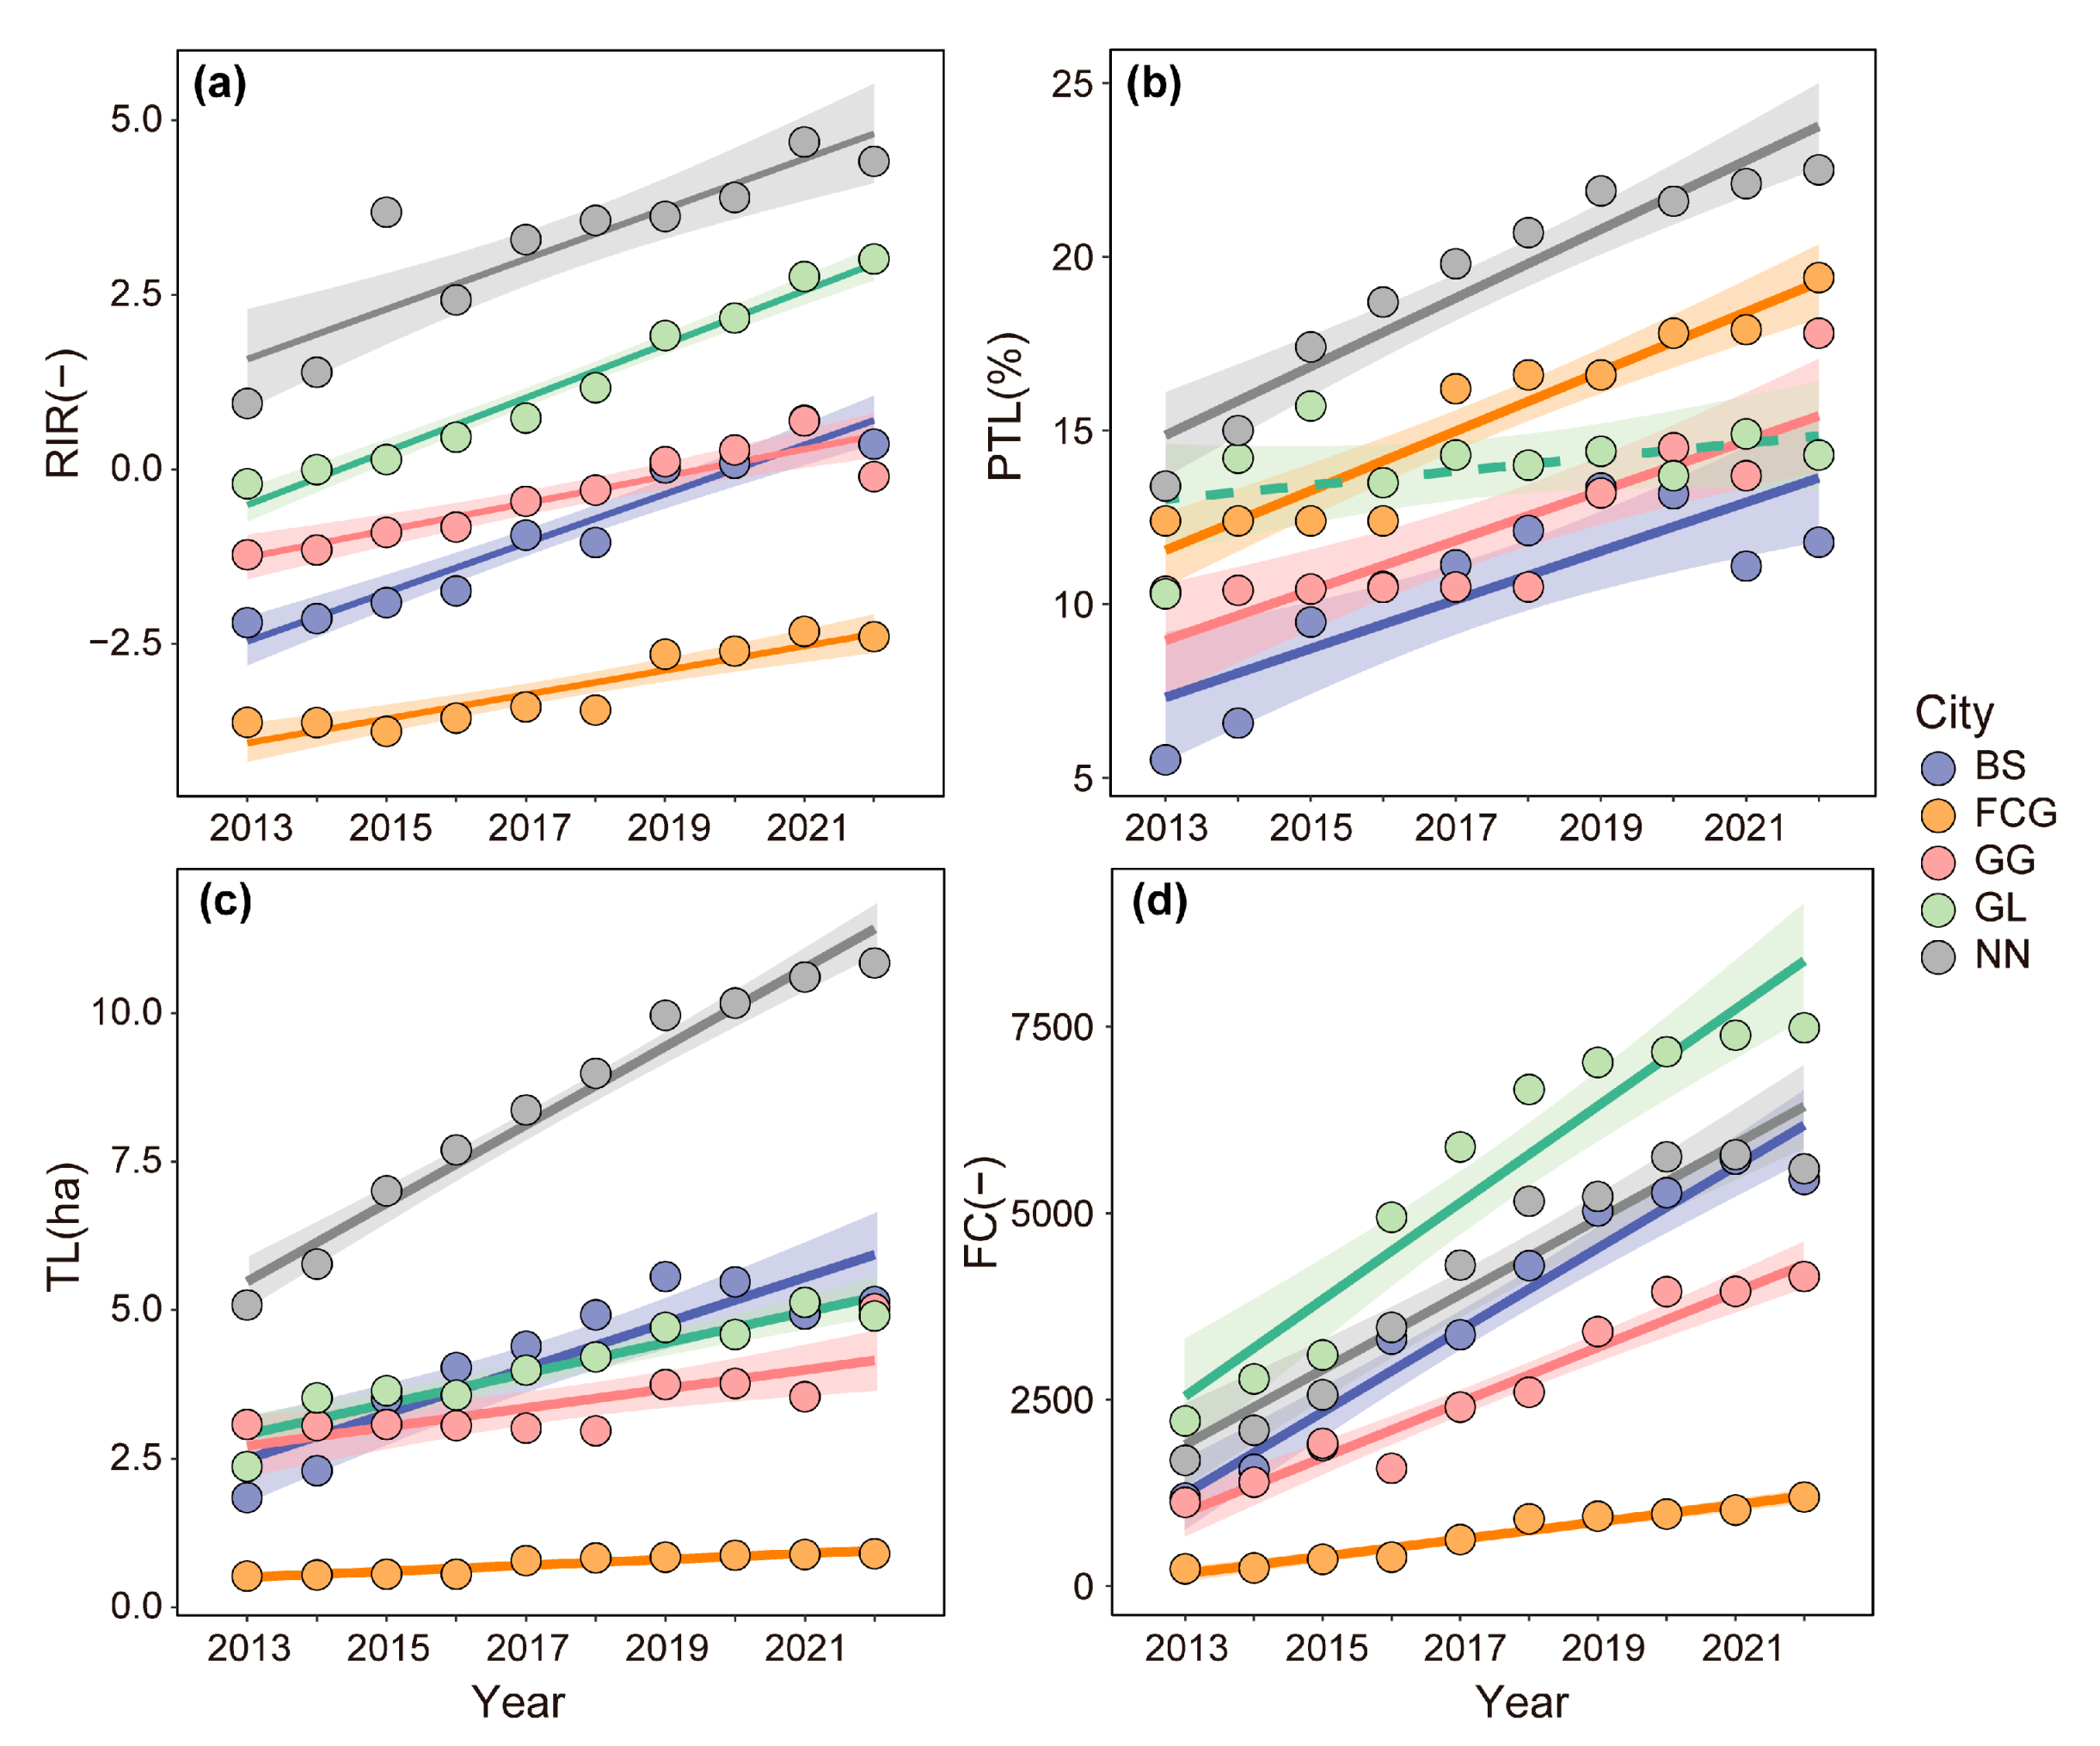
3.1. The Inter-Annual Trend of RIR and Land Transfer for the Five Cities

Figure 4a shows the annual increases in RIR during 2013–2022 for the five cities. The fastest increase in RIR was observed for GL (from −0.21 to 3.01), whereas the slowest increase was observed for FCG (from −3.62 to −2.40). The RIR for FCG in 2022 was still very low—it was even lower than that for BS in 2013. Prominent differences in the inter-annual trend of the three land transfer indices between cities were also detected (Figure 4b–d). Except for GL, which lacked a significant annual increasing trend of PTL, the other four cities were basically similar in their rate of increase in PTL. The fastest increase in TL was observed for NN, whereas the fastest increase in FC was observed for GL. By contrast, the slowest increase in both TL and FC was again observed for FCG. This hints at the possibility that the slow increases in RIR for FCG may be associated with that in TL and FC.

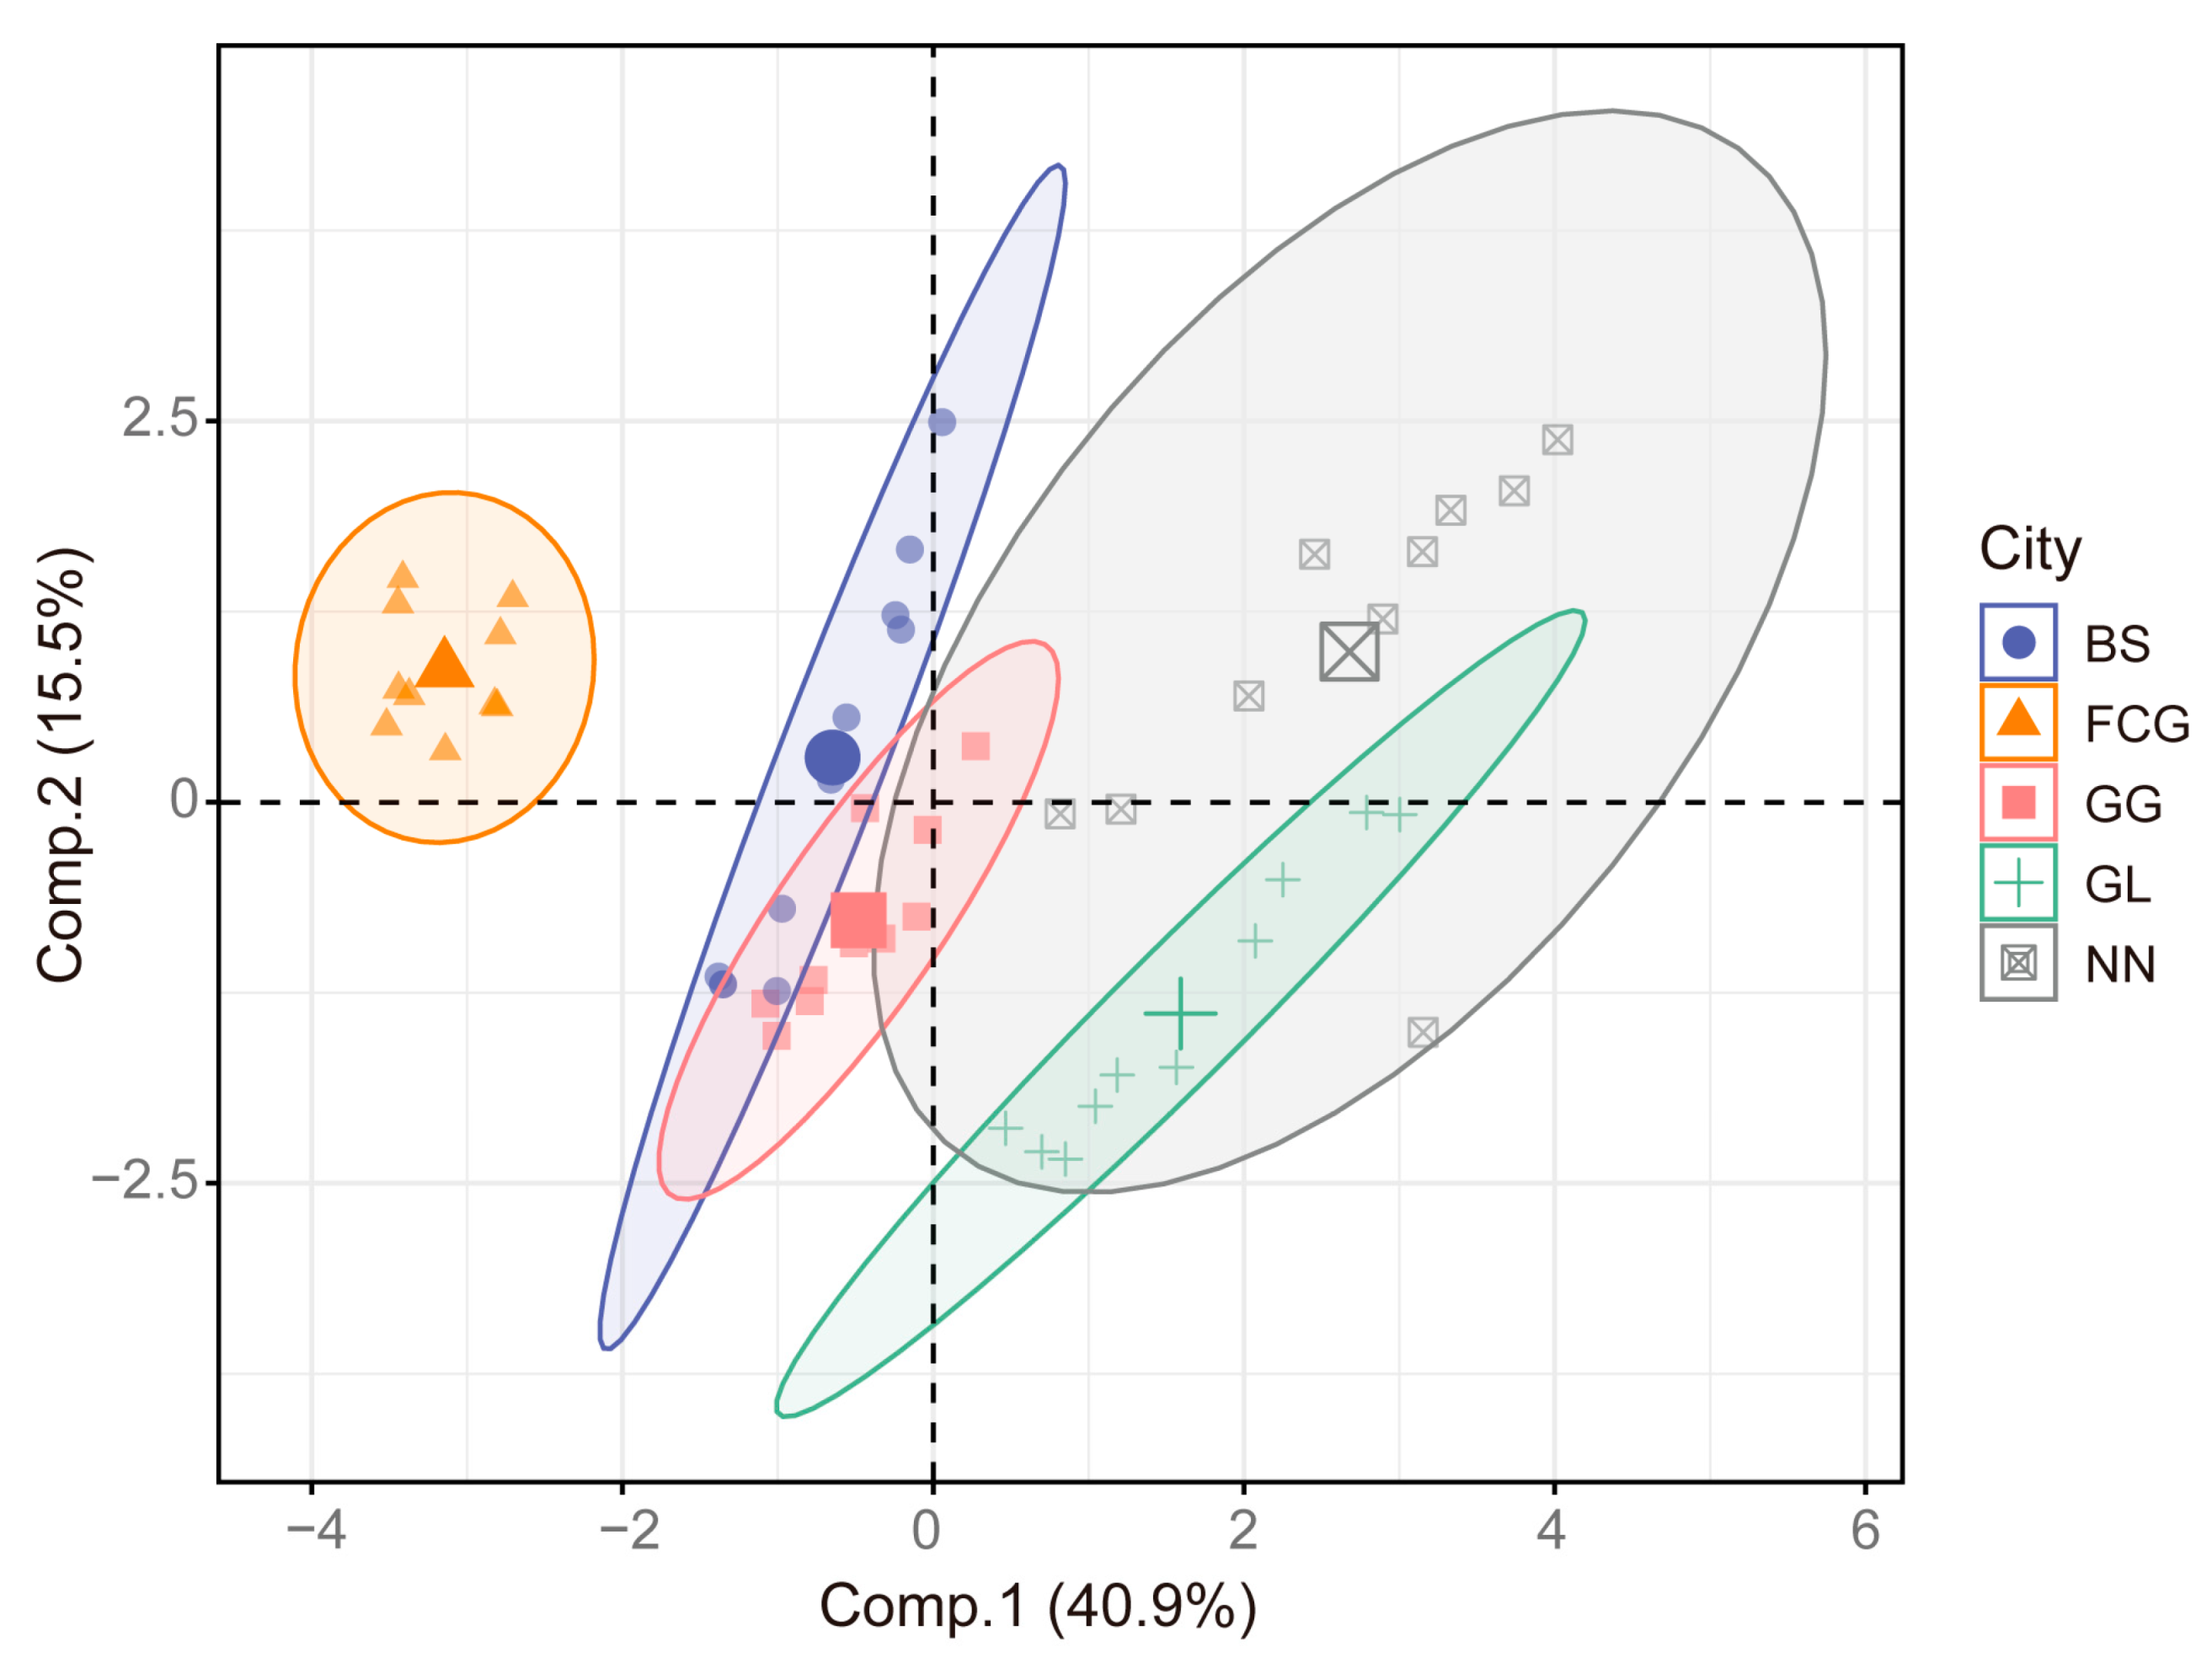
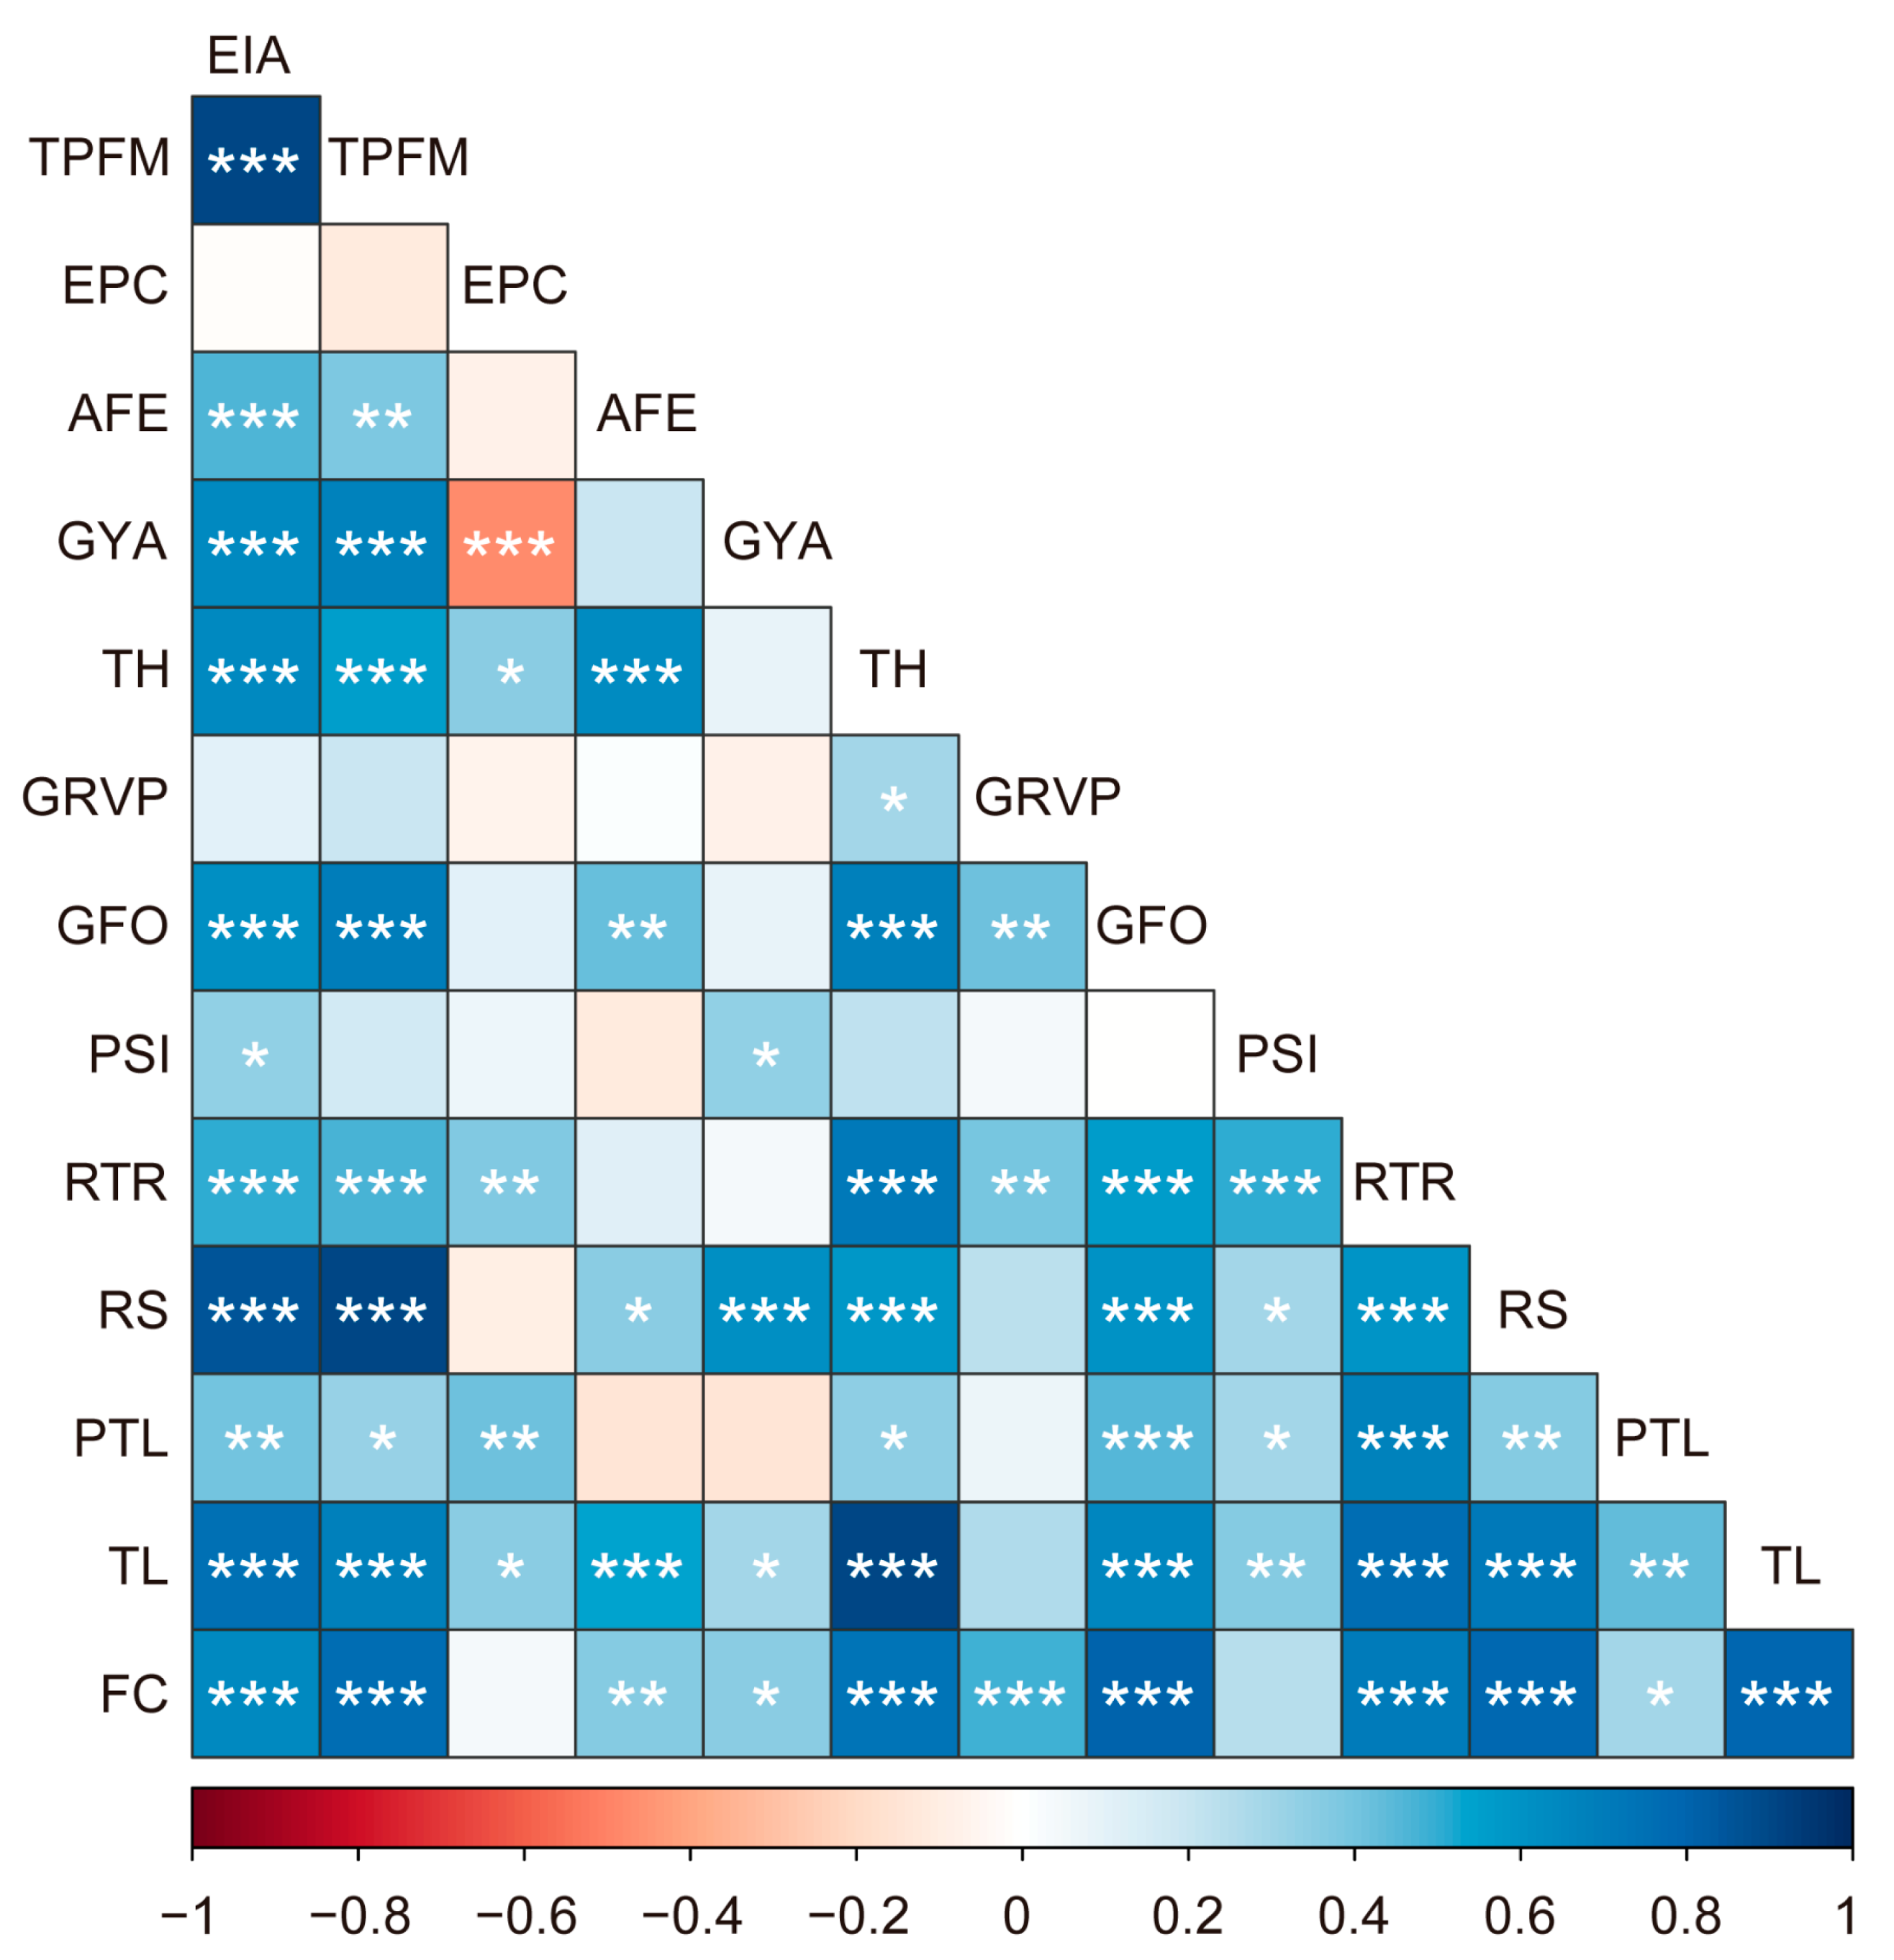
3.2. The Driving Forces of RIR

To explain the differences in the rate of increase in RIR among different cities, we used PCA to identify the driving forces of RIR for each city. Figure 5 shows the projection of points specific for each city–year combination. There seemed to be no clear pattern in the variations in score value for FCG, as the triangles were bounded within a small ellipse. This is because FCG developed relatively slowly in terms of the variables that had large contributions to the first and the second principal components (see Figure 2), compared to the other four cities. Except for FCG, the other four cities were distributed along inclined lines, with one end extending to the region with high score values of both the first and second principal components. This result suggests a divergence in the driving forces of RIR between cities. Annual increases in both infrastructures and industry convergence drove the annual increase in RIR for the cities, other than FCG. By contrast, the increase in infrastructures and industry was moderate and contributed evenly to the inter-annual variability in RIR for FCG.

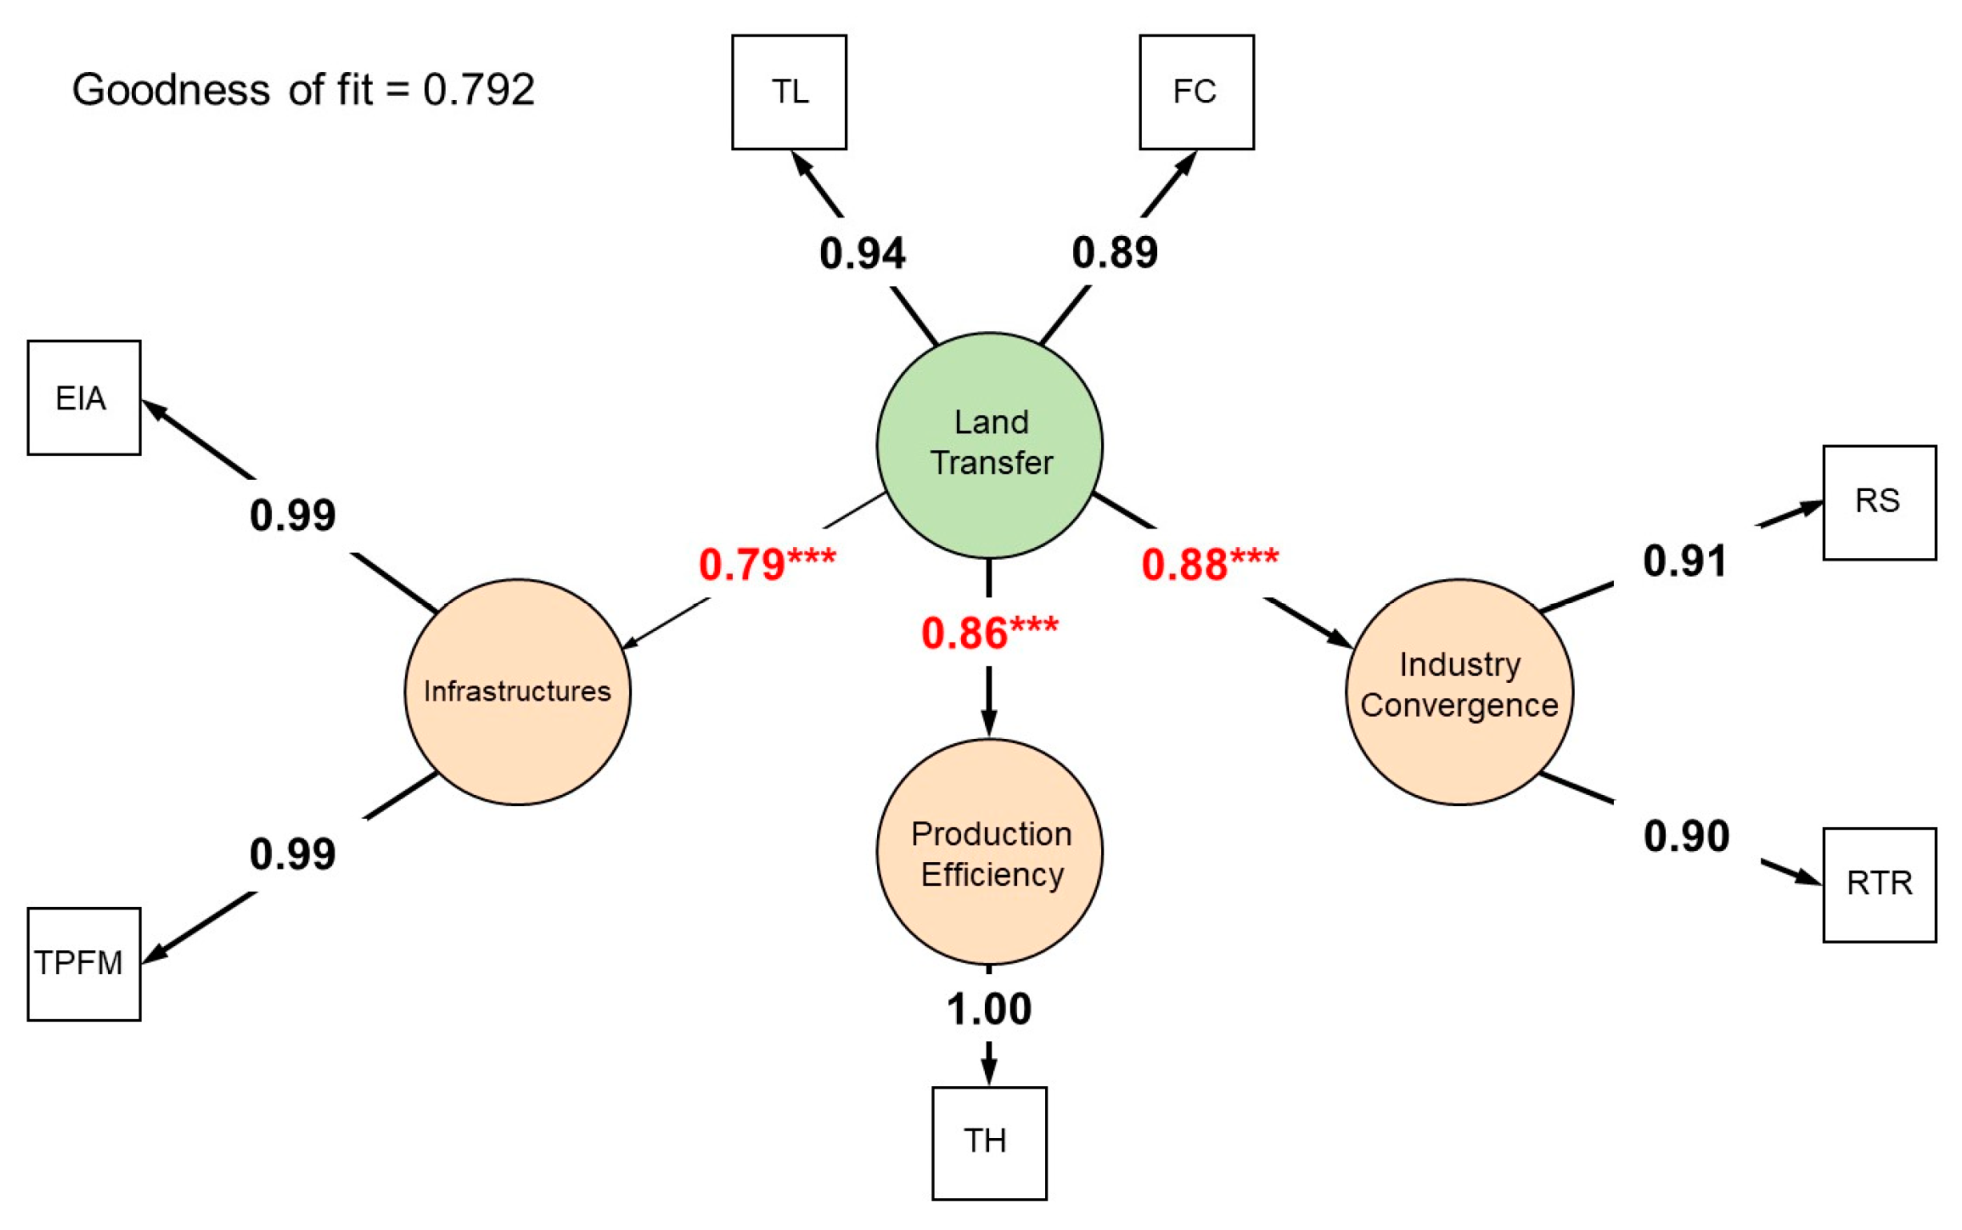
3.3. The Relationship between Land Transfer and RIR

The correlation between RIR and the three land transfer indices is shown in Figure 6. Clearly, RIR was significantly (p < 0.05) correlated with the three indices for each of the five cities, suggesting that land transfer did contribute to rural industry revitalization in Guangxi. Again, we detected differential effects of land transfer on RIR between cities. The correlation between PTL and RIR was statistically insignificant (p > 0.05) for GL. While RIR for GL steadily increased year by year, PTL rapidly increased and reached a peak in 2015, then it slightly decreased and fluctuated around a steady level. This caused a decoupled relationship between PTL and RIR in GL. With a unit increase in PTL, RIR increased faster in NN and BS than in FCG and GG. Large differences existed in the response of RIR to the unit increase in TL and FC between cities. In both cases, the increase was remarkably faster for FCG than for the other four cities. This may be, in part, ascribed to the very low level of TL and FC for FCG. An increase in TL hardly promoted RIR for GG. The response of RIR to an increase in FC was roughly similar between the other four cities.
We proceeded to address how land transfer promoted RIR by testing the correlation between the three land transfer indices and the indices for RIR construction (Figure 7). Across cities, PTL strongly correlated with infrastructures indices (EIA, TPFM, and EPC) and industry convergence indices (PSI, RTR, and RS). PTL had little influence on production efficiency indices, except for TH. By contrast, TL and FC strongly correlated with almost all RIR indices. Recalling that EIA, TPFM, and RS contributed the most to the first principal component of RIR (Figure 2), we may infer that an increase in TL and FC promotes RIR primarily through improved infrastructures and enhanced industry convergence.
Our PLS-SEM model is shown in Figure 8. The internal consistency reliability indicated using composite reliability for each group within the PLS-SEM exceeded 0.7, suggesting that the current model well captured the interrelations between the variables. The latent variables had a very high R2. For example, R2 for production efficiency and industry convergence was 0.85 and 0.77, respectively. Our model indicated that exogenous variables, such as land transfer, imposed significant influences on the endogenous variables. We also employed 0.8 as an alternative critical value when building the PLE-SEM. Yet, the new model (Figure A1) basically agreed with the original model, with 0.7 as the critical value, except for slight differences in the coefficients.

4. Discussion

4.1. Both RIR and Land Transfer Are Closely Bound Up with the National Favorable Treatments to Farmers

There is no doubt that national policies to strengthen agriculture and benefit farmers are the single most important economic benchmark for rural economic development [11,12]. For instance, on one hand, with the constant modification, supplementation, and improvement of the land transfer policy in China, its scale has boosted rapidly [18]. On the other hand, Chinese General Secretary Xi Jinping considered that the strategy of rural revitalization is the foundation for China to achieve high-quality and high-level development [3]. In the present study, we firstly verified that in remote southwest ethnic areas, such as Guangxi, China, both RIR and land transfer also elicited obviously steady improvements over time, which are consistent with the positive effects of national policies on farmers’ benefits (Figure 4). Similarly, using some mathematical calculation models, Zhu et al. (2022) predicted that the agricultural land, construction land, and level of human settlements (named as a standardized index for rural revitalization) in some villages of northwest minority areas in China would notably increase by 2035, compared with 2020 [23]. Moreover, we also found that the levels of RIR and land transfer showed obvious regional differences in our five research cities in Guangxi, China (Figure 4). For example, the highest levels of RIR and land transfer appeared in NN, while the lowest ones were exhibited in FCG, indicating that the economic development is unbalanced among villages in different cities in Guangxi. Indeed, Yin et al. (2022) reported that due to the unique natural geographical environment, socioeconomic development background, and rural revitalization policy orientation in different regions of China, there are great differences in the implementation of land consolidation [37]. Not only that, but we considered that the basal levels of economic development in different regions determine the ceilings of RIR and land transfer.

4.2. The Mechanism and Analysis of Positive Effects of Land Transfer on RIR from the Target Five Cities in Guangxi

In terms of the potential influences of land transfer on RIR, we first found that the driving forces of RIR varied with diverse cities using PCA (Figure 5). The level of RIR in FCG was far from that in BS, GG, NN, and GL, indicating that its RIR level fell further behind the other four cities combining the specific data (Figure 5). In addition, the FCG value of the primary axis was the lowest of all the cities, suggesting that its levels of EIA, RS, and TPFM should be strengthened in future due to their huge interpretations for the primary axis in PCA (Table 2; Figure 5). Indeed, also by means of PCA, Li et al. (2021) reported that the level of comprehensive strength of economic growth in FCG was lower than other cities in Guangxi; however, its overall status of residents’ living standards was relatively better, whose result was similar to our present study [38]. In addition, we discovered that the positive influences of land transfer on RIR existed in all five target cities in Guangxi, China, regardless of FCG, which had the lowest development level of RIR (Figure 6, Figure 7 and Figure 8). What is the specific influencing mechanism based on the present case results? In previous studies, scholars considered that TL and PTL could combine with the levels of infrastructure and industry convergence; meanwhile, FC could stand for the level of production efficiency [32,33,34,35]. Specifically, when TL and PTL increase, some economic entities with the nature of services, such as agritainments and village resorts, boost rapidly, which induces the reinforcement of infrastructure and industry convergence. Furthermore, while the number of FC enhances, the per unit output of peasant business, e.g., selling agricultural products and harvesting, consequently increases, which can facilitate the level of production efficiency. Hence, TL, PTL, and FC, all of which stand for land transfer, together can promote the level of RIR. Huo and Chen (2024) set up a new measurement index for agricultural sustainable development based on 30 regions’ data in China from 2006 to 2020 and found that the land transfer significantly promoted Chinese agriculture, which could verify our present results [18]. In addition, the empirical evidence from Shandong Province proved that land transfer could significantly promote the overall level of farmer household labor productivity and improve the reform and high-quality development of farm business, eventually having an indirectly positive effect on RIR [22]. Another previous study concluded that land transfer is a vital platform and leverage to promote RIR, which can specifically enhance the area of effective cultivated land, facilitate the quality of cultivated land, raise the efficiency of land resource use, optimize the structure and distribution of land use, and promote large-scale management and the development of modern agriculture and rural tourism, which is also in keeping with the results from our present empirical study [39].
Apart from the above mechanism of the positive effects of land transfer on RIR from this present case study, we also concluded its specific internal theoretical mechanism based on literature support. To be specific, from the perspective of industrial convergence theory, it emphasizes that different industries form new industrial forms and business models through mutual penetration, crossover, and reorganization, so as to achieve optimal allocation of resources, industrial innovation, and economic growth. In the process of urban and rural integration development in our country, we need to promote the integration of urban and rural land through the reform of the land system. Land transfer can break the barriers of factor flow, facilitate the flow of urban capital, talent, information, technology, and management means to rural areas, and is an effective means to promote the comprehensive revitalization of rural areas and build a new pattern of mutual promotion and development of urban and rural industrial economy [40,41]. From the perspective of economies of scale theory, with the expansion of the production scale, the cost per unit of product will gradually decrease. The theory of economies of scale is often used in the research of land use problems and is used to analyze the impact on agricultural production. To realize agricultural modernization, China must promote land transfer and achieve large-scale management [42]. Land transfer leads to scattered land concentrated in the hands of a small number of business entities, to achieve large-scale land management, so that large-scale agricultural machinery and equipment can be concentrated to achieve mechanization, automation, and intelligence of agricultural production, reduce labor costs, and improve agricultural production efficiency. At the same time, the realization of economies of scale is conducive to the implementation of agricultural supply reform and can effectively increase farmers’ income, which is an important prerequisite for the revitalization of rural industries.

4.3. Sustainable Development Recommendations of RIR and Land Transfer for the Five Target Cities in Guangxi

Combining our present results and previous related research, we propose some sustainable development recommendations of RIR and land transfer in Guangxi, as follows: (1) As for our empirical data, we recommend that local government needs to attach more importance to the relationship between RIR and land transfer, strengthen the constructions of RIR and land transfer of backward areas, such as FCG and BS, and make sure that the economic development in all regions is well balanced. Eliminating poverty and narrowing the income gap is an important part of ensuring and improving people’s livelihood in an all-round way [43]. (2) Maximizing and acknowledging the main body status of farmers. Peasants are the main performers and, meanwhile, they also act as the most direct stakeholders of land transfer action [44]. Local governments should expand employment channels for farmers, increase their income from labor and assets, promote the economical and intensive use of rural construction land, provide space and carriers for rural development, improve rural infrastructure and public services, improve the living conditions and lifestyles of villagers, and improve the quality of rural living environments. Only under these conditions can the government trigger the enthusiasm of farmers to participate, reshape the main responsibility of farmers, and make innovations in the rural governance mechanism of “joint consultation and collective action” [45]. (3) The local government can also encourage the development of land business entities, such as agritainments, village resorts, and farmer cooperatives, and improve the level of operation and competitiveness of land business entities through financial support and tax incentives. Further, it should set up and promote the land transfer contract system to protect farmers’ land contract rights, transfer rights, and income rights, prevent improper or unreasonable profit distribution in land transfer, and safeguard farmers’ legitimate rights and interests [18]. As long as we can precisely control the relationship between farmers and land and the key elements of land transfer, such as TL, PTL, and FC, RIR will be developed efficiently and sustainably.

5. Conclusions

Taking Guangxi as an example, this study constructed an index system of rural industry revitalization. By integrating the eleven variables to indicate RIR, we explored the association between RIR and land transfer. We detected an increasing trend of land transfer and RIR over the last decade for each of the five cities. The increase in RIR was largely contributed by the improvement in infrastructure construction and industry convergence, and to a lesser extent by the enhancement in agricultural production efficiency. Our analysis further revealed a close relationship between land transfer and RIR, which differed in efficiency between cities. This finding provides evidence for the positive influence of land transfer on RIR. With the PLS-SEM, we further probed the possible pathways through which land transfer promotes RIR and distinguished the differences between the five cities. Our results indicated that land transfer likely promoted RIR primarily through improved infrastructures and enhanced industry convergence. Our study provides policymakers with theoretical references for advancing farmers’ well-being, rural economic development, and the overall goal of rural revitalization in the future.
We believe that the framework and the methodology are applicable to some other regions with similar economic structures and development paths, where scattering allocation of land resources represents a key limitation to agricultural production and economic development. However, it should be emphasized that our study focused only on five typical cities in Southwest China. Considering the wide differences in resource endowments and economic and social development between cities, either in or out of China, the index system may be re-organized on a case-by-case basis. To reveal a relationship between land transfer and RIR, future studies need to develop a more comprehensive index system and expand the study scope by considering a larger study area.

Author Contributions

Y.Y., T.L., L.S. and Z.W. conceived of the original research project and selected methods; M.P., Q.D., Y.L., Y.H. and X.L. collected the data; L.S. and Z.W. supervised the work and provided technical assistance to Y.Y., T.L., M.P., Q.D., Y.L., Y.H. and X.L.; Y.Y. and T.L. wrote the article; L.S. and Z.W. refined the project and revised the writing. All authors have read and agreed to the published version of the manuscript.

Funding

This research was jointly supported by the National Social Science Fund Project: Exploring an Innovative Model for Integrated Social Governance in Border Ethnic Regions: Balancing Security and Development (21XZZ006), the Key Research Base of Humanities and Social Sciences of Universities in Guangxi Zhuang Autonomous Region, “The Research Base for Humanity Spirit and Social Development of Revolutionary Areas in Guizhou, Yunnan, Guangxi, and Their Border Areas”, the Guangxi First-Class Disciplines (Agricultural Resources and Environment, BSUFCD-KF202402), and the National Natural Science Foundation of China (32101367).

Institutional Review Board Statement

Not applicable.

Informed Consent Statement

Not applicable.

Data Availability Statement

Data are contained within the article.

Conflicts of Interest

The authors declare no conflicts of interest.

Appendix A

Table A1. The goodness of fit for the regression between the index and year for the five cities.
AbbreviationRIRPTLTLFC
R2R2R2R2
BS0.933 ***0.662 **0.797 **0.948 ***
FCG0.844 ***0.898 ***0.879 ***0.949 ***
GG0.834 ***0.729 **0.573 *0.950 ***
GL0.972 ***0.1860.887 ***0.905 ***
NN0.777 **0.900 ***0.970 ***0.917 ***
*** p < 0.001, ** p < 0.01, and * p < 0.05. Absence of asterisks indicates a non-significant increasing trend over the years.
Table A2. The goodness of fit for the regression between each pair of indices for the five cities.
AbbreviationPTL ~ RIR + YearTL ~ RIR + YearFC ~ RIR + Year
R2R2R2
BS0.934 ***0.934 ***0.939 ***
FCG0.844 **0.844 **0.845 **
GG0.882 ***0.914 ***0.872 ***
GL0.978 ***0.973 ***0.980 ***
NN0.835 **0.831 **0.780 **
*** p < 0.001, ** p < 0.01. Absence of asterisks indicates a non-significant increasing trend over the years.
Figure A1. The partial least squares structural equation model using 0.8 as the critical value of loading factor. The numbers between the latent variables (circles) are estimated coefficients, followed by significance asterisks (*** p < 0.001), and the numbers between the observed (squares) and latent variables are factor loadings.
Sustainability 16 06999 g0a1

References

  1. Alkire, S.; Fang, Y. Dynamics of multidimensional poverty and uni-dimensional income poverty: An evidence of stability analysis from China. Soc. Indic. Res. 2019, 142, 25–64. [Google Scholar] [CrossRef]
  2. Wei, Y.; Tang, B.M. Health shock, social capital and rural household poverty vulnerability. J. Stat. Inform. 2022, 37, 103–116. [Google Scholar]
  3. Rui, C.; Liu, Y.; Li, Z.; Yi, M. Wang. Research on the dilemma and development path of rural industry revitalization under the background of rural revitalization. BCP Bus. Manag. 2023, 44, 265–269. [Google Scholar] [CrossRef]
  4. Wang, M.Y.; He, B.; Zhang, J.S.; Jin, Y.N. Analysis of the effect of cooperatives on increasing farmers’ income from the perspective of industry prosperity based on the psm empirical study in shennongjia region. Sustainability 2021, 13, 13172. [Google Scholar] [CrossRef]
  5. Watanabe, M.; Jinji, N.; Kurihara, M. Is the development of the agro-processing industry pro-poor? The case of thailand. J. Asian Econ. 2009, 20, 443–455. [Google Scholar] [CrossRef]
  6. Yang, L.; Yang, J.H.; Min, Q.W.; Liu, M.C. Impacts of non-agricultural livelihood transformation of smallholder farmers on agricultural system in the qinghai-tibet plateau. Int. J. Agric. Sustain. 2021, 20, 302–311. [Google Scholar] [CrossRef]
  7. Lu, D.M.; Yang, X.J.; Shi, Y.Z.; Wang, Z.Q. Rural regime shifts and transformation development on the Loess Plateau. Acta Geogr. Sin. 2020, 75, 348–364. (In Chinese) [Google Scholar]
  8. Wu, K.; Kong, D.; Yang, X. The impact of rural industrial development on farmers’ livelihoods—Taking fruit-producing area as an example. Land 2023, 12, 1478. [Google Scholar] [CrossRef]
  9. Yan, Z.; Yang, Z.; Zhong, W. Primary exploration of operation model and strategy of rural land circulation from the perspective of anti-poverty development. IOP Conf. Ser. Earth Environ. Sci. 2019, 267, 062004. [Google Scholar]
  10. Yu, W.; Guan, G.; Wang, Y.; Wang, Q. An analysis of the poverty reduction effects on land transfer: Evidence from rural areas in China. PLoS ONE 2024, 19, e0298243. [Google Scholar] [CrossRef]
  11. Zhou, Y.; Li, X.; Liu, Y. Rural land system reforms in China: History, issues, measures and prospects. Land Use Policy 2020, 91, 104330. [Google Scholar] [CrossRef]
  12. Qiu, T.; Luo, B.; Tang, L.; He, Q. Does land tenure security increase the marketization of land rentals between acquaintances? Appl. Econ. Lett. 2022, 29, 790–793. [Google Scholar] [CrossRef]
  13. Yu, X.; Su, Q.; Lyu, J. Does access to credit matter in land transfer decision-making? Evidence from China. Front. Environ. Sci. 2023, 11, 1111089. [Google Scholar] [CrossRef]
  14. Wang, P.; Wang, F. A study of the impact of land transfer decisions on household income in rural China. PLoS ONE 2022, 17, e0276559. [Google Scholar] [CrossRef]
  15. Liu, H.; Zhang, H.; Xu, Y.; Xue, Y. Decision-making mechanism of farmers in land transfer processes based on sustainable livelihood analysis framework: A study in rural China. Land 2024, 13, 640. [Google Scholar] [CrossRef]
  16. Zhu, B.; Zhu, X.; Zhang, R.; Zhao, X. Study of multiple land use planning based on the coordinated development of wetland farmland: A case study of Fuyuan City, China. Sustainability 2019, 11, 271. [Google Scholar] [CrossRef]
  17. Yu, H.; Zhang, W.; Pang, S. Exploring the role of land transfer and social capital in improving agricultural income under the background of rural revitalization. Int. J. Environ. Res. Public Health 2022, 19, 17077. [Google Scholar] [CrossRef] [PubMed]
  18. Huo, C.; Chen, L. The impact of land transfer policy on sustainable agricultural development in China. Sci. Rep. 2024, 14, 7064. [Google Scholar] [CrossRef] [PubMed]
  19. Chen, Y.; Li, M.; Zhang, Z. Does the rural land transfer promote the non-grain production of cultivated land in China? Land 2023, 12, 688. [Google Scholar] [CrossRef]
  20. Rada, N.; Fuglie, K. New perspectives on farm size and productivity. Food Policy 2019, 84, 147–152. [Google Scholar] [CrossRef]
  21. Fei, R.; Lin, Z.; Chunga, J. How land transfer affects agricultural land use efficiency: Evidence from China’s agricultural sector. Land Use Policy 2021, 103, 105300. [Google Scholar] [CrossRef]
  22. Cui, B.; Tang, L.; Liu, J.; Sriboonchitta, S. How does land transfer impact the household labor productivity in China? Empirical evidence from survey data in Shandong. Land 2023, 12, 881. [Google Scholar] [CrossRef]
  23. Zhu, J.; Ma, S.; Zhou, Q. Industrial revitalization of rural villages via comprehensive land consolidation: Case studies in Gansu, China. Land 2022, 11, 1307. [Google Scholar] [CrossRef]
  24. Xie, D.; Bai, C.; Wang, H.; Xue, Q. The land system and the rise and fall of China’s rural industrialization: Based on the perspective of institutional change of rural collective construction land. Land 2022, 11, 960. [Google Scholar] [CrossRef]
  25. Wang, Y.; Cao, X. Village evaluation and classification guidance of a county in southeast gansu based on the rural revitalization strategy. Land 2022, 11, 857. [Google Scholar] [CrossRef]
  26. Zheng, G.; Wang, W.; Jiang, C.; Jiang, F. Can rural industrial convergence improve the total factor productivity of agricultural environments: Evidence from China. Sustainability 2023, 15, 16432. [Google Scholar] [CrossRef]
  27. Yang, X.; Li, W.; Zhang, P.; Chen, H.; Lai, M.; Zhao, S. The dynamics and driving mechanisms of rural revitalization in western China. Agriculture 2023, 13, 1448. [Google Scholar] [CrossRef]
  28. Wang, S.; Zhu, J.; Wang, L.; Zhong, S. The inhibitory effect of agricultural fiscal expenditure on agricultural green total factor productivity. Sci. Rep. 2022, 12, 20933. [Google Scholar] [CrossRef]
  29. Zhang, S.; Zhang, X. Fiscal agricultural expenditures’ impact on sustainable agricultural economic development: Dynamic marginal effects and impact mechanism. PLoS ONE 2024, 19, e0299070. [Google Scholar] [CrossRef]
  30. Li, X.; Zhang, W.; Peng, Y. Grain output and cultivated land preservation: Assessment of the rewarded land conversion quotas trading policy in China’s Zhejiang Province. Sustainability 2016, 8, 821. [Google Scholar] [CrossRef]
  31. Trbic, G.; Popov, T.; Djurdjevic, V.; Milunovic, I.; Dejanovic, T.; Gnjato, S.; Ivanisevic, M. Climate change in bosnia and herzegovina according to climate scenario RCP8.5 and possible impact on fruit production. Atmosphere 2022, 13, 1. [Google Scholar] [CrossRef]
  32. Liu, G. Specific implementation strategies for rural revitalization strategies to help agricultural and rural economic development. Appl. Math. Nonlinear Sci. 2024, 9, 1–18. [Google Scholar] [CrossRef]
  33. Li, J. Research on the influence mechanism and effect of rural industrial convergence on urban-rural income gap—An empirical analysis based on the Yangtze River Economic Belt. Forest Chem. Rev. 2022, 7–8, 2109–2135. [Google Scholar]
  34. Liu, C.; Xie, W.; Wu, W.; Zhu, H. Predicting Chinese total retail sales of consumer goods by employing an extended discrete grey polynomial model. Eng. Appl. Artif. Intel. 2021, 102, 104261. [Google Scholar] [CrossRef]
  35. Hao, W.; Hu, X.; Wang, J.; Zhang, Z.; Shi, Z.; Zhou, H. The impact of farmland fragmentation in China on agricultural productivity. J. Clean. Prod. 2023, 425, 138962. [Google Scholar] [CrossRef]
  36. Hair, J.F.; Risher, J.J.; Sarstedt, M.; Ringle, C.M. When to use and how to report the results of PLS-SEM. Eur. Bus. Rev. 2018, 31, 2–24. [Google Scholar] [CrossRef]
  37. Yin, Q.; Sui, X.; Ye, B.; Zhou, Y.; Li, C.; Zou, M.; Zhou, S. What role does land consolidation play in the multi-dimensional rural revitalization in China? A research synthesis. Land Use Policy 2022, 120, 106261. [Google Scholar] [CrossRef]
  38. Li, Z.; Li, Z.; Mykhailov, A.; Shi, W.; Yang, Z.; Xia, S. Evaluation and analysis of socio-economic development level and management in Guangxi province of China. Stud. Appl. Econ. 2021, 39, 5. [Google Scholar]
  39. Zhou, Y.; Li, Y.; Xu, C. Land consolidation and rural revitalization in China: Mechanisms and paths. Land Use Policy 2020, 91, 104379. [Google Scholar] [CrossRef]
  40. Chen, K.Q.; Long, H.L.; Liao, L.W.; Tu, S.S.; Li, T.T. Land use transitions and urban-rural integrated development: Theoretical framework and China’s evidence. Land Use Policy 2020, 92, 104465. [Google Scholar] [CrossRef]
  41. Muga, G.; Hu, S.; Wang, Z.; Tong, L.; Hu, Z.; Huang, H.; Qu, S. The efficiency of urban–rural integration in the Yangtze River Economic Belt and its optimization. Sustainability 2023, 15, 2419. [Google Scholar] [CrossRef]
  42. The 40-year evolution and future trend of my country’s agricultural management system. Agr. Econ. Issues 2018, 6, 8–17.
  43. Pei, C.; Wang, Z.; Sun, J. New concepts, new ideas of shared development. In The Basic Income Distribution System of China; China governance system research series; Springer: Singapore, 2020. [Google Scholar]
  44. Niroula, G.S.; Thapa, G.B. Impacts and causes of land fragmentation, and lessons learned from land consolidation in South Asia. Land Use Policy 2005, 22, 358–372. [Google Scholar] [CrossRef]
  45. Li, Y.R.; Li, Y.; Fan, P.C.; Long, H.L. Impacts of land consolidation on rural human–environment system in typical watershed of the Loess Plateau and implications for rural development policy. Land Use Policy 2019, 86, 339–350. [Google Scholar]
Figure 1. The geographical study area in the present study. In the lower panel, the five cities studied here are highlighted in yellow.
Sustainability 16 06999 g001
Figure 2. The factor loading of each variable on the first four principal components. Negative loadings (red) and positive (blue). The indices are described in detail in Table 2. Both the size and color depth of the circles indicate the size of the factor loading. Absence of circles indicates negligible contribution of the indices to the component.
Sustainability 16 06999 g002
Figure 3. The flow chart of the present study.
Sustainability 16 06999 g003
Figure 4. The inter-annual trend of RIR and the land transfer indices for the five cities (denoted using different colors; (a) RIR; (b) PTL; (c) TL; (d) FC). The colored lines indicate the linear regressions between the index and year. Among them, the solid ones indicate statistically significant (p < 0.05) regressions, whereas the broken one indicates an insignificant regression. The shadings indicate the 95% confidence intervals. The goodness of fit (R2) is shown in Table A1.
Sustainability 16 06999 g004
Figure 5. Principal component analysis on the indices for RIR construction for the five cities during 2013–2022. Abbreviations for cities are described in detail in Table 1. Small-sized symbols indicate the projection for different years for each city, while large-sized symbols indicate the centroid of the ellipse for each city. The ellipses indicate the 95% confidence intervals.
Sustainability 16 06999 g005
Figure 6. Development level of rural industry revitalization (RIR) as a function of the proportion of the transferred land (PTL, (a)), transferred land per capita (TL, (b)), and the number of farmer cooperatives (FC, (c)) for each city (denoted using different colors). The goodness of fit (r2) is shown in Table A2.
Sustainability 16 06999 g006
Figure 7. Pearson’s correlation r of all RIR and land transfer indices across cities and years. Negative correlations (red) and positive (blue). Abbreviations are described in detail in Table 2. *** p < 0.001, ** p < 0.01, and * p < 0.05. Absence of asterisks indicates an insignificant (p > 0.05) correlation between the indices.
Sustainability 16 06999 g007
Figure 8. The partial least squares structural equation model using 0.7 as the critical value of loading factor. The numbers between the latent variables (circles) are estimated coefficients, followed by significance asterisks (*** p < 0.001), and the numbers between the observed (squares) and latent variables are factor loadings.
Sustainability 16 06999 g008
Table 1. Basic information on the five cities studied.
City Abbreviation Location Area
(km2)
GDP Ranking within Guangxi Proportion of
Rural Populations
Leading Industries
NanningNNCentral17,332140.9%Electronic manufacturing, machinery, and equipment
GuigangGGEast10,602849.1%Electric cars and agro-food processing
BaiseBSWest36,201675.9%Aluminum and forestry
FangchenggangFCGSouthern62431237.1%Steel and logistics
GuilinGLNorthern27,667345.9%Tourism and eco-foods
Note: Data were collected from the Statistical Yearbook and statistical communiqué on the national economic and social development of Guangxi, and the studied cities for 2022.
Table 2. The evaluation index system used in this study.
Target LayerFirst-Level IndicesSecond-Level IndicesDescription of the Indices (Unit)AbbreviationMinimumMaximumMeanVariance
Development level of rural industry revitalization
(RIR)
InfrastructuresEffective irrigation areaThe cropland area with water source and complete sets of irrigation facilities (104 ha)EIA2.925.915.055.5
Total power of farm machineryTotal mechanical power of machinery used in agricultural industries (104 kw)TPFM6357735627,999
Electric power consumptionElectric power consumption/rural population (kWh per person)EPC15558936213,127
Agricultural fiscal expendituresFiscal expenditure on agriculture, forestry, and water affairs (108 CNY)AFE1013046801
Production
efficiency
Grain yield per unit areaGrain yield/the sowing area (103 kg m–2)GYA0.261.340.340.02
Timber harvestsThe volume of timber harvested (104 m3)TH7169726823,922
Growth rate of the value added of the primary sectorPercentage change in the added value created by the production activities of primary industries (%)GRVP2.909.505.152.22
Garden fruit outputGarden fruit output/rural population (kg per person)GFO9543469221,009,572
Industry
convergence
Proportion of the service industriesGDP of the service industries that are related to primary industries/total GDP (%)PSI1.026.293.792.59
Rural tourism resortsNumber of star-level rural tourism resorts (-)RTR1.069.018.5356.8
Retail salesRetail sales of rural consumer goods (108 CNY)RS8.3211.094.34556.0
Land transfer Transferred land per capitaArea of the transferred farmland previously owned by rural household/rural population (ha per person)TL0.510.84.27.5
Proportion of the transferred landArea of the transferred farmland previously owned by rural household/area of the farmland owned by rural household (%)PTL5.522.514.315.3
Farmer cooperativesNumber of famer cooperatives (-)FC230748733334,674,933
Disclaimer/Publisher’s Note: The statements, opinions and data contained in all publications are solely those of the individual author(s) and contributor(s) and not of MDPI and/or the editor(s). MDPI and/or the editor(s) disclaim responsibility for any injury to people or property resulting from any ideas, methods, instructions or products referred to in the content.

