Article

Does “Dual Credit Policy” Really Matter in Corporate Competitiveness?

School of Management, Guizhou University, Guiyang 550025, China
*
Author to whom correspondence should be addressed.
Sustainability 2024, 16(16), 6991; https://doi.org/10.3390/su16166991
Submission received: 8 July 2024 / Revised: 30 July 2024 / Accepted: 13 August 2024 / Published: 15 August 2024

Abstract

:
Developing the new energy vehicle (NEV) industry significantly reduces pollutant emissions in the transportation sector, promotes high-quality carbon peaks, and reduces dependence on oil imports. Industrial policies also support the NEV industry, constantly enhancing its international competitiveness. The Dual Credit Policy, implemented in 2017, has pressured automotive manufacturers to transform their production models, reduce the output of traditional fuel vehicles, and increase the production of NEV. This study analyzes the effects of the Dual Credit Policy on corporate competitiveness before and after implementing it, using listed companies in China’s NEV industry as the research subjects. The results indicate that the Dual Credit Policy significantly enhanced corporate competitiveness through substantial innovation. Additionally, the difference-in-differences (DID) model results reveal that the policy’s promotional effect is more pronounced in traditional vehicle companies due to higher pressure. Heterogeneity tests show that the policy has a more significant effect on state-owned enterprises and that regional marketization differences lead to a greater promotional impact on enterprises in the central and eastern regions.

1. Introduction

Promoting the decarbonization of economic and social development is crucial for China to achieve high-quality development [1,2]. The development of NEV is a pivotal strategy for China to realize low-carbon growth, meet its carbon peak and neutrality goals, and surpass global leaders in the automotive industry [3]. Since 2010, China has implemented subsidy-based industrial policies, including fiscal subsidies and tax incentives, to boost the production and sales of NEVs (Figure 1) [4,5]. By 2015, China became the world’s leading producer and seller of NEVs [6]. However, while promoting industrial development, these original fiscal and tax policies may lead to “strategic” innovative behaviors [7]. Companies, in pursuit of policy benefits, focus on the quantity of innovations rather than quality [8], resulting in issues such as “subsidy dependence”, “fraudulent subsidy claims”, and “strategic innovation” [9,10,11]. These behaviors are inconsistent in promoting the high-quality development of the NEV industry [12]. Policy dependence has significantly constrained technological innovation in China’s NEV industry, necessitating a shift from selective to functional industrial policies [13]. To adjust the NEV industry’s supply, optimize its structure, and promote industrial innovation, the “Dual Credit” Policy has been enacted [14,15].
In September 2017, China issued the “Parallel Management Method for Passenger Car Enterprises’ Average Fuel Consumption and New Energy Vehicle Credits” (hereinafter referred to as the “Dual Credit” Policy), which was officially implemented in April 2018. China’s Dual Credit Policy draws on the United States’ Corporate Average Fuel Economy (CAFE) and Zero-Emission Vehicle (ZEV) fuel policies [16]. The government provides a fair market competition environment by establishing market mechanisms [17,18] and encourages companies to enhance their competitive advantages through substantial innovation [19]. Functional industrial policy raises market technical standards and thresholds, compelling companies to enhance their technical levels to meet market entry requirements (Figure 2) [20].
China’s Corporate Average Fuel (CAFC) credit and NEV credit accounting rules involve vehicle performance and corresponding production volume [21]. Policies influence vehicle performance and production scale by setting standards and implementing incentive measures [22]. The CAFC and NEV credit systems require automakers to produce a certain proportion of NEVs, and credits are calculated based on vehicle fuel efficiency and the production volume of NEVs [23,24].
As shown in Figure 3, 38 new energy-listed vehicle enterprises are listed in the eastern region, followed by 14 in the central region and 6 in the eastern region. It can be found mainly concentrated in the eastern region. From the point of the company’s new energy credits, BYD credits total 7,653,922, while Chery Automobile is only 41,305; the credit difference between the companies is huge.
The Chinese automobile industry is developing swiftly and steadily on the road to high-quality development, maintaining the world’s top position in the production and sales of NEVs for eight consecutive years [25]. Production and sales figures of major listed companies for NEVs are shown in Figure 4. NEVs have provided a brand-new track for transforming and upgrading and high-quality development of China’s automotive industry.
Industrial development is carried out and is implied by the companies. The production and sales of NEVs reached 7.058 million and 6.887 million units, respectively, increasing by 96.9% and 93.4% year-on-year and achieving a market share of 25.6%. Among them, the sales of battery electric vehicles reached 5.365 million units, and plug-in hybrid electric vehicles reached 1.518 million units (Figure 5).
While the government formulates industrial policies to achieve specific macro-goals, the externalities of the policies significantly impact the business decisions and performance of enterprises, influencing their competitiveness and survival. Previous researchers have focused on investigating consumer satisfaction [26,27,28,29,30] and purchase intention [31,32] for NEVs through questionnaires. Adolfo Perujo, through a comparative analysis of petrol, diesel, and purely electric vehicles, argues that purely electric NEVs align with the future trend of reducing carbon dioxide requirements in public transport. He asserts that targeted government policies are essential to overcome the initial cost losses and improve the industrial competitiveness of NEVs [33]. In addition, empirical studies have shown that NEV policies can further enhance firms’ innovation through economies of scale [34,35]. However, limited research has examined the significant impact of industrial policies on corporate competitiveness, especially for new industrial policies such as the Dual Credit Policy, which combines credit limits, trading, and penalties. The Dual Credit Policy quantifies target values through credits, compelling companies to increase their efforts in innovation. Especially after 2017, the number of invention patent applications in the new energy industry surged. By 2022, patent applications reached 9815, nearly four times that of 2015. The proportion of invention patents and substantive innovations in the total number of patent applications has also increased, exceeding ninety percent since 2016 (Figure 6).
However, will the policy affect the competitiveness of companies? What kind of innovation has a significant impact on corporate competitiveness? And what type of companies experience more significant changes in competitiveness? There are questions that have not yet been fully explained from a theoretical perspective.
This study selects listed new energy automobile companies listed in 2014–2022 as a sample. Regression methods were used to analyze the impact of Dual Credit Policy on the total factor productivity of enterprises. The instrumental variable method and a series of robustness tests are used to ensure the accuracy of the results. The heterogeneous characteristics of firms are fully considered. This study also takes innovation ability as a mediator to study its mediating effect, and the results provide an important reference for the construction and upgrading of traditional automobile manufacturing enterprises.

2. Theoretical Analysis and Research Hypotheses

From the perspective of research content, the prior literature on the Dual Credit Policy often considers factors such as supply chains [36], battery recycling [37], and charging infrastructure in the context of the substitution effect of subsidy policies [38]. These studies assess the policy outcomes and impacts from different perspectives and predict the development trends of policy rules. Regarding research methods, many scholars construct decision models, setting hypothetical conditions and different scenarios, and employing a numerical analysis to study the Dual Credit Policy and its impact effects [39]. The Dual Credit Policy aims to enhance the energy efficiency of passenger cars, establish a long-term mechanism for energy-saving and emission reduction of passenger cars, manage NEVs, and promote the healthy development of the automotive industry [40,41]. Enhancing a company’s competitiveness is the foundation for the healthy development of the industry. As a functional industrial policy, evaluating whether the Dual Credit Policy can truly enhance the competitiveness of enterprises after its implementation is important to assess the policy’s effectiveness. The Dual Credit Policy aims to promote enterprise innovation through market regulation by proposing clear market threshold requirements to achieve an overall enhancement in enterprise competitiveness. Therefore, the following hypothesis is proposed:
H1: 
The Dual Credit Policy can effectively promote corporate competitiveness.
Corporate competitiveness is defined by a company’s unique, non-replicable, and valuable collection of core technologies and skills [42]. Technological innovation theory suggests that enhancing competitive advantages and enhancing operational performance are primary company objectives. Research indicates a positive impact of R&D investment intensity on corporate competitiveness [43]. Patent applications are an important indicator for measuring corporate technological innovation [44]. Patents can be divided into three types in China: invention patents, utility model patents, and design patents. Corporate patent applications represent high-quality, innovative behavior, which can lead to technological advancements and enhance competitive advantages [45]. Invention patents are seen as high-quality, substantive innovations requiring significant resources and carrying high risk, unlike utility model and design patents, which are less innovative and easier to obtain. Thus, it requires companies to invest significant human and financial resources, and the outcomes of innovation usually have externalities. Therefore, when a company aims to obtain government subsidies and align with government policies and regulatory requirements, it tends to apply for utility model patents and design patents [46,47]. The intensity of R&D investment positively impacts corporate competitiveness, and technological innovation is the primary source of corporate competitiveness. Based on the above analysis, this study argues that the Dual Credit Policy can encourage companies to increase substantive innovation to obtain new growth opportunities and enhance their competitiveness. Therefore, the following hypothesis is proposed:
H2: 
Substantive innovation has a mediating effect on the impact of the Dual Credit Policy on corporate competitiveness.
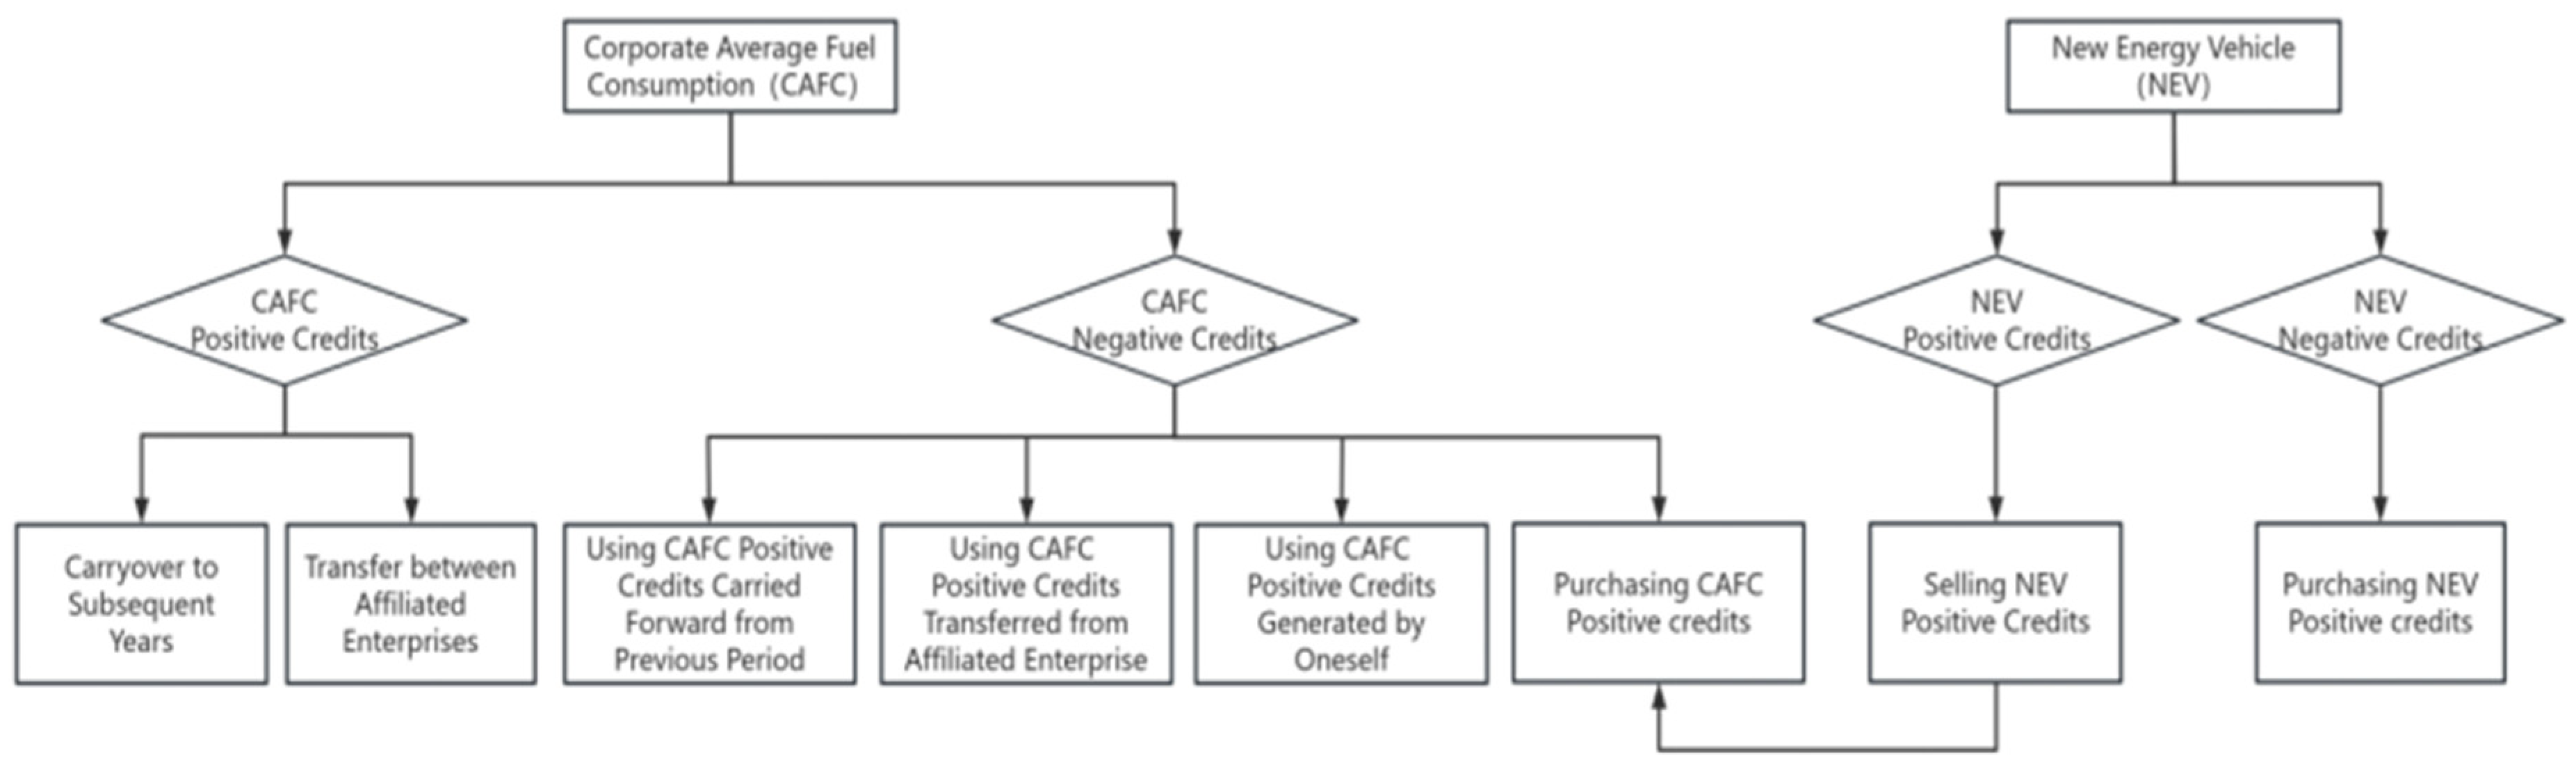
The Dual Credit Policy applies to both pure NEV and traditional passenger car companies. The policy aims to promote energy conservation and advocate for the coordinated development of enterprises using new energy [48]. For traditional car companies, achieving the standard of credits through self-sufficiency is often not feasible. They must obtain points from affiliated companies (e.g., SAIC-GM-Wuling produces macro-mini Wuling to obtain positive points) to offset the negative points of other brands of SAIC or buy positive points from other businesses to offset their negative points (Figure 7). However, purchasing credits will significantly increase management expenses [49,50]; for example, in the first half of 2021, Changan’s management expenses were as high as CNY 2.217 billion, up 93.45% year-on-year. Changan Automobile stated that this was exactly the impact of “allocating new energy credits”.
After implementing the Dual Credit Policy, there is a high demand for positive credit in the market. Traditional car companies are facing greater pressure [51]. Enhancing competitiveness by increasing R&D efforts and generating more NEV-positive credits is necessary. Therefore, the following hypothesis is proposed:
H3: 
Traditional automakers emphasize enhancing competitiveness through substantial innovation more than pure NEV manufacturers.

3. Research Design

3.1. Sample Selection and Data Sources

This study selects 58 listed companies in China’s new energy automobile industry from 2014 to 2022 as the research object, and the data are mainly obtained from the Wind database. This study treats the samples as follows: (1) excluding the samples of ST and the samples of enterprises delisted during the sample period; (2) excluding the samples with missing main variables. To reduce the influence of extreme values, this paper shrinks all continuous variables by 1% up and down and finally obtains 424 observations from 58 enterprises.

3.2. Variable Selection and Definition

3.2.1. Dependent Variable

The dependent variable in this paper is the total factor productivity of firms. There are many existing methods to measure the total factor productivity of enterprises, among which the OP method [52] and the LP method [53] are the most popular. Among them, the OP and the LP methods can alleviate the endogeneity caused by the traditional methods. Traditional methods cause the endogeneity problem. At the same time, the OP method needs to satisfy the premise that the investment is greater than 0 and monotonically increasing, which leads to partial loss of samples. This results in the loss of part of the sample. In contrast, the LP method, which uses intermediate inputs as instrumental variables, is more flexible. In this paper, the LP method is used to estimate the total factor productivity of enterprises, while the OP method is used to estimate the total factor productivity of enterprises. In this paper, the LP method is used to estimate the total factor productivity of enterprises, and the total factor productivity estimated by the OP method and the GMM method is used as the robustness test.

3.2.2. Explanatory Variable

The explanatory variable is the defined policy virtual variable DCP, where 1 is taken after the implementation of the double-integral policy and 0 before the implementation of the double-integral policy.

3.2.3. Mediator Variable

This study adopts a number of enterprise patent applications to measure the innovation ability of enterprises as a mediating variable. According to the classification of patent types by the State Intellectual Property Office, including an invention patent, utility model patent, and appearance design patent, the degree of innovation decreases in turn. Practical patents and appearance patents are relatively loose in the approval and examination, while invention patents require novelty and creativity, with a high technical level. In view of the differences in the innovative nature of these three patents, the number of enterprise innovations is measured by the sum of enterprise patent applications, and the quality of enterprise innovation is measured by the number of invention patent applications.

3.2.4. Control Variables

Referring to the existing studies, the following control variables are selected: enterprise age (age), nature of ownership (soe), enterprise market capitalization (ma), enterprise’s return on assets (ROA), financial leverage (lever), economic policy uncertainty (epu), and the largest shareholder proportion (top1). The specific calculation methods of the control variables are shown in Table 1.

3.3. Model Design and Construction

To test hypothesis 1, the model is constructed as follows:
T F P _ L P i t = β 1 + β 2 D C P i t + β 3 X i t + ω i + δ t + ε i t
where T F P _ L P i t represents total factor productivity, D C P i t represents Double Credit Policy, X i t represents the control variable set, ω i represents the enterprise fixed effect, δ t represents the time fixed effect, and ε i t represents stochastic error.
To test hypothesis 2, this study uses the three-step method of testing the mediation effect used by Wen Zhong and Ye [54].
T F P _ L P i t = α 0 + α 1 D C P i t + α 2 X i t + ω i + δ t + ε i t
I n v e n t i o n i t = γ 0 + γ 1 D C P i t + γ 2 X i t + ω i + δ t + ε i t
T F P _ L P i t = φ 0 + φ 1 D C P i t + φ 2 I n v e n t i o n i t + φ 3 X i t + ω i + δ t + ε i t
where T F P _ L P i t represents total factor productivity, D C P i t represents Double Credit Policy, I n v e n t i o n i t represents innovation capacity as a mediating variable, X i t represents the control variable set, ω i represents the enterprise fixed effect, δ t represents the time fixed effect, and ε i t represents stochastic error.
The difference-in-differences method is applied to assess the average treatment effect of the double-integral policy on the competitiveness of enterprises. Construct the new energy enterprise dummy variable NEV, in which the NEV enterprises take 1 and the traditional vehicle enterprises take 0. Define the policy dummy variable DCP, in which the year before the implementation of the policy is taken as 0 and the year after the implementation is taken as 1. Based on this, the double-difference benchmark model is established as follows:
T F P _ L P i t = μ 0 + μ 1 D C P i t + μ 2 D C P i t × N E V i t + μ 3 X i t + ω i + δ t + ε i t
where T F P _ L P i t represents total factor productivity, D C P i t represents Double Credit Policy, D C P i t × N E V i t represents the intermodal term (math.), X i t represents the control variable set, ω i represents the enterprise fixed effect, δ t represents the time fixed effect, and ε i t represents stochastic error.

4. Results and Analysis

4.1. Descriptive Statistics and Correlation Analysis

Descriptive statistics were analyzed for each of the study variables. Table 2 shows the results.
A comparison with data from existing studies shows that the variables are within reasonable limits. As shown in Table 2, the mean value of the indicators of corporate competitiveness is 9.260, with minimum values of 5.462 and maximum values of 11.370. The standard deviation of substantive invention is 2.007, with a mean value of 4.092. This indicates that different firms have varying numbers of substantive inventions. It also shows that there is a gap in innovation capability between firms. Regarding control variables, the maximum and minimum company market value (ma) values are 18.100 and 10.641, respectively, with a standard deviation of 1.290. This indicates that there is a large gap in the market value of the firms. The mean value of return on assets (roa) is 0.031, with a maximum value of 0.445 and a minimum value of −0.672. This indicates that there is a wide profitability gap among the firms. The mean value of the largest shareholder (top1) is 33.763, with minimum values of 9.540 and maximum values of 83.410, indicating a significant difference in the shareholding ratio of the largest shareholder. The mean value of the debt ratio (lever) is 0.560, with a standard deviation of 0.177. It shows that the sample firms generally have high debt ratios. The standard deviation of economic policy uncertainty (epu) is 0.592, with a mean of 6.042. The mean value of firm age is 3.016, with a maximum value of 4.804 and a minimum value of 2.996.
We conducted a Pearson correlation analysis for each variable to test whether there is a correlation between variables and to understand their relationships with each other. Table 3 shows the results of the analysis.

4.2. Regression Analysis of the Dual Credit Policy and Corporate Competitiveness

Table 4 shows the regression analysis of the impact on corporate competitiveness before and after the Dual Credit Policy implementation. The regression coefficient on DCP is 0.387, which is positive and statistically significant at 1%. This indicates that there has been a significant improvement in corporate competitiveness after the implementation of the Dual Credit Policy.
The results for the control variables are largely consistent with prior studies and inspire confidence in our interpretation of the Dual Credit Policy as positively related to corporate competitiveness. For example, larger firms have higher corporate competitiveness. Roa is positively associated with competitiveness [55].

4.3. Regression Analysis of the Mechanism

Table 5 presents the test results of the mediation effect of substantive innovation on implementing the Dual Credit Policy and corporate competitiveness. Based on the three steps described previously, the first step tests the significance of the regression coefficient between policy and corporate competitiveness, which was shown to be significant and positive at the 1% level. The second step is to test the significance of Dual Credit Policy and corporate innovation in models (DCP) and (invention), which are significant according to the results reported in Table 5 columns (1) and (2).
According to Table 5, the regression coefficient between invention and dcp is 0.664, which is significant at the 1% level after controlling year and firm effects. After including control variables, the coefficient is still positive and significant, which means that after the policy implementation, the number of substantive innovations increased. The coefficients between corporate competitiveness and substantive innovation are the same, 0.266, in columns (3) and (4). This indicates that the more substantial the innovations, the stronger the competitiveness of the enterprises. That is to say, the mediating effect is established. This study argues that implementing the Dual Credit Policy can enhance corporate competitiveness through the mediating variable of substantive innovation. After the mechanism analysis, hypothesis 2 has been verified.

4.4. The Difference-in-Differences Model

This study believes that implementing the Dual Credit Policy will have a “forcing effect” on traditional automakers, in that they have to pay more attention to enhancing their competitiveness than pure NEV companies. The difference-in-differences model (DID) is used to test the impact of the policy on the competitiveness of different types of automakers. Suppose the experimental group and the control group (traditional automakers) exhibit the same trend in terms of enterprise competitiveness before the policy is implemented. In that case, the DID estimation results can be considered reliable. To avoid perfect multicollinearity, this study selected 2016, the year before the policy implementation, as the baseline group in the model. Figure 8 depicts that there is no significant difference in the trend between the experimental group and the control group before the policy implementation and a very pronounced downward trend after 2016.
The result of the difference-in-differences model is reported in Table 6. This study notes that the coefficients of DCP × NEV in columns (1) and (2) are negative and statistically significant at 1%. This indicates that after 2017, traditional automakers showed a more significant competitiveness improvement than pure NEV companies.

4.5. Further Analysis and Robustness Tests

4.5.1. Heterogeneity Analysis of the Nature of Corporate Property Rights

This study further explores the impact of policy implementation on companies with different ownership characteristics. The sample is divided into state-owned and non-state-owned groups. State-owned enterprises are assigned a value of 1, while non-state-owned enterprises are assigned a value of 0. The results in Table 7 reveal that for state-owned enterprises, the effect of the policy is more significant than that of non-state-owned enterprises. Interestingly, the more concentrated the ownership of state-owned enterprises, the more negative impact it has on competitiveness, whereas the opposite is true for non-state-owned enterprises. This empirical result aligns with the reality that if the ownership is more concentrated, it often suppresses innovation within state-owned enterprises [56,57]. For non-state-owned enterprises, more concentrated ownership tends to quicken strategic adjustments that play a more positive role in fostering innovation.

4.5.2. Heterogeneity Analysis of Regional Economic Development Levels

The Dual Credit Policy is influenced by the degree of marketization in the region where the enterprise is located. If the enterprise is located in a region with a higher degree of marketization, the enterprise can more easily obtain resources for technological innovation from the market, thereby reducing the risks of technological innovation; second, the enterprise can use market earnings to offset the investment in technological innovation. As we all know, China has a vast territory with a very uneven level of regional economic development, and there are significant differences in the degree of marketization among different regions. This study classifies the regions where enterprises are located into three areas, the eastern, central, and western regions, according to the economic region classification method of the National Bureau of Statistics, then repeats the regression analysis of the models for hypothesis 2. The regression results are shown in Table 8.
The regression results for the eastern and central regions are consistent with the main regression results above, while the coefficient in the western region is insignificant. This indicates that the differences in marketization among different regions have affected the promotional role of the Dual Credit Policy in enterprise innovation and competitiveness.

4.5.3. Robustness Tests

This study performed a robustness analysis by changing the dependent and control variables. In the analysis above, this study takes TFP_LP as the proxy of corporate competitiveness. TFP_LP is replaced with the TFP_OLS, calculated by the ordinary least square method in this part of our study. Table 9 reveals that the coefficient between Dual Credit Policy and Tfp_OLS is 0.346, which is significant at 1%. Through the analysis of influence mechanisms, the coefficient of the invention is 0.297, which is positively correlated with corporate competitiveness. The results indicate that after the policy implementation, the firms enhance their competitiveness by increasing substantial innovation. The empirical results are still consistent with our findings.

5. Discussion

Different industrial policies significantly impact industry development. China’s NEV industry policy has transitioned from early selective policies to the functional Dual Credit Policy to establish a long-term mechanism promoting NEV industry growth. The current Dual Credit Policy draws lessons from the United States’ ZEV credit policy, which has been shown to promote R&D innovation and technological maturity in the automotive industry [58]. In China, scholars have also studied the Dual Credit Policy’s incentive effects on corporate technological innovation and its role in industrial development, and findings are confirmed in this study. Under the Dual Credit Policy, NEV companies have enhanced their competitiveness through innovation, as represented by total factor productivity, supporting hypothesis 1.
Studies indicate that the Dual Credit Policy promotes technological innovation in NEV companies by regulating the market and setting clear technological thresholds. NEV companies have adjusted their R&D investments’ scale, intensity, and structure, promoting substantive innovation. This study confirms that the Dual Credit Policy enhances corporate competitiveness by encouraging significant innovation, validating hypothesis 2.
Researchers have examined whether the Dual Credit Policy can replace the NEV purchase subsidy policy based on the trade-off between fuel and NEV production and fuel consumption. Properly adjusting the Dual Credit Policy mechanism by setting NEV proportion requirements can lead to increased investment in fuel efficiency for traditional vehicles. This study also verifies that traditional automakers, compared to pure NEV manufacturers, emphasize enhancing competitiveness through substantial innovation, consistent with hypothesis 3.

6. Conclusions and Implications

Using new energy-listed car companies from 2014 to 2022 as the sample, this study investigates the role of the Dual Credit Policy in promoting the competitiveness of NEV enterprises. A vast amount of the literature focuses on the effects after the implementation of the policy. This study emphasizes the functionality of the industrial policy, particularly the high-quality development of the new energy industry. The results show that consistent with the purpose of the Dual Credit Policy, the competitiveness of China’s automobile manufacturing companies has been enhanced after the implementation of the policy. This study explores the mechanisms of competitiveness enhancement and finds that the sample firms have raised their level of competitiveness through increased substantial innovation. Furthermore, a DID model is constructed to explore the extent of the policy’s impact on two types of automobile manufacturers: pure NEV manufacturers and traditional automakers. Traditional automakers must reduce fuel consumption and increase the production of NEVs to meet the credit requirements. This study finds that the traditional automakers are prone to enhancing competitiveness compared with pure NEV manufacturers due to greater policy pressure (Figure 9).
In terms of research significance, this study is crucial for the sustainable development of the NEV industry; the adjustment of industrial policies is vital for the healthy and sustainable growth of the sector. The development of the NEV industry significantly reduces pollutant emissions in the transportation sector, promotes a high-quality carbon peak, and decreases dependence on oil imports. Industrial policies continue to support NEV development, constantly enhancing their international competitiveness. The Dual Credit Policy, implemented in 2017, has pressured automotive manufacturers to transform their production models, reducing traditional fuel vehicle output and increasing the production of NEV.
This study finds that substantive innovation is an important mechanism for NEVs to enhance their competitiveness. Future research should focus on the impact of R&D personnel, R&D investment, and intensity on corporate competitiveness, which has practical significance for the healthy and sustainable development of enterprises.
This study indicates that the Dual Credit Policy positively impacts the new energy industry, providing an empirical basis for evaluating China’s NEV industry policy. Based on the conclusions of this study, the following policy recommendations are proposed:
  • China should continue to refine and adjust the Dual Credit Policy to stimulate the motivation for technological innovation in NEV enterprises. It is suggested that the government update credit requirements based on the development of enterprise technology, effectively promoting corporate innovation and achieving high-quality development of the industry.
  • The NEV industry policy should focus on guiding non-state-owned enterprises. Non-state-owned enterprises are less sensitive to policies and face higher innovation risks, which may weaken their willingness to innovate. The government should consider providing more support for non-state-owned enterprises, such as offering easier access to financing, to reduce their innovation risks and stimulate their innovative vitality.

Author Contributions

L.L.: Writing—original draft, Methodology, Conceptualization; Q.M.: Writing—original draft, Formal analysis, Data curation; C.L.: Writing—review and editing, Visualization, Funding acquisition. All authors have read and agreed to the published version of the manuscript.

Funding

This research was funded by Guizhou Office of Philosophy and Social Science Planning, China [funding numbers: 22GZQN20; funder: C.L.], and the Environmental and Economic Benefits Analysis of Methanol Vehicles, Guizhou, China [funding numbers: GDQN2021019; funder: C.L.].

Institutional Review Board Statement

Not applicable.

Informed Consent Statement

Not applicable.

Data Availability Statement

Data will be made available on request.

Conflicts of Interest

The authors declare that they have no known competing financial interests or personal relationships that could have appeared to influence the work reported in this study.

References

  1. Golpîra, H.; Khan, S.A.R.; Safaeipour, S. A review of logistics internet-of-things: Current trends and scope for future research. J. Ind. Inf. Integr. 2021, 22, 100194. [Google Scholar] [CrossRef]
  2. Lee, C.C.; Wang, F.; Lou, R.; Wang, K. How does green finance drive the decarbonization of the economy? Empirical evidence from China. Renew. Energy 2023, 204, 671–684. [Google Scholar] [CrossRef]
  3. Yang, D.X.; Meng, J.; Yang, L.; Nie, P.Y.; Wu, Q.G. Dual-Credit Policy of new energy automobile at China: Inhibiting scale or intermediary of innovation? Energy Strategy Rev. 2022, 43, 100932. [Google Scholar] [CrossRef]
  4. Zhao, D.; Ji, S.F.; Wang, H.P.; Jiang, L.W. How do government subsidies promote new energy vehicle diffusion in the complex network context? A three-stage evolutionary game model. Energy 2021, 230, 120899. [Google Scholar] [CrossRef] [PubMed]
  5. Wang, Y.; Fan, R.; Lin, J.; Chen, F.; Qian, R. The effective subsidy policies for new energy vehicles considering both supply and demand sides and their influence mechanisms: An analytical perspective from the network-based evolutionary game. J. Environ. Manag. 2023, 325, 116483. [Google Scholar] [CrossRef] [PubMed]
  6. Li, J.; Jiao, J.; Xu, Y.; Chen, C. Impact of the latent topics of policy documents on the promotion of new energy vehicles: Empirical evidence from Chinese cities. Sustain. Prod. Consum. 2021, 28, 637–647. [Google Scholar] [CrossRef]
  7. Li, J. Can Fiscal Subsidies and Tax Incentives Stimulate High-quality Innovation in Strategic Emerging Industries? Explanation Based on Enterprise Life Cycle Theory. Front. Bus. Econ. Manag. 2023, 9, 62–71. [Google Scholar]
  8. Zhang, B.; Zhang, B.; Di, J.; Han, Q. The strategic behavior of Chinese enterprises using R&D subsidies: Game model and empirical research. Appl. Econ. 2022, 54, 4187–4202. [Google Scholar]
  9. Zuo, Z.; Lin, Z. Government R&D subsidies and firm innovation performance: The moderating role of accounting information quality. J. Innov. Knowl. 2022, 7, 100176. [Google Scholar]
  10. Wu, Y.; Li, X.; Zhang, C.; Wang, S. The impact of government subsidies on technological innovation of new energy vehicle enterprises: From the perspective of industry chain. Environ. Dev. Sustain. 2023, 1–19. [Google Scholar] [CrossRef]
  11. Li, C.; Hao, Q.; Wang, H.; Hu, Y.J.; Xu, G.; Qin, Q.; Wang, X. Assessing green methanol vehicles’ deployment with life cycle assessment-system dynamics model. Appl. Energy 2024, 364, 123055. [Google Scholar]
  12. Qin, S.; Xiong, Y. Differential impact of subsidised and nonsubsidized policies on the innovation of new energy vehicle enterprises: Evidence from China. Asian J. Technol. Innov. 2022, 31, 260–283. [Google Scholar] [CrossRef]
  13. Jiang, Z.; Xu, C. Policy incentives, government subsidies, and technological innovation in new energy vehicle enterprises: Evidence from China. Energy Policy 2023, 177, 113527. [Google Scholar] [CrossRef]
  14. Yang, D.X.; Yang, L.; Chen, X.L.; Wang, C.; Nie, P.Y. Research on credit pricing mechanism in dual-credit policy: Is the government in charge or is the market in charge? Environ. Dev. Sustain. 2023, 25, 1561–1581. [Google Scholar] [CrossRef]
  15. Yang, T.; Xing, C.; Li, X. Evaluation and analysis of new-energy vehicle industry policies in the context of technical innovation in China. J. Clean. Prod. 2021, 281, 125126. [Google Scholar] [CrossRef]
  16. Ma, H.; Lou, G.; Fan, T.; Chan, H.K.; Chung, S.H. Conventional automotive supply chains under China’s dual-credit policy: Fuel economy, production and coordination. Energy Policy 2021, 151, 112166. [Google Scholar] [CrossRef]
  17. Xiao, Z.; Wang, S.; Zhang, Y.; Si, D.K. Power of competition: Unraveling the impact of China’s fair competition review system implementation on firm innovation. Econ. Anal. Policy 2023, 80, 1561–1581. [Google Scholar] [CrossRef]
  18. Li, C.; Jia, T.; Wang, H.; Wang, X.; Negnevitsky, M.; Hu, Y.-J.; Zhao, G.; Wang, L. Assessing the prospect of deploying green methanol vehicles in China from energy, environmental economic perspectives. Energy 2023, 263, 125967. [Google Scholar] [CrossRef]
  19. Shi, L.; Lin, B. The dual-credit policy effectively replaces subsidy from the perspective of R&D intensity. Environ. Impact Assess. Rev. 2023, 102, 107160. [Google Scholar]
  20. Martin, R.; Mohnen, P.; Thomas, C.; Verhoeven, D.; Guillard, C. Efficient industrial policy for innovation: Standing on the shoulders of hidden giants; Centre for Economic Performance: London, UK, 2021. [Google Scholar]
  21. Wang, Y.; Zhao, F.; Yuan, Y.; Hao, H.; Liu, Z. Analysis of typical automakers’ strategies for meeting the dual-credit regulations regarding CAFC and NEVs. Automot. Innov. 2018, 1, 15–23. [Google Scholar] [CrossRef]
  22. Liu, Y.; Zhao, X.; Lu, D.; Li, X. Impact of policy incentives on the adoption of electric vehicle in China. Transp. Res. Part A Policy Pract. 2023, 176, 103801. [Google Scholar] [CrossRef]
  23. Li, Y.; Zhang, Q.; Liu, B.; McLellan, B.; Gao, Y.; Tang, Y. Substitution effect of new-energy vehicle credit program and corporate average fuel consumption regulation for green-car subsidy. Energy 2018, 152, 223–236. [Google Scholar] [CrossRef]
  24. Li, C.; Jia, T.; Wang, S.; Wang, X.; Negnevitsky, M.; Wang, H.; Hu, Y.; Xu, W.; Zhou, N.; Zhao, G. Methanol Vehicles in China: A Review from a Policy Perspective. Sustainability 2023, 15, 9201. [Google Scholar] [CrossRef]
  25. Hu, S.; Liu, Z.; Tan, Y.; Cheng, X.; Chen, Z.; Long, Z. The status quo and future trends of new energy vehicle power batteries in China—Analysis from policy perspective. Energy Rep. 2022, 8, 63–80. [Google Scholar] [CrossRef]
  26. Liu, J.; Nie, J.; Zhang, W.; Li, L.; Yuan, H. Product development strategies of electric vehicle manufacturers: Considering government subsidy and consumers’ environmental preferences. Technol. Forecast. Soc. Change 2024, 201, 123222. [Google Scholar] [CrossRef]
  27. Xiong, Y.; Wang, L. Policy cognition of potential consumers of new energy vehicles and its sensitivity to purchase willingness. J. Clean. Prod. 2020, 261, 121032. [Google Scholar] [CrossRef]
  28. Wang, L.; Fu, Z.L.; Guo, W.; Liang, R.Y.; Shao, H.Y. What influences sales market of new energy vehicles in China? Empirical study based on survey of consumers’ purchase reasons. Energy Policy 2020, 142, 111484. [Google Scholar] [CrossRef]
  29. Li, W.; Long, R.; Chen, H. Consumers’ evaluation of national new energy vehicle policy in China: An analysis based on a four paradigm model. Energy Policy 2016, 99, 33–41. [Google Scholar] [CrossRef]
  30. Li, C.; Negnevitsky, M.; Wang, X.; Wang, H.; Hu, Y. Evaluating consumer acceptance of the commercial fleet of methanol vehicles in China. Front. Energy Res. 2021, 9, 792982. [Google Scholar] [CrossRef]
  31. Wang, W.; Li, H.; Qiao, P.; Gui, J. An influence study on the new energy automobile enterprise performances by government subsidies-based on the enterprise growth. Sci. Technol Prog. Policy 2017, 34, 114–120. [Google Scholar] [CrossRef]
  32. Wang, Z.; Zhao, C.; Yin, J.; Zhang, B. Purchasing intentions of Chinese citizens on new energy vehicles: How should one respond to current preferential policy? J. Clean. Prod. 2017, 161, 1000–1010. [Google Scholar] [CrossRef]
  33. Adolfo, P.A.; Arnaud, M. Cost and CO2 aspects of future vehicle options in Europe under new energy policy scenarios. Energy Policy 2010, 38, 7142–7151. [Google Scholar]
  34. Gao, W.; Hu, X. New energy vehicle policy effect: Does scale or innovation serve as an intermediary? Sci. Res. Manag. 2020, 41, 32–44. [Google Scholar]
  35. Wang, S.; Li, C.; Hu, Y.; Wang, H.; Xu, G.; Zhao, G.; Wang, S. Assessing the prospect of bio-methanol fuel in China from a life cycle perspective. Fuel 2024, 358, 130255. [Google Scholar] [CrossRef]
  36. Yu, Y.; Zhou, D.; Zha, D.; Wang, Q.; Zhu, Q. Optimal production and pricing strategies in auto supply chain when dual credit policy is substituted for subsidy policy. Energy 2021, 226, 120369. [Google Scholar] [CrossRef]
  37. Li, J.; Ku, Y.; Liu, C.; Zhou, Y. Dual credit policy: Promoting new energy vehicles with battery recycling in a competitive environment? J. Clean. Prod. 2020, 243, 118456. [Google Scholar] [CrossRef]
  38. Luo, Q.; Yin, Y.; Chen, P.; Zhan, Z.; Saigal, R. Dynamic subsidies for synergistic development of charging infrastructure and electric vehicle adoption. Transp. Policy 2022, 129, 117–136. [Google Scholar] [CrossRef]
  39. Meng, W.; Ma, M.; Li, Y.; Huang, B. New energy vehicle R&D strategy with supplier capital constraints under China’s dual credit policy. Energy Policy 2022, 168, 113099. [Google Scholar]
  40. Lin, B.; Jia, Z. Economic, energy and environmental impact of coal-to-electricity policy in China: A dynamic recursive CGE study. Sci. Total Environ. 2020, 698, 134241. [Google Scholar] [CrossRef]
  41. Jia, T.; Li, C.; Wang, H.; Hu, Y.J.; Wang, S.; Xu, G.; Hoang, A.T. Subsidy policy or dual-credit policy? Evolutionary game analysis of green methanol vehicles promotion. Energy 2024, 293, 130763. [Google Scholar] [CrossRef]
  42. Hutabarat, C.; Suharyono, S.; Utami, H.N.; Prasetya, A. Servant leadership, business transformation, and corporate competitiveness. J. Asian Financ. Econ. Bus. 2021, 8, 1091–1099. [Google Scholar]
  43. Zhu, Z.; Zhu, Z.; Xu, P.; Xue, D. Exploring the impact of government subsidy and R&D investment on financial competitiveness of China’s new energy listed companies: An empirical study. Energy Rep. 2019, 5, 919–925. [Google Scholar]
  44. Verhoeven, D.; Baker, J.; Veugelers, R. Measuring technological novelty with patent-based indicators. Res. Policy 2016, 45, 707–723. [Google Scholar] [CrossRef]
  45. Milani, S.; Neumann, R. R&D, patents, and financing constraints of the top global innovative firms. J. Econ. Behav. Organ. 2022, 196, 546–567. [Google Scholar]
  46. Cheng, H.; Zhang, Y.; Zhang, Z. Support the stronger or the weaker? Influence each other between subsidies and enterprise innovation. Technol. Anal. Strateg. Manag. 2023, 35, 1–16. [Google Scholar] [CrossRef]
  47. Chen, Q.; Li, C. The Green Paradox in NEV Manufacturing: Regulatory Impacts on Innovation from a Stakeholder Perspective. Energies 2024, 17, 3508. [Google Scholar] [CrossRef]
  48. Li, B.; Chen, Y.; Cao, S. Carrot and stick: Does dual-credit policy promote green innovation in auto firms? J. Clean. Prod. 2023, 403, 136863. [Google Scholar] [CrossRef]
  49. Wang, L.; Zhang, F.; Wang, J. Analysis of Intellectual Property Rights of New Energy Vehicles in China Based on Big Data Technology. In Proceedings of the 2022 IEEE International Conference on Industrial IoT, Big Data and Supply Chain (IIoTBDSC), Virtual, 23–25 September 2022; pp. 168–172. [Google Scholar]
  50. Shi, Y.; Wang, H.; Li, C.; Negnevitsky, M.; Wang, X. Stochastic optimization of system configurations and operation of hybrid cascade hydro-wind-photovoltaic with battery for uncertain medium- and long-term load growth. Appl. Energy 2024, 364, 123127. [Google Scholar] [CrossRef]
  51. Shao, W.; Yang, K.; Bai, X. Impact of financial subsidies on the R&D intensity of new energy vehicles: A case study of 88 listed enterprises in China. Energy Strategy Rev. 2021, 33, 100580. [Google Scholar]
  52. Oelly, S.; Pakes, A. The dynamics of productivity in the telecommunications equipment industry. Econometrica 1992, 65, 292–332. [Google Scholar]
  53. Levinsohn, J.; Petrin, A. Estimating production functions using inputs to control for unobservables. Rev. Econ. Stud. 2003, 70, 317–341. [Google Scholar] [CrossRef]
  54. Wen, Z.; Ye, B. Analyses of mediating effects: The development of methods and models. Adv. Psychol. Sci. 2014, 22, 731. [Google Scholar] [CrossRef]
  55. Khazaei, M. Relationship of profitability of world’s top companies with entrepreneurship, competitiveness, and business environment indicators. Appl. Econ. 2021, 53, 2584–2597. [Google Scholar] [CrossRef]
  56. Xia, P.; Cheng, W.; Gao, Y. The impact of privatization of state-owned enterprises on innovation in China: A tale of privatization degree. Technovation 2022, 118, 317–341. [Google Scholar]
  57. Yi, Y.; Zhang, M.; Zhang, A.; Li, Y. Fuel consumption and carbon emission reduction strategies in a fuel vehicle supply chain under auto double credit policy and carbon social responsibility. Environ. Dev. Sustain. 2023; 1–38. [Google Scholar]
  58. Stokes, L.C.; Breetz, H.L. Politics in the U. S. energy transition: Case studies of solar, wind, biofuels and electric vehicles policy. Energy Policy 2018, 113, 76–86. [Google Scholar] [CrossRef]
Figure 1. Stages in the development of new energy policies.
Sustainability 16 06991 g001
Figure 2. Mechanisms of industrial policy and innovation.
Sustainability 16 06991 g002
Figure 3. Example of credit for NEV enterprises (2023).
Sustainability 16 06991 g003
Figure 4. NEV production and sales of major listed companies (2022).
Sustainability 16 06991 g004
Figure 5. The production and sales of China’s automobile industry in 2022 (data source from China Association of Automobile Manufacturers (CAAM)).
Sustainability 16 06991 g005
Figure 6. The No. of patent applications and the proportion of invention patents.
Sustainability 16 06991 g006
Figure 7. Dual Credit Carryover rules.
Sustainability 16 06991 g007
Figure 8. Parallel trend test of sample firms.
Sustainability 16 06991 g008
Figure 9. Summary of findings.
Sustainability 16 06991 g009
Table 1. Variable definitions and descriptions.
Type of VariableIndicator SymbolIndicator NameIndicator Meaning and Method of Calculation
Dependent
variables
TFP_LPTotal factor productivityEnterprise total factor productivity calculated by the LP method
Explanatory variableDCPDual Credit Policy1 in the year of policy implementation, 0 in the year of no policy implementation
Mediating variableinventionInnovation capacityNumber of invention-based patent applications takes logarithm
Control variableageAge of enterprisesYears of enterprise taking logarithmic values
leverFinancial leverageTotal liabilities/total assets
maenterprise market capitalizationEnterprise market capitalization taken as logarithm
top1Shareholding of the first major shareholderShareholding ratio of the largest shareholder
soeNature of ownership1 for state-owned enterprises, 0 for non-state-owned enterprises
epuEconomic policy uncertaintyChina’s economic policy uncertainty index compiled by Baker
roaReturn on assetsNet profit/total assets
Table 2. Descriptive statistics of variables.
VariablesNMeanSDMinMedianMax
TFP_LP4609.2601.1515.4629.15911.370
invention4244.0922.0070.0003.9899.444
ma46014.1021.29010.64113.89018.100
roa4600.0310.079−0.6720.0370.445
top146033.76314.9229.54029.77083.410
lever4600.5600.1770.1250.5611.698
epu4606.0420.5924.8176.1326.674
age4603.0160.3901.9462.9964.804
Table 3. Correlation analysis.
TFP_LPDCPInventionmaroatop1leverepuageNEV
TFP_LP1.000
DCP0.135 ***1.000
invention0.749 ***0.109 **1.000
ma0.717 ***−0.0370.714 ***1.000
roa0.287 ***−0.131 ***0.083 *0.251 ***1.000
top10.260 ***−0.082 *0.183 ***0.212 ***0.0411.000
lever0.268 ***0.114 **0.322 ***0.081 *−0.391 ***0.117 **1.000
epu0.125 ***0.814 ***0.113 **−0.015−0.145 ***−0.097 **0.128 ***1.000
age0.318 ***0.213 ***0.337 ***0.390 ***−0.0750.0260.211 ***0.232 ***1.000
NEV0.383 ***−0.0390.315 ***0.237 ***0.0080.351 ***0.334 ***−0.0420.265 ***1.000
Note: *, **, and ***, respectively, indicate the 10%, 5%, and 1% significance levels.
Table 4. Baseline regression results.
TFP_LPDCPmaroatop1leverepuAgeYearFirmN R 2
(1)0.387 *** yesyes4600.124
(7.540)
(2)0.308 ***0.278 ***2.970 ***−0.0051.0160.0690.177yesyes4600.353
(3.790)(5.820)(7.540)(−1.030)(3.750)(0.345)(0.560)
Note: *** indicate 1% significance levels.
Table 5. Regression results of moderating effects.
(1)(2)(3)(4)
VariablesInventionInventionTFP_LPTFP_LP
DCP0.664 ***0.484 ***0.161 ***0.109 ***
(7.510)(3.180)(5.900)(4.350)
invention 0.266 ***0.266 ***
(5.370)(3.610)
ma 0.352 *** 0.222 ***
(3.890) (5.050)
roa −0.050 2.767 ***
(−0.036) (7.390)
top1 −0.009 −0.005
(−0.950) (−1.21)
lever 1.730 *** 1.664 ***
(3.190) (6.340)
epu 0.552 *** −0.001
(4.100) (−0.010)
lnage −2.098 *** 0.136
(−3.5) (0.470)
yearyesyesyesyes
firmyesyesyesyes
N424426426426
R 2 0.1340.2400.2160.424
Note: *** indicate the 1% significance levels.
Table 6. The result of the difference-in-differences model.
TFP_LPDCP × NEVmaroatop1leverepuAgeYearFirmN R 2
(1)−0.566 *** yesyes4600.207
(−5.420)
(2)−0.458 ***0.335 ***2.562 ***−0.0050.7430.462−0.534yesyes4600.407
(−3.690)(3.780)(4.560)(−0.480)(0.810)(2.460)(−0.670)
Note: *** indicate the 1% significance levels.
Table 7. Results of heterogeneity analysis of firms with different ownership.
TFP_LPDCPInventionmaroatop1leverepuAgeYearFirmN R 2
soe0.267 ***0.149 ***0.287 ***3.661 ***−0.017 ***3.622 ***0.132 *−0.818 **yesyes2360.602
(3.050)(4.480)(4.420)(5.380)(−3.280)(9.180)(1.710)(−2.050)
Non
-soe
0.228 **0.100 ***0.202 ***1.858 ***0.022 ***0.35−0.1201.126 ***yesyes1880.407
(2.100)(2.980)(3.730)(4.270)(3.170)(1.050)(−1.200)(2.890)
Note: *, **, and ***, respectively, indicate the 10%, 5%, and 1% significance levels.
Table 8. Regression results on regional economic development levels.
Eastern RegionCentral RegionWestern Region
VariablesTFP_LPInventionTFP_LPTFP_LPInventionTFP_LPTFP_LPInventionTFP_LP
DCP0.317 ***0.460 **0.280 ***0.320 ***0.670 **0.212 *0.1540.6260.091
(2.790)(2.460)(2.720)(2.870)(2.160)(1.850)(1.090)(1.390)(0.650)
invention 0.114 *** 0.124 *** 0.101
(3.130) (3.290) (1.850)
ma0.332 ***0.404 ***0.258 ***0.214 ***0.527 **0.1090.1400.3030.110
(5.170)(3.790)(4.310)(2.720)(2.450)(1.360)(1.240)(0.840)(1.00)
roa3.175 ***−1.8033.432 ***2.270 ***−0.5272.399 ***1.7708.001 **0.957
(5.480)(−1.680)(5.840)(4.410)(−0.380)(4.860)(1.590)(2.260)(0.830)
top1−0.008−0.030 **−0.005−0.009−0.012−0.016 **0.006−0.0340.009
(−1.020)(−2.320)(−0.660)(−1.390)(−0.590)(−2.130)(0.720)(−1.340)(1.170)
lever0.843 **0.1222.038 ***1.111 ***1.1670.977 **1.776 ***9.622 ***0.799
(2.190)(0.170)(5.230)(2.690)(1.070)(2.470)(3.490)(5.920)(1.110)
epu0.0780.601 ***−0.0070.0870.4970.021−0.0390.566−0.097
(0.770)(3.630)(−0.080)(0.850)(1.790)0.210(−0.330)(1.480)(−0.810)
age0.372−2.376 ***0.320−0.519−2.216−0.2930.850−1.3470.986 **
(0.820)(−3.140)(0.760)(−1.010)(−1.630)(−0.590)(1.910)(−0.950)(2.280)
yearyesyesyesyesyesyesyesyesyes
firmyesyesyesyesyesyesyesyesyes
N298268268119113113434343
R 2 0.3730.2750.4410.4440.2510.500.4900.5990.544
Note: *, **, and ***, respectively, indicate the 10%, 5%, and 1% significance levels.
Table 9. Regression results with replacement of total factor productivity.
(1)(2)(3)
VariablesTFP_OLSInventionTFP_OLS
DCP0.346 ***2.057 ***0.135 ***
(3.371)(2.790)(4.570)
invention 0.297 ***
(3.450)
ma0.346 ***0.709 ***0.282 ***
(6.310)(9.160)(5.470)
roa3.027 ***−0.4852.910 ***
(6.690)(−0.630)(6.640)
top1−0.0060.004−0.007
(−1.310)(0.620)(−1.35)
lever1.345 ***1.727 ***2.197 ***
(4.330)(3.590)(7.150)
epu0.073−1.110 **0.001
(0.880)(−2.440)(0.010)
age0.2510.5150.157
(0.690)(1.490)(0.460)
yearyesyesyes
firmyesyesyes
N460424424
R 2 0.3640.2710.440
Note: ** and ***, respectively, indicate the 5%, and 1% significance levels.
Disclaimer/Publisher’s Note: The statements, opinions and data contained in all publications are solely those of the individual author(s) and contributor(s) and not of MDPI and/or the editor(s). MDPI and/or the editor(s) disclaim responsibility for any injury to people or property resulting from any ideas, methods, instructions or products referred to in the content.

