
Community Resilience Evaluation and Construction Strategies in the Perspective of Public Health Emergencies: A Case Study of Six Communities in Nanjing

Abstract
:1. Introduction
2. Literature Review
2.1. Resilience Theory
2.2. Resilience Assessment
3. Materials and Methods
3.1. Evaluation System
3.2. Weights
4. Samples and Results
4.1. Study Area
- Suojin Village Community (I) is established in the 1980s, the community covers an area of 0.45 square kilometers and has a population of 12,000. It located in the central part of Xuanwu District, bordered by Xuanwu Lake Street to the east, Taipingmen and Houzaimen Street to the south, Xuanwu Lake and Xuanwumen Street to the west, and the Shanghai–Nanjing Railway and Hongshan Street to the north.
- Bancang Community (II) was established in the 1980s, covering an area of 0.28 square kilometers with a population of 6800. It is bordered by the Purple Mountain to the south, Jiangwangmiao Community to the east, Xuanwu Lake to the west, and is adjacent to Suojincun Street.
- Zixincheng Community (III) was established in the 1980s, covering an area of 0.35 square kilometers with a population of 6000. It is bordered by Purple Mountain to the east, Xuanwu Lake to the west, Baima Park and Bei’anmen Street to the south, and Ningxi Road to the north.
- Jiangwangmiao Community (IV) was established in the 1990s, covering an area of 0.32 square kilometers with a population of 6000. It is bordered by Ningxi Road to the south, National Highway 312 to the west, and Huaxin West Road to the north.
- Huayuan Road Community (V) was established in the 1990s, covering an area of 0.47 square kilometers with a population of 13,700. Garden Road runs through the community, which is bordered by Huaxin West Road to the east, Nanjing Forestry University to the west, Garden Road Neighborhoods 5 and 8 to the south, and Xuanwu Avenue to the north.
- Yingtie Village Community (VI) was established in the 1990s, covering an area of 0.57 square kilometers with a population of 13,000. It is bordered by the Jingwu Overpass to the east, Yingtuo Huayuan Road Community to the south, the East Long-Distance Bus Station to the west, and Xuanwu Avenue to the north.
4.2. Resilience Evaluation Results
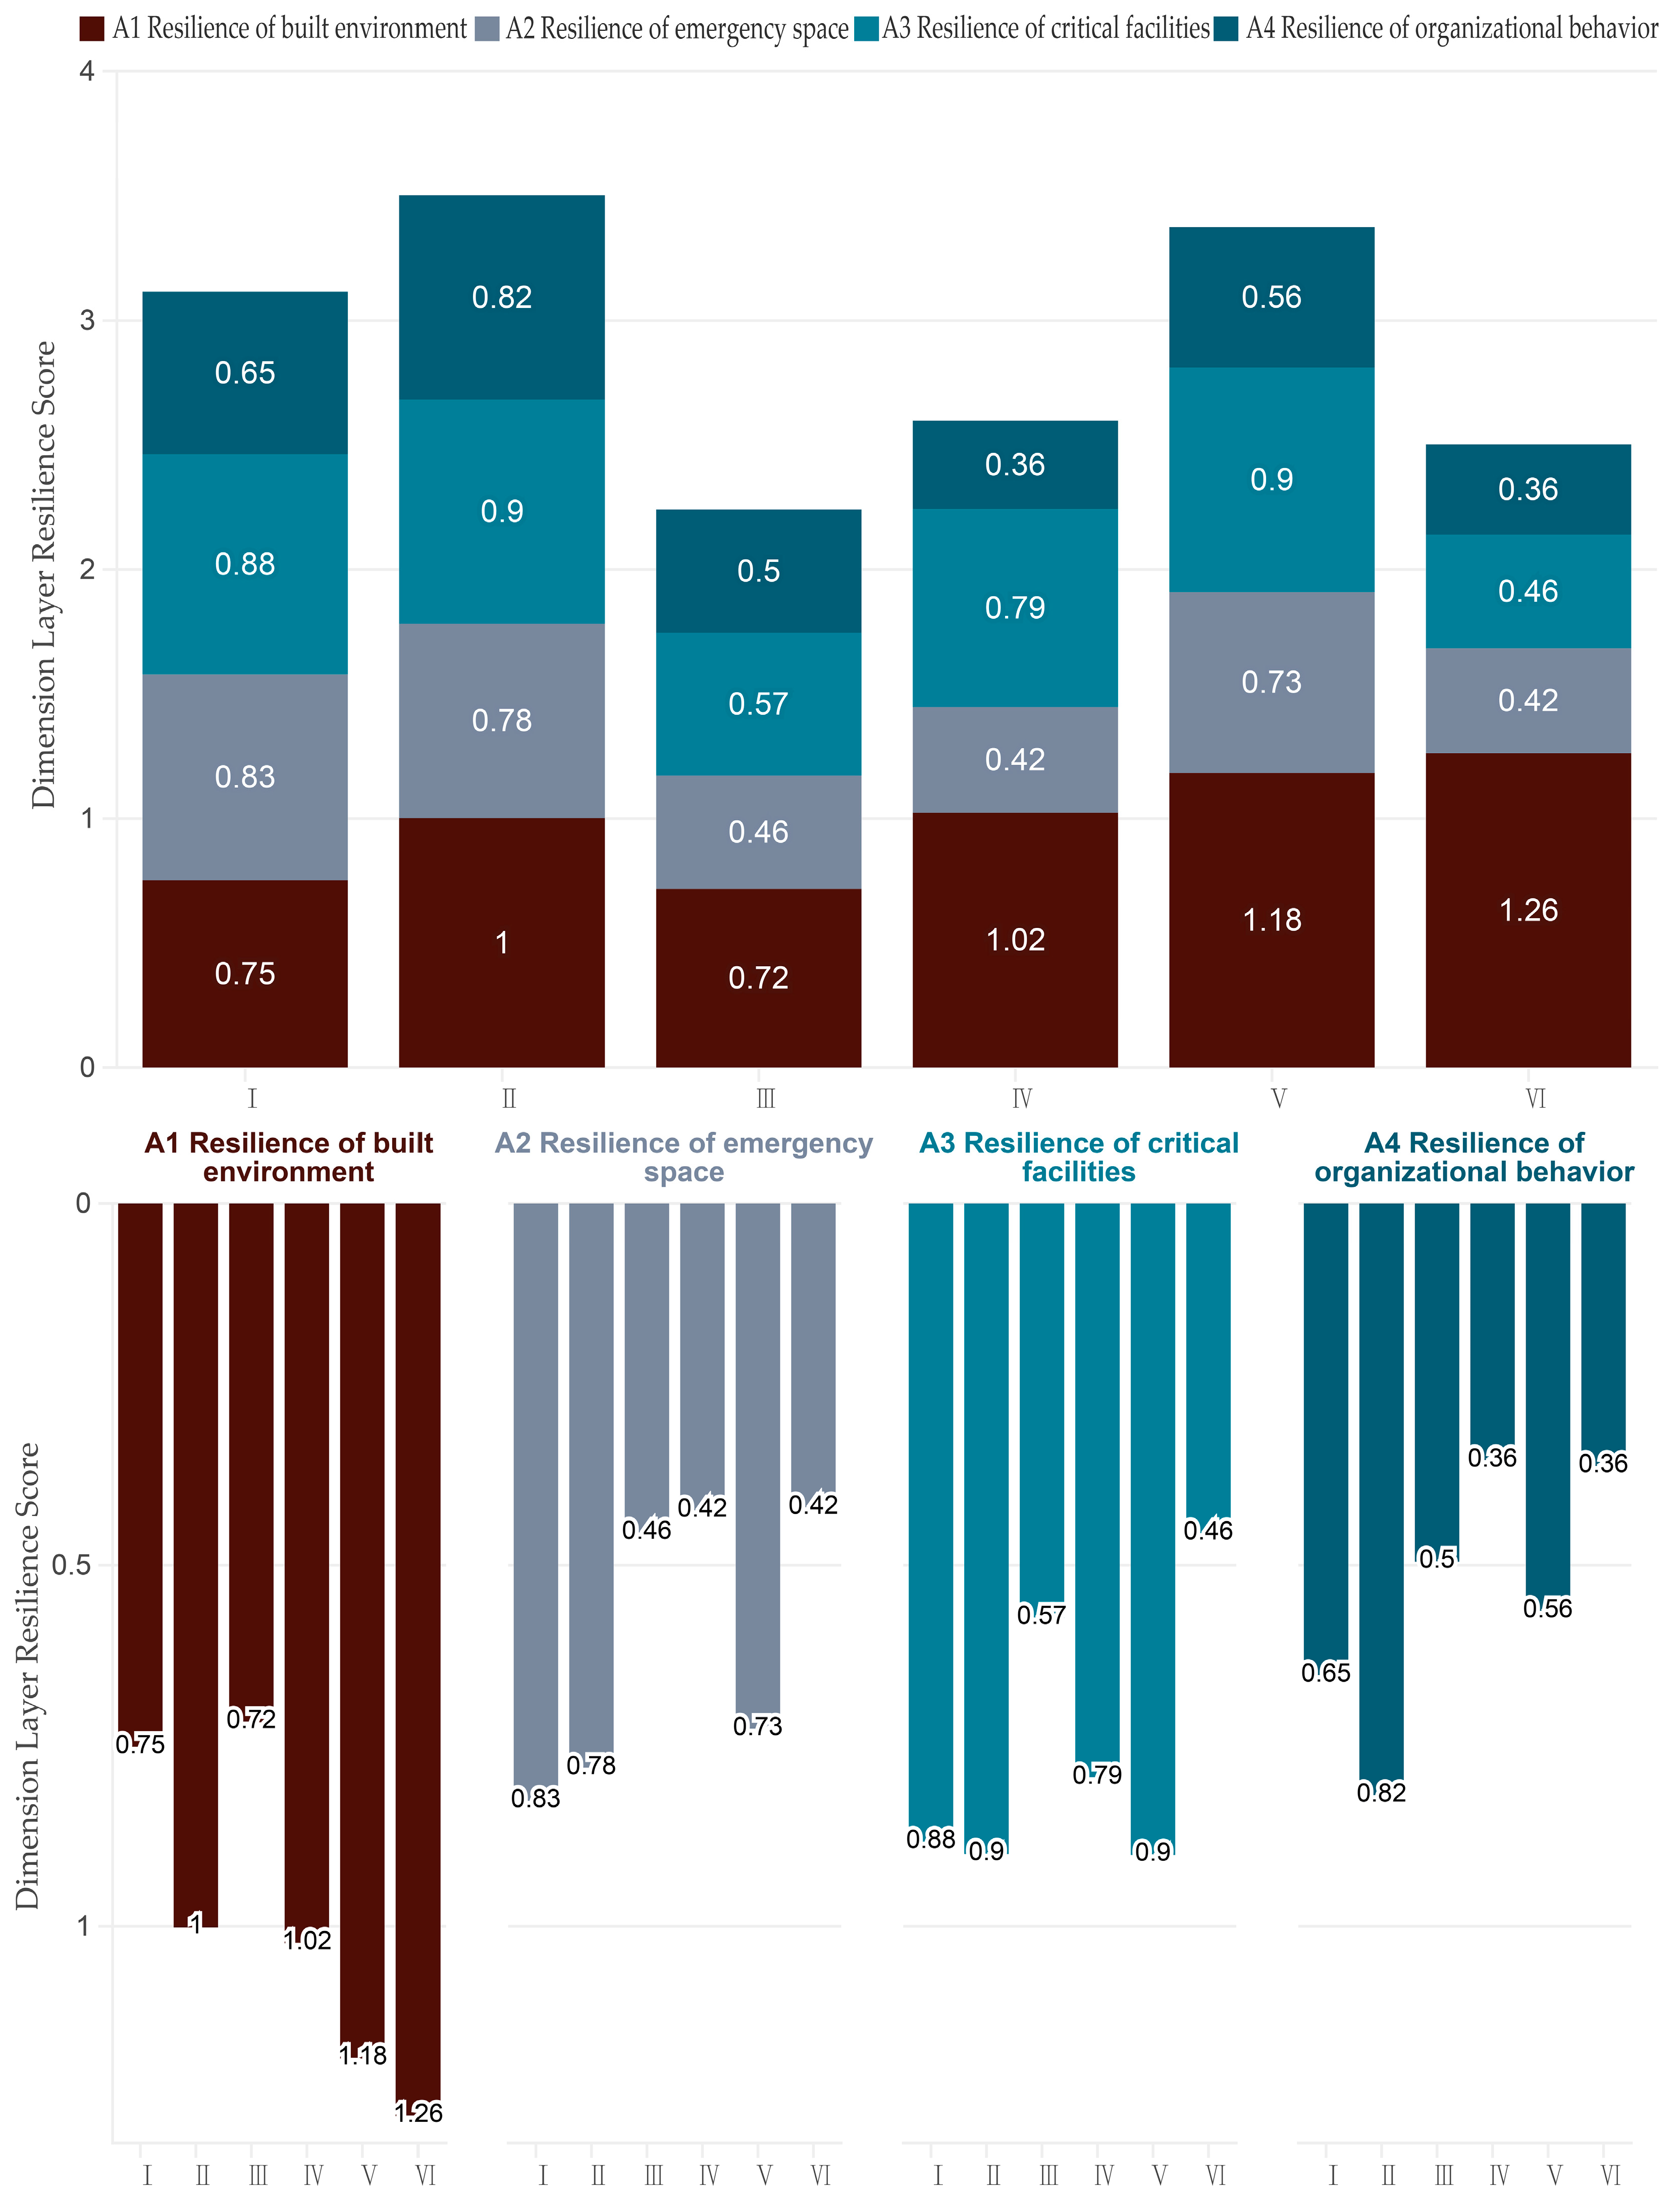
4.2.1. First-Level Indicator
4.2.2. Second-Level Indicator
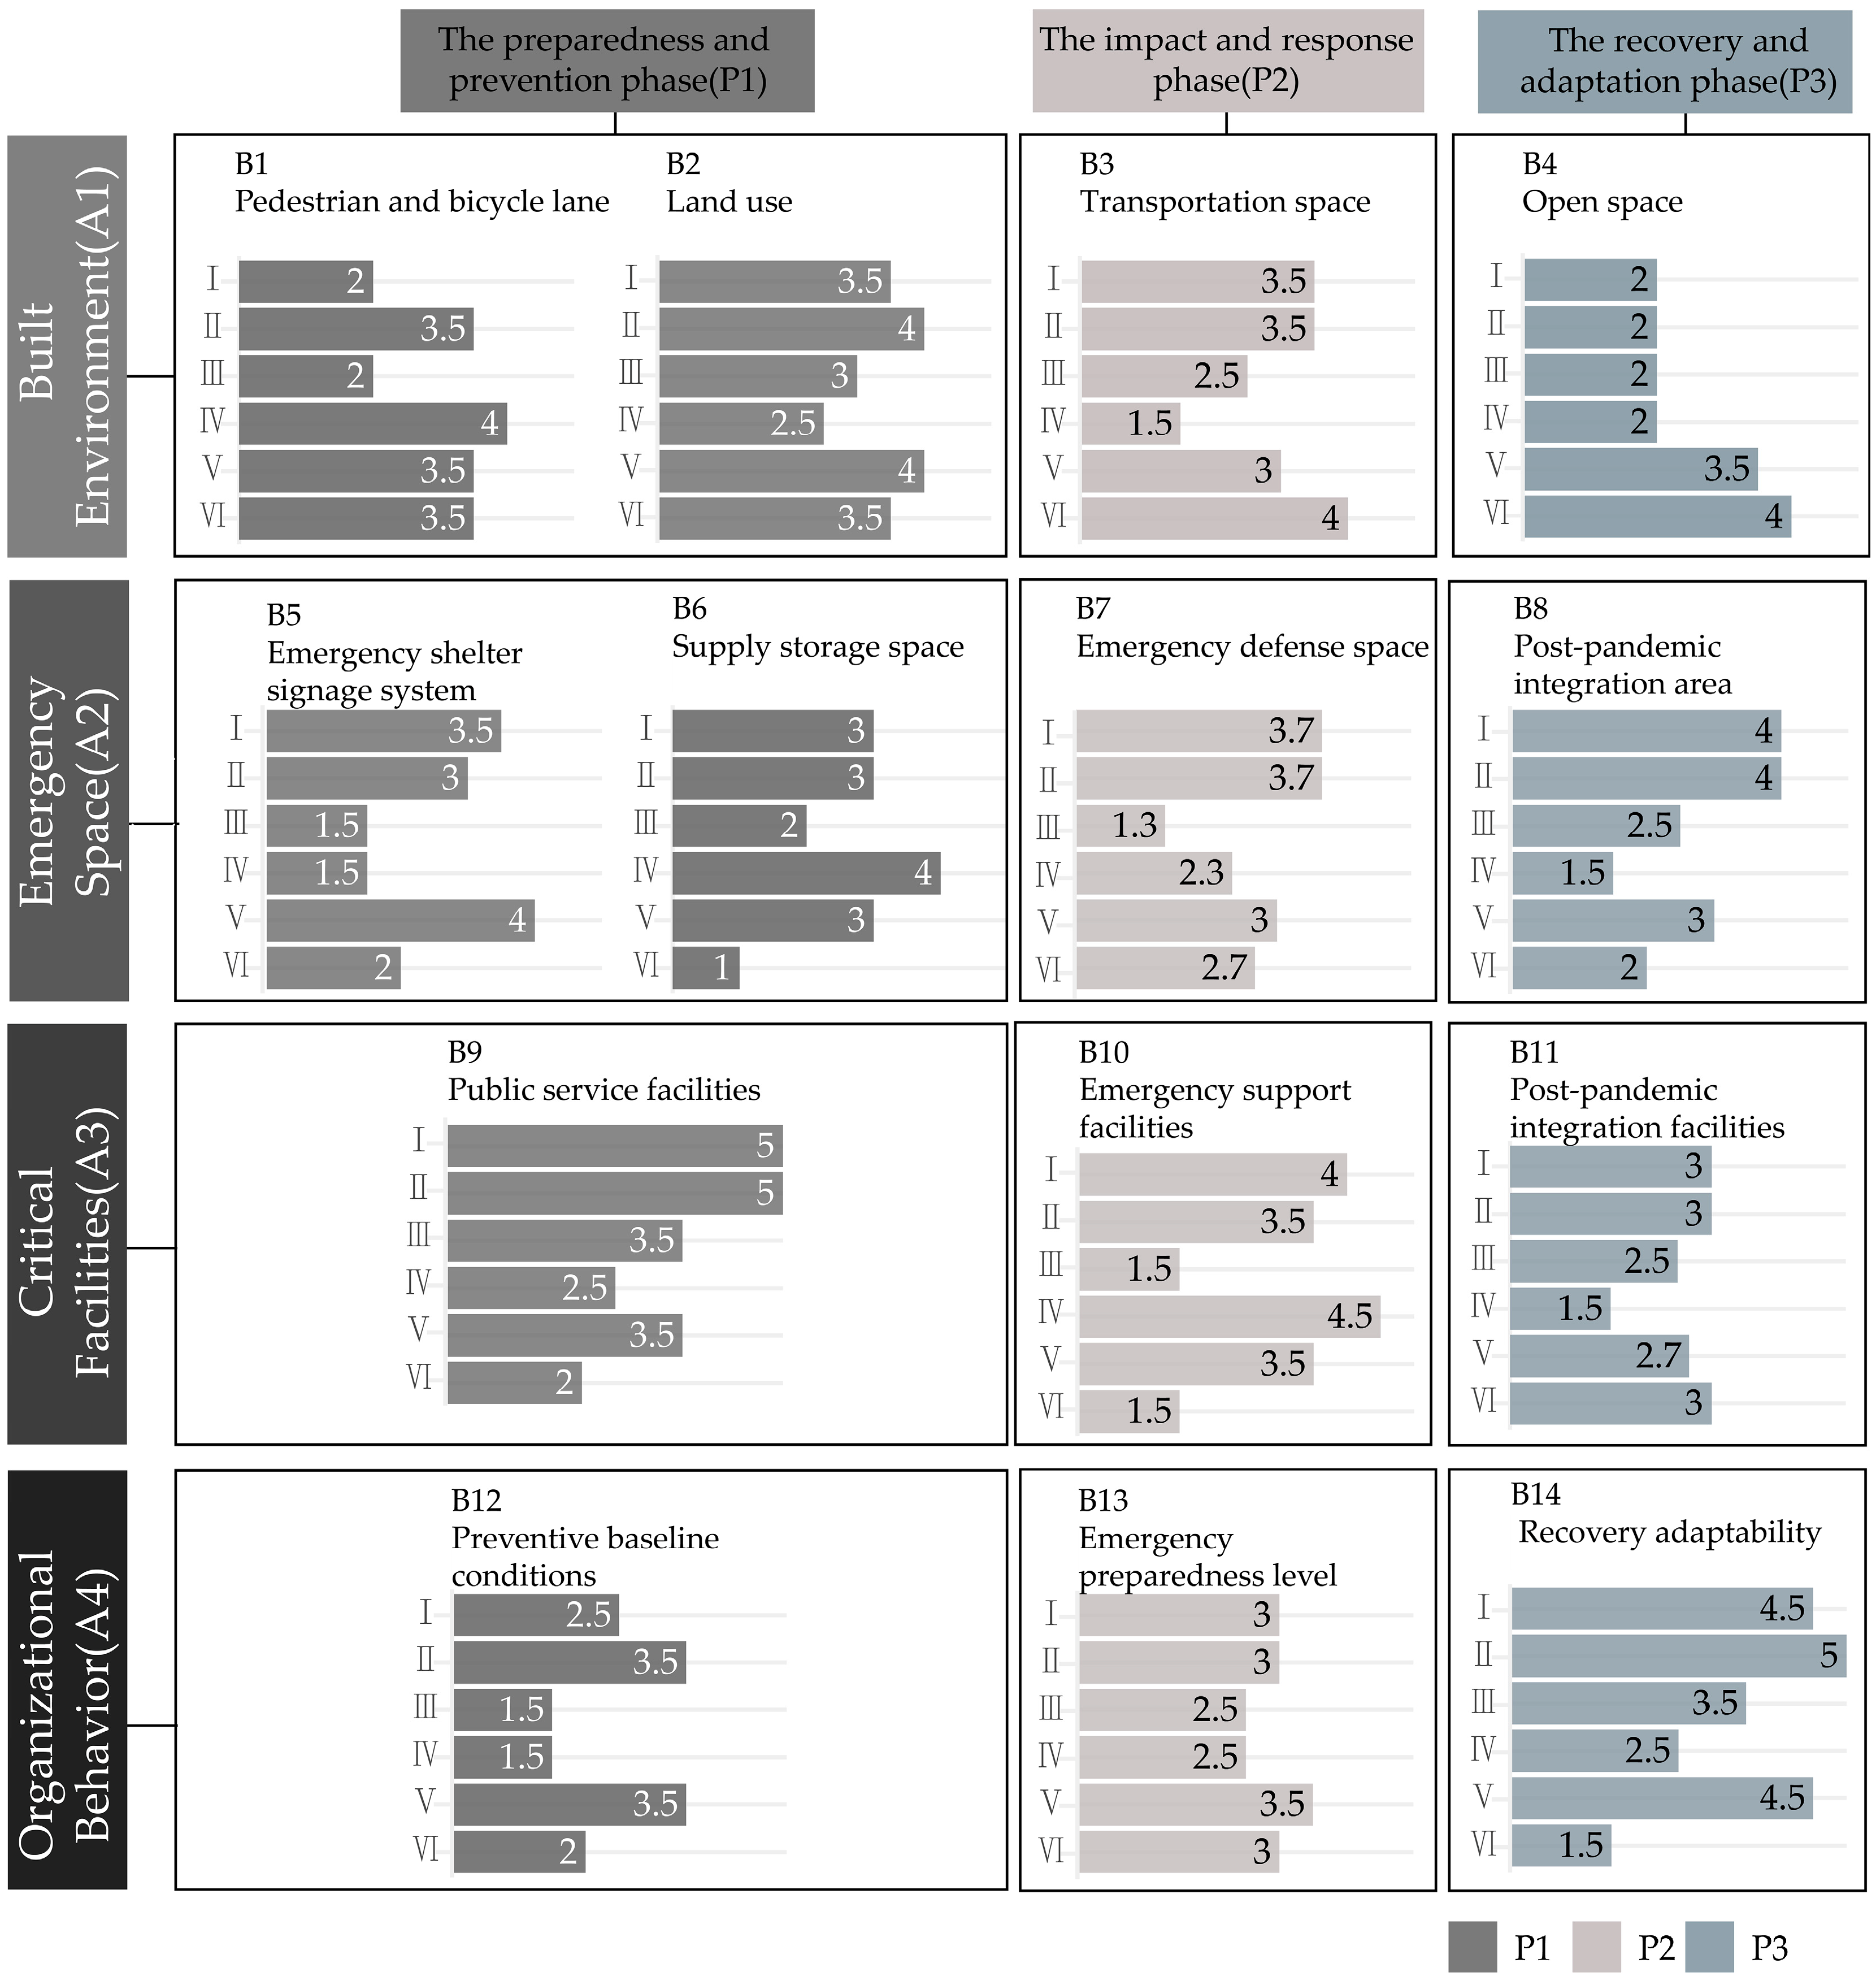
4.2.3. Third-Level Indicator
4.3. Validity and Reliability of the Empirical Results
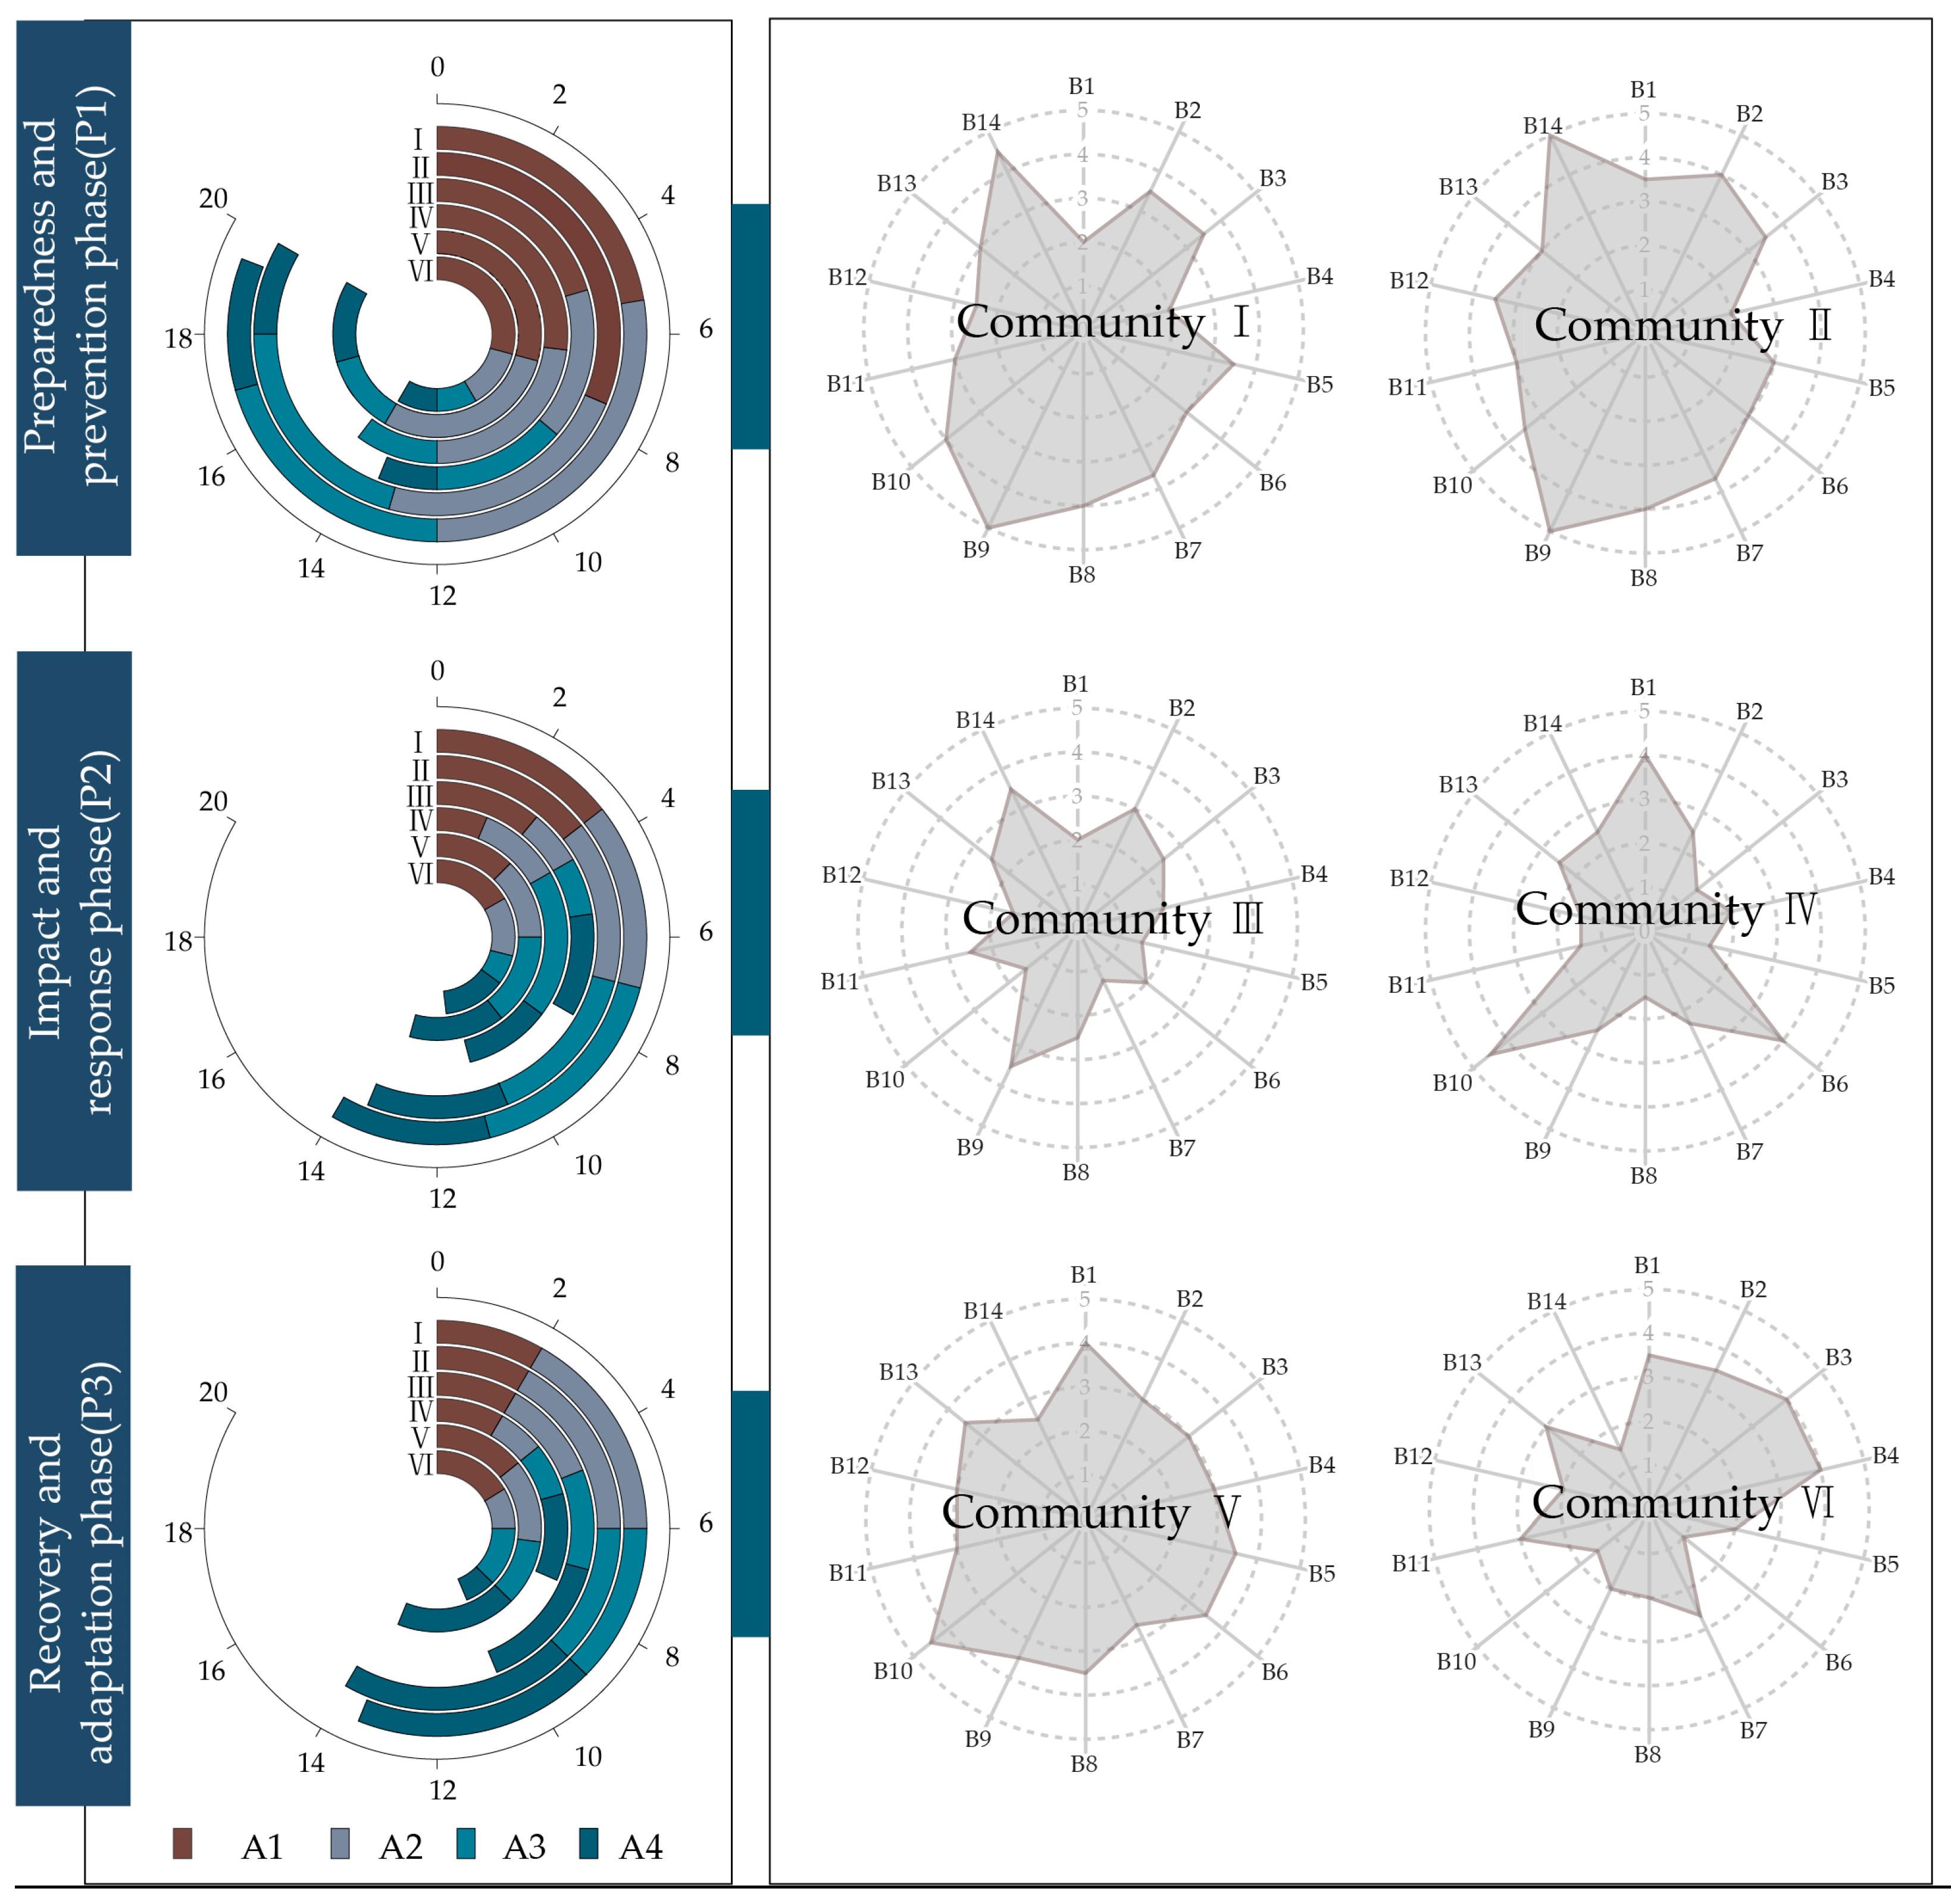
- Suojin Village Community (I) established an efficient information communication mechanism to ensure that residents were kept up to date with the latest pandemic developments. Among the interviewed residents, there was widespread satisfaction with the community’s pandemic prevention and control performance. However, it performs poorly in pedestrian and bicycle lane (B1). Thus, it is advised that the walking and cycling systems be improved, the public transit system be made more accessible, the transportation network and transfer facilities be laid out sensibly, and the environment for slow traffic be improved in the ensuing resilience enhancement construction. Furthermore, the community slow traffic road system’s design and optimization must be combined in order to offer adaptable motor vehicle management plans, such as restricting parking during public health emergencies to lower safety risks.
- Bancang Community (II) performs well in public service facilities (B9) and recovery adaptability (B14). Residents expressed universal satisfaction with the community’s pandemic prevention and control performance: during the pandemic, the town plaza was rapidly converted into an emergency center, significantly slowing the spread of the virus. However, it performs poorly in open space (B4). Thus, it is advised that open green spaces be used for more purposes and that outdoor activity areas be planned with consideration for the local climate and the demands of the occupants throughout the ensuing resilience enhancement construction. In addition, it may guarantee comfortable slow traffic by improving the accessibility and connection of public areas like parks and block green areas. Simultaneously, adjust the spatial layout in accordance with the requirements of the inhabitants, such as by including rest spaces and lights in the park, to provide a better open area for everyday community activities.
- Zixincheng Community (III) performs poorly in emergency support facilities (B10). The majority of the citizens were dissatisfied with the community’s pandemic prevention and control performance. It is recommended to improve the configuration of medical equipment to ensure meeting various medical needs. Balanced layout and adding facilities to fill gaps and expand service coverage are essential. Additionally, establishing a 15-min disaster prevention and epidemic prevention zone and increasing facilities such as health stations can enhance epidemic prevention capabilities.
- Jiangwangmiao Community (IV) performs poorly in transportation space (B3). It is recommended to optimize the punctuality of public transportation and integrate non-motorized transportation, increase the density of bus stops, and reduce waiting times. Additionally, it is crucial to strategically allocate public transportation, medical facilities, and open spaces, establish a network of slow traffic and life services covering the community, and promote the development of a healthy community.
- Huayuan Road Community (V) performs poorly in emergency defense space (B7). It is recommended to optimize emergency shelters to respond to public health emergencies. It is suggested to establish construction standards that match the community, renovate public buildings to meet disaster response needs, and consider public and commercial facilities as potential shelters. Establishing and updating relevant databases for the rapid conversion of space use is also recommended.
- Yingtie Village Community (VI) performs poorly in supply storage space (B6). It is recommended to improve community emergency material reserves by establishing dedicated storage facilities. Implementing efficient material storage and rotation systems, and integrating community resources to optimize emergency provisioning, are crucial steps. Ensuring the seamless supply and utilization of materials in both emergency and normal situations, covering all residents and organizations, will enhance emergency response capabilities.
5. Discussion
5.1. Optimization Strategy from a Full Cycle Perspective
5.1.1. Optimization Strategy for Preparation and Prevention Phase
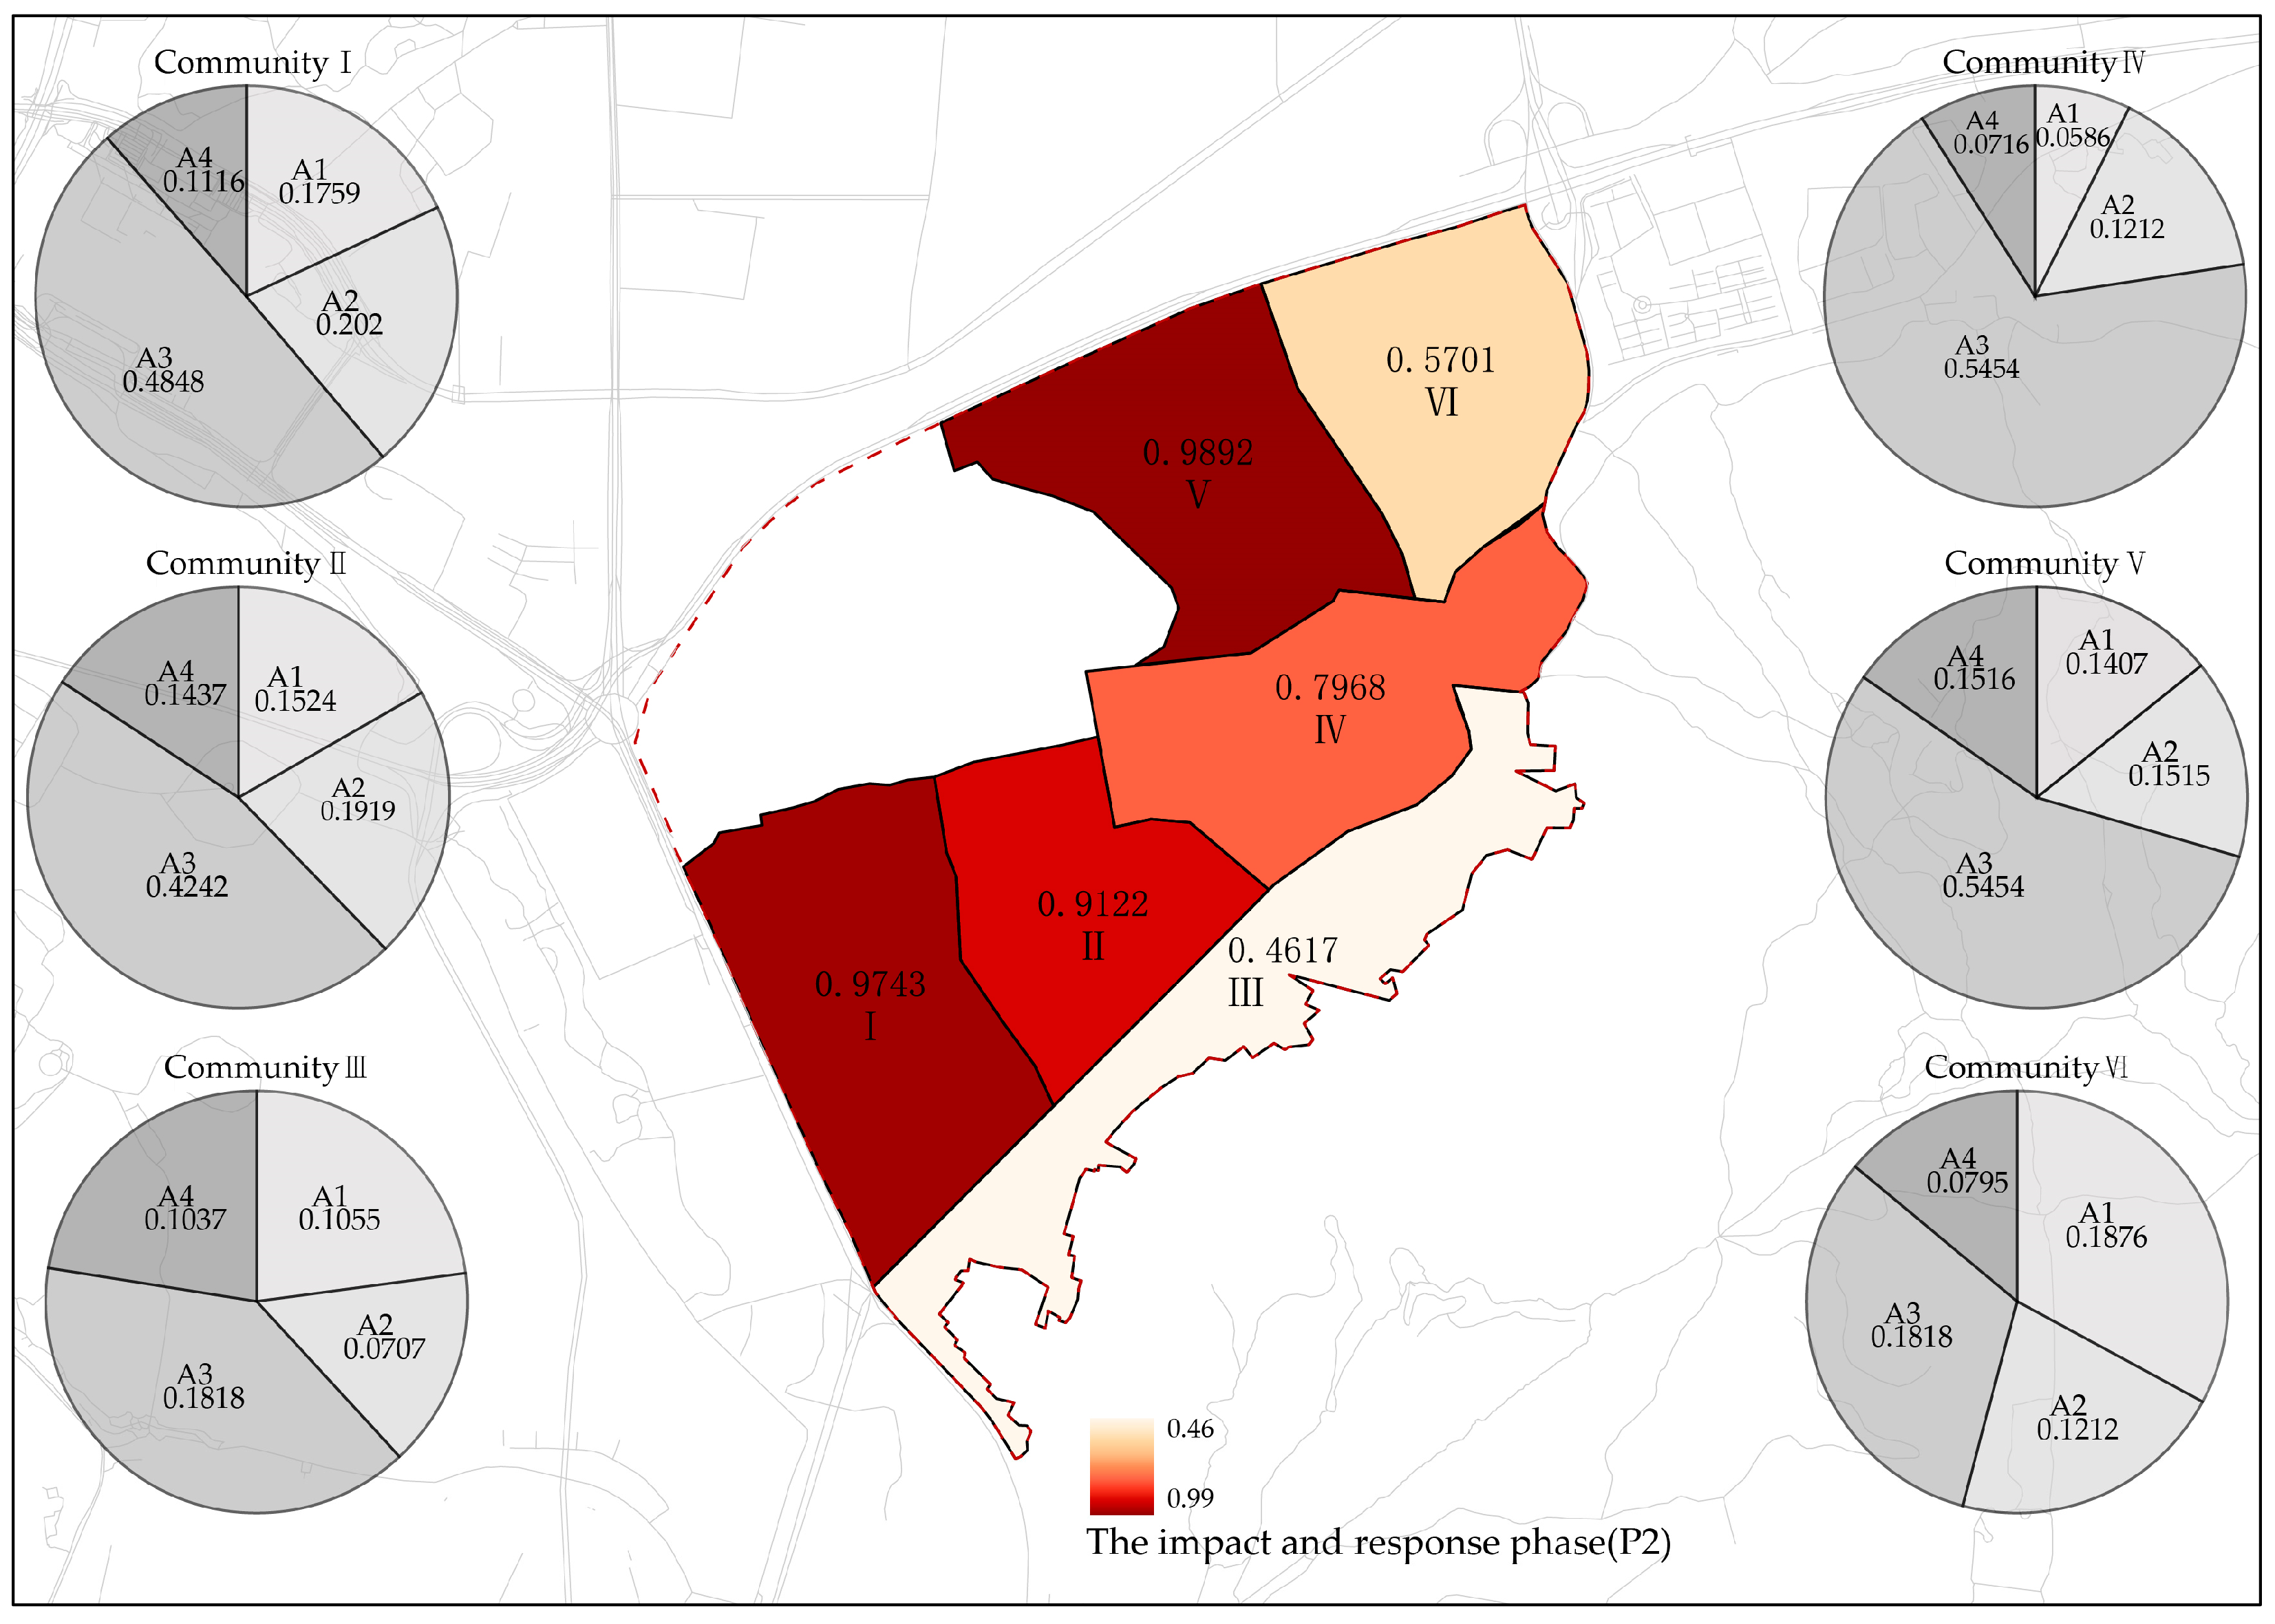
5.1.2. Optimization Strategy for Impact and Response Phase
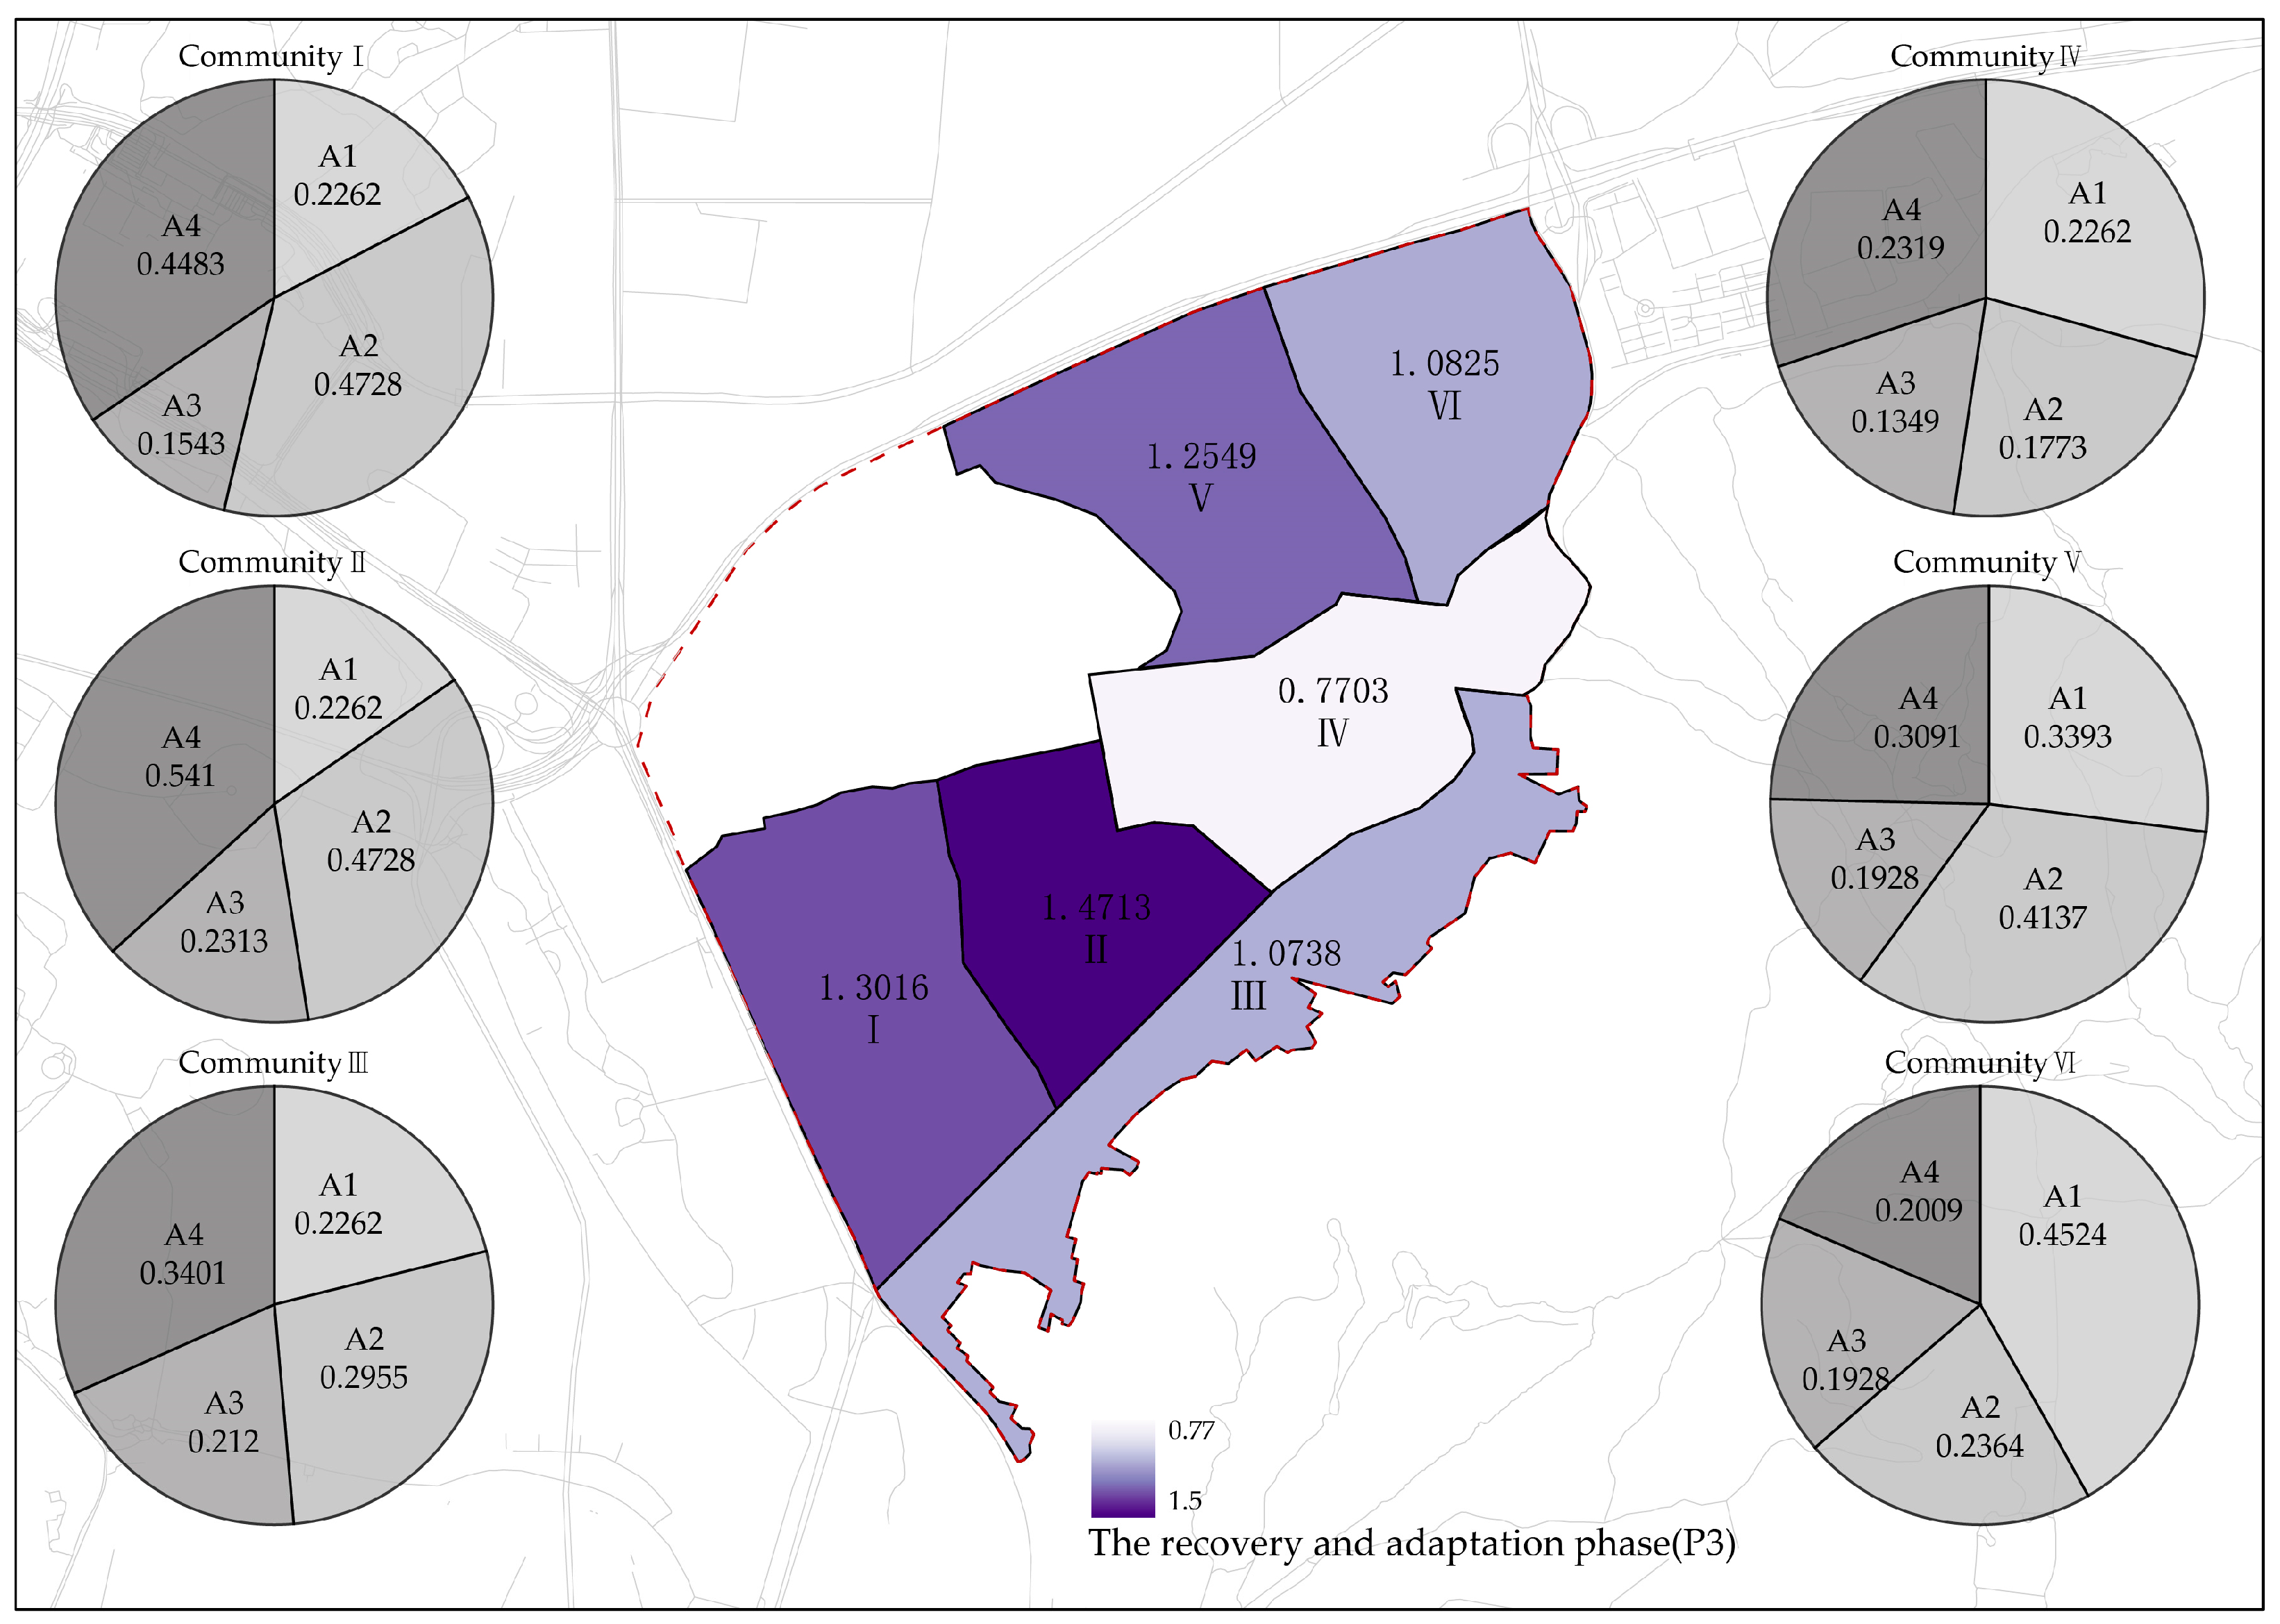
5.1.3. Optimization Strategy for Recovery and Adaptation Phase
5.2. Practical Application in Real-World Circumstances
5.3. Limitations of the Study
6. Conclusions
Author Contributions
Funding
Institutional Review Board Statement
Informed Consent Statement
Data Availability Statement
Acknowledgments
Conflicts of Interest
Appendix A

| Source | Website Link | |
|---|---|---|
| New and used community data | https://www.weibo.com/ (accessed on 8 August 2022) | |
| https://mp.weixin.qq.com/ (accessed on 8 August 2022) | ||
| Evaluation questionnaire data | Questionnaire network | https://www.wenjuan.com/ (accessed on 5 February 2024) |
| Software and algorithms | Analytic Hierarchy Process | https://spssau.com/ (accessed on 23 March 2024) |
| Python | https://www.python.org/downloads/ (accessed on 8 August 2022) | |
| Auto CAD | http://www.autodesk.com.cn/ (accessed on 13 May 2022) | |
| Excel | https://www.microsoft.com/zh-cn/microsoft-365/excel (accessed on 23 February 2024) | |
| ArcGIS | https://www.esri.com/en-us/arcgis/products/arcgis-pro/resources (accessed on 23 March 2024) | |
| Space syntax | https://spacesyntax.com/ (accessed on 23 March 2024) | |
References
- Wu, Z.Q.; Feng, F.; Lu, F. Space design for urban resilience. Time Archit. 2020, 4, 84–89. [Google Scholar] [CrossRef]
- Wu, Z.Q.; Lu, F.; Yang, T.; Feng, F. Challenges for urban space governance under the major epidemic impack. City Plan. Rev. 2020, 44, 9–12. [Google Scholar]
- Norris, F.H.; Stevens, S.P.; Pfefferbaum, B.; Wyche, K.F. Community resilience as a metaphor, theory, set of capacities, and strategy for disaster readiness. Am. J. Community Psychol. 2008, 41, 127–150. [Google Scholar] [CrossRef]
- Duan, J.; Yang, B.; Zhou, L. Planning improves city’s immunity: A written conversation on COVID-19 breakout. City Plan. Rev. 2020, 44, 115–136. [Google Scholar]
- Lim, S.; Allen, K.; Bhutta, Z. Measuring the health-related Sustainable Development Goals in 188 countries: A baseline analysis from the Global Burden of Disease Study 2015. Lancet 2016, 388, 1813–1850. [Google Scholar] [CrossRef]
- Cutter, S.L. The landscape of disaster resilience indicators in the USA. Nat. Hazards 2016, 80, 741–758. [Google Scholar] [CrossRef]
- Collier, M.J.; Nedović-Budić, Z.; Aerts, J. Transitioning to resilience and sustainability in urban communities. Cities 2013, 32, 21–28. [Google Scholar] [CrossRef]
- Garcia-Perez, A.; Cegarra-Navarro, J.G.; Sallos, M.P. Resilience in healthcare systems: Cyber security and digital transformation. Technovation 2023, 121, 102583. [Google Scholar] [CrossRef]
- Cimellaro, G.P.; Reinhorn, A.M.; Bruneau, M. Framework for analytical quantification of disaster resilience. Eng. Struct. 2010, 32, 3639–3649. [Google Scholar] [CrossRef]
- Gunderson, L.H.; Holling, C.S. Panarchy: Understanding Transformations in Human and Natural Systems; Island Press: Washington, DC, USA, 2002. [Google Scholar]
- Gunderson, L.H.; Holling, C.S.; Pritchard, L. Resilience of large-scale resource systems. Scope-Sci. Comm. Probl. Environ. Int. Counc. Sci. Unions 2002, 60, 3–20. [Google Scholar]
- Galderisi, A.; Limongi, G.; Salata, K.D. Strengths and weaknesses of the 100 resilient cities initiative in southern Europe: Rome and Athens’ experiences. City Territ. Archit. 2020, 7, 16. [Google Scholar] [CrossRef]
- Mileti, D. Disasters by Design: A Reassessment of Natural Hazards in the United States; Joseph Henry Press: Washington, DC, USA, 1999. [Google Scholar] [CrossRef]
- UNISDR. Living with Risk: A Global Review of Disaster Reduction Initiatives; United Nations: Geneva, Switzerland, 2004. [Google Scholar]
- Coles, E.; Buckle, P. Developing community resilience as a foundation for effective disaster recovery. Aust. J. Emerg. Manag. 2004, 19, 6–15. [Google Scholar]
- Cutter, S.L.; Barnes, L.; Berry, M. A Place-based model for understanding community resilience to natural disasters. Glob. Environ. Change 2008, 8, 598–606. [Google Scholar] [CrossRef]
- Twigg, J. Characteristics of a Disaster-Resilient Community: A Guidance Note, 2nd ed.; Aon Benfield UCL Hazard Research Centre: London, UK, 2009. [Google Scholar]
- Magis, K. Community Resilience: An Indicator of Social Sustainability. Soc. Nat. Resour. Int. J. 2010, 23, 401–416. [Google Scholar] [CrossRef]
- Chandra, A.; Acosta, J.; Howard, S.; Uscher-Pines, L. Building Community Resilience to Disasters: A way forward to Enhance Nationa1 Health Security. Rand Health Q. 2011, 1, 6. [Google Scholar] [CrossRef] [PubMed]
- Lopez-Marrero, T.; Tschakert, P. From theory to practice: Building more resilient communities in flood-prone areas. Environ. Urban. 2011, 23, 229–249. [Google Scholar] [CrossRef]
- Bruneau, M.; Chang, S.E.; Eguchi, R.T. A framework to quantitatively assess and enhance the seismic resilience of communities. Earthq. Spectra 2012, 19, 733–752. [Google Scholar] [CrossRef]
- Berkes, F.; Ross, H. Community Resilience: Toward an Integrated Approach. Soc. Nat. Resour. Int. J. 2013, 26, 5–20. [Google Scholar] [CrossRef]
- Fabbricatti, K.; Boissenin, L.; Citoni, M. Heritage Community Resilience: Towards new approaches for urban resilience and sustainability. City Territ. Archit. 2020, 7, 17. [Google Scholar] [CrossRef]
- Rifat, S.A.; Liu, W. Measuring community disaster resilience in the conterminous coastal United States. ISPRS Int. J. Geo-Inf. 2020, 9, 469. [Google Scholar] [CrossRef]
- Jewett, R.L.; Mah, S.M.; Howell, N. Social cohesion and community resilience during COVID-19 and pandemics: A rapid scoping review to inform the United Nations research roadmap for COVID-19 recovery. Int. J. Health Serv. 2021, 51, 325–336. [Google Scholar] [CrossRef] [PubMed]
- Fransen, J.; Peralta, D.O.; Vanelli, F. The emergence of urban community resilience initiatives during the COVID-19 pandemic: An international exploratory study. Eur. J. Dev. Res. 2022, 34, 432–454. [Google Scholar] [CrossRef] [PubMed]
- Peng, C.; Guo, Z.; Peng, Z. Research Progress on the Theory and Practice of Foreign Community Resilience. Urban Plan. Int. 2017, 32, 60–66. [Google Scholar] [CrossRef]
- O’Connell, D.; Walker, B.; Abel, N. The Resilience, Adaptation and Transformation Assessment Framework: From Theory to Application; Csiro: Canberra, Australia, 2015. [Google Scholar] [CrossRef]
- Meng, L.J.; Yun, Y.X. Disaster Resilience Improvement Strategy of Existing Communities Based on RATA Resilience Evaluation System: A Case Study of Existing Communities in Dongxing Road, Hedong District, Tianjin. In Proceedings of the 60 Years of Planning: Achievements and Challenges: Annual National Planning Conference, Shenyang, China, 24–27 September 2016; pp. 194–205. [Google Scholar]
- Yang, B.Q.; Li, G.C. Evaluation and analysis of social resilience of international communities based on DPSRC model: A case study of 16 international communities in Xiaobei, Guangzhou. Areal Res. Dev. 2020, 39, 70–75. [Google Scholar] [CrossRef]
- Yan, C.; Chen, J.T.; Duan, R. Evaluation Index System for Fireproof Resilience of Historic Blocks Based on PSR Model: A Case of Three Lanes and Seven Alleys in Fuzhou. Sci. Technol. Eng. 2021, 21, 3290–3296. [Google Scholar] [CrossRef]
- Zhang, F.; Liu, Q.; Zhou, X. Vitality Evaluation of Public Spaces in Historical and Cultural Blocks Based on Multi-Source Data, a Case Study of Suzhou Changmen. Sustainability 2022, 14, 14040. [Google Scholar] [CrossRef]
- Shang, Z.H.; Ou, X.J.; Zeng, L.H.; He, J.Q. Risk Assessment of City Community Public Safety: A Case Study of Chigang Community of Humen Town, Dongguan. Trop. Geogr. 2013, 33, 195–199. [Google Scholar] [CrossRef]
- Golany, B.; Roll, Y. An application procedure for DEA. Omega 1989, 17, 237–250. [Google Scholar] [CrossRef]
- Sun, M.; Zhu, T. Review on the Evaluation System of Public Safety Carrying Capacity about Small Town Community. Asian Agric. Res. 2014, 6, 77–79. [Google Scholar] [CrossRef]
- Zheng, B.; Hao, Y.H.; Ning, N. Community resilience to disaster risk in Sichuan province of China: An analysis of TOPSIS. Chin. J. Public Health 2017, 33, 699–702. [Google Scholar] [CrossRef]
- Guo, X.D.; Su, J.Y.; Wang, Z.T. Urban safety and disaster prevention under the perspective of resilience theory. Shanghai Urban Plan 2016, 71, 41–44. [Google Scholar]
- Fox-Lent, C.; Linkov, I. Resilience Matrix for Comprehensive Urban Resilience Planning; Springer International Publishing: Cham, Switzerland, 2018. [Google Scholar] [CrossRef]
- Fox-Lent, C.; Bates, M.E.; Linkov, l. A matrix approach to community resilience assessment: Anillustrative case at Rockaway Peninsula. Environ. Syst. Decis. 2015, 35, 209–218. [Google Scholar] [CrossRef]
- Chen, C.K.; Chen, Y.Q.; Shi, B.O.; Xu, T. An model for evaluating urban resilience to rainstorm flood disasters. China Saf. Sci. J. 2018, 28, 1–6. [Google Scholar] [CrossRef]
- Shi, Y.; Ji, F.; Zhang, H.B. Research on evaluation indicators of disaster resilience of urban communities. J. Acad. Disaster Prev. Sci. Technol 2019, 21, 47–54. [Google Scholar]
- Zhang, F.; Zhou, X. Structural renovation of blocks in build-up area of Jiangnan cities, taking Suzhou new district as an example. iScience 2023, 26, 108553. [Google Scholar] [CrossRef] [PubMed]
- Zhang, Y.L. Study on Community Emergency Capacity Assessment Based on the Fuzzy Comprehensive Assessment. Ind. Saf. Environ. Prot. 2011, 37, 14–16. [Google Scholar] [CrossRef]
- Zhou, X.; Ye, F.; Zhang, F.; Wang, D. Analysis and Optimization of Residential Elements from the Perspective of Multi-Child Families in the Yangtze River Delta Region. Buildings 2024, 14, 1649. [Google Scholar] [CrossRef]
- Moghadas, M.; Asadzadeh, A.; Vafeidis, A. A multi-criteria approach for assessing urban flood resilience in Tehran, Iran. Int. J. Disaster Risk Reduct. 2019, 35, 101069. [Google Scholar] [CrossRef]


| Dimension | Preparedness and Prevention Phase (P1) | Impact and Response Phase (P2) | Recovery and Adaptation Phase (P3) |
|---|---|---|---|
| Built environment (A1) | (A1,P1) To maintain a good community environment and enhance the friendliness of public spaces, encouraging residents to participate in outdoor activities. | (A1,P2) Restricting external traffic flow at community entrances and equipping open public spaces with enhanced epidemic prevention functions to ensure residents’ physical and mental well-being. | (A1,P3) Establishing community parks, pocket green spaces, and other public recreational areas, and utilizing linear greenery as a natural barrier to reduce health risks. |
| Emergency spaces (A2) | (A2,P1) Planning adequate isolation spaces and layout of refuge areas, ensuring sufficient evacuation areas. | (A2,P2) Always ensure the security of emergency spaces and strive for unobstructed emergency routes. | (A2,P3) Expanding the number of emergency spaces, repair damaged areas, and meeting the dual requirements of emergency and daily use. |
| Critical facilities (A3) | (A3,P1) Increase the redundancy of community facilities and cultivate residents’ awareness of using safety facilities. | (A3,P2) Fully utilize community hospitals, sports facilities, leisure and health centers, and other health facilities for emergency interventions to minimize residents’ health injuries. | (A3,P3) Accelerate the restoration of postal, express delivery, and other transportation facilities to meet the dynamic needs of integrating community services during and after pandemics. |
| Organizational behavior (A4) | (A4,P1) Conduct early warning and prevention information campaigns; perform safety hazard inspections. | (A4,P2) Initiate emergency rescue and evacuation operations; formulate disaster response plans. | (A4,P3) Announce the disaster situation and ongoing efforts; promote community spirit of mutual assistance; enhance the level of health activities for residents. |
| First-Level Indicator A | Phase | Second-Level Indicator B | Third-Level Indicator C | Measurement Methods |
|---|---|---|---|---|
| Resilience of built environment A1 | P1 | Pedestrian and bicycle lane B1 | C1 Street visual comfort | Semantic segmentation |
| C2 Perception of street scale | Street height-to-width ratio | |||
| Land use B2 | C3 Land development intensity | Building density formula | ||
| C4 Land use diversity | Land use formula | |||
| P2 | Transportation space B3 | C5 Road integration | SpaceSyntax | |
| C6 Road connectivity | The ratio of intersections to sidewalks | |||
| P3 | Open space B4 | C7 Spatial coverage | The ratio of open space area to the total community area | |
| C8 Morphological compactness | Compactness Index formula | |||
| Resilience of emergency space A2 | P1 | Emergency shelter signage system B5 | C9 Signage utility | Questionnaire |
| C10 Layout rationality | Field research | |||
| Supply storage space B6 | C11 Spatial coverage | Service coverage of supply points | ||
| C12 Material supply level | Two-Step floating catchment area method | |||
| P2 | Emergency defense space B7 | C13 Accessibility of places | The shortest distance from shelter to hospital | |
| C14 Coverage of places | Shelter service area | |||
| C15 Safety of emergency access | Road congestion | |||
| P3 | Post-pandemic integration area B8 | C16 Operability of post-pandemic transition | Percentage of operable space units | |
| C17 Scale of spatial planning for post-pandemic transition | Area of the epidemic prevention space | |||
| Resilience of critical facilities A3 | P1 | Public service facilities B9 | C18 Facility equity | Location entropy index |
| C19 Facility coverage | Public facility service coverage | |||
| P2 | Emergency support facilities B10 | C20 Provision of healthcare facilities | Two-step floating catchment area method | |
| C21 Accessibility of healthcare facilities | Two-step floating catchment area method | |||
| P3 | Post-pandemic integration facilities B11 | C22 Number of available existing facilities | Field research | |
| C23 Facility maintenance | Field research | |||
| Resilience of organizational behavior A4 | P1 | Preventive baseline conditions B12 | C24 Residents’ disaster awareness | Questionnaire |
| C25 Community disaster preparedness level | Questionnaire | |||
| P2 | Emergency preparedness level B13 | C26 Level of resident activity | Standard deviational ellipse | |
| C27 Community organizational capacity | Python | |||
| P3 | Recovery adaptability B14 | C28 Healthiness of activities | Questionnaire | |
| C29 Restoration participation | Python |
| First-Level Indicator | Weight | Second-Level Indicator | Second-Level Combined Weight | Third-Level Indicator | Third-Level Combined Weight | Ranking |
|---|---|---|---|---|---|---|
| Resilience of built environment A1 | 0.3444 | B1 | 0.1586 | C1 | 0.0529 | 9 |
| C2 | 0.1057 | 1 | ||||
| B2 | 0.0257 | C3 | 0.0086 | 26 | ||
| C4 | 0.0171 | 18 | ||||
| B3 | 0.0470 | C5 | 0.0117 | 23 | ||
| C6 | 0.0352 | 12 | ||||
| B4 | 0.1131 | C7 | 0.0754 | 3 | ||
| C8 | 0.0377 | 11 | ||||
| Resilience of emergency space A2 | 0.2111 | B5 | 0.0205 | C9 | 0.0068 | 28 |
| C10 | 0.0137 | 22 | ||||
| B6 | 0.0220 | C11 | 0.0055 | 29 | ||
| C12 | 0.0165 | 19 | ||||
| B7 | 0.0505 | C13 | 0.0202 | 15 | ||
| C14 | 0.0101 | 25 | ||||
| C15 | 0.0202 | 15 | ||||
| B8 | 0.1181 | C16 | 0.0591 | 6 | ||
| C17 | 0.0591 | 6 | ||||
| Resilience of critical facilities A3 | 0.2472 | B9 | 0.0489 | C18 | 0.0326 | 13 |
| C19 | 0.0163 | 20 | ||||
| B10 | 0.1212 | C20 | 0.0606 | 4 | ||
| C21 | 0.0606 | 4 | ||||
| B11 | 0.0771 | C22 | 0.0578 | 8 | ||
| C23 | 0.0193 | 17 | ||||
| Resilience of organizational behavior A4 | 0.1972 | B12 | 0.0415 | C24 | 0.0103 | 24 |
| C25 | 0.0311 | 14 | ||||
| B13 | 0.0475 | C26 | 0.0079 | 27 | ||
| C27 | 0.0400 | 10 | ||||
| B14 | 0.1082 | C28 | 0.0927 | 2 | ||
| C29 | 0.0155 | 21 |
| Sample Communities | I | II | III | IV | V | VI |
|---|---|---|---|---|---|---|
| Comprehensive resilience evaluation | 3.1158 | 3.502 | 2.2415 | 2.5979 | 3.3753 | 2.5028 |
| Ranking | 3 | 1 | 6 | 4 | 2 | 5 |
| Analysis Items | Name | Sample Size | Average Value | Standard Deviation | Brown F | p |
|---|---|---|---|---|---|---|
| Resilience evaluation | Community I | 29 | 0.03 | 0.05 | 2.340 | 0.046 |
| Community II | 29 | 0.03 | 0.04 | |||
| Community III | 29 | 0.08 | 0.14 | |||
| Community IV | 29 | 0.08 | 0.11 | |||
| Community V | 29 | 0.04 | 0.06 | |||
| Community VI | 29 | 0.05 | 0.07 | |||
| Total | 174 | 0.05 | 0.09 |
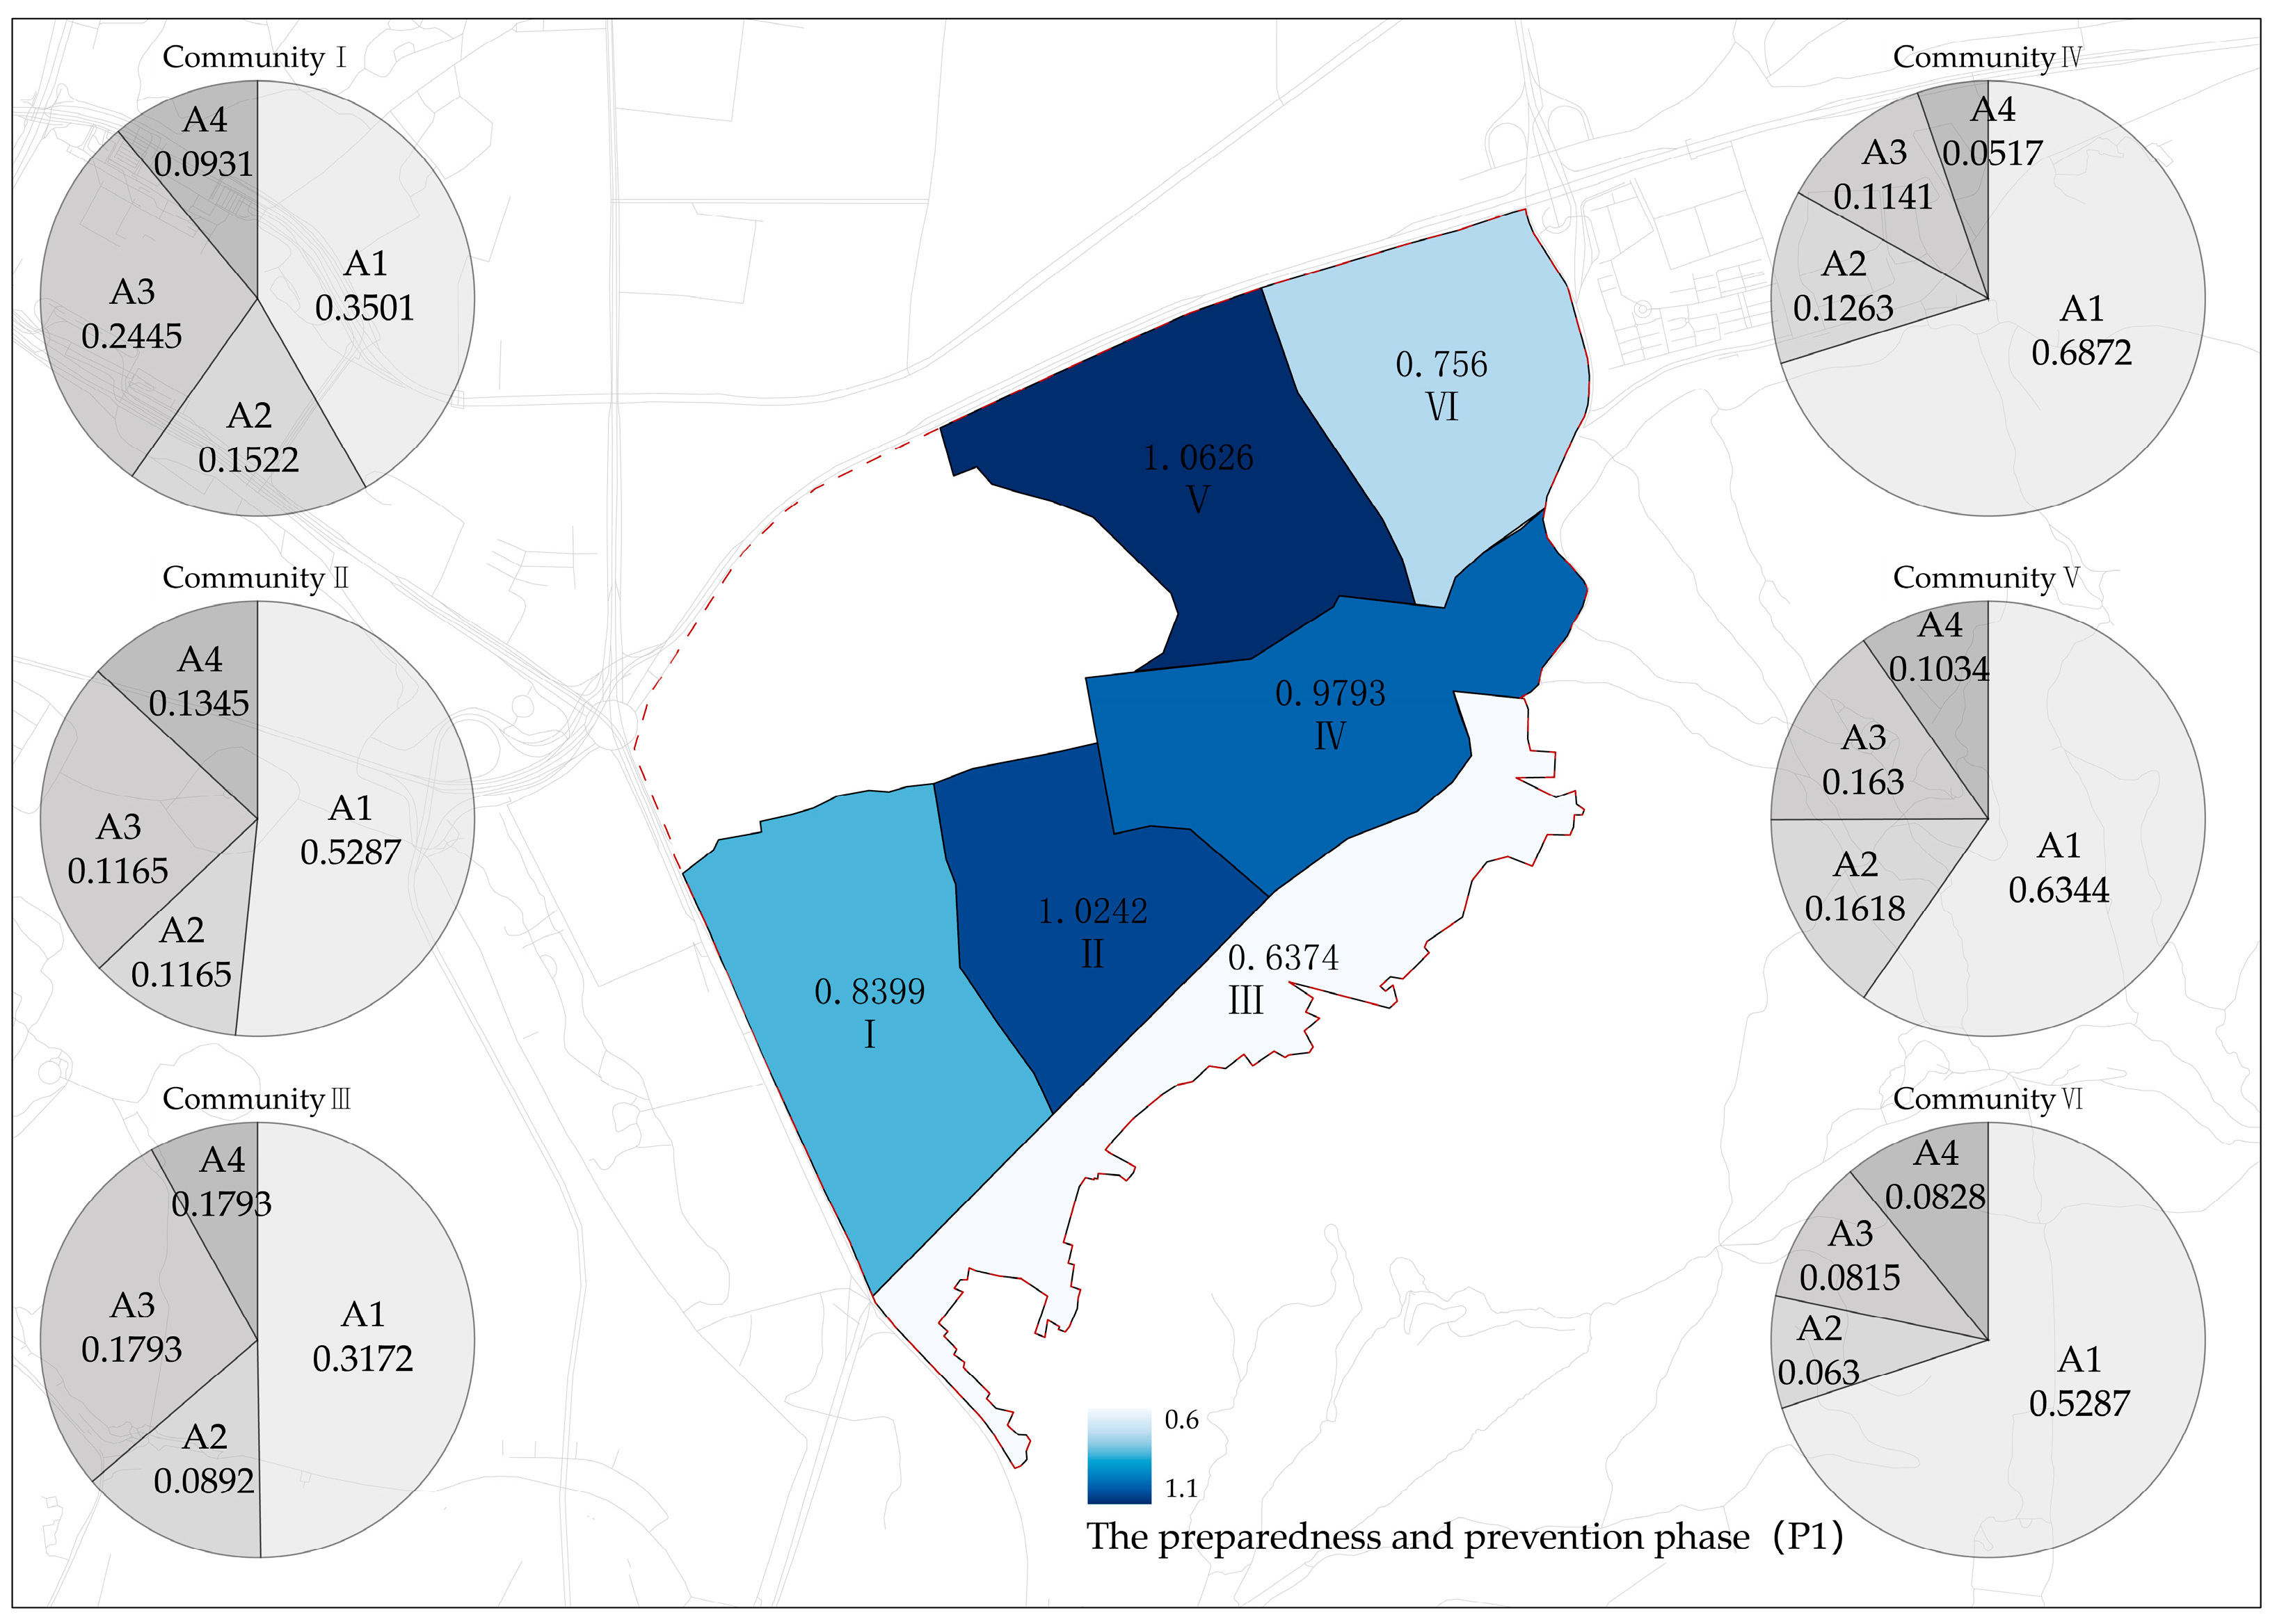
| Dimension | I | II | III | IV | V | VI |
|---|---|---|---|---|---|---|
| Built environment | 0.3501 | 0.5287 | 0.3172 | 0.6872 | 0.6344 | 0.5287 |
| Emergency spaces | 0.1522 | 0.1165 | 0.0892 | 0.1263 | 0.1618 | 0.063 |
| Critical facilities | 0.2445 | 0.2445 | 0.1793 | 0.1141 | 0.163 | 0.0815 |
| Organizational behavior | 0.0931 | 0.1345 | 0.0517 | 0.0517 | 0.1034 | 0.0828 |
| Total | 0.8399 | 1.0242 | 0.6374 | 0.9793 | 1.0626 | 0.756 |
| Dimension | I | II | III | IV | V | VI |
|---|---|---|---|---|---|---|
| Built environment | 0.1759 | 0.1524 | 0.1055 | 0.0586 | 0.1407 | 0.1876 |
| Emergency spaces | 0.202 | 0.1919 | 0.0707 | 0.1212 | 0.1515 | 0.1212 |
| Critical facilities | 0.4848 | 0.4242 | 0.1818 | 0.5454 | 0.5454 | 0.1818 |
| Organizational behavior | 0.1116 | 0.1437 | 0.1037 | 0.0716 | 0.1516 | 0.0795 |
| Total | 0.9743 | 0.9122 | 0.4617 | 0.7968 | 0.9892 | 0.5701 |
| Dimension | I | II | III | IV | V | VI |
|---|---|---|---|---|---|---|
| Built environment | 0.2262 | 0.2262 | 0.2262 | 0.2262 | 0.3393 | 0.4524 |
| Emergency spaces | 0.4728 | 0.4728 | 0.2955 | 0.1773 | 0.4137 | 0.2364 |
| Critical facilities | 0.1543 | 0.2313 | 0.212 | 0.1349 | 0.1928 | 0.1928 |
| Organizational behavior | 0.4483 | 0.541 | 0.3401 | 0.2319 | 0.3091 | 0.2009 |
| Total | 1.3016 | 1.4713 | 1.0738 | 0.7703 | 1.2549 | 1.0825 |
Disclaimer/Publisher’s Note: The statements, opinions and data contained in all publications are solely those of the individual author(s) and contributor(s) and not of MDPI and/or the editor(s). MDPI and/or the editor(s) disclaim responsibility for any injury to people or property resulting from any ideas, methods, instructions or products referred to in the content. |
© 2024 by the authors. Licensee MDPI, Basel, Switzerland. This article is an open access article distributed under the terms and conditions of the Creative Commons Attribution (CC BY) license (https://creativecommons.org/licenses/by/4.0/).
Share and Cite
Zhang, F.; Wang, D.; Zhou, X.; Ye, F. Community Resilience Evaluation and Construction Strategies in the Perspective of Public Health Emergencies: A Case Study of Six Communities in Nanjing. Sustainability 2024, 16, 6992. https://doi.org/10.3390/su16166992
Zhang F, Wang D, Zhou X, Ye F. Community Resilience Evaluation and Construction Strategies in the Perspective of Public Health Emergencies: A Case Study of Six Communities in Nanjing. Sustainability. 2024; 16(16):6992. https://doi.org/10.3390/su16166992
Chicago/Turabian StyleZhang, Fang, Dengyu Wang, Xi Zhou, and Fan Ye. 2024. "Community Resilience Evaluation and Construction Strategies in the Perspective of Public Health Emergencies: A Case Study of Six Communities in Nanjing" Sustainability 16, no. 16: 6992. https://doi.org/10.3390/su16166992
APA StyleZhang, F., Wang, D., Zhou, X., & Ye, F. (2024). Community Resilience Evaluation and Construction Strategies in the Perspective of Public Health Emergencies: A Case Study of Six Communities in Nanjing. Sustainability, 16(16), 6992. https://doi.org/10.3390/su16166992