Article

The Effect of Distance between Jet Fans on Gas Transport, Energy Conservation, and Emission Reduction in Long Highway Tunnels

1
School of Safety Science and Engineering, Xi’an University of Science and Technology, Xi’an 710054, China
2
Sichuan Province Long Road Tunnel (Group) Operation Safety Engineering Laboratory, Chengdu 611100, China
3
Department of Road and Bridge Engineering, Sichuan Communications Vocational and Technical College, Chengdu 611100, China
4
Key Laboratory of Xinjiang Coal Resources Green Mining, Ministry of Education, Xinjiang Institute of Engineering, Urumqi 830023, China
5
Xinjiang Key Laboratory of Coal Mine Disaster Intelligent Prevention and Emergency Response, Xinjiang Institute of Engineering, Urumqi 830023, China
6
Sichuan Road and Bridge East China Construction Co., Ltd., Chengdu 600039, China
*
Author to whom correspondence should be addressed.
Sustainability 2024, 16(16), 6990; https://doi.org/10.3390/su16166990
Submission received: 24 June 2024 / Revised: 7 August 2024 / Accepted: 12 August 2024 / Published: 15 August 2024
(This article belongs to the Collection Mine Hazards Identification, Prevention and Control)

Abstract

:
With the rapid development of the national economy, China’s transportation industry is experiencing accelerated development, and, at the same time, the number of long tunnels is constantly increasing. In order to examine the influence of jet fan spacing on gas transport law during the construction of long highway tunnels, this study used the Baima Highway Tunnel in Sichuan as an engineering prototype and established a numerical tunnel ventilation model based on Fluent numerical simulation software. The gas transport characteristics of jet fans in tunnels at different spacings (200 m, 400 m, 600 m, and 800 m) were studied. The results showed that with the increase in jet fan spacing (200 m, 400 m, 600 m, and 800 m), the gas concentration at the tunnel face showed a trend of decreasing and then increasing. Moreover, by analyzing the gas distribution cloud map and the wind flow line diagram, it was determined that the ventilation system effect was the best when the jet fan spacing was 600 m, which met the requirements of a gas concentration of less than 0.5% at the tunnel face and a minimum wind speed of 0.25 m/s. At the same time, according to the optimal spacing for the optimization of the site ventilation system, it was observed that after the ventilation was stabilized (after 600 s), the minimum value of the gas concentration in the left and right tunnel holes diminished from 0.38% to 0.31% and from 0.41% to 0.31%, with rates of reduction of 18.42% and 24.39%, respectively. This indicated that after optimizing the ventilation system at the tunnel site, the concentration significantly decreased compared with before the optimization. Moreover, when the jet fan spacing was 600 m compared with 200 m and 400 m, the annual energy savings were 1900.8 MW·h and 950.4 MW·h, respectively. The research results clarified the optimal layout parameters of jet fans in the Baima Highway Tunnel, providing a reference for the rational layout of jet fans in long-distance tunnels. In addition, the results of this study provide an important theoretical basis for the gas prevention and safe construction of long highway tunnels. Furthermore, this study contributes to research in energy conservation, emission reduction, and sustainable development of energy in the ventilation process during tunnel construction.

1. Introduction

Since the beginning of the 21st century, China’s transportation construction has developed rapidly, with the total number of tunnels ranking first in the world [1,2,3,4]. When a highway tunnel is constructed through a gas-containing stratum, the balance of force in the surrounding rock is disrupted, resulting in the continuous outflow of gas and the formation of a highway gas tunnel [5,6,7]. During the construction phase of tunnels and underground works, ventilation is the only method to exchange gasses between the inside of the tunnel and the outside. As the scale of tunnel construction increases and the level of technology improves, the production environment and construction safety issues in construction tunnels have gradually come to the fore. As a result, safe and green construction technology is the future development trend of tunnel engineering around the world; however, the requirements for tunnel construction ventilation are increasingly high [8,9,10]. In recent years, the consequences of gas accidents in highway gas tunnels have been tragic, and the safety of highway gas tunnel construction has received more and more attention; therefore, numerous problems in gas ventilation need to be addressed in tunnel construction [11,12].
Tunnels have a high degree of uncertainty and complexity due to the special environment in which they are located. The prediction of gas emissions in tunnels can effectively reduce gas accidents, which is of great significance to the safe construction of tunnels. Wang et al. [13] established a tunnel gas emission prediction model considering the main control factors, and the model tests showed that the model accuracy was high and the prediction effect was favorable. Li [14] and Wang [15] established tunnel gas concentration prediction models based on the LSTM (Long Short-Term Memory) network and K-line diagram, respectively, to realize the real-time change trend of gas concentration during tunnel construction, which provides an important safety guarantee for efficient tunnel production. Yang et al. [16] proposed a prediction method based on the drill cuttings index and bat algorithm to optimize the limit learning machine for the tunnel gas, and the results showed that the method has a better prediction effect and certain application prospects. Wang [17] and Zhang [18] established a numerical model for the response of comprehensive pipe galleries to gas explosion loads, which was of some significance for predicting the degree of damage caused by gas explosions to comprehensive pipe galleries.
In recent years, with the continuous innovation of research methods and theories, the study of gas transport dynamics in tunnels has been gradually developed and improved. Yuan et al. [19] proposed a tunnel gas transportation model combined with Kalman filtering to realize the diffusion prediction of gas in tunnels. Bai et al. [20] conducted a study on gas diffusion in tunnels using a combination of Bayesian networks and CFD numerical calculations, as well as risk assessment, which has some applicability to tunnel risk management.
Tunnel ventilation is of great significance to the prevention and control of gas tunnels. By optimizing the design of tunnel ventilation and optimizing the pipeline, the gas content in the tunnel can be effectively reduced to ensure the safety of tunnel construction [21]. Liu et al. [22] established a three-dimensional model of jet tunnel ventilation for high-altitude gas tunnels and analyzed the air velocity, ventilation time, and duct location to obtain the optimal ventilation length, which provides a reference for high-altitude gas tunnel construction. He et al. [23] studied the ventilation and diffusion of gas in shield tunnels and found that ventilation air velocity is the main control factor affecting the diffusion of gas, and reasonable air velocity settings play an important role in reducing gas concentration. Fang et al. [24] investigated the effects of the distance of the air outlet from the working face and the diameter of the air duct on the emission of pollutants in tunnels through a numerical analysis, and the results of the study helped to optimize the tunnel ventilation system. Zhang et al. [25] investigated the optimal ventilation parameters for highly hazardous gasses in tunnels by building a physical similarity simulation experiment platform, and the results showed that an exhaust velocity of 5 m/s and a duct diameter of 1 m were the optimal ventilation parameters. Chang et al. [26] used numerical simulation to study the influence of fan arrangement on the distribution of gas and other harmful gasses during tunnel construction and proposed corresponding optimization measures, which were of some reference significance for the arrangement of tunnel ventilation systems. Cao [27], Nie [28], and Liu [29] studied the effect of different ventilation parameters on dust diffusion for dust control in the tunnel boring process, and the results showed that the distance of the air outlet of the windpipe from the tunnel face and the air velocity of the air outlet are the key factors for dust control, and the optimal parameters were derived from the simulation results. Ma et al. [30] carried out numerical simulations to study the distribution of the flow field in the case of a simultaneous excavation of multiple working faces in a long tunnel, which provided an important reference for the effective discharge of gas in tunnels. Feng et al. [31] established a tunnel ventilation model for high-altitude areas to study the transportation law of harmful gasses after tunnel blasting, which provides certain guidance for the safe construction of high-altitude gas tunnels. Wang et al. [32] proposed a tunnel ventilation method with a high utilization of non-mechanical ventilation for super-long highway tunnels and verified its effectiveness through field tests. Du et al. [33] used the physical properties of gas to study the migration law of gas leakage in tunnel oil tank trucks, which is of great significance for preventing gas explosions. Nie [9], Du [34], Li [35], Liu [36], and Zhu [37] studied the characteristics of tunnel gas explosion by establishing a three-dimensional numerical model of a tunnel to conduct laboratory experiments and obtain gas concentration and temperature distribution characteristics. The study provides an important basis for tunnel gas prevention and control. In addition, some scholars have conducted research on tunnel gas risk assessment, which is a valuable reference for tunnel gas accident prevention measures [38,39].
In the ventilation process of long tunnels, due to its long distance, the main ventilation fan cannot meet the requirements of tunnel ventilation, often needing to increase the jet fan to make the harmful gasses effectively discharged out of the tunnel, in order to ensure the safety of long tunnels; however, the current impact of jet fan ventilation on the tunnel gas transport law is less studied. In this paper, by using Fluent numerical simulation software, with Sichuan Baima Tunnel as the engineering background, a numerical model of jet fan ventilation in long tunnels was established, and the gas transportation law in tunnels with different arrangement spacing of jet fans was studied and compared, so as to clarify the characteristics of the influence of jet fan ventilation on gas transportation, and to obtain the optimal arrangement spacing to meet the requirements of tunnel ventilation. Finally, the optimal arrangement spacing of jet fans was applied to the tunnel site for the optimization of the ventilation system, and the results showed that the gas concentration was reduced compared with the pre-optimization, and the energy consumption and costs were saved to a certain extent, and the results of the study are of great significance to the safe construction of long tunnels and the sustainable development of energy.

2. Project Overview

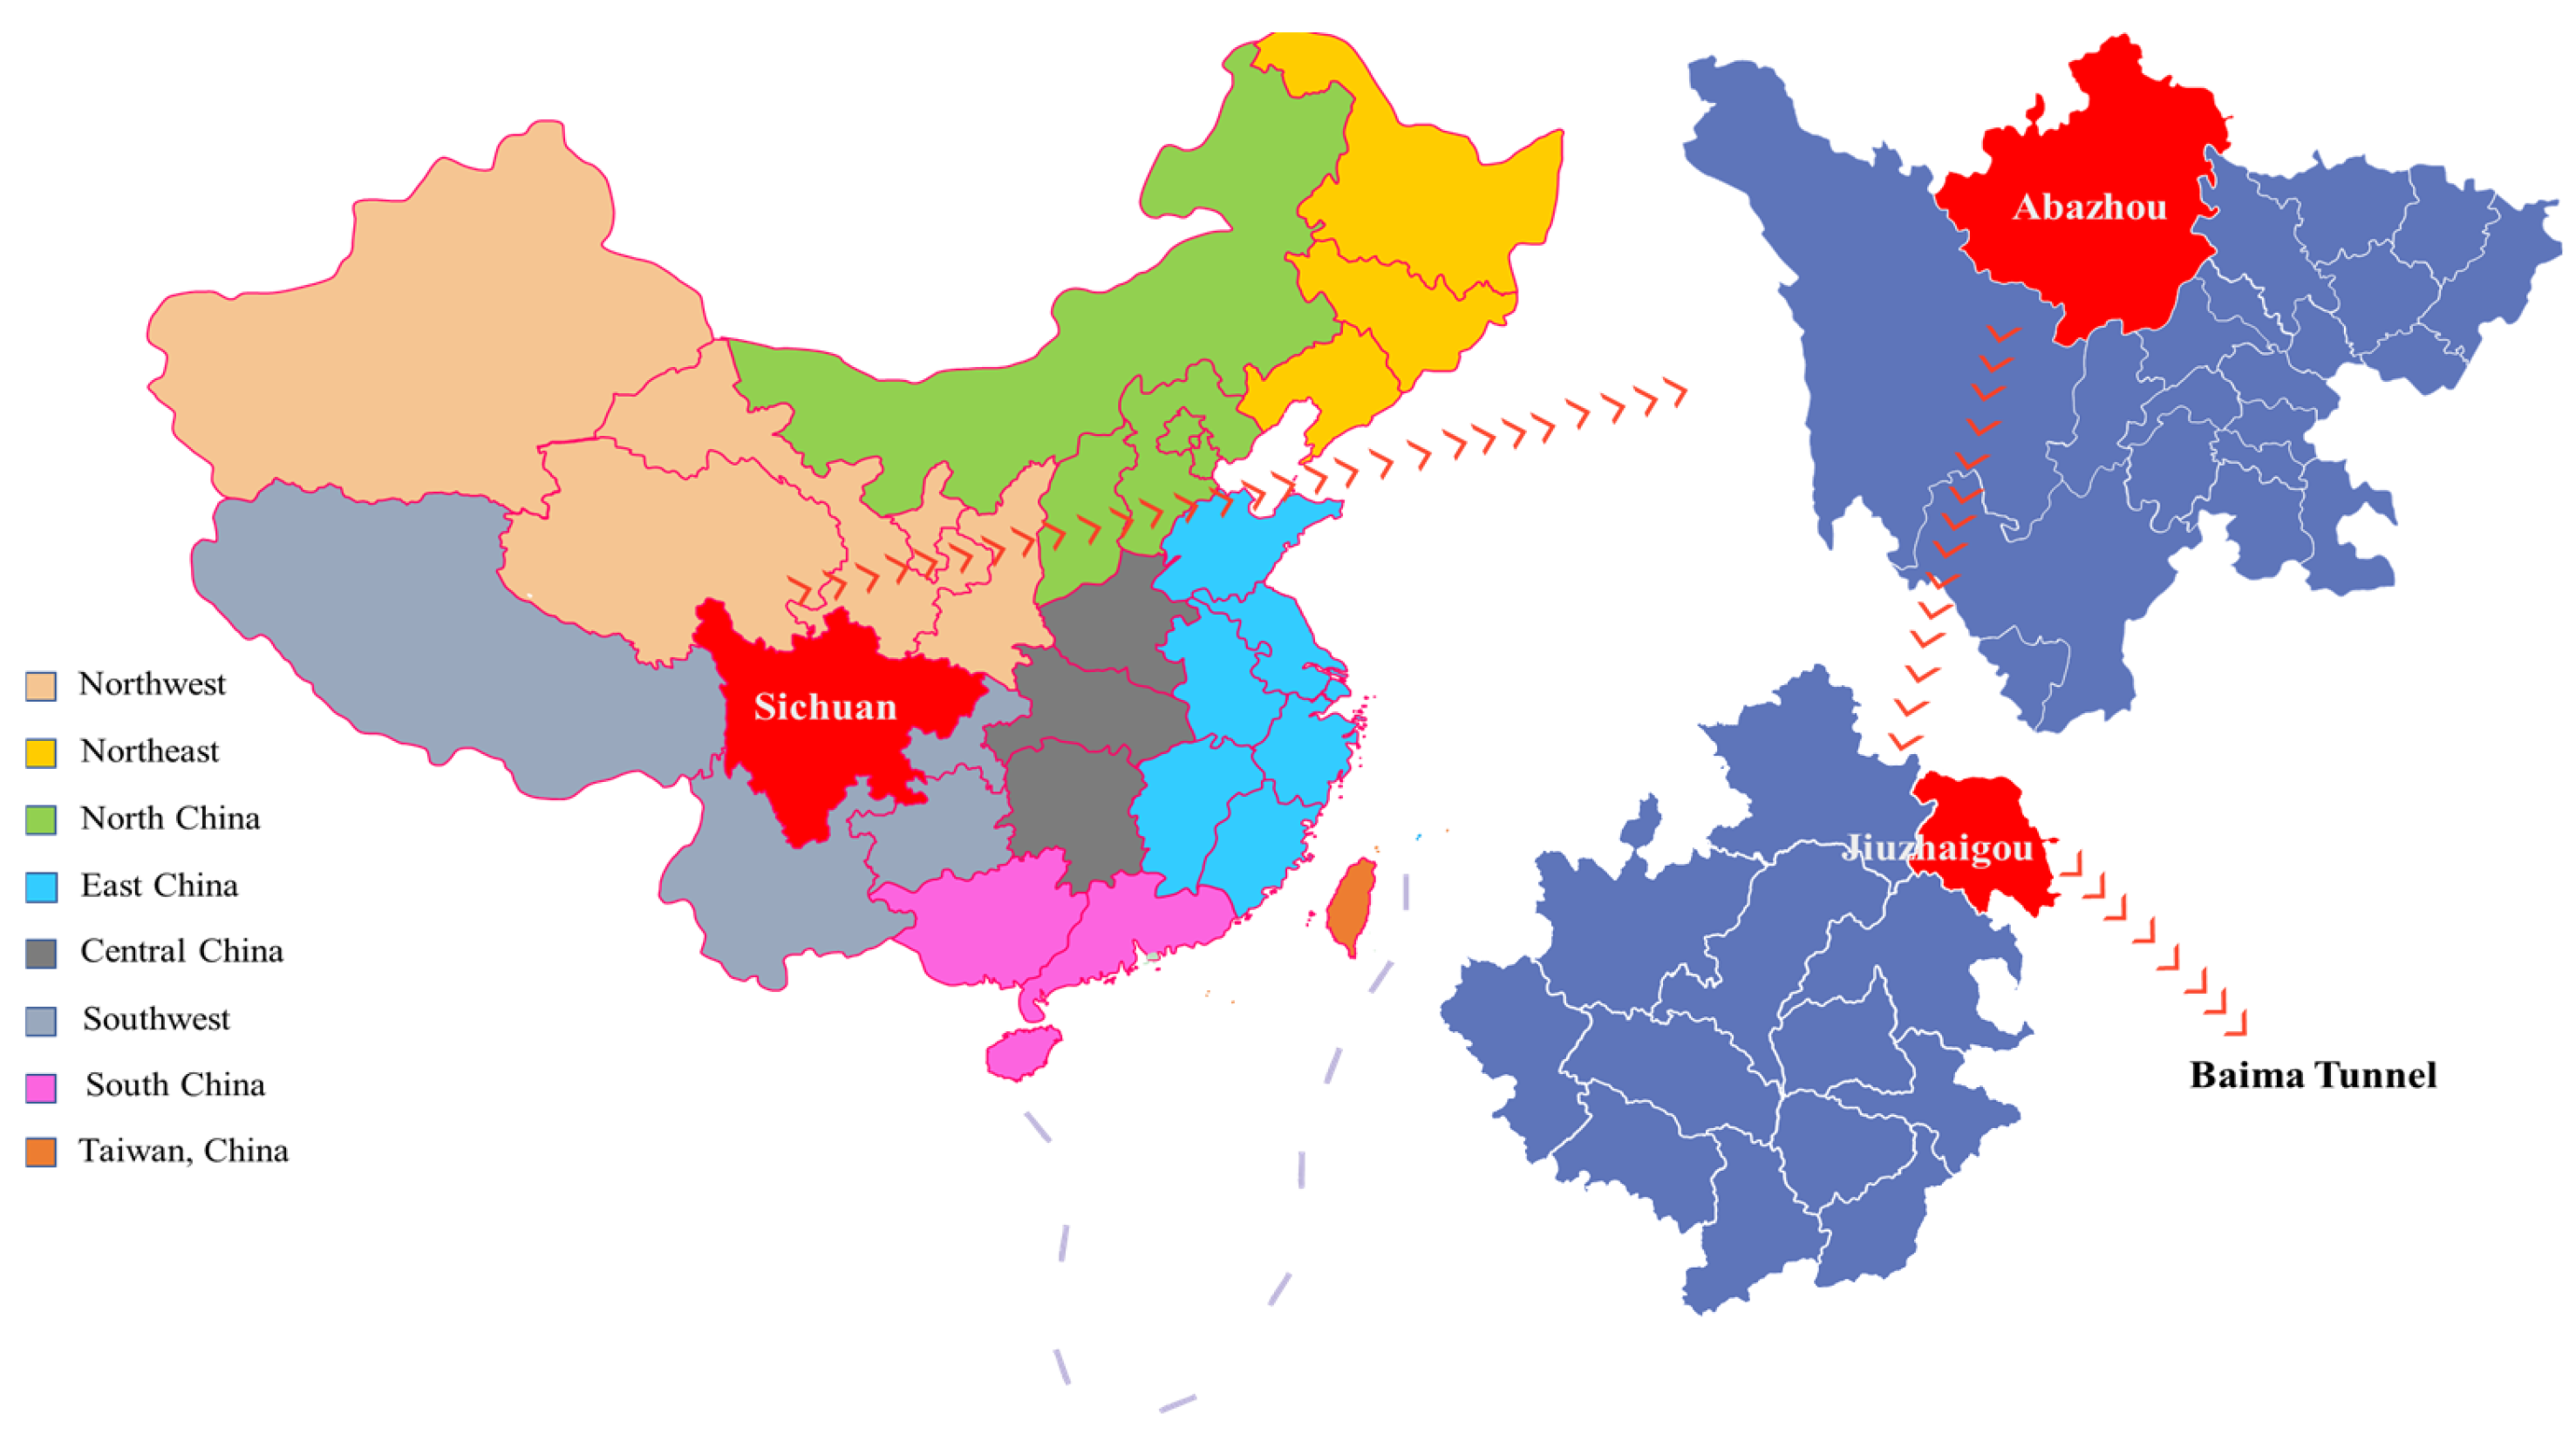
2.1. Overview of the Tunnel Route

The Baima Highway Tunnel investigated in this study is located at the junction of Beijiao Town, Jiuzhaigou County, Aba Prefecture, Sichuan Province, and Baima Tibetan Township, Pingwu County, Sichuan Province. The Baima Highway Tunnel is the longest highway tunnel under construction in Sichuan Province, with a total length of 13,013 m. The geographic location of the Baima Highway Tunnel is shown in Figure 1.
The research object of this study is the Baima Highway Tunnel of the Jiuzhaigou–Mianyang Expressway, which starts and ends at the left line, K34 + 303~K41 + 664, with a total length of 7.309 km, and the right line, YK34 + 355~YK41 + 664, with a total length of 7.361 km. The construction mileage of the inclined shaft is XJPK1 + 260~XJPK0 + 000, with a slope of 11.60%, and the length of the air-supply inclined shaft is XJSK1 + 215~XJK0 + 000, with a slope of 10.85%, and the total length of the line is 1.260 km for the exhaust air-supply inclined shaft and 1.215 km for the air-supply inclined shaft. A construction branch hole is set up on the right side of the right hole of the Jiuzhaigou end of the tunnel, with a length of 0.235 km, to assist in the construction of the main hole of the Jiuzhaigou tunnel.

2.2. Overview of Gas Inventory in the Tunnel

There is a close relationship between the tunnel gas storage status and the location of the tunnel structure. Moreover, fold type and fold complexity have an impact on gas storage. When the enclosing rock closure conditions are favorable, the backslope is often conducive to the storage of gas; however, if the closure conditions are poor, the backslope in the gas easily escapes along the fissure. The coal samples at different locations in the Baima Highway Tunnel were analyzed for industrial properties and the results are shown in Table 1.
According to the measurements, the maximum absolute gas outflow in the tunnel air-supply inclined shaft (right hole) is 1.244 m3/min, and the maximum carbon dioxide outflow is 0.889 m3/min; the maximum absolute gas outflow in the air exhaust inclined shaft (left hole) is 1.429 m3/min, and the maximum carbon dioxide outflow is 0.904 m3/min. The absolute gas outflow from the right tunnel face of the branch hole is 1.204 m3/min, and the maximum carbon dioxide outflow is 0.911 m3/min. According to the gas level standard, the Baima Highway Tunnel is a low-gas tunnel.

3. Experimental Methods

3.1. Basic Assumptions

1. Since the gas flow rates in the tunnel ventilation flow field are all low, the fluid in the tunnel was viewed as a viscous incompressible fluid.
2. The fluid in the tunnel was considered as a mixture of methane and air without considering other gasses, and the effects of pedestrian crossings, mechanical equipment, etc., on the flow field were ignored, while the flow field motion was considered an unsteady turbulent flow.
3. Neglecting the dissipated heat energy generated by the viscous forces of the fluid in the tunnel, the ventilation flow field and the tunnel walls were considered as a constant temperature.
4. Fresh air flow from the air duct and jet fan outlet was determined by the air flow velocity with isotropic characteristics.
5. The gas in the tunnel vented out from the tunnel face, and there was no gas venting from the rest of the tunnel.

3.2. Governing Equations

The standard k-ε turbulence model was used for the simulation, and the model satisfies the laws of the conservation of mass, momentum, and energy, i.e., the standard k-ε turbulence equations, mass conservation equations, momentum conservation equations, and component transport equations, which were expressed as follows:
ρ k t = x i μ + μ t σ k k x i + G k + G b ρ ε Y M
ρ ε t = x i μ + μ t σ ε k x i + G 1 ε k G k + C 3 ε G b C 2 ε ρ ε 2 k
where Gk is the turbulent kinetic energy due to the velocity gradient, J; Gb is the turbulent kinetic energy due to buoyancy, J; YM is the effect of the pulsation expansion of compressible turbulence on the total dissipation rate; μt is the turbulent viscosity coefficient; σk and σε are the turbulent Planck’s numbers for k and ε, which were taken as 1.0 and 1.3; k is turbulent kinetic energy, J; ε is the dissipation rate; μ is the dynamic viscosity; and C3ε and C2ε are constants.
The mass conservation equation is as follows:
ρ τ + ρ v = S m
where ρ is the fluid density, kg/m3; v is the fluid flow velocity, m/s; and Sm is the mass of the dispersed secondary phase and the defining source added to the continuous phase, kg.
The momentum conservation equation is as follows:
d u i d t = F i P x i + x j γ u i x j u i u j ¯
The component transportation equation is as follows:
t ρ Y M + x j ρ u j Y M = x j u e σ Y Y M x j
where ui is the velocity component, m/s; xi is the coordinate component; P is the corrected time-averaged pressure, Pa; Fi is the fluid mass force, N; and γ, ue, and σY are constants.

3.3. Numerical Calculation Model

According to the actual ventilation mode of the tunnel, the tunnel ventilation was designed as alley-type ventilation, and the arrangement of jet fans was carried out to establish a plan schematic model, as shown in Figure 2, as well as the jet fan model and layout parameters as shown in Table 2 and Table 3.
The purpose of this article is to obtain the optimal layout parameters for jet fans, so that they can meet the safety regulations for tunnel gas and wind speed, while minimizing tunnel electrical energy consumption and achieving sustainable development of electrical energy. Therefore, when the spacing between jet fans increases, using fewer jet fans can also fill the entire tunnel with air flow and dilute the gas, achieving the goal of reducing energy loss and saving electricity costs.

3.4. Boundary Condition Settings

The setting of boundary conditions and parameters is a necessary prerequisite for simulation calculations, and the accuracy of its settings directly determines the correctness of the calculation results. Based on the analysis of the model parameters, and taking the previous research as a reference, the following calculation parameter settings were obtained through continuous parameter adjustment and optimization. The Fluent calculation model parameters and boundary condition settings are shown in Table 4.
1. For the velocity inlet boundary, set the jet fan velocity at 30 m/s, the duct outlet velocity at 20 m/s, the flow direction perpendicular to the tunnel section, and the oxygen content at 21%.
2. For the tunnel walls, which were assumed to be adiabatic, the wall roughness Rh was 0.09 and the roughness constant Rc was 0.55.
3. Exit boundary: The tunnel entrance was set as an outflow boundary.
4. Gas source term: In this study, the influx of gas was addressed by using a source term, and the actual source of contamination was regarded as the source term in the air at a very small distance from the wall of its tunnel face, and its influx was the actual influx of the gas source in the tunnel, which was set to 1.244 m3/min.
In addition, this study established a tunnel model with a tunnel excavation of 4000 m as the condition. The air duct inlet was set at a distance of 2500 m from the tunnel entrance, the air duct outlet was 10 m away from the palm face, and the distance between the air duct and the wall was 0.5 m.

4. Experimental Results

When the ventilation resistance in long-distance tunnel ventilation is determined to be too high, it is necessary to set up jet fans at a certain distance from the inlet and return air ends of the tunnel. The distance of jet fans from the gas outlet directly impacts the ventilation air volume and the discharge of gas. Therefore, it is necessary to study the spacing of jet fans in the inlet and return air ends of the tunnel.

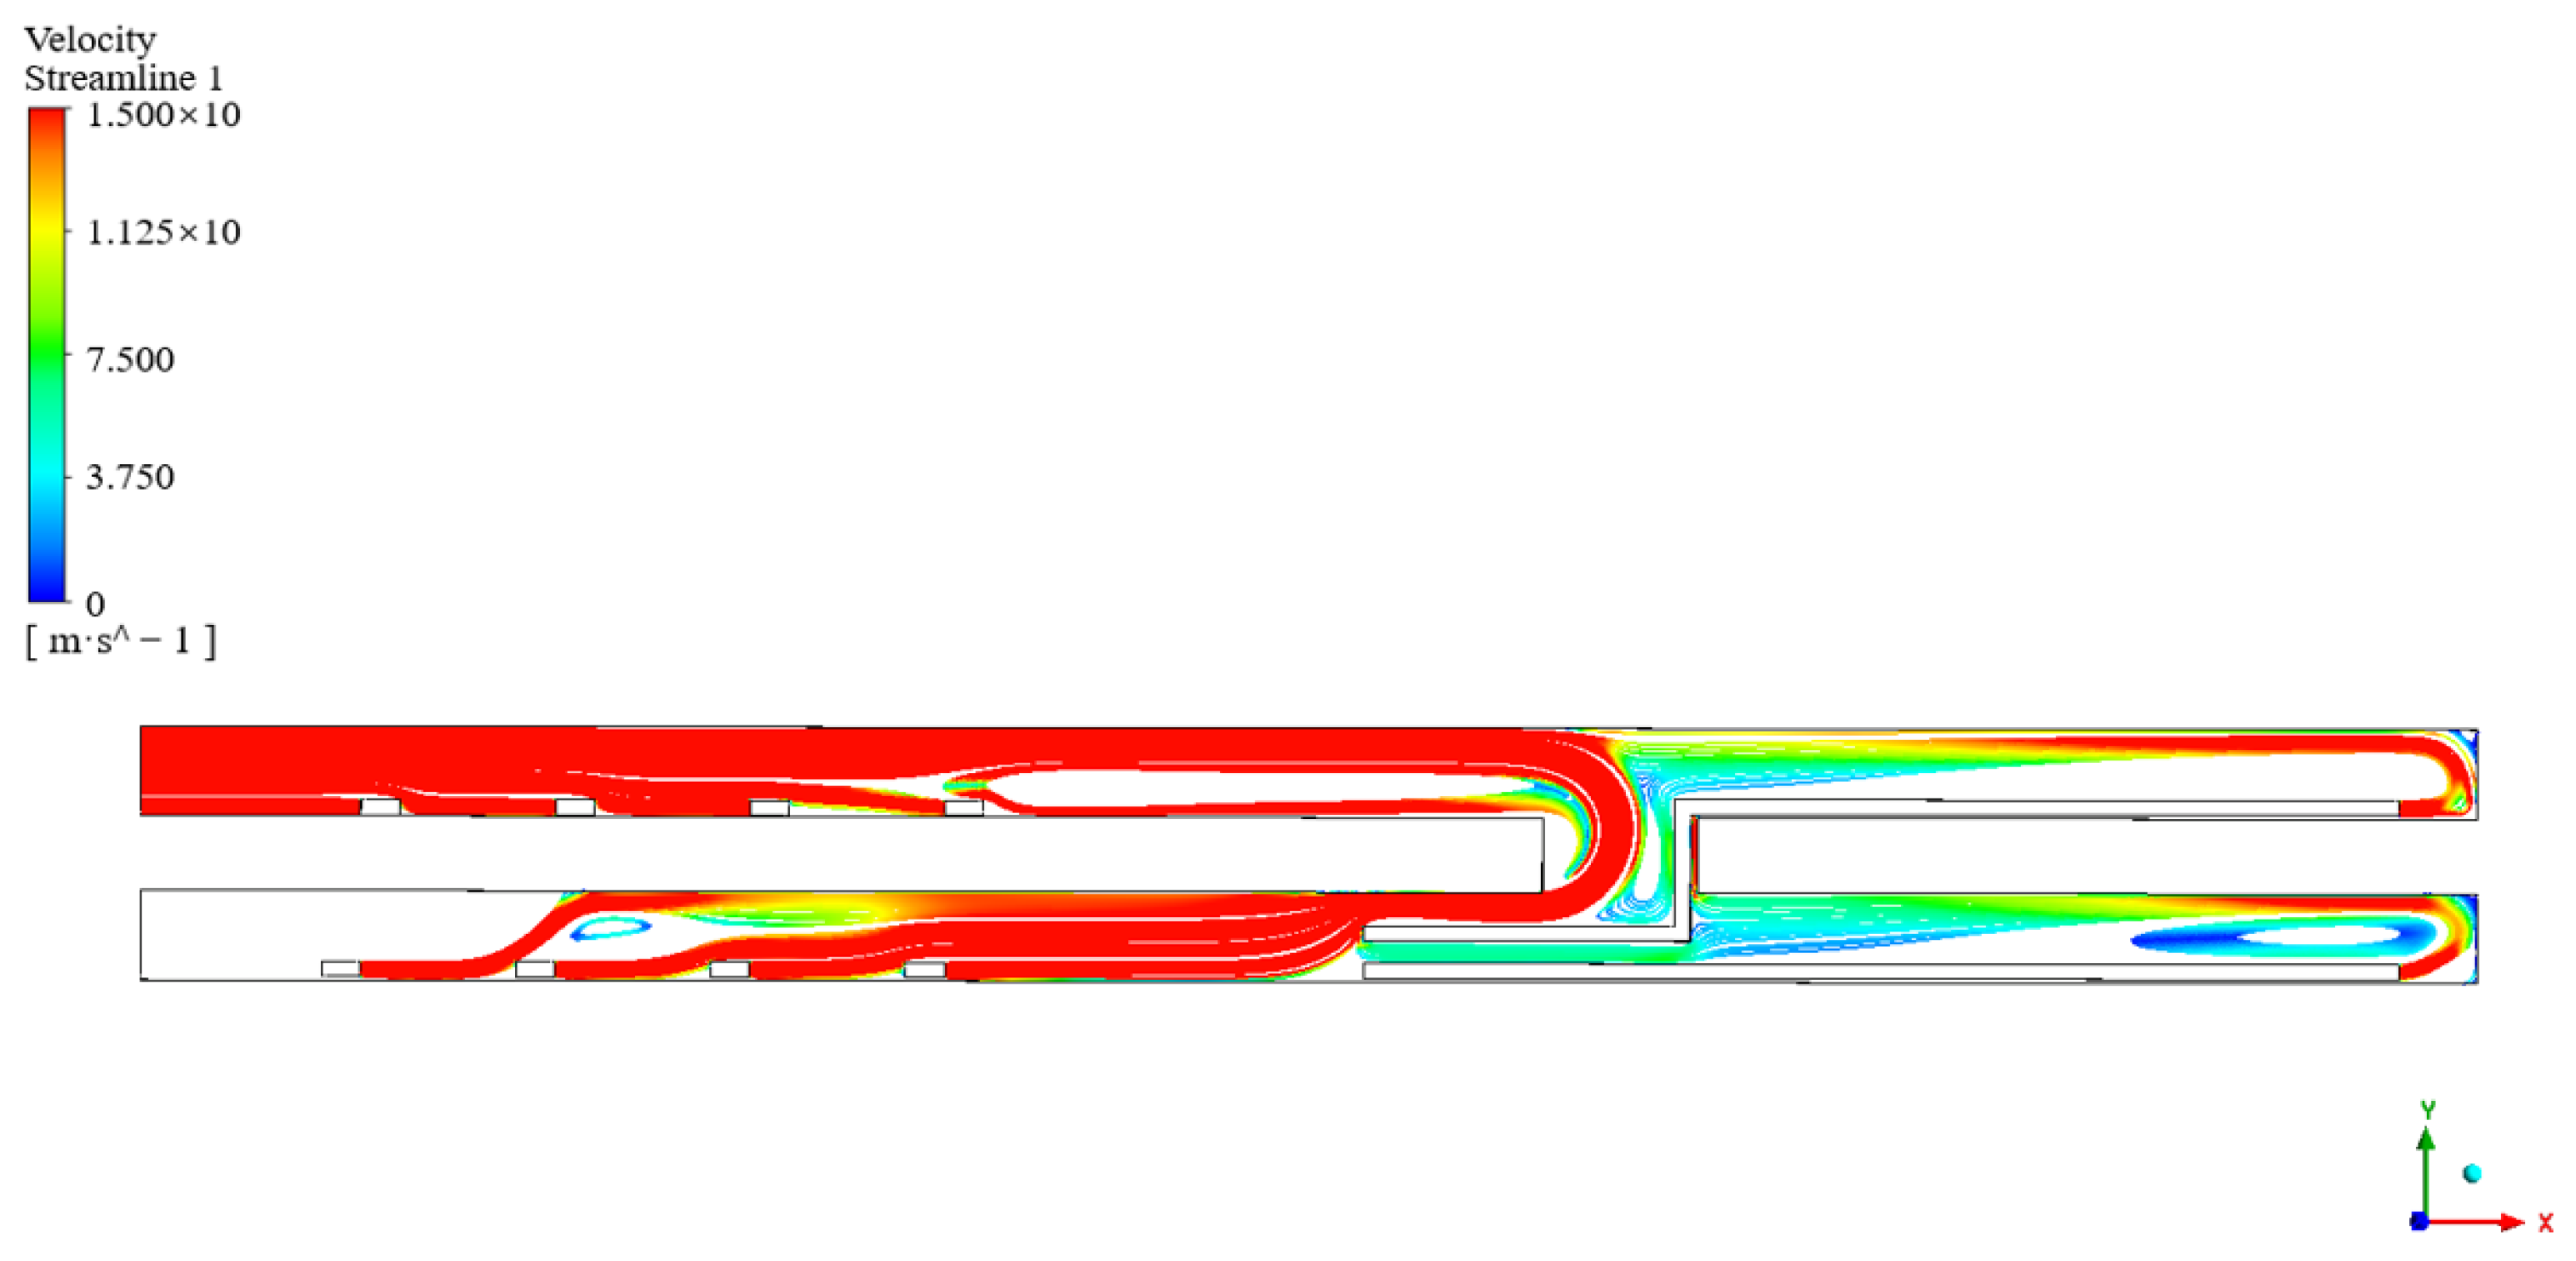
4.1. Ventilation Simulation Results for Jet Fan Spacing of 200 m

According to the parameters of jet fan deployment, when the spacing is 200 m, there are five units in each of the left and right holes of the tunnel. The cloud map of gas distribution and the distribution of wind flow lines are shown in Figure 3 and Figure 4.
It can be observed in Figure 4 that when the spacing of jet fan deployment was set to 200 m, the wind speed of the whole tunnel inlet and return airway was stronger, and the volume of wind transported to the palm faces of the left and right holes of the tunnel was also higher. Under the condition of a certain amount of gas influx, it can be observed in Figure 3 that the gas concentration was less than 0.5% within a certain range of the tunnel face. At the same time, within a certain range of the tunnel face, the minimum wind speed was more than 0.25 m/s, which met the requirement of minimum ventilation wind speed for low-gas tunnels. This result showed that under the existing ventilation conditions, when the gas outflow from the tunnel face reached 1.244 m3/min, the requirements to achieve the dilution of the gas in the tunnel face and ultra-long-distance ventilation were met.

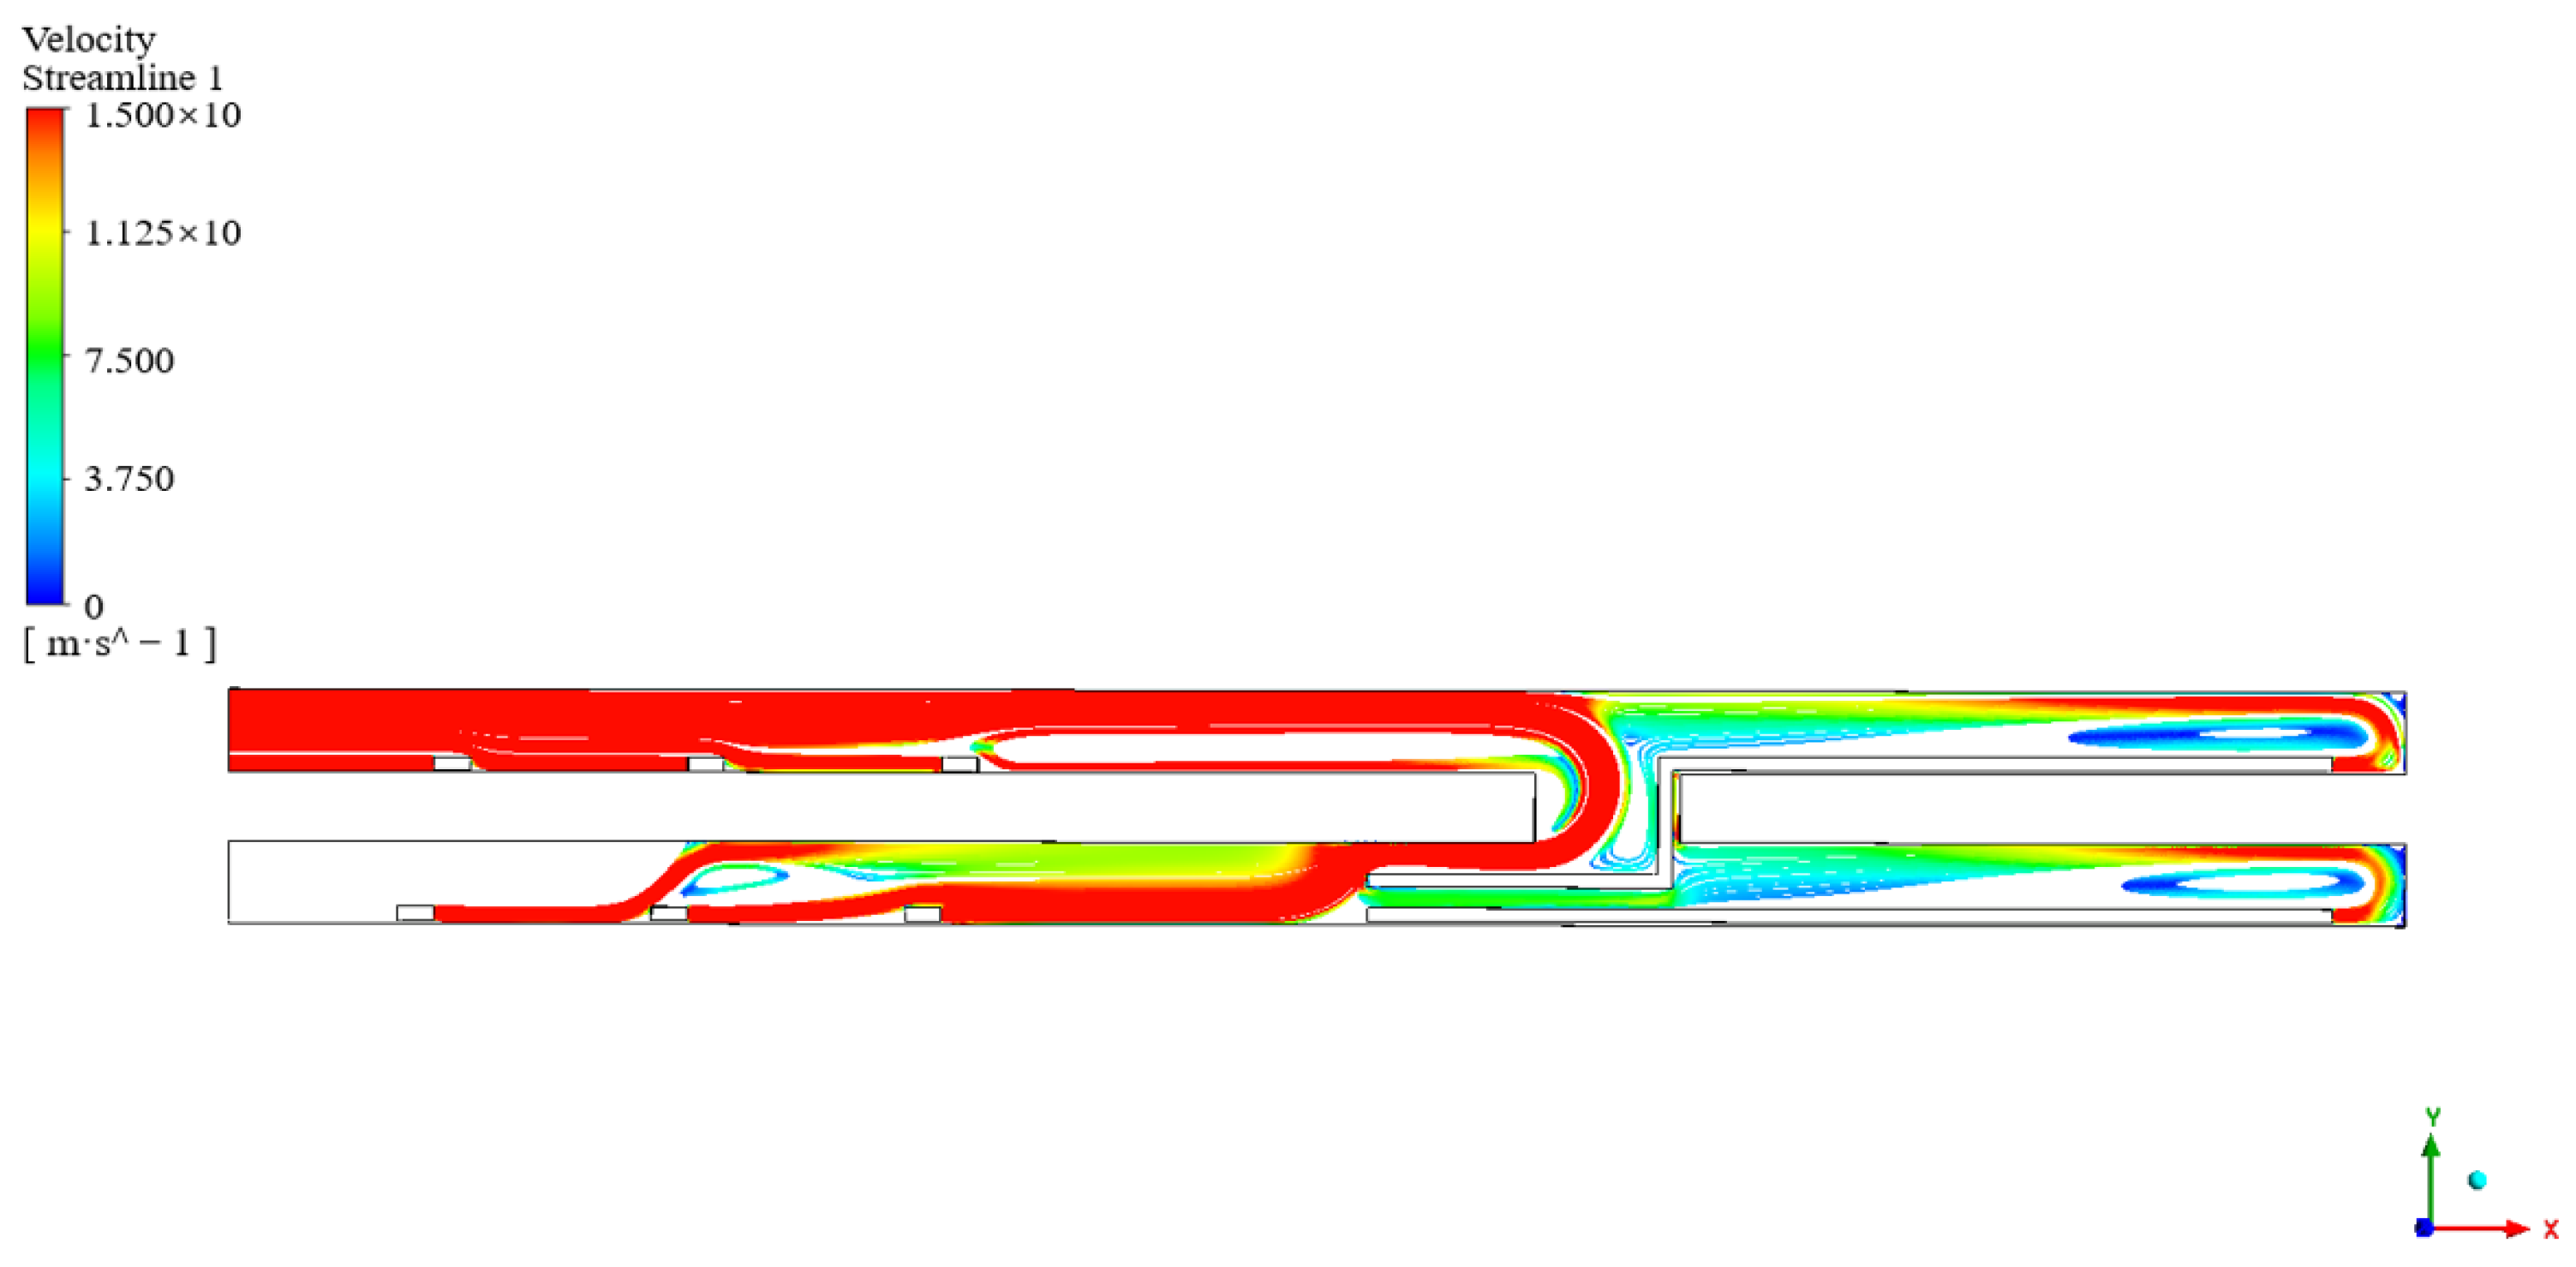
4.2. Ventilation Simulation Results for Jet Fan Spacing of 400 m

According to the parameters of jet fan deployment, when the spacing was 400 m, there were four sets in each of the left and right tunnel holes. The cloud map of the gas distribution and the distribution of the wind flow line are shown in Figure 5 and Figure 6.
As can be observed in Figure 6, when the spacing of jet fan deployment was set to 400 m, the wind speed of the whole tunnel inlet and return airway weakened, and the wind volume delivered to the tunnel faces of the left and right tunnel holes was also reduced. Under the condition of a certain amount of gas influx, the gas concentration and air volume satisfy the safety regulations for low-gas tunnels, indicating that the jet fan spacing is somewhat effective.

4.3. Ventilation Simulation Results for Jet Fan Spacing of 600 m

According to the parameters of jet fan deployment, when the spacing was 600 m, there were three sets in each of the left and right tunnel holes. The cloud map of gas distribution and the distribution of the wind flow line are shown in Figure 7 and Figure 8.
As can be observed in Figure 7 and Figure 8, with the further increase in the jet fan spacing, the vortex area in front of the tunnel face increased significantly. Meanwhile, the velocity of the wind flow arriving at the tunnel face increased, the dilution effect on the tunnel face improved, and the maximum value of the gas concentration in a section of the tunnel face and in front of the area was less than 0.5%. At the same time, it can be observed from the wind flow line diagram that the wind flow in the tunnel was more fully developed, and the degree of return flow penetration was further increased. As a result, the wind flow could direct the gas to the mouth of the cave to be discharged more effectively, and in the overall space of the tunnel, the wind speed was greater than 0.25 m/s. This result showed that the existing ventilation conditions can meet the requirements of diluting the gas in the tunnel face and ultra-long-distance ventilation.

4.4. Ventilation Simulation Results for Jet Fan Spacing of 800 m

According to the parameters of jet fan deployment, when the spacing was 800 m, there were three sets in each of the left and right tunnel holes. The cloud map of gas distribution and the distribution of wind flow lines are shown in Figure 9 and Figure 10.
As can be observed in Figure 9 and Figure 10, when the spacing of jet fans was 800 m, the degree of wind flow penetration was reduced, the wind speed arriving at the tunnel face was likewise reduced, the wind speed of the whole tunnel inlet and return airway was weakened, and the wind volume transported to the tunnel face of the tunnel’s left and right holes was also reduced. Moreover, gas overrun occurred within a certain range of the tunnel face under some gas venting conditions. Meanwhile, within a certain range from the tunnel face, the minimum wind speed was less than 0.25 m/s, which did not meet the minimum ventilation requirement for low-gas tunnels. This result showed that under the existing ventilation conditions, when the gas outflow from the tunnel face reached 1.244 m3/min, the gas dilution requirements in the tunnel face and ultra-long-distance ventilation were not met.
Based on the above analysis, on the premise of meeting the requirements of wind speed and gas concentration and maximizing energy saving, a jet fan spacing of about 600 m meets the requirements of maintaining a gas concentration of less than 0.5% and a minimum wind speed of more than 0.25 m/s in the palm face.

5. Discussion

5.1. Analysis of the Ventilation Effect of Optimal Jet Fan Spacing in the Tunnel

The simulation of different jet fan spacings under the tunnel gas transport law and the optimal layout spacing (600 m) were analyzed in order to determine the ventilation effect in the tunnel after activating the gas concentration detection device at the left arch foot of the tunnel face. Moreover, the characteristics of the change in ventilation time were analyzed in relation to the increase in gas concentration, as shown in Figure 11.
As can be observed in Figure 11, the concentration of gas at the tunnel face was at a high level after the tunnel face was opened; moreover, the gas concentration at the tunnel face of the left and right tunnels reached the maximum value upon activating the ventilation process, and then gradually showed a decreasing trend with increased ventilation time. Finally, the gas concentration fluctuated in a small range around a certain value. Overall, after optimizing the ventilation system for the tunnel site, the concentration was significantly reduced compared with the pre-optimization period, although the optimization effect did not show much during this period. However, with the increase in ventilation time, the optimized gas concentration remained at a lower level. After ventilation stabilization (after 600 s), the minimum values of gas concentration in the left and right tunnel holes were reduced from 0.38% to 0.31% and from 0.41% to 0.31%, with a reduction of 18.42% and 24.39%, respectively. The error analysis of measured and simulated values after optimization showed that the overall error was basically stable at −20%~20%, indicating that the gas simulation data at the palm face can reflect the distribution of gas concentration in the tunnel site to a certain extent, which is of some significance in guiding the optimization of on-site ventilation. According to the results obtained in Reference [3], installing jet fans can effectively reduce gas concentration under long-distance ventilation conditions, with the maximum gas concentration reduced to 0.24%. Comparing the results of the aforementioned study with the results of this study, it can be observed that both experiments reduced tunnel gas concentration by installing jet fans, which is significant for ensuring safety in tunnel construction.

5.2. Analysis of Energy Saving Effect

In order to analyze the energy consumption and energy savings under different jet fan spacings, the electrical energy consumption under three spacings (200 m, 400 m, and 600 m) was plotted as shown in Figure 12. Moreover, the electrical energy and electricity cost savings achieved with a spacing of 600 m compared with spacings of 200 m and 400 m were plotted as shown in Table 5.
As can be observed in Figure 12, the monthly energy consumption was 396 MW·h, 316.8 MW·h, and 237.6 MW·h for the three jet fan spacings (200 m, 400 m, and 600 m) with a decreasing trend, of which 600 m had the lowest monthly energy consumption and the highest degree of energy saving. Moreover, as shown in Table 5, compared with the spacings of 200 m and 400 m, the annual electricity saving of 600 m was 1900.8 MW·h and 950.4 MW·h, respectively, and the annual electricity cost saving was CNY 1,378,080 and CNY 689,040, respectively. Therefore, not only does a jet fan spacing of 600 m meet the tunnel ventilation requirement, effectively dilute gas, and reduce the possibility of gas overrun, but this configuration also maximizes electric energy savings, which supports sustainable energy consumption practices in tunnel construction.

6. Conclusions

(1) Using the Baima Highway Tunnel in Sichuan as the engineering prototype, a two-dimensional numerical calculation model of tunnel roadway ventilation was established using Fluent software (The software version is 2022 R2). According to the results, as the spacing between jet fans increases (200 m, 400 m, 600 m, and 800 m), the gas concentration at the palm face shows a trend of first decreasing and then increasing. When the jet fan spacing is 600 m, the ventilation effect is the highest, and, thus, the gas concentration and wind speed inside the tunnel meet the safety standards.
(2) The configuration of jet fans installed at the tunnel site was optimized with a spacing of 600 m and the gas concentration was monitored. The results showed that after stable ventilation (after 600 s), the minimum gas concentration in the left and right tunnels decreased from 0.38% to 0.31% and from 0.41% to 0.31%, with a decrease of 18.42% and 24.39%, respectively. This indicates that after optimizing the ventilation system at the tunnel site, the concentration significantly decreased compared with before the optimization.
(3) At three different jet fan spacings (200 m, 400 m, and 600 m), the monthly energy consumption of the ventilation system was 396 MW·h, 316.8 MW·h, and 237.6 MW·h, respectively, indicating a gradually decreasing trend with increasing spacing. At the same time, compared with the spacings of 200 m and 400 m, the annual energy savings of 600 m spacing were 1900.8 MW·h and 950.4 MW·h, respectively, and the annual electricity savings were CNY 1,378,080 and CNY 689,040, respectively. This indicates that the energy saving effect of the tunnel ventilation system is favorable under the spacing of 600 m, which supports sustainable energy consumption practices in tunnel construction.
This study used Fluent software to determine the changes in tunnel gas concentrations under different jet fan spacings. A two-dimensional plane geometric model was built and tested. In a future study, a three-dimensional tunnel model will be established to investigate the changes in tunnel gas concentration under different jet fan heights in order to determine the influence of different jet fan layout parameters on tunnel gas transport and ventilation.

Author Contributions

Conceptualization, L.S.; methodology, S.L.; data curation, F.W. and P.Z.; writing—original draft preparation, J.W.; investigation, L.S.; resources, P.Q. and Z.D.; writing—review and editing, J.W. and P.Q.; funding acquisition, L.S. and P.Z. All authors have read and agreed to the published version of the manuscript.

Funding

This research was funded by National Natural Science Foundation Grants of China (5217-4205, 5197-4237, and 5207-4217), the Shanxi Province Outstanding Youth Science Fund Project (2023-JC-JQ-40), and the Sichuan Provincial Transportation Technology Funding Project (2021-C-03).

Institutional Review Board Statement

Not applicable.

Informed Consent Statement

Not applicable.

Data Availability Statement

Data are available upon reasonable request.

Conflicts of Interest

Author Zongbo Diao was employed by the company Sichuan Road and Bridge East China Construction Co., Ltd. The remaining authors declare that the research was conducted in the absence of any commercial or financial relationships that could be construed as a potential conflict of interest.

References

  1. Zhu, Y.M.; Zhou, J.J.; Zhang, B.; Wang, H.; Huang, M.Q. Statistical analysis of major tunnel construction accidents in China from 2010 to 2020. Tunn. Undergr. Space Technol. 2022, 124, 104460. [Google Scholar] [CrossRef]
  2. Ye, F.; Qin, N.; Liang, X.; Ouyang, A.H.; Qin, Z.; Su, E.J. Analyses of the defects in highway tunnels in China. Tunn. Undergr. Space Technol. 2021, 107, 103658. [Google Scholar] [CrossRef]
  3. Domaneschi, M.; Cucuzza, R.; Martinelli, L.; Noori, M.; Marano, G.C. A probabilistic framework for the resilience assessment of transport infrastructure systems via structural health monitoring and control based on a cost function approach. Struct. Infrastruct. Eng. 2024, 1–13. [Google Scholar] [CrossRef]
  4. Rosso, M.M.; Cucuzza, R.; Marano, G.C.; Aloisio, A.; Cirrincione, G. Review on deep learning in structural health monitoring. In Bridge Safety, Maintenance, Management, Life-Cycle, Resilience and Sustainability, 1st ed.; CRC Press: Boca Raton, FL, USA, 2022; pp. 309–315. [Google Scholar]
  5. Zhang, X.Q.; Hu, J.Y.; Zhang, D.F.; Cai, S.; Yang, F. Distribution of harmful gas and ventilation length design of high altitude long gas tunnel construction: A case study. Front. Earth Sci. 2023, 11, 1195880. [Google Scholar] [CrossRef]
  6. Su, P.D.; He, K.C.; Feng, T.; Qiu, P.; Xu, Z.X.; Li, Y.G. Gas hazard evaluation for tunnel construction in coal-bearing Longtan Formation, South China. Bull. Eng. Geol. Environ. 2022, 81, 87–104. [Google Scholar] [CrossRef]
  7. Cao, S.Y.; Yang, M.; Hu, J.Y.; Chen, J.Z. Advanced perception and control method of harmful gas during construction period of coal tunnel based on DeepAR. Front. Earth Sci. 2023, 11, 1225287. [Google Scholar] [CrossRef]
  8. Yang, S.; Ai, Z.B.; Zhang, C.; Dong, S.; Ouyang, X.; Liu, R.; Zhang, P. Study on optimization of tunnel ventilation flow field in long tunnel based on CFD computer simulation technology. Sustainability 2022, 14, 11468. [Google Scholar] [CrossRef]
  9. Nie, W.; Cai, Y.K.; Wang, L.Y.; Liu, Q.; Jiang, C.W.; Hua, Y.; Guo, L.D.; Cheng, C.X.; Zhang, H.N. Study of spatiotemporal evolution of coupled airflow–gas–dust multi-field diffusion at low-gas tunnel. Sci. Total Environ. 2024, 928, 172428. [Google Scholar] [CrossRef] [PubMed]
  10. Zeng, F.B.; Jiang, Z.A.; Zheng, D.F.; Si, M.L.; Wang, Y.P. Study on numerical simulation of leakage and diffusion law of parallel buried gas pipelines in tunnels. Process Saf. Environ. Prot. 2023, 177, 258–277. [Google Scholar] [CrossRef]
  11. Shen, Y.; Sun, S.C.; Sun, W.; Zhou, L.; Huang, Z.K.; Yang, Y.F. Understanding the factors and consequences of gas deflagration accident in metro shield tunnel: Site investigation and numerical analysis. Buildings 2024, 14, 56. [Google Scholar] [CrossRef]
  12. Apak, M.Y.; Ozen, H.; Cails, M.; Golgeli, B.; Ataoglu, S. Applications of utility tunnels for natural gas pipelines. Tunn. Undergr. Space Technol. 2022, 122, 104243. [Google Scholar] [CrossRef]
  13. Wang, H.; Wang, E.Y.; Li, Z.H. Study on dynamic prediction model of gas emission in tunneling working face. Combust. Sci. Technol. 2020, 194, 506–522. [Google Scholar] [CrossRef]
  14. Li, P.H.; Li, K.; Wang, F.; Zhang, Z.L.; Cai, S.; Cheng, L. A novel method for gas disaster prevention during the construction period in coal penetration tunnels-a stepwise prediction of gas concentration based on the LSTM method. Sustainability 2022, 14, 12998. [Google Scholar] [CrossRef]
  15. Wang, H.Y.; Zhao, S.L.; Liu, J.L.; Zhou, Y.M.; Chen, X.; Wang, J.; Cheng, L. Prediction and analysis of abnormal gas emission law in low-gas tunnel based on K-Line diagram. Geofluids 2020, 2020, 8898394. [Google Scholar] [CrossRef]
  16. Yang, Z.H.; Zhang, H.W.; Li, S.; Fan, C.J. Prediction of residual gas content during coal roadway tunneling based on drilling cuttings indices and BA-ELM algorithm. Adv. Civ. Eng. 2020, 2020, 1287306. [Google Scholar] [CrossRef]
  17. Wang, S.P.; Li, Z.; Fang, Q.; Yan, H.C.; Chen, L. Performance of utility tunnels under gas explosion loads. Tunn. Undergr. Space Technol. 2021, 109, 103762. [Google Scholar] [CrossRef]
  18. Zhang, Z.J.; Liu, Z.X.; Zhang, H.; Meng, S.B.; Zhao, J.W.; Wu, C.Q.; Shi, J.H. patial distribution and machine learning-based prediction model of natural gas explosion loads in a utility tunnel. Tunn. Undergr. Space Technol. 2023, 140, 105272. [Google Scholar] [CrossRef]
  19. Yuan, S.Q.; Wu, J.S.; Zhang, X.L.; Liu, W.Y. EnKF-based estimation of natural gas release and dispersion in an underground tunnel. J. Loss Prev. Process Ind. 2019, 62, 103931. [Google Scholar] [CrossRef]
  20. Bai, Y.P.; Wu, J.S.; Sun, Y.X.; Cai, J.T.; Cao, J.J.; Peng, L. BN & CFD-based quantitative risk assessment of the natural gas explosion in utility tunnels. J. Loss Prev. Process Ind. 2022, 80, 104883. [Google Scholar]
  21. Wang, X.; Wang, M.N.; Chen, J.; Yan, T.; Bao, Y.F.; Chen, J.Y.; Qin, P.C.; Li, K.J.; Deng, T.; Yan, G.F. Analysis of calculation of fresh-air demand for road tunnel ventilation design in China. Tunn. Undergr. Space Technol. 2020, 103, 103469. [Google Scholar] [CrossRef]
  22. Liu, J.; Zhou, H.W.; Wang, W.Q.; Hu, X.Y.; Ma, Q.; Lu, F. Study of the diffusion law of harmful gases in tunnel construction on plateaus and optimization of ventilation parameters. ACS Omega 2022, 7, 27135–27148. [Google Scholar] [CrossRef] [PubMed]
  23. He, J.; Zhu, H.H.; Wei, X.Y.; Jin, R.; Jiao, Y.J.; Yin, M. Numerical and experimental analyses of methane leakage in shield tunnel. Front. Struct. Civ. Eng. 2023, 17, 1011–1020. [Google Scholar] [CrossRef]
  24. Fang, Y.; Yao, Z.G.; Lei, S. Air flow and gas dispersion in the forced ventilation of a road tunnel during construction. Undergr. Space 2019, 4, 168–179. [Google Scholar] [CrossRef]
  25. Zhang, P.; Lan, H.Q. Experimental study on dynamic exhaust law for ventilation system of gas tunnel. Appl. Sci. 2023, 13, 12783. [Google Scholar] [CrossRef]
  26. Chang, X.K.; Chai, J.R.; Luo, J.P.; Qin, Y.; Xu, Z.; Cao, J. Tunnel ventilation during construction and diffusion of hazardous gases studied by numerical simulations. Build. Environ. 2020, 177, 106902. [Google Scholar] [CrossRef]
  27. Cao, C.; Zhao, J.Y.; Ding, H.G. Dust removal of large cross-section tunnels: Following ventilation and its adjustment strategy. J. Braz. Soc. Mech. Sci. Eng. 2018, 40, 483–497. [Google Scholar] [CrossRef]
  28. Nie, W.; Jiang, C.W.; Sun, N. CFD-based simulation study of dust transport law and air age in tunnel under different ventilation methods. Environ. Sci. Pollut. Res. 2023, 30, 114484–114500. [Google Scholar] [CrossRef] [PubMed]
  29. Liu, Q.; Nie, W.; Hua, Y.; Peng, H.T.; Ma, H.; Yin, S.; Guo, L.D. Long-duct forced and short-duct exhaust ventilation system in tunnels: Formation and dust control analysis of pressure ventilation air curtain. Process Saf. Environ. Prot. 2019, 132, 367–377. [Google Scholar] [CrossRef]
  30. Ma, S.; Mi, W.S.; Fan, S.X.; Qiu, R.; Niu, G.Q.S. Numerical analysis and control technology of gas accumulation in a large-scale specially-shaped tunnel passing through coal bearing strata. Front. Earth Sci. 2023, 11, 1201492. [Google Scholar] [CrossRef]
  31. Feng, X.; Jiang, Z.A.; Zhang, G.L.; Luo, X.; Zeng, F.B. Study on CO diffusion law and concentration distribution function under ventilation after blasting in high-altitude tunnel. J. Wind Eng. Ind. Aerodyn. 2022, 220, 104871. [Google Scholar] [CrossRef]
  32. Wang, Y.D.; Zheng, R.J.; Bai, W.J.; Qin, Z.J.; Chai, L.L.; Wan, S.T.; Yan, S. Study on the utilization of non-mechanical ventilation power in extra-long highway tunnels with shafts. J. Wind Eng. Ind. Aerodyn. 2022, 221, 104909. [Google Scholar] [CrossRef]
  33. Du, T.; Lu, X.Y.; Yu, H.Y.; Wu, T.F.; Yang, D. Experimental study on the characteristics of buoyant gas flow produced by vertical gas leakage in tunnels under natural ventilation. Phys. Fluids 2024, 36, 057116. [Google Scholar] [CrossRef]
  34. Du, J.Q.; Chen, J.; Zhu, L.Q.; Guo, L.W.; Wang, F.S.; Hu, X.M. Numerical study on the dynamic response of gas explosion in uneven coal mine tunnels using CESE reaction dynamics model. Appl. Sci. 2024, 14, 2372. [Google Scholar] [CrossRef]
  35. Li, B.; Wang, L.; Mao, S.H.; Lu, K.H.; Ni, X.Y. Study on the ceiling gas temperature distribution, fire merging, and flame length induced by twin tunnel fires under reduced pressures. Int. J. Therm. Sci. 2024, 203, 109149. [Google Scholar] [CrossRef]
  36. Liu, Z.Q.; Ye, J.H.; Zhong, X.X.; Zhong, Q.; Lu, Y.S. Study on the propagation characteristics of gas explosions disturbed by crushed rock in tunnels through gas-containing stratum. Fire Saf. J. 2024, 146, 104134. [Google Scholar] [CrossRef]
  37. Zhu, L.Q.; Du, J.Q.; Chen, J.; Guo, L.W.; Wang, F.S. Dust raising law of gas explosion in a 3D reconstruction real tunnel: Based on ALE-DEM model. Powder Technol. 2024, 434, 119224. [Google Scholar] [CrossRef]
  38. Cai, J.T.; Wu, J.S.; Yuan, S.Q.; Reniers, G.; Bai, Y.P. Risk-based optimization of emergency response systems for accidental gas leakage in utility tunnels. Reliab. Eng. Syst. Saf. 2024, 244, 109947. [Google Scholar] [CrossRef]
  39. Bai, Y.P.; Wu, J.S.; Liu, K.Q.; Sun, Y.X.; Shen, S.Y.; Cao, J.J.; Cai, J.T. Energy-based coupling risk assessment (CRA) model for urban underground utility tunnels. Eng. Syst. Saf. 2024, 250, 110255. [Google Scholar] [CrossRef]
Figure 1. Geographical location map of Baima Highway Tunnel.
Sustainability 16 06990 g001
Figure 2. Schematic diagram of jet fan arrangement.
Sustainability 16 06990 g002
Figure 3. Cloud map of gas distribution at 200 m spacing.
Sustainability 16 06990 g003
Figure 4. Distribution of wind flow lines with spacing of 200 m.
Sustainability 16 06990 g004
Figure 5. Cloud map of gas distribution at 400 m spacing.
Sustainability 16 06990 g005
Figure 6. Distribution of wind flow lines with spacing of 400 m.
Sustainability 16 06990 g006
Figure 7. Cloud map of gas distribution at 600 m spacing.
Sustainability 16 06990 g007
Figure 8. Distribution of wind flow lines with spacing of 600 m.
Sustainability 16 06990 g008
Figure 9. Cloud map of gas distribution at 800 m spacing.
Sustainability 16 06990 g009
Figure 10. Distribution of wind flow lines with spacing of 800 m.
Sustainability 16 06990 g010
Figure 11. Changes in gas concentration in the left arch foot of the tunnel face. (a) Change in gas concentration in the left tunnel hole. (b) Error between measured and simulated values after the optimization of the left tunnel hole. (c) Change in gas concentration in the right tunnel hole. (d) Error between measured and simulated values after the optimization of the right tunnel hole values.
Sustainability 16 06990 g011
Figure 12. Energy consumption at three spacings.
Sustainability 16 06990 g012
Table 1. Measurement results of coal seam gas base parameters from Baima Highway Tunnel samples.
LocationDensity (t/m3)Porosity (%)Gas Pressure (MPa)Adsorption ConstantIndustrial AnalysisGas Content (m3/t)Corrected Gas Content (m3/t)
abAadMadVdaf
Air-supply inclined shaft (right tunnel); station number: XJSK0 + 9652.566.230.1527.551.183.921.528.240.500.70
Exhaust inclined shaft (left tunnel); station number: XJPK1 + 0602.586.860.1627.41.1483.21.667.510.550.77
Right palm face of branch tunnel; station number: K35 + 1802.657.670.1426.951.2382.411.629.450.550.76
Table 2. Model and working parameters of the jet fans.
Fan ModelMain Parameters of the Jet Fans
Number of PolesAir Volume (m3/s)Exit Wind Speed (m/s)Axial Thrust (N)Motor Power (kw)
SDS-11.2-4P-6-33°4P37.438204855
Table 3. Parameters for the deployment of the jet fans.
Working Condition1234
Spacing of jet fans200 m400 m600 m800 m
Number of fans installed5 units each for left and right holes4 units each for left and right holes3 units each for left and right holes3 units each for left and right holes
Table 4. Calculation model parameter settings.
Calculation ParametersSetting Options
Spatial attributesTwo-dimensional space
Temporal attributesUnsteady flow
Speed attributesAbsolute speed
SolverPressure basis solution
Turbulence modelStandard k-ε model
Component modelComponent transport model
EnergyEnergy equations
Wall treatmentStandard wall function
Fluid componentsMethane–air
Solving algorithmCoupled solution
Table 5. Energy conservation situation.
Spacing/mMonthly Energy Savings/MW·hAnnual Energy Savings/MW·hMonthly Electricity Cost Savings/CNYAnnual Electricity Cost Savings/CNY
200158.41900.8114,8401,378,080
40079.2950.457,420689,040
Disclaimer/Publisher’s Note: The statements, opinions and data contained in all publications are solely those of the individual author(s) and contributor(s) and not of MDPI and/or the editor(s). MDPI and/or the editor(s) disclaim responsibility for any injury to people or property resulting from any ideas, methods, instructions or products referred to in the content.

