Article

The Role of Atmospheric Circulation in Favouring Forest Fires in the Extreme Southern Portugal

by
Carolina Purificação
1,2,*,
Alice Henkes
3,
Stergios Kartsios
4 and
Flavio Tiago Couto
1,2,5
1
Instituto de Investigação e Formação Avançada—IIFA, Universidade de Évora, Palácio do Vimioso, Largo Marquês de Marialva, Apart. 94, 7002-554 Évora, Portugal
2
Instituto de Ciências da Terra—ICT (Polo de Évora), Earth Remote Sensing Laboratory (EaRS Lab), Universidade de Évora, Rua Romão Ramalho, 59, 7000-671 Évora, Portugal
3
Leipzig Institute for Meteorology, Universität Leipzig, Stephanstraße 3, 04103 Leipzig, Germany
4
Department of Meteorology and Climatology, School of Geology, Faculty of Sciences, Aristotle University of Thessaloniki (AUTh), 54124 Thessaloniki, Greece
5
Departamento de Física, Escola de Ciências e Tecnologia, Universidade de Évora, Rua Romão Ramalho, 59, 7000-671 Évora, Portugal
*
Author to whom correspondence should be addressed.
Sustainability 2024, 16(16), 6985; https://doi.org/10.3390/su16166985
Submission received: 8 July 2024 / Revised: 7 August 2024 / Accepted: 12 August 2024 / Published: 15 August 2024
(This article belongs to the Section Hazards and Sustainability)

Abstract

The study explores two forest fires in extreme southern Portugal aiming to increase the knowledge of how atmospheric circulation influenced the fire dynamics in each event. The meteorological conditions were simulated by the Meso-NH full-physics non-hydrostatic limited-area research model. The two numerical simulations were performed using a two-way nested domain configuration with horizontal resolutions of 2500 m and 500 m. In both cases, the large-scale atmospheric environment was marked by the Azores Anticyclone west of Portugal which induced northerly winds over the coastal of Mainland Portugal. The analysis of Tavira’s fire (18–21 July 2012, 24,800 ha of total burned area) revealed flow characteristics resembling a low-level jet located below 1 km, with stronger winds during the second day resulting in enhanced fire spread rates. The second case study (Aljezur, 19–21 June 2020; 2302 ha of burned area) highlights a fire occurring under atypical fire weather conditions, namely lower air temperature and higher relative humidity; however, orographic effects produced downslope winds favouring fire propagation. This study provides a better understanding of the fire critical conditions in extreme South Portugal and investigates the atmosphere–orography interactions in the region that played an important role in the development of these two forest fires. Increasing knowledge about large fires in Southern Portugal can support fire management practices and encourage the sustainable development of the region.

1. Introduction

Forest fires are greatly influenced by the prevailing atmospheric conditions in terms of fire spread and behaviour at several different spatial and temporal scales. These conditions can determine the duration and severity of wildfires, as well as their potential to cause large and destructive effects. Under specific meteorological conditions, some fires can produce their own meteorology, e.g., the development of pyro-Cumulonimbus (pyroCb) clouds [1,2,3]. On the other hand, forest fires can also be impacted by large-scale wind patterns, which can result in rapid changes in fire propagation rates. In the western United States, for instance, extreme fire behaviour and spread can be connected to weather patterns producing the Santa Ana winds in California, which occur through the presence of a high-pressure system over the Great Basin simultaneously with a low-pressure system offshore of southern California [4,5,6,7]. Mediterranean regions, especially Greece and Croatia, have also experienced a significant number of forest fires in recent years, originating from the intense surface winds, leading to the rapid spread of fire [8,9,10,11].
In many cases, intense winds can be determined by large-scale synoptic weather pattern. Tomshin and Solovyev [12] described synoptic-scale and surface-level weather conditions in Siberian forest fires during the summer months. The spatio-temporal analysis of weather parameters indicated the formation of a positive geopotential height anomaly as the primary factor influencing the atmospheric circulation and consequently the spread of fires. This anomaly determined the presence of an anticyclone directly above the location of the fire, contributing to the drying of fuel and increasing fire risk. Therefore, identifying the large-scale atmospheric circulation patterns, which are associated with extreme fires, is crucial to understanding the meteorological drivers of wildfires and for developing early warning systems leading to the decrease in fire impact in these regions [13].
Large-scale synoptic systems over mountainous areas interact with local topography, impacting fire evolution. The spatial and temporal variations in meteorological conditions at the micro-, meso-, and synoptic scales are challenging to quantify due to the complex interactions between atmospheric flows and the rugged topography, especially during forest fires [14]. Therefore, the combined effect of orography and atmospheric circulation generates substantial conditions for fire front propagation, which is a major concern in many fire events [8,15,16,17].
Local effects, especially in Portugal’s mountainous regions, play a crucial role in fire behaviour. In July 2019, Vila de Rei’s forest fire developed under the influence of the Azores anticyclone and the Iberian thermal low. This weather pattern produced intense northwest winds on the western Iberian Peninsula, favouring the rapid spread of the fire and characterising the event as a wind-driven fire [18]. The positioning of the Azores anticyclone has also an important role in fire weather conditions on the island of Madeira due to orographic effects [19], where strong gusty winds lead to extreme fire behaviour, as verified in the wildfire of August 2016 [19,20]. In winter 2022, the semi-stationary anticyclone centred in the Bay of Biscay favoured dry easterly winds over the Iberian Peninsula, creating conditions for erratic fire spread due to orographic effects in Northern Portugal [21]. This wind pattern, disturbed by the complex terrain of the region, was characterised by a downslope wind that remained stationary during the entire period, particularly where the fire was ignited. Such events not only promote the rapid drying of fine fuels but also facilitate the rapid spread of fire fronts [22].
In the extreme Southern Portugal, the atmospheric circulation interacting with the orography can also create favourable conditions for fire ignition and development in the region. Purificação [23] explored in detail two mega-fires that occurred in the Monchique Mountain Range in August 2003 and 2018. Besides the typical fire weather conditions at the surface, i.e., high temperatures and low relative humidity, the authors highlighted that the interaction of Monchique’s Mountain shape and orientation with the airflow in the lowest tropospheric levels increased turbulence in the atmospheric boundary layer, as well as induced upslope and downslope winds that favoured the rapid propagation of the fire fronts. Furthermore, in the absence of significant synoptic circulations, a sea breeze from the south coast of Portugal contributed to the strong downslope winds observed on the northwestern side of the Monchique Mountain Range.
Taking into account previous studies about the atmospheric conditions interacting with orography in Portugal [18,19,21,23], this study aims to answer the following question: How does atmospheric circulation influence fire dynamics in the extreme Southern Portugal during forest fire events? Therefore, the present study uses atmospheric numerical modelling to investigate, increase knowledge, and obtain a better understanding of the meteorological environment that affected the development of the two distinct forest fires situated in the other mountains of the extreme Southern Portugal. Furthermore, a better understanding of fire events in the region can be a step toward a sustainable development of the region, supporting better fire management practices.
The article is structured as follows. Section 2 presents the data and methodology applied in the study. The results are presented in Section 3, followed by discussion and conclusions in Section 4.

2. Materials and Methods

2.1. Study Region and Case Studies

In South Portugal, some regions are often impacted by wildfires, which play an important role in human activities [24]. Algarve is situated in the extreme Southern Portugal at 37.242° N by 8.170° W and occupies an area of 4997 km2, as shown in Figure 1a. The region is subdivided into three large areas with a coastline that extends for 320 km at low altitudes under 50 m above sea level [25]. The Barrocal is in the centre of the Algarve and is a transition zone between the coast and the mountains with altitudes below 500 m above sea level. The Northern Algarve is composed of several mountain ranges, which represent 50% of the territory, and the main mountain ranges are the Espinhaço de Cão Mountain Range, the Monchique Mountain Range, and the Caldeirão Mountain Range (Figure 1b). The Espinhaço de Cão Mountain Range has a progressive increase in height from 100 m to more than 350 m, corresponding to the highest places on the border with another mountain, the Monchique Mountain Range [26]. The Monchique Mountain Range is the highest point in the Algarve with a 902 m altitude, with rugged reliefs and embedded, successive, and abundant valleys, specifically in the north and centre zone [27]. The Caldeirão Mountain Range is situated in the central area and part of the Eastern Algarve at 589 m above sea level and is the largest mountain range of Algarve (Figure 1b). Although it is a low altitude mountain, its relief is quite rugged in several places, forming a very peculiar landscape with rounded elevations mostly made up of temporary watercourses [28]. This mountain system is a large expanse in a roughly elliptical shape, with the major axis oriented in the WNW–ESE direction [29]. In this direction, it measures around 70 km and is divided into two flanks: the first is located further north with small elevations (A) and a second located in the Algarve and is formed by the highest point of the mountains at 589 m altitude in Pelados (B). Furthermore, there is also a flank further south, on the border between the Barrocal and the interior, which has several points above 500 m in the municipalities of Tavira and São Brás de Alportel (C).
The mountains have a significant influence on the climate of the Algarve, creating a physical barrier to the low-level atmospheric flow and presents a temperate climate with Mediterranean characteristics, e.g., hot and dry summers and mild winters. Furthermore, there is a predominance of north-westerly winds in the region [30,31]. Besides the orographic aspects, Algarve consists of a landscape with some forest species depending on the altitude throughout the region. For instance, strawberry trees and cork oaks are present primarily in the Barrocal, whereas in the mountain areas, monocultures of species such as eucalyptus and maritime pine predominate [32,33].
Purificação [23] highlighted the orographic effect as a phenomenon which plays an important role in fire development and enhances the fire danger in the Monchique Mountain Range. Here, this study focuses on increasing knowledge of the atmosphere-orography interactions that played a key role in the development of two distinct forest fires that occurred in other two mountains of the region. In the first case study, the Tavira fire burned an area of 24,800 ha across an extensive area of the Caldeirão Mountain Range, namely in Tavira and São Brás de Alportel municipalities. The fire started in Catraia village at 1300 UTC on 18 July 2012 and was brought under control on 21 July 2012 [34]. The second case study, the Aljezur fire, began in Vilarinha village (Aljezur county) and ignited at 1200 UTC on 19 June 2020, burning until 21 June 2020 [35]. This forest fire crossed parts of Espinhaço de Cão Mountain Range, burning a total area of approximately 2302 ha.

2.2. Synoptic Data

The large-scale circulation was characterised using the data obtained from the operational archive of the European Centre for Medium-Range Weather Forecasts (ECMWF), namely from the Meteorological Archival and Retrieval System [36]. The data have a horizontal resolution of 0.125 × 0.125 degrees and to synoptic hours (0000 UTC, 0600 UTC, 1200 UTC, 1800 UTC). We have characterised the large-scale circulation during the events from the mean sea level pressure, the geopotential height, and wind speed and direction at 250 hPa, 500 hPa, and 850 hPa.

2.3. Weather Stations Data

The meteorological variables of hourly average air temperature (°C), average relative humidity (%), average wind direction (°), and average wind intensity (m s−1) were obtained from seven automatic weather stations located in Algarve and were provided by the Portuguese Institute for Sea and Atmosphere (IPMA). This dataset was used to validate the model output using a point-to-point comparison method [19,23] and the Mean Error (ME) and Root Mean Squared Error (RMSE) [37].

2.4. Numerical Modelling

2.4.1. Numerical Experiments

This study explores two simulations performed through the cloud-resolving simulation research model Meso-NH 5-6-0 [38]. The Meso-NH is a non-hydrostatic limited-area numerical model for studying atmospheric phenomena, enabling the depiction of various physical processes that occur in the Earth’s atmosphere and across a range of spatial and temporal scales. In the present study, the physical configuration of the model is similar to those successfully used in previous studies (e.g., [18]) and uses the parametrisation schemes shown in Table 1. Shallow convection is parameterized only in the large domain using the EDKF scheme [39], while deep convection is explicitly resolved by the model. The ICE3 cloud microphysics scheme [40], which considers six species of water substance (water vapour, cloud droplets, raindrops, graupel, snow, and ice crystals), was activated in both domains. The radiation parameterisation was based on the Rapid Radiative Transfer Model [41]. The turbulence scheme in the large domain was considered in a simplified 1D version [42], while in the 500 m domain, the full 3D turbulent fluxes scheme was implemented [43]. Finally, surface fluxes were obtained through the externalised surface model SURFEX [44].
Initial and boundary conditions (every 6 h) were obtained from operational analyses by ECMWF. The model orography was derived from the Shuttle Radar Topography Mission (SRTM) database at 30 m [45], and the surface was characterised using the ECOCLIMAP-II dataset available at a 1 km resolution for Europe [46]. Soil categories were inserted into the model utilizing SoilGrids 2.0, a system of digital soil mapping at a 10 arc sec resolution (~300 m), given in fractions by percent weight [47].
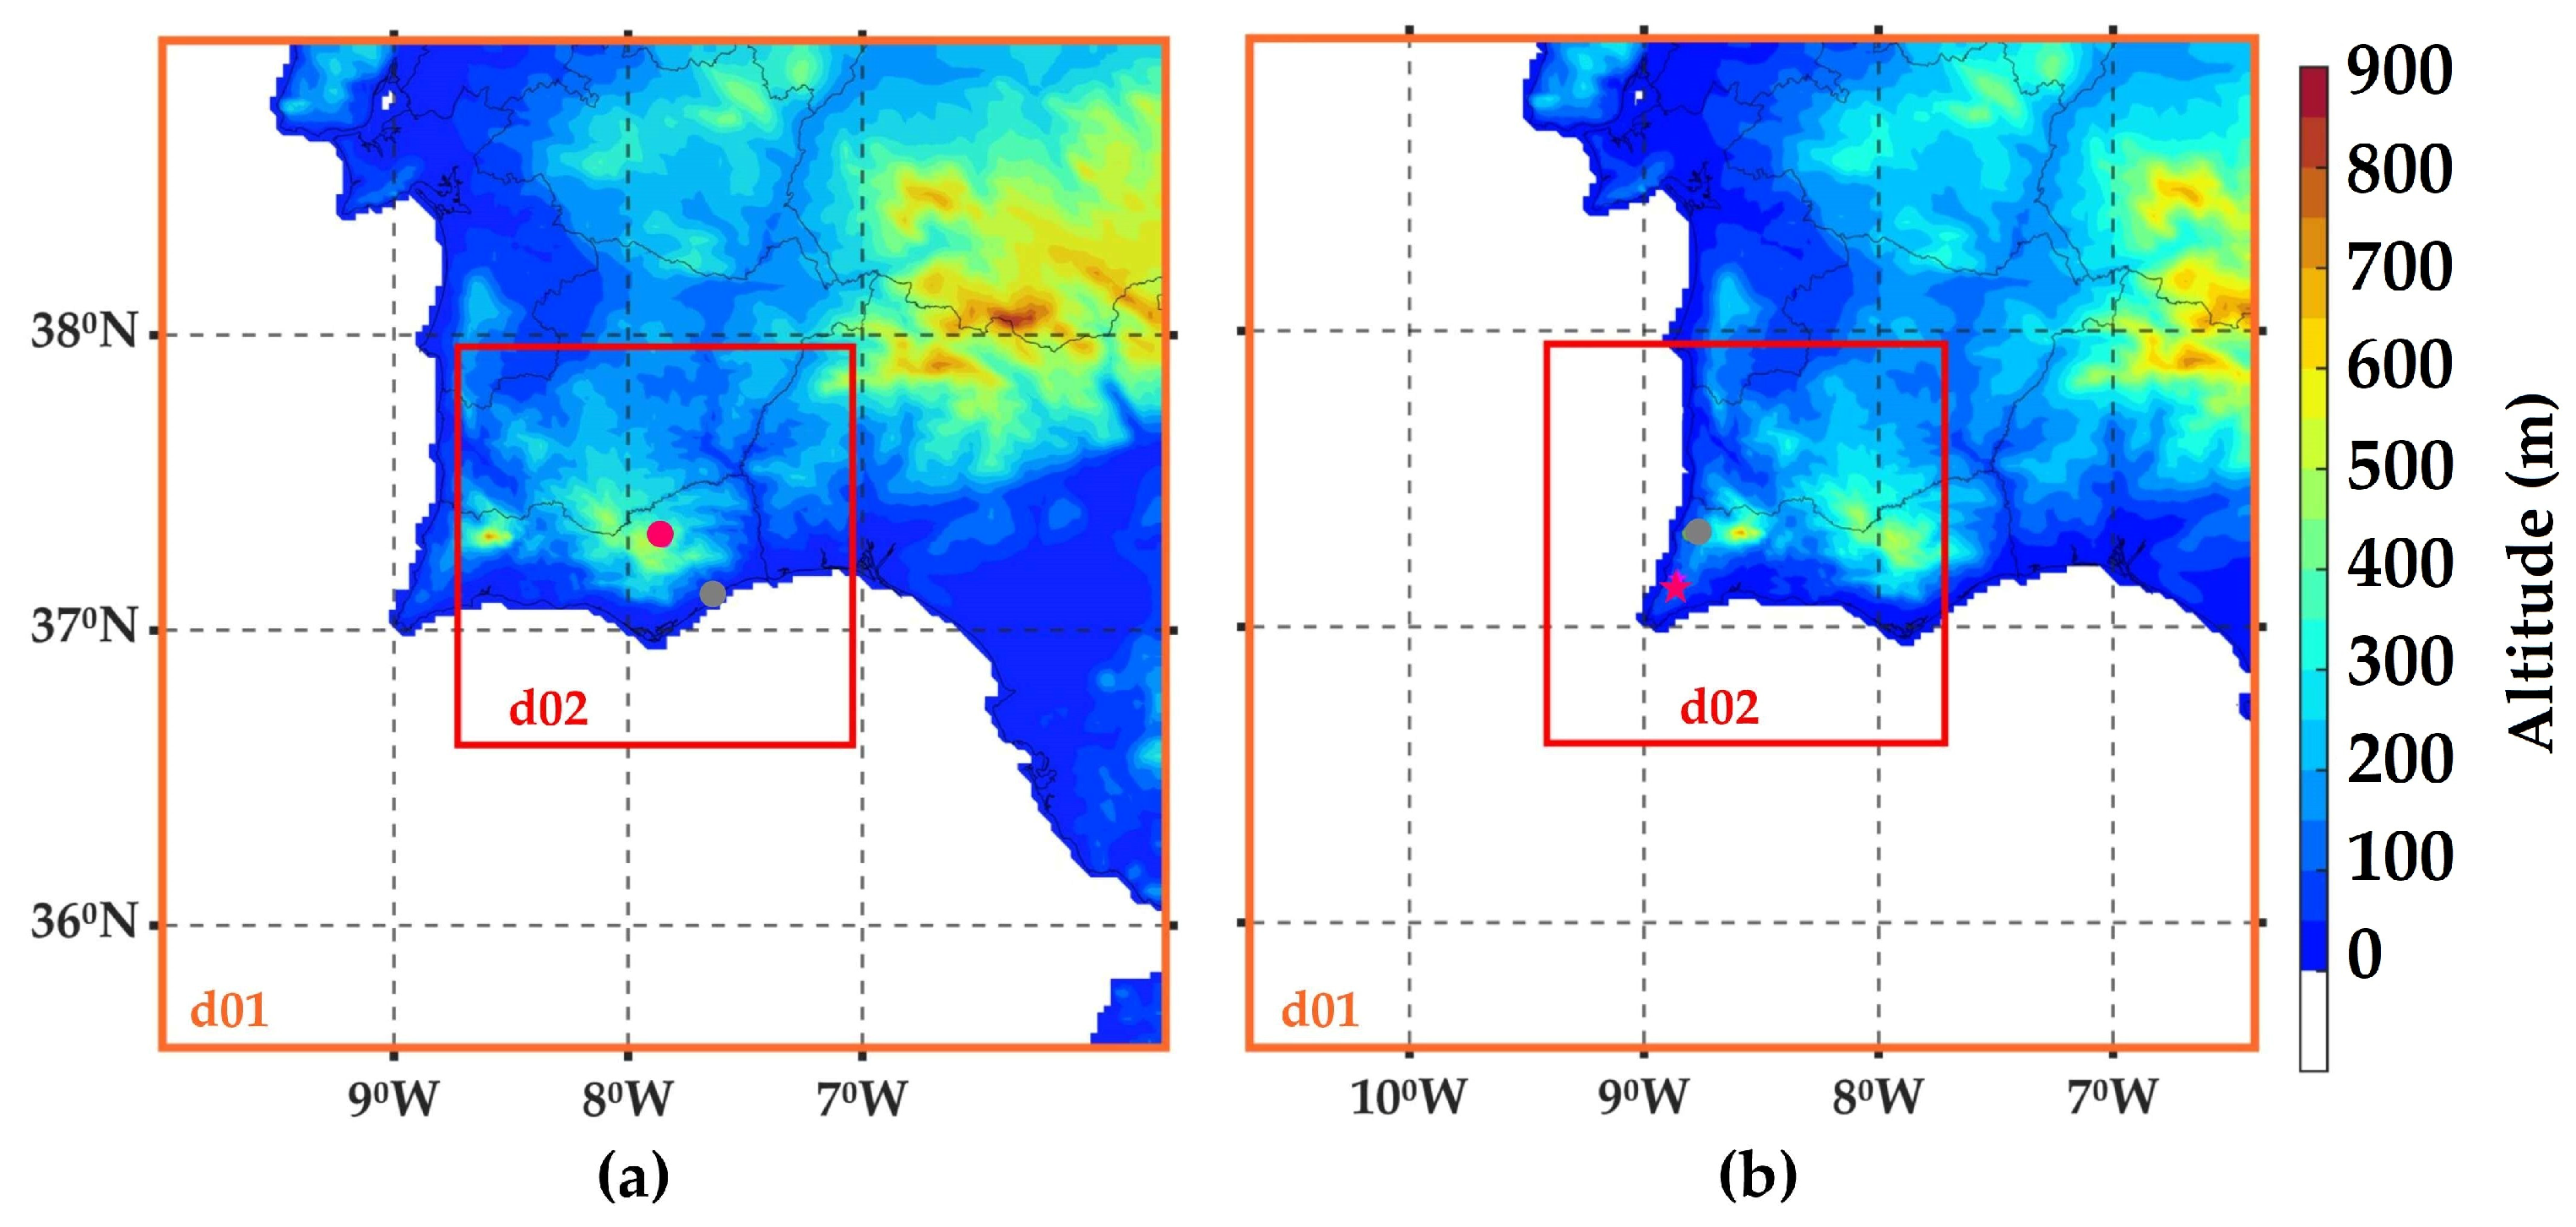
To characterise the atmospheric conditions and the local circulation over the Algarve region, unlike to previous study [23] which had just a single domain at a 2.5 km resolution, the numerical experiments here were performed using two nested domains (Figure 2). The parent domain (d01) had a horizontal resolution of 2.5 km × 2.5 km (150 × 150 grid points) and covered 375 × 375 km2 of South Portugal and part of Spain, while the inner domain (d02) had a 0.5 km × 0.5 km horizontal resolution (300 × 300 grid points) and encompassing a region of 150 × 150 km2. The inner domain was used to better represent the complex terrain characteristics throughout the region. The vertical configuration was the same in both domains and deployed 50 terrain-following vertical levels.
In the case of the Tavira fire (TAV-fire), the d01 initialized at 0000 UTC on 18 July 2012, while the d02 initialized at 0600 UTC on the same day. The simulation window was up to 0000 UTC on 20 July 2012 (a total of 48 h). According to the official report [34], there were some instances that were crucial to the fire development, namely to the increase of the burned area. Therefore, we configured the numerical experiment taking into account these moments, which led to the simulation window being smaller than the duration of the entire fire event. For the Aljezur case study (ALJ-fire), the model initialized at 0000 UTC on 19 June 2020 (the d02 started six hours later) and ran until 0000 UTC on 21 June 2020 (48 h in total).

2.4.2. Model Verification

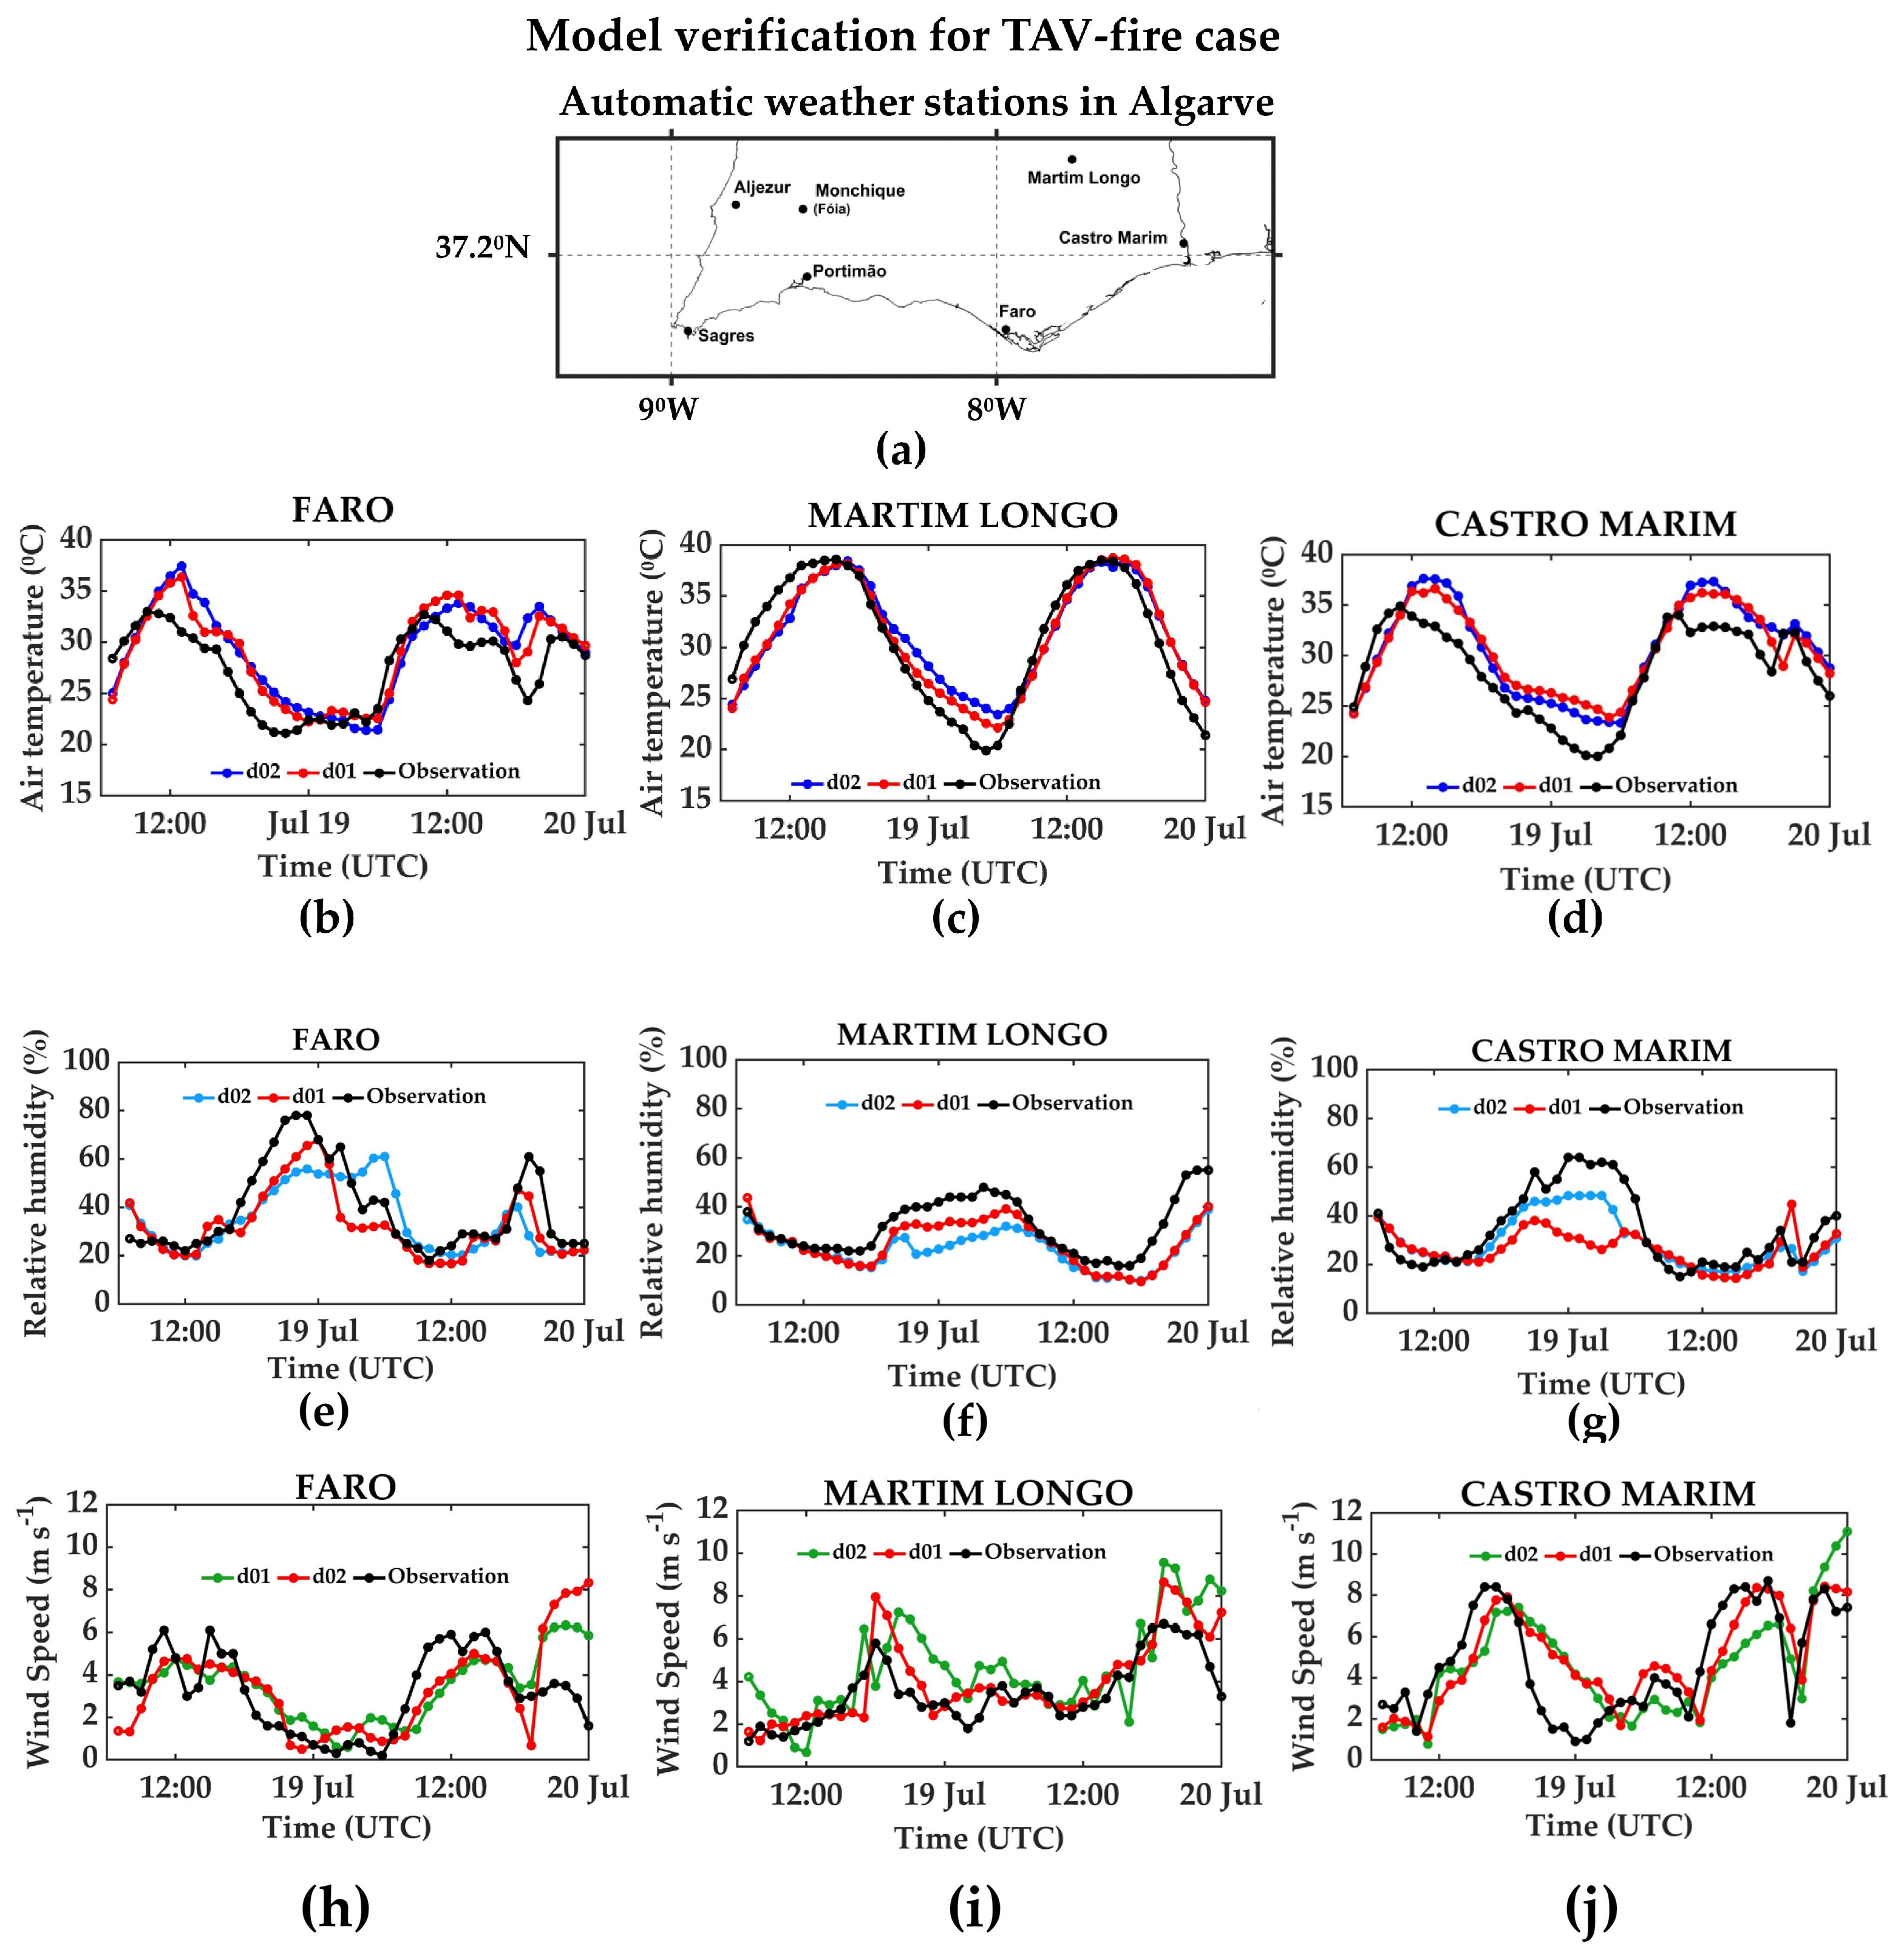
The point-to-point comparison of the hourly data of average air temperature (T2M, °C), average relative humidity (RH2M, %), and average wind speed (WIND, m s−1) was applied in both cases at the weather stations located near to the forest fires (Figure A1a). The model verification was performed only between T + 6 h and T + 48 h, as depicted in Figure A1 and Figure A2.
In the TAV-fire case, the d02-T2M was overestimated by 6 °C by the model (dark blue line) in Faro, except in the morning of 18 and 19 July 2012 (Figure A1b). The maximum air temperatures were adequately represented by the model in d01 and d02 (dark blue and red lines) in Martim Longo during the verification period (Figure A1c), while there was an overestimation of the simulated values for the minimum temperatures between the late afternoon on 18 July and morning of 19 July 2012. However, in Castro Marim, the T2M were overestimated at 5 °C by the d01 and d02 (dark blue and red lines), except on the morning of 18 July 2012 (Figure A1d). Furthermore, it is noteworthy that in Castro Marim, the minimum temperatures were simulated more accurately by the model in d02 (0.5 km) in comparison to those in d01 (2.5 km) between 1700 UTC on 18 July and 0600 UTC on 19 July 2012 (Figure A1d). Regarding RH2M, Figure A1e shows that the model underestimated the observed values in Faro throughout the verification period by around 20% at 2200 UTC on 18 July 2012. Moreover, the d02-RH2M (light blue line) in Faro was overestimated between 0400 and 1000 UTC on 19 July 2012 (Figure A1e). In Martim Longo, the RH2M observation was underestimated by the model in d01 and d02, except on the mornings of 18 and 19 July 2012 (Figure A1f). The RH2M in Castro Marim was also underestimated by the model in d01 and d02, except on the mornings of 18 and 19 July and at 2000 UTC on 19 July 2012, as shown in Figure A1g. During these underestimated periods, the d02-simulated RH2M values (light blue line) are closer to the observed ones, for example, between 1600 UTC on 18 July and 0500 UTC on 19 July 2012. Regarding WIND, Figure A1h,i show that the model overestimated the observed values between the late afternoon of 18 July and the morning of 19 July, and in the early night of 19 July 2012 in Faro (except in d01) and Castro Marim. In Martim Longo, the d01-WIND (red line) follows the behaviour of the observed values along the entire verification period, as shown in Figure A1j. In the case of d02, the WIND simulated (green line) overestimates the observations in the late afternoon on both the days (Figure A1j).
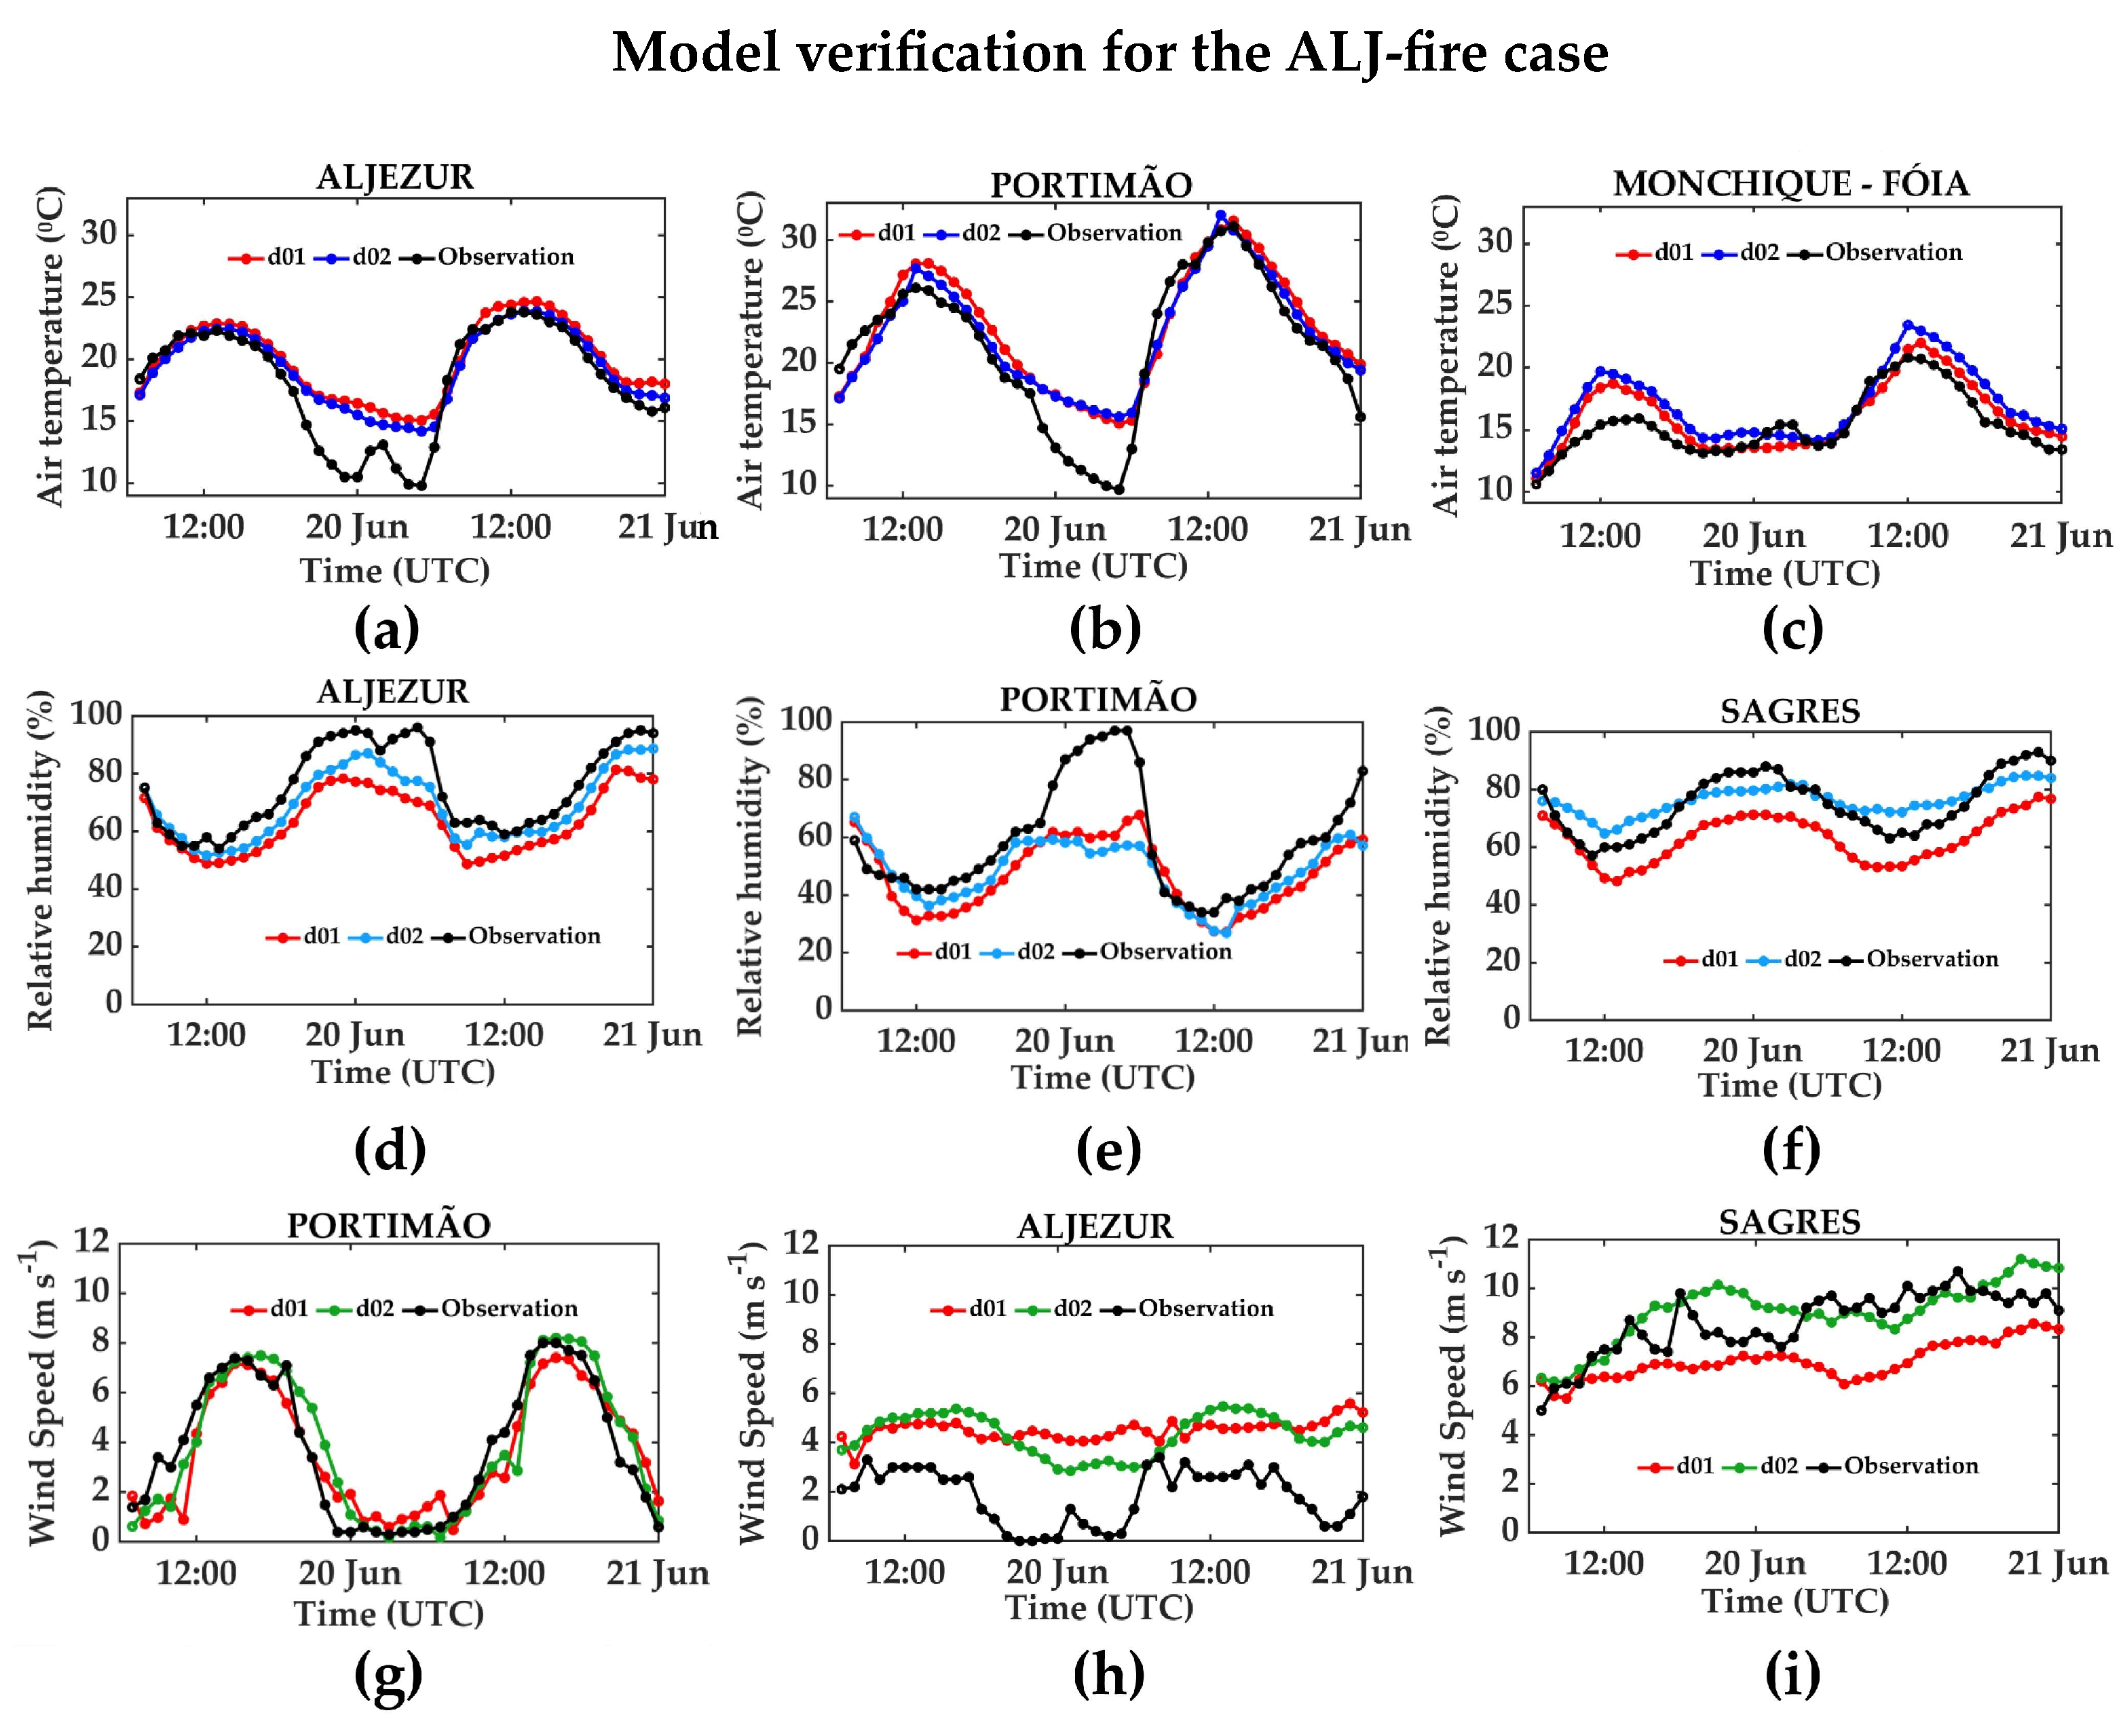
For the ALJ-fire case, Figure A2a,b indicate that the maximum T2M were accurately simulated in Aljezur and Portimão, except for an overestimation by the model in d01 and d02 between the early night of 19 June and the morning of 20 June 2020. In the Monchique-Fóia station, the T2M observation was overestimated by the model along the verification period, except for an underestimation in the middle of the night on 20 June 2020 (Figure A2c). The simulated RH2M of the d02 values (light blue line) were closer to the observations in Aljezur, Sagres, and Portimão, as shown in Figure A2d,f. However, there was an underestimation of the RH2M observation by the d02 simulation between the night of 19 June and the morning of 20 June 2020 in Portimão (Figure A2e). Regarding the simulated WIND, Figure A2g indicates that the values of the Portimão weather station were well simulated by the model, while there was an overestimation of the observed values in Aljezur throughout the verification period (Figure A2h). In Sagres, the d02-WIND (green line) follows the observed values throughout the entire verification period, except between the late afternoon of 19 June and in the middle of the night (0300 UTC) on 20 June 2020 (Figure A2i).
Table 2 presents the Mean Error (ME) and Root Mean Squared Error (RMSE) that were calculated for each station for d02 in the TAV-fire case during the afternoon. In the case of T2M, the mean error indicates that the model tended to overestimate the temperature (positive values) with a maximum of RMSE around 4 °C (Martim Longo and Faro stations). In general, RH2M was underestimated by the model with the ME around 6% and the RMSE at 8% at the Faro weather station. The WIND value was well captured by the simulation with errors close to zero and a maximum RMSE of 1.6 m s−1 at the Castro Marim station. For the ALJ-fire case (Table 3), the mean error of T2M was overestimated by the model with a maximum of RMSE around 3 °C (Monchique-Fóia station). The mean RH2M error was underestimated by the model with the ME and RMSE at around 7% at the Aljezur station. In the case of WIND, the mean error indicates that it was well simulated by the model with errors close to zero and a maximum RMSE of about 3 m s−1 at the Aljezur weather station. Due to the low number of available weather stations and thus observational data in the Algarve region, the verification of the model through the calculation of robust statistical indices is insufficient for a deep validation. However, the simple verification demonstrated that the model is able to quantitatively simulate the observed values, even with some under- or overestimation.

3. Results

Results are divided into two subsections that represent the Tavira fire (TAV-fire) and the Aljezur fire (ALJ-fire) in Section 3.1 and Section 3.2, respectively. In these subsections, the synoptic environment is discussed first, followed by the main results of the numerical simulations; this helps us to characterise the mesoscale environment that influenced the fire dynamics for each event.

3.1. Tavira Fire (TAV-Fire), 18–20 July 2012

3.1.1. Large-Scale Conditions

The identification of the prevailing synoptic conditions was carried out for different isobaric levels in terms of geopotential height and wind speed and direction at 1200 UTC on 19 July 2012 (Figure 3), according to the ECMWF operational analyses. At isobaric levels of 250 hPa and 500 hPa (Figure 3a,b), a jet stream with winds coming predominantly from the west and with velocities varying between 30 and 50 m s−1 is observed over the middle to northern latitudes of North America and Europe. Notice the jet stream core extends downwards to 500 hPa.
Figure 3c shows the depression situated in the northwest Atlantic Ocean moving to the northeast, while the wind speeds at 850 hPa are above 30 m s−1. To the south, the Azores anticyclone can be clearly identified with its centre southwest of the Azores archipelago (31° N, 42° W), determining the weather over the subtropical Atlantic Ocean, with a clockwise circulation and geopotential heights of between 1500 and 1650 gpm. In Figure 3d, the mean sea level pressure (hPa), the wind speed, and vectors at 10 m are depicted. The depression in the northwest Atlantic Ocean has a core below 990 hPa with a wind speed higher than 15 m s−1, while the Azores anticyclone presents pressure values above 1020 hPa and a core of 1030 hPa, which extends to the Iberian Peninsula. It is noteworthy that the near surface wind speed is higher than 10 m s−1 and comes predominantly from the northwest, near the coastline of mainland Portugal.

3.1.2. Mesoscale Environment

In order to identify the mesoscale environment that influences the fire dynamics, this section focuses on the analysis of the simulated meteorological variables from the parent domain (d01) that influence fuel conditions and may favour fire evolution, namely air temperature (°C) and relative humidity (%) at 2 m, as well as wind gusts (m s−1) and turbulent kinetic energy (TKE) (m2 s−2) at 10 m. Furthermore, the wind field near Tavira is analysed though the simulation results of the inner domain (d02) to understand the atmospheric dynamics during the forest fire in July 2012.
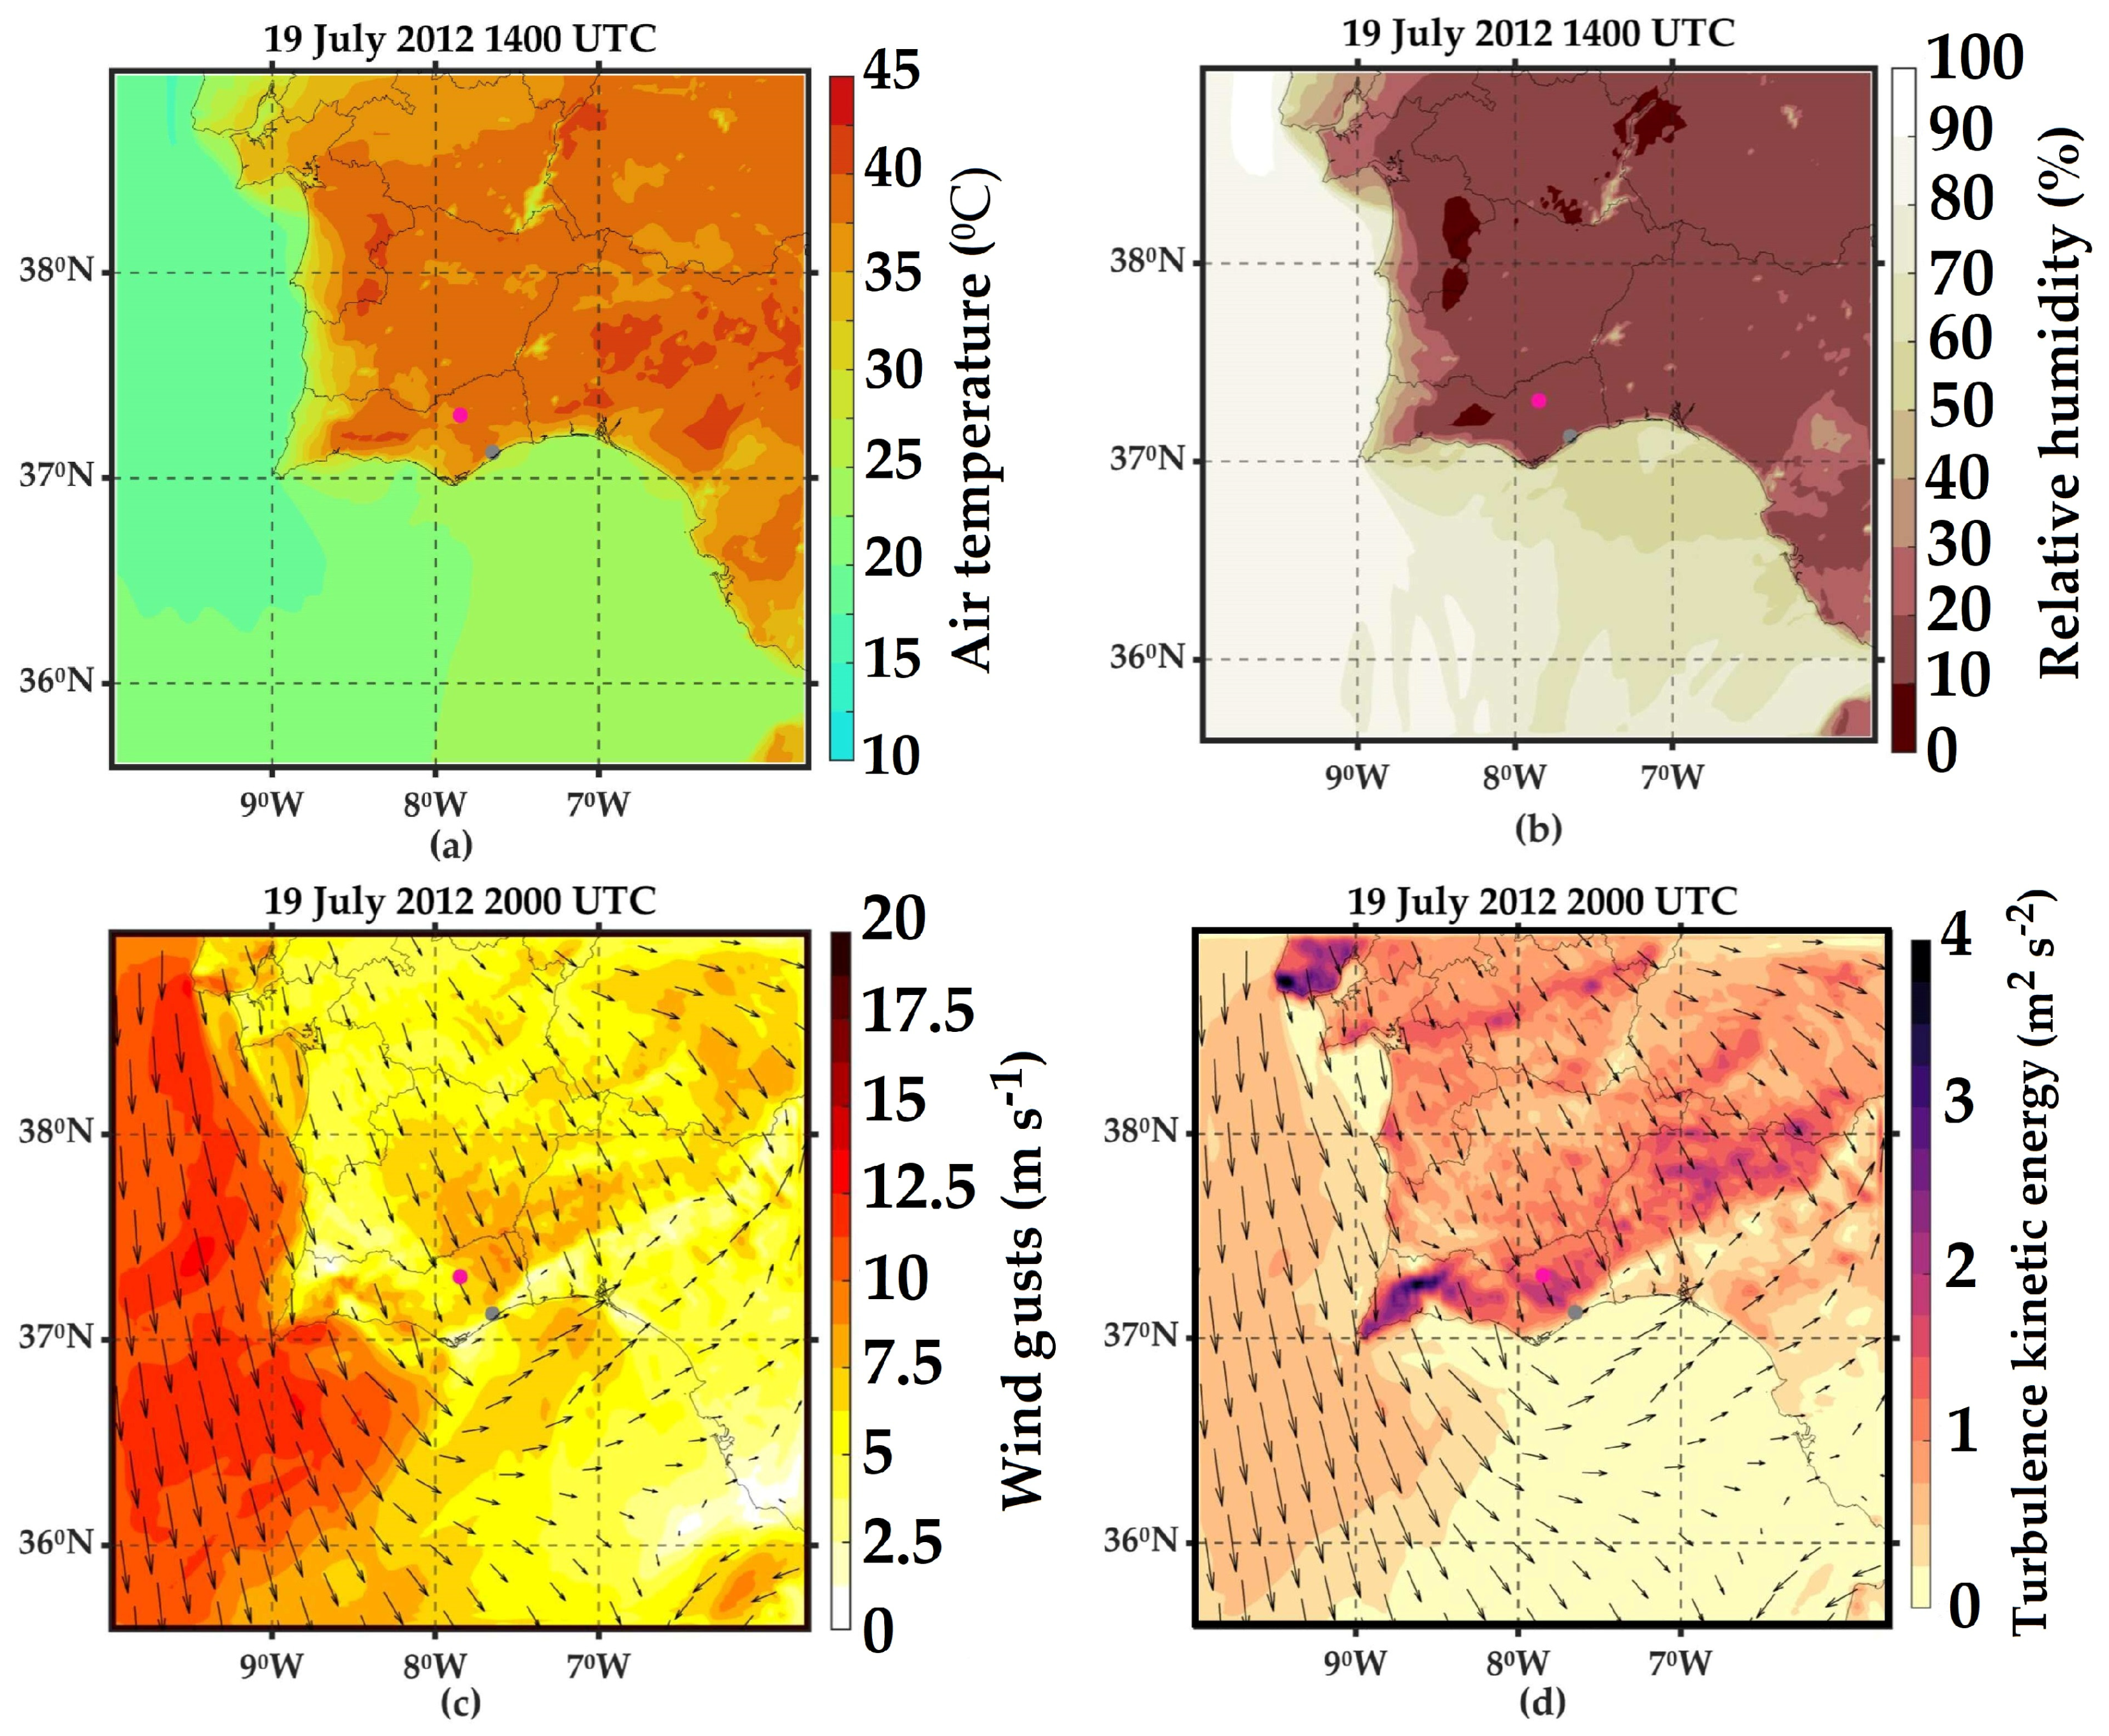
Figure 4a shows the simulated air temperature at 2 m with values above 30 °C at 1400 UTC on 19 July 2012 throughout the Algarve, especially in the Central and Easterly Algarve, in contrast with the coastline of Western Algarve. Most of Southern Portugal presents low relative humidity near the surface (Figure 4b), with values ranging between 10 and 30%; this is in contrast to the coast of Western Algarve, which presents RH values of above 40% at 1400 UTC on 19 July 2012. It is noteworthy that the dry and hot conditions remained in the Catraia location during the entire fire event.
The airflow dynamic at 2000 UTC on 19 July 2012 was also analysed in terms of simulated wind gusts and turbulent kinetic energy near the surface, particularly on the second day of the forest fire. In the early hours of the night on 19 July 2012, the model simulated intense wind gusts reaching 10 m s−1 in some regions of the Algarve, as shown in Figure 4c. This situation is coherent with the report [34]. In addition, the turbulence was explored in the TKE field, with the maximum simulated TKE values reaching 4 m2 s−2 over Southwestern Algarve, particularly in the Monchique Mountain Range, in contrast with lower TKE values (between 1 and 2 m2 s−2) in the other areas (Figure 4d). Moreover, the prevailing north-westerly wind in Southern Portugal indicates air intrusion from the Atlantic Ocean in the region, which can also be observed in the simulated wind field at 925 hPa around the Algarve (Figure 5).
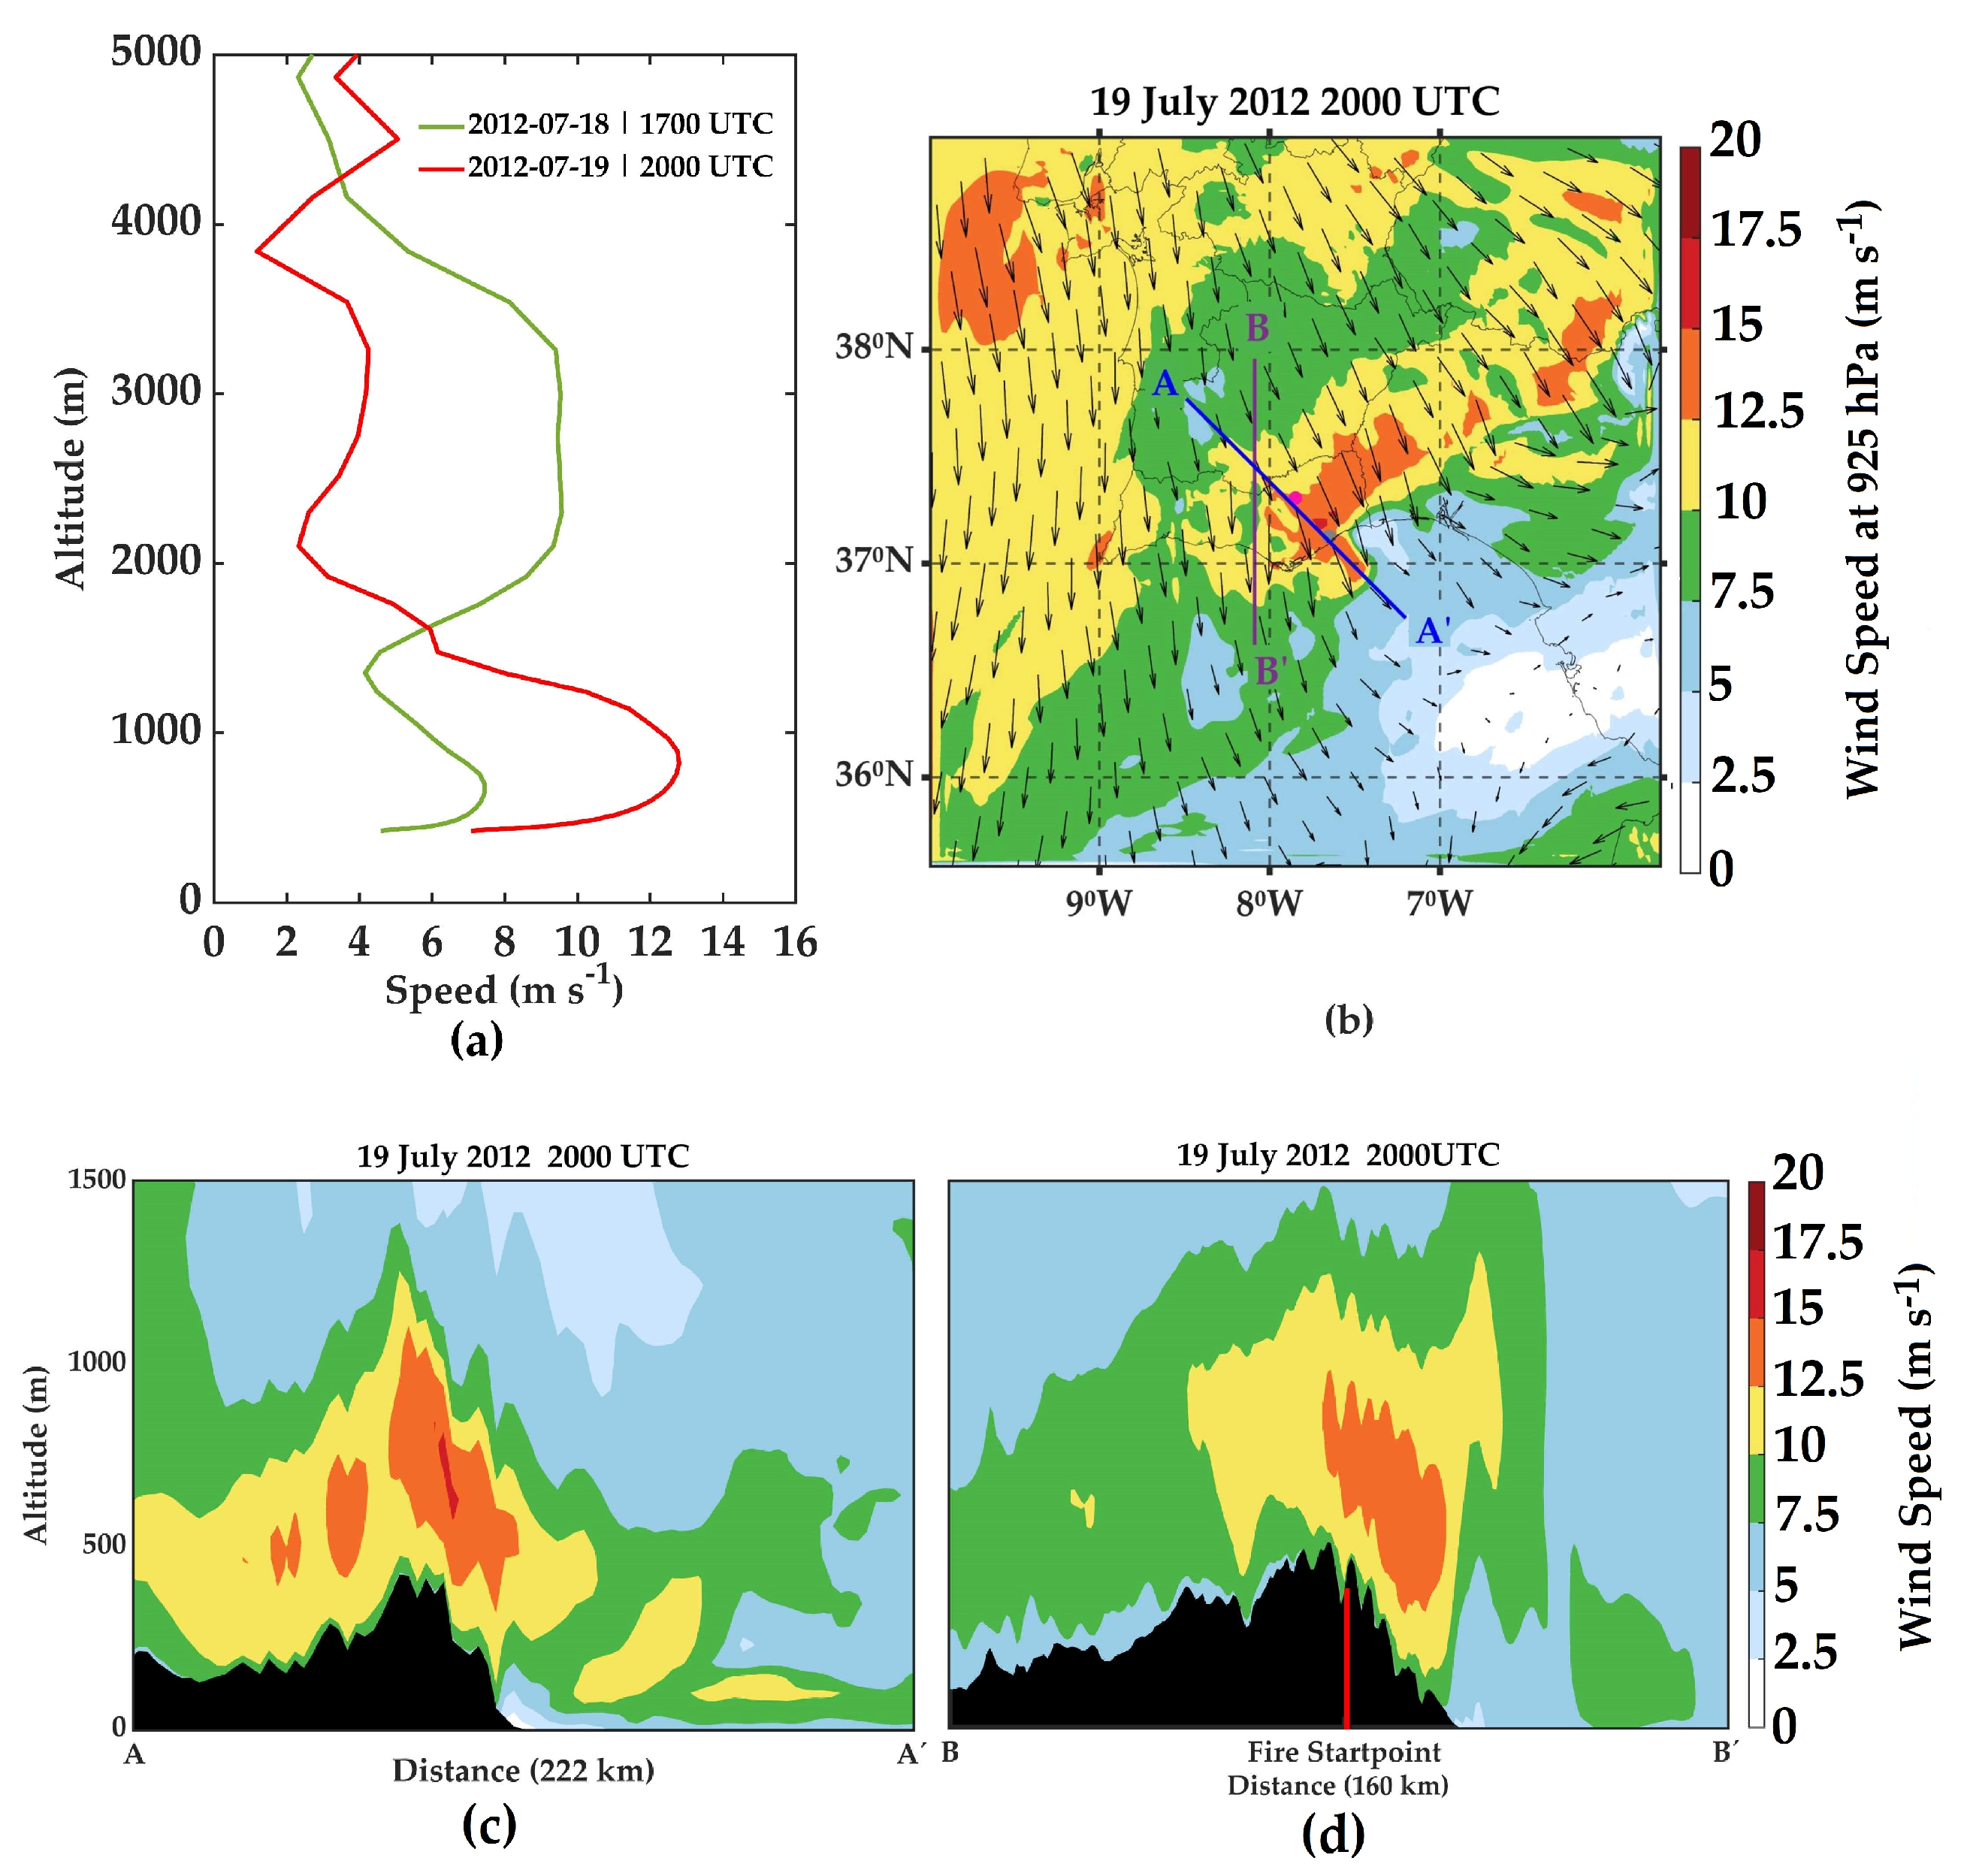
Figure 5a displays the d02-simulated vertical wind profile in the Catraia location at 1700 UTC on 18 July 2012 (green line) and at 2000 UTC on 19 July 2012 (red line). The maximum wind intensity above 7 m s−1 was simulated in a layer between 500 m and 800 m altitude at 1700 UTC on 18 July 2012 (Figure 5a, green line). The next day (19 July 2012), there was an intensification of the airflow near the surface, with maximum winds of 13 m s−1 at 822 m altitude at 2000 UTC (Figure 5a, red line). The wind (speed and direction) fields at 555 m above the sea level (around 925 hPa) at 2000 UTC on 19 July 2012 are shown in Figure 5b, which aims to explore the main features associated with air intrusion presented in Figure 4c,d. This figure shows that the wind blows predominantly from the northwest over Southern Portugal, with wind speeds of around 15 m s−1, especially in Tavira. These strong winds in the lowest tropospheric levels were also identified in the N-S and NW-SE vertical cross-sections of the Caldeirão Mountain Range, denoted as A-A′ and B-B′ in Figure 5b. The wind field in the vertical cross-sections (Figure 5c,d) show a layer between near the surface and below an altitude of 1250 m over the mountain peaks, with wind speeds higher than 10 m s−1. Furthermore, it is noteworthy that the increase in wind speed in this layer is caused by the interaction between the airflow and the orography of the Caldeirão Mountain Range, since the latter is oriented almost perpendicularly to the prevailing winds. The axis C of the Caldeirão Mountain Range (Figure 1b) has an elongated SW-NE orientation. This condition favoured the NW airflow to go over the mountain. The intense airflow over the mountain at less than a 1 km altitude is consistent with the maximum wind speed, as demonstrated in Figure 5a (red line). The analysis of the wind field for the Tavira fire demonstrated that the Caldeirão Mountain’s shape and orientation interacting with the airflow influence atmospheric circulation and consequently the spread of fire.

3.2. Aljezur Fire (ALJ-Fire), 19–21 June 2020

3.2.1. Large-Scale Conditions

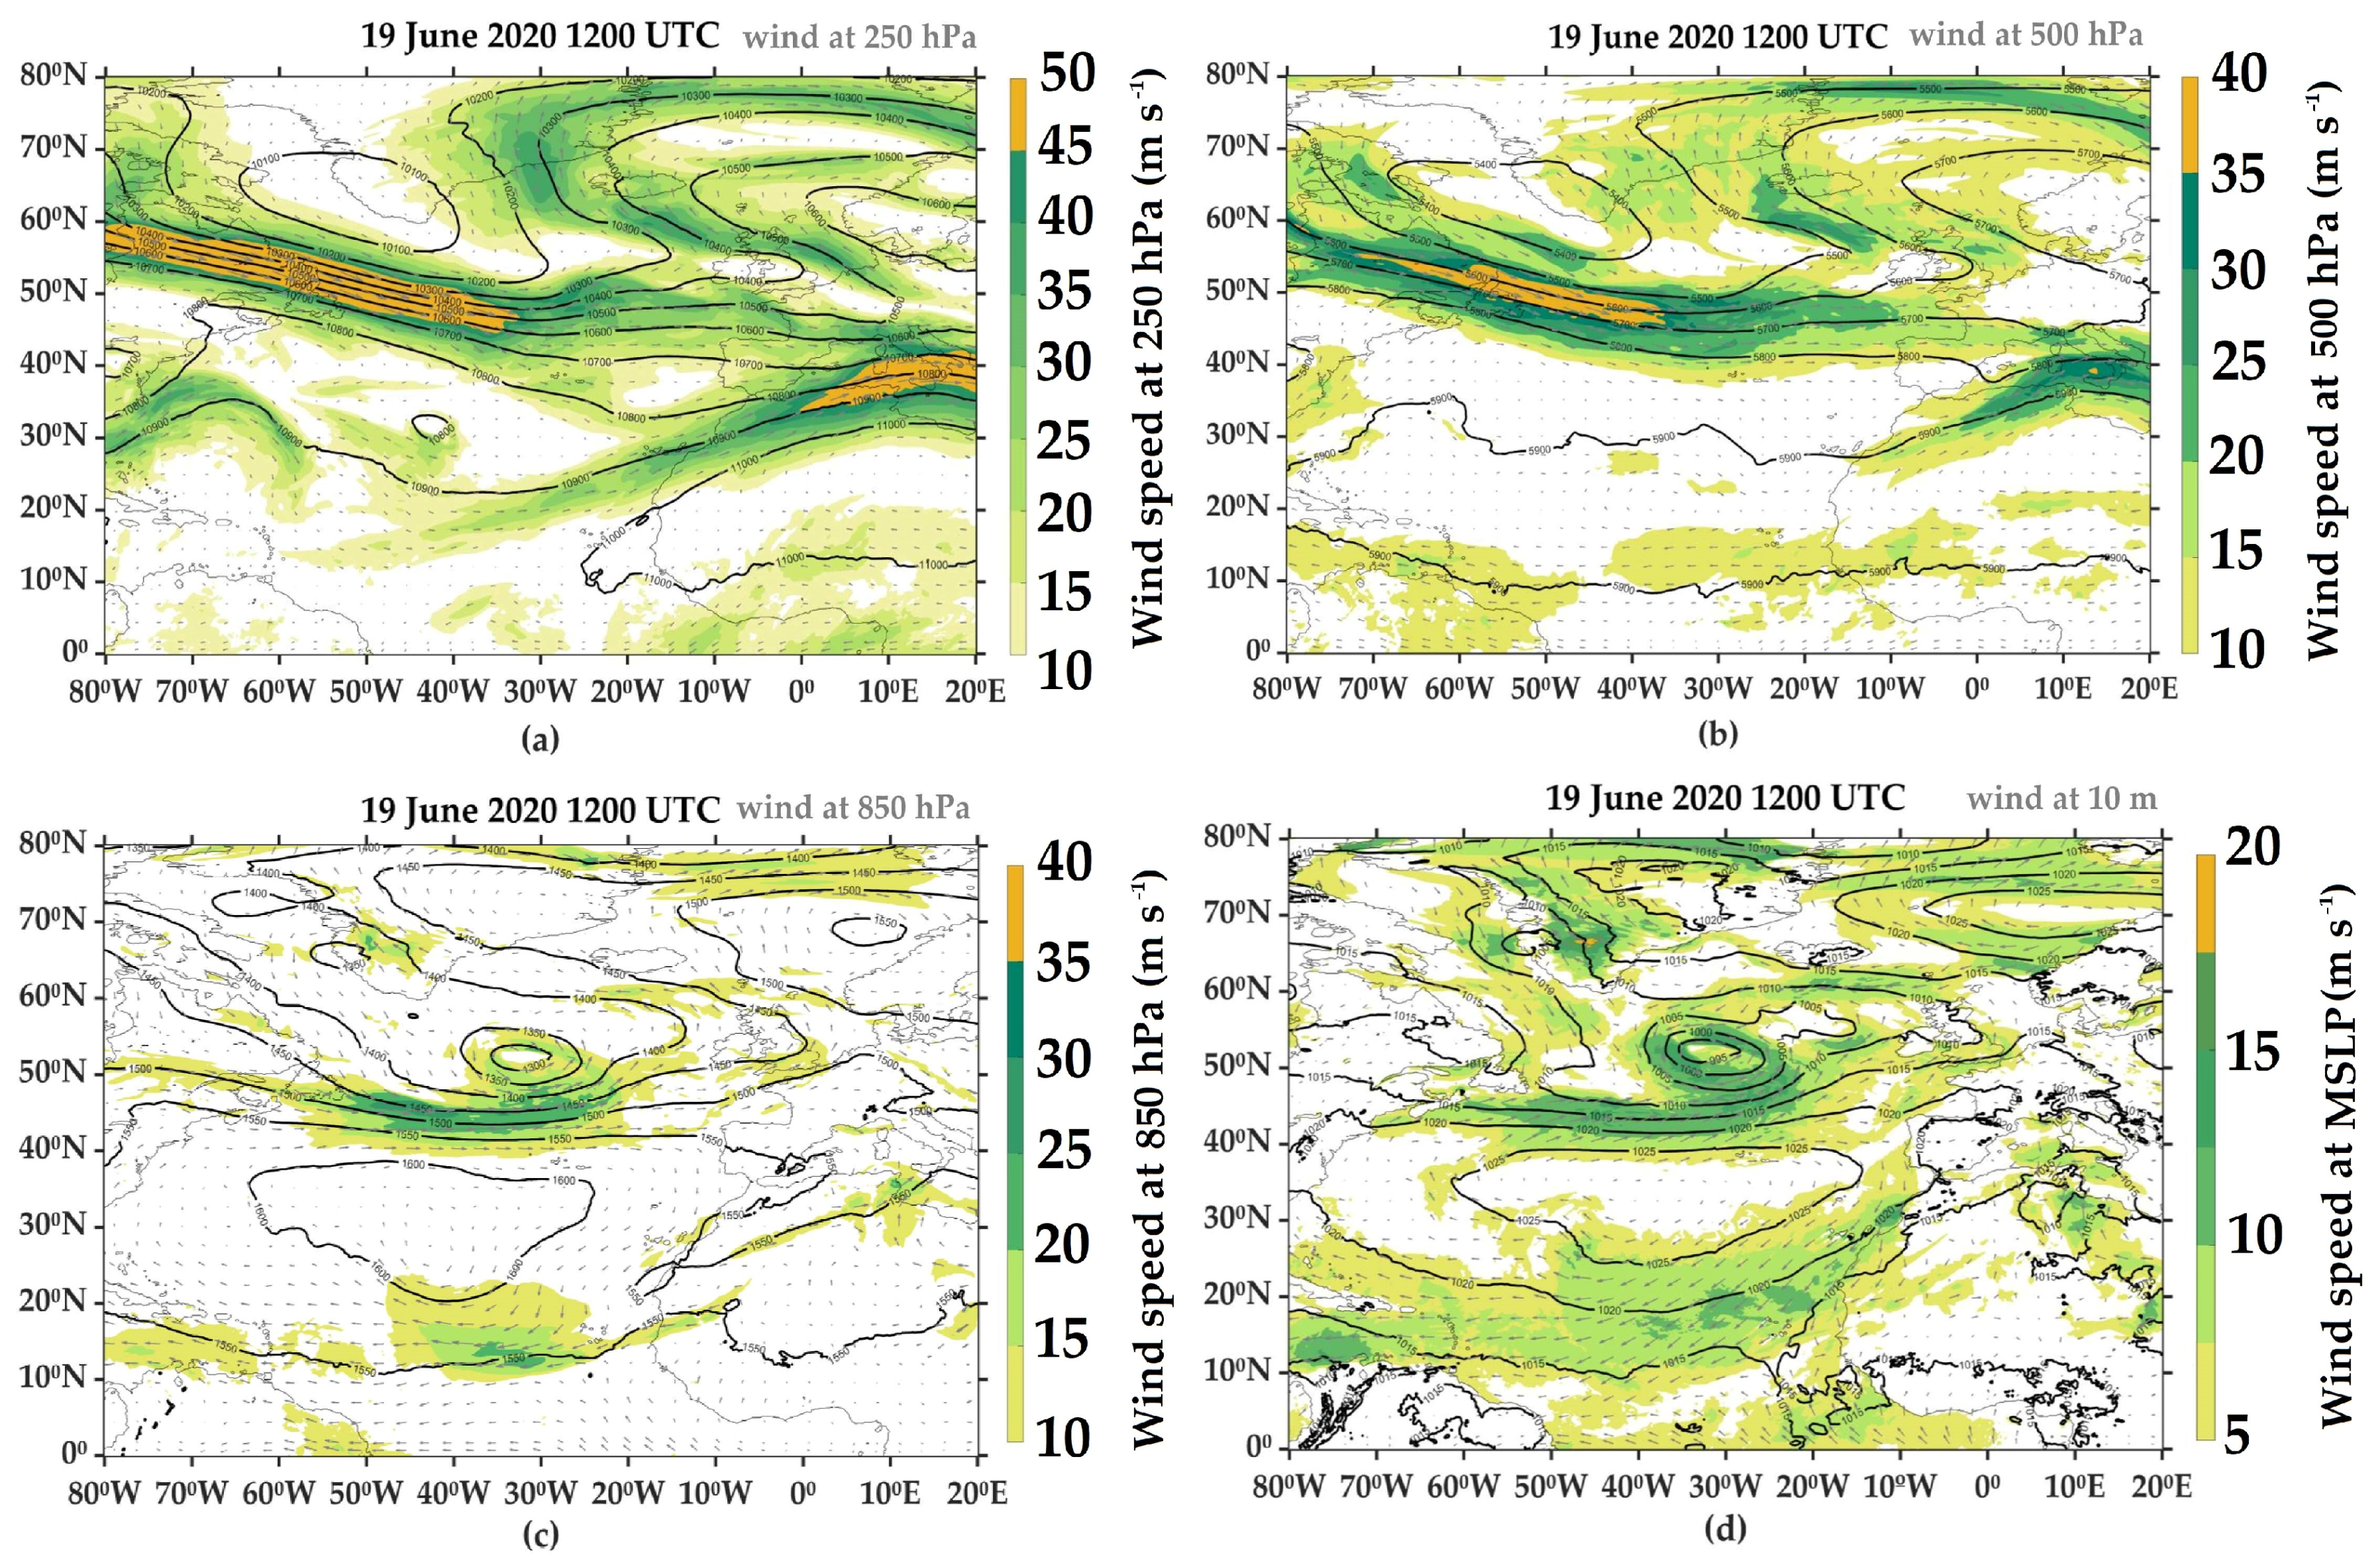
Figure 6 shows the prevailing large-scale conditions from the geopotential height and wind speed and direction at different isobaric levels at 1200 UTC on 19 June 2020, according to the ECMWF operational analyses. At isobaric levels of 250 hPa and 500 hPa, the jet stream was between 60° N and 50° N, with winds above 40 m s−1 prevailing from west over North America and the Atlantic Ocean (Figure 6a,b).
At the 850 hPa isobaric level, a depression is identified centred in the northern Atlantic Ocean (55° N, 32° W) with geopotential height values ranging from 1450 and 1300 gpm (Figure 6c). However, we bring attention to the Azores anticyclone centred in southwest Azores (30° N, 45° W). The system shows a clockwise circulation that extends to the East but with weak winds on the western coast of the Iberian Peninsula below 10 m s−1 (Figure 6c).
Figure 6d shows the mean sea level pressure and the wind at 10 m (speed and direction). The depression in the northern Atlantic Ocean presents a core of 995 hPa and the Azores anticyclone has a core with 1025 hPa centred on the southwest of the Azores (Figure 6d). It is also noteworthy that the northwest winds on the coastline of the southwestern Iberian Peninsula exhibited values of below 7.5 m s−1 influenced by the clockwise circulation.

3.2.2. Mesoscale Environment

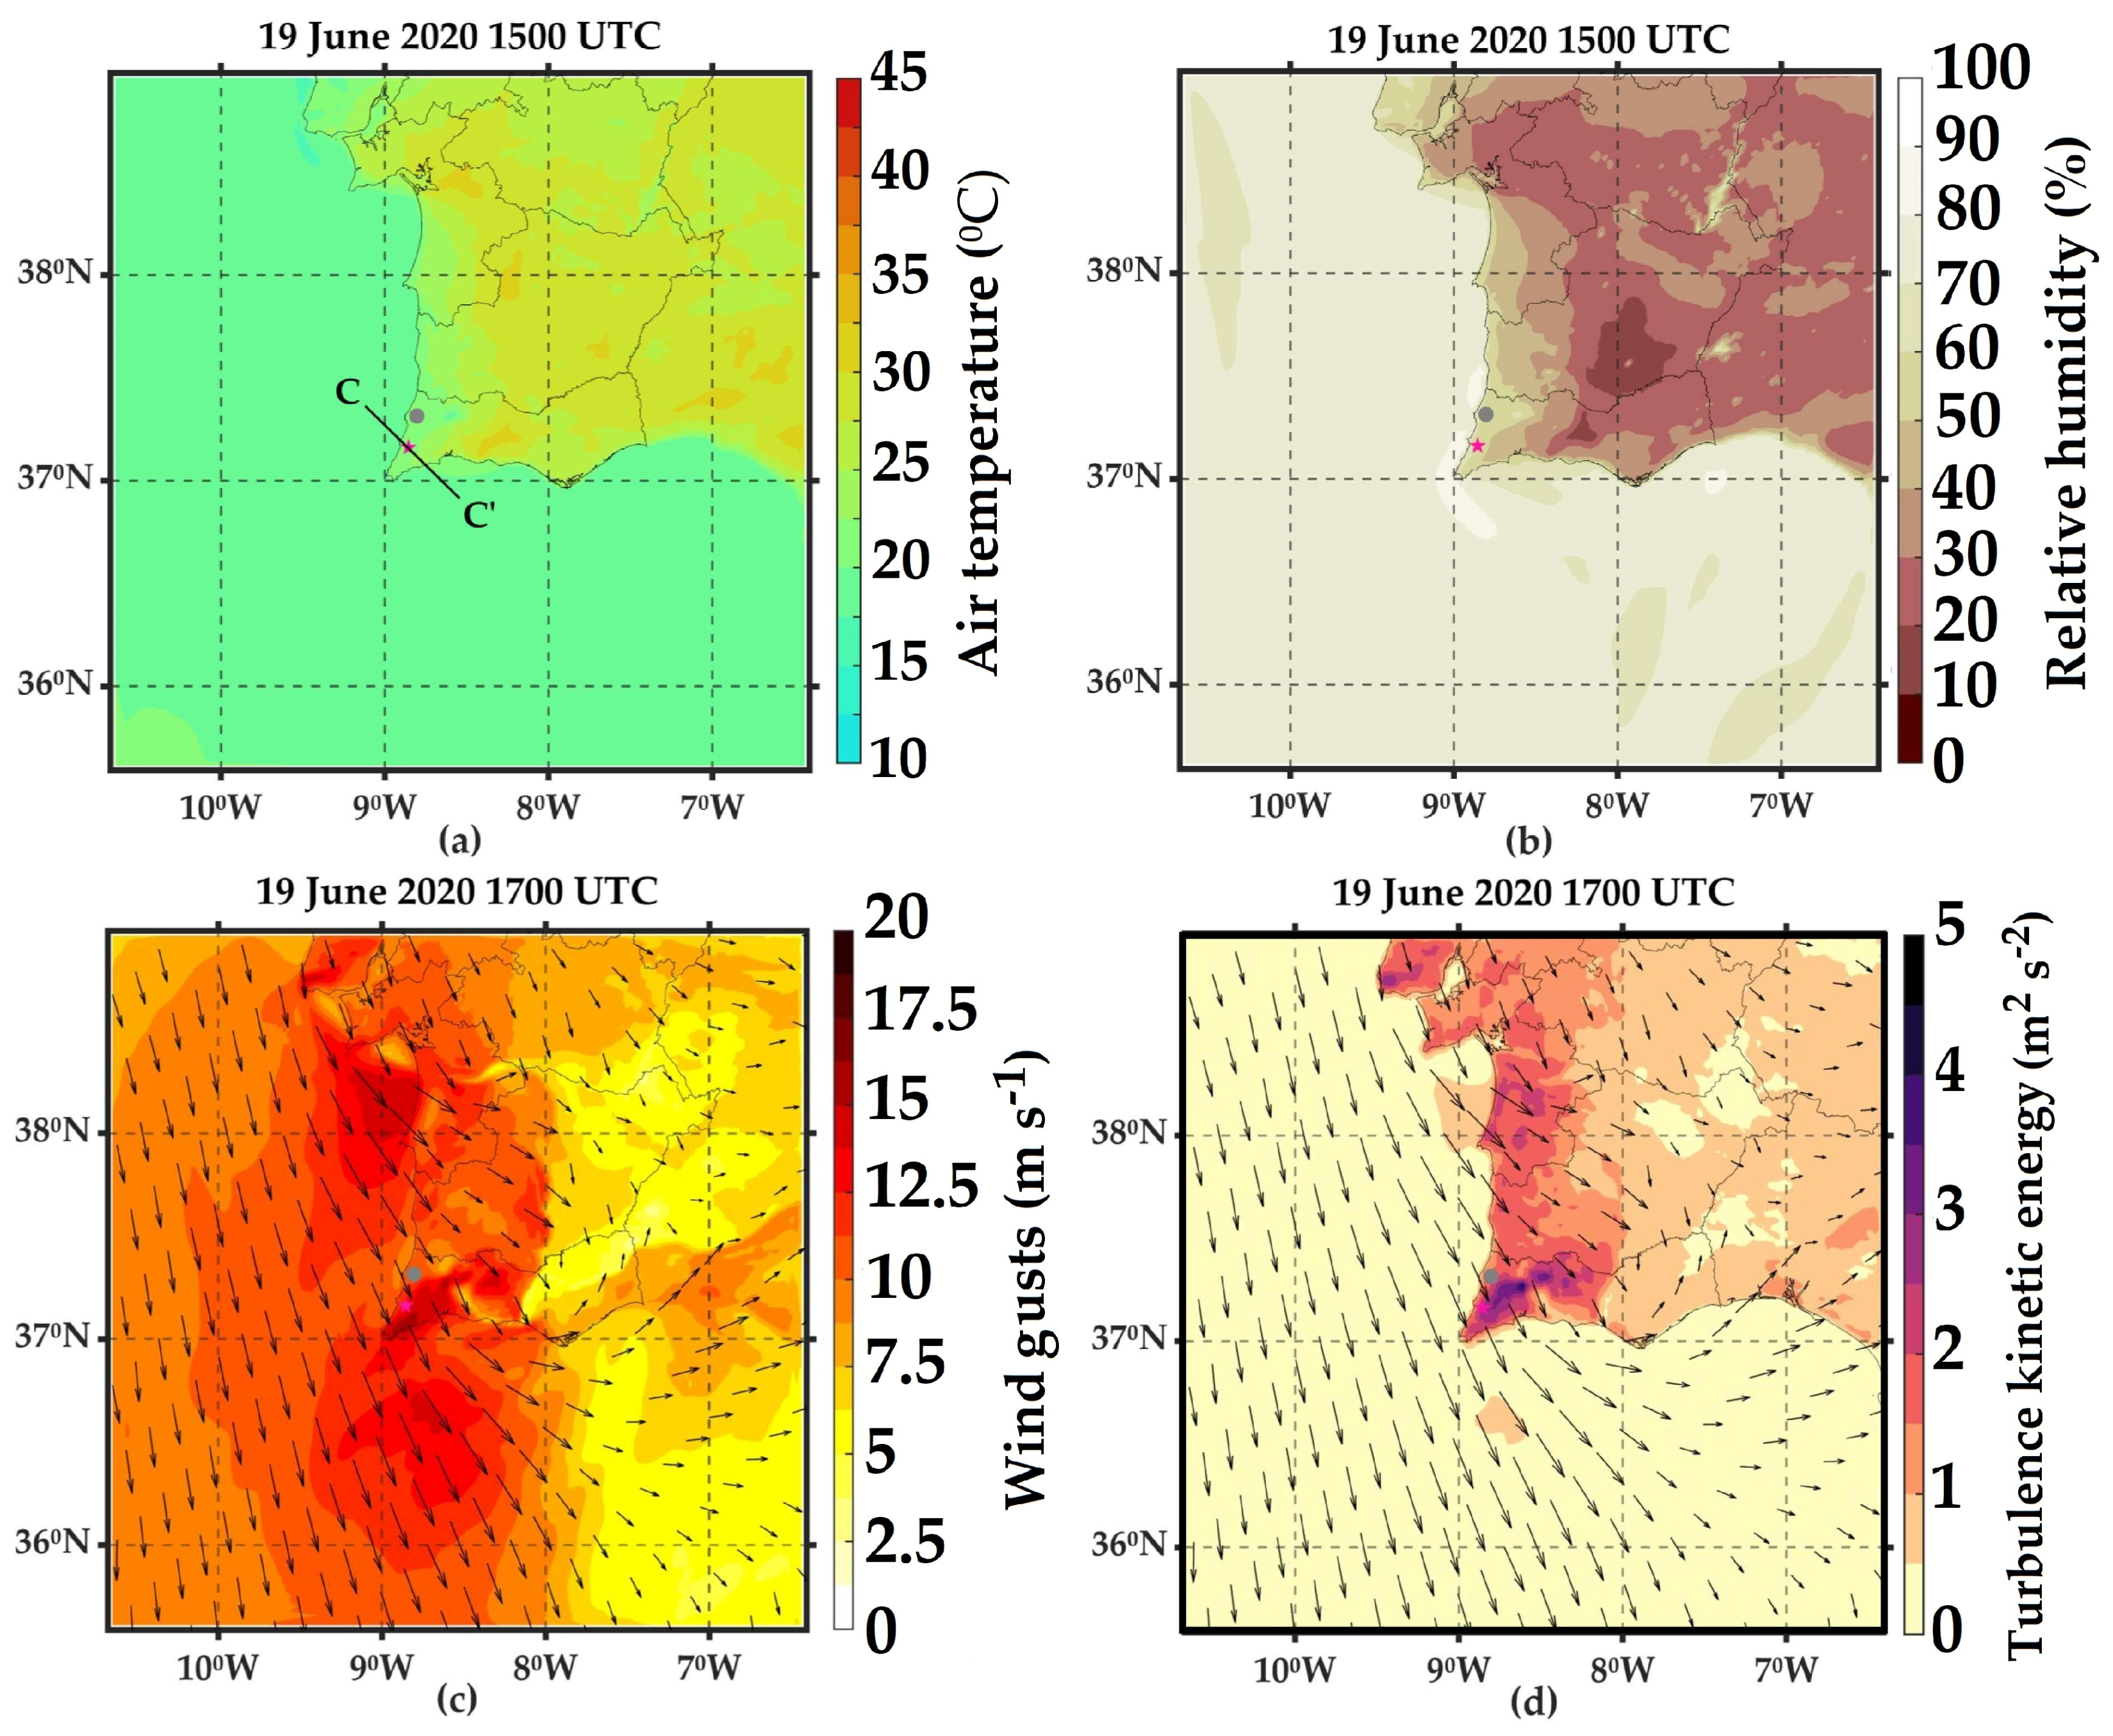
For the ALJ-fire case, the air temperature (°C) and relative humidity (%) simulated at 2 m are shown in Figure 7 for the d01, in combination with the wind gusts (m s−1) and TKE (m2 s−2) simulated at 10 m and at the surface, respectively. The spatial distribution of the air temperature shows that some areas of the Algarve region exceeded 30 °C at 1500 UTC on 19 June 2020 (Figure 7a). Although in Central Algarve temperatures of around 30 °C were simulated and observed, the air temperature in Western Algarve, especially in Aljezur, was about 17.5 °C in the middle of the afternoon (1500 UTC) when the forest fire had already started. As can be seen in Figure 7b, the Algarve can be divided into two regions: in the first one where, the relative humidity was below 30% in the Eastern Algarve or even below 20% in Central, and in the second one where, the relative humidity was above 50% along the western coastline of the region, as it was in Aljezur at 1500 UTC on 19 June 2020. Therefore, the air temperature and relative humidity do not show conditions that could provide an environment favourable to wildfire ignition and propagation in Aljezur.
Figure 7c shows wind gusts around and above 15 m s−1 in the West and Central Algarve, with the main gust front prevailing from the northwest at 1700 UTC on 19 June 2020. The significant values of TKE of 3 m2 s−2 occurred over the Monchique and Espinhaço de Cão Mountains Ranges in the late afternoon (Figure 7d). Despite these strong wind gusts and high turbulence in Western Algarve, the maximum wind gusts prevailing from the southwest reached 10 m s−1, and TKE was not above 1.5 m2 s−2 in the eastern coastal Algarve area.
The impacts of the Espinhaço de Cão Mountain Range on atmospheric circulation, in terms of wind speed and vertical velocity fields, are presented in Figure 8. Both panels in Figure 8 depict a vertical cross-section with a NW-SE orientation, marked as C-C′ (in Figure 7a). Figure 8a shows a layer with intense winds speeds of above 10 m s−1 in the lowest troposphere between near the surface and 500 m altitude. Moreover, it is noteworthy that the wind intensifies near the surface on the leeward side of the mountain (downslope winds), with velocities of 10 m s−1 being simulated at the surface. Figure 8b shows that this intensification of the wind at the surface is caused by the interaction of the mountain range with the airflow being possible to verify the downward motions on the lee side. Therefore, under a relatively weak synoptic influence, the northwest wind produced by the Atlantic Sea breeze originating from the western coast of Algarve is forced to go over the top of the Espinhaço de Cão Mountain Range, whereas the local orography favour the downward motions on the southeastern slope of the mountain with velocities around 1 m s−1 and intensifies the wind velocity at the surface. This environment was crucial to the fire spread in the ALJ-fire.

4. Discussion

The present study investigates the meteorological conditions that influence the fire dynamics favouring the evolution of two distinct forest fires over the mountain ranges of Algarve region based on atmospheric modelling using the Meso-NH model.
Concerning the synoptic-scale context, the two case studies showed the role that the Azores Anticyclone can play in determining the atmospheric circulation over Southern Portugal, depending on its position in the North Atlantic Ocean. For the first case (TAV-fire, 18–21 July 2012; 24,800 ha of total burned area), the study highlights that when the Azores anticyclone is closer to the coast of Mainland Portugal, it favoured an increase of the horizontal gradient of pressure and temperature at the surface between the adjacent ocean and the Iberian Peninsula, inducing the northerly flow in the coastline of Mainland Portugal. As the soil heat remains confined to the centre of the Iberian Peninsula, it radiates back into the boundary layer’s upper part, warming the air and creating a relatively weak low-pressure area [48]. Therefore, the air that converges over the Iberian Peninsula is deflected to the right due to the effect of the Coriolis acceleration, giving rise to a stationary cyclonic circulation in the boundary layer, called the Iberian thermal low [49]. The position of the Iberian thermal low and the Azores Anticyclone creates strong seasonal northwest winds in Mainland Portugal in the summer, especially in July, which is well known as Coastal low-level jet [18,50,51,52,53].
In the forest fire context, the largest forest fire of 2019 occurred in Central Portugal under such a synoptic configuration. The strong airflow at a 600 m altitude, together with the local effects, contributed to the extremely high spread rate of the fire front [18]. Occasionally, these intense low-level airflows reach the extreme South Portugal (Algarve region), where the local mountains play an important role in the development of orographic effects that are crucial for fire spread, especially to south-eastward [23].
In a regional-scale context, the TAV-fire also showed the intense low-level airflow reaching the Algarve region and influencing the fire dynamic, especially in Catraia, Tavira. In this study, Tavira’s forest fire occurred with conditions extremely conducive to the spread of fire, especially on 19 July 2012, characterised by a very high to extreme level of fire danger, consistent with the official report [34]. The increase in wind intensity around the Caldeirão Mountain Range achieved a maximum wind speed of 10 m s−1 below 1 km altitude, which was also influenced by orography, as verified by the maximum wind speed above and after the airflow had crossed the mountain ridge.
On the other hand, in the second case (ALJ-fire, 19–21 June 2020, 2302 ha of burned area), the Azores Anticyclone was positioned farther away from the west coast of Mainland Portugal, which caused a reduction in its influence in wind intensity over the Iberian Peninsula, being a normal condition in the springtime [54]. In other words, the weak influence of the anticyclone favoured the establishment of a more local circulation regime, which was different to the TAV-fire case. This situation mainly affected mainly the WesternAlgarve where the forest fire occurred, namely the Vilarinha region, Aljezur. Although the anticyclone was relatively weak in its oriental sector/boundary, the regional environment favoured a north-westerly wind that affected Vilarinha with a colder and moist air advection close to the surface in coastal areas, and characterising as an Atlantic Sea breeze. When interacting with the local orography, this northwest flow is forcing to go over the top of the Espinhaço de Cão Mountain Range, and the orographic effects are observed producing downward movements on the southeastern slope of the mountain, as documented by Purificação [23] concerning the orographic effects occurring around the Monchique Mountain Range. Although the Espinhaço de Cão Mountain Range has a lower altitude, there is still an orographic effect characterised by a downslope wind on the leeward side of the mountain. In summary, the intensification of the fire spread to south-eastward was verified by such an orographic effect in the Espinhaço de Cão Mountain Range, significantly increasing the burned area in the middle of the afternoon on 19 June 2020.
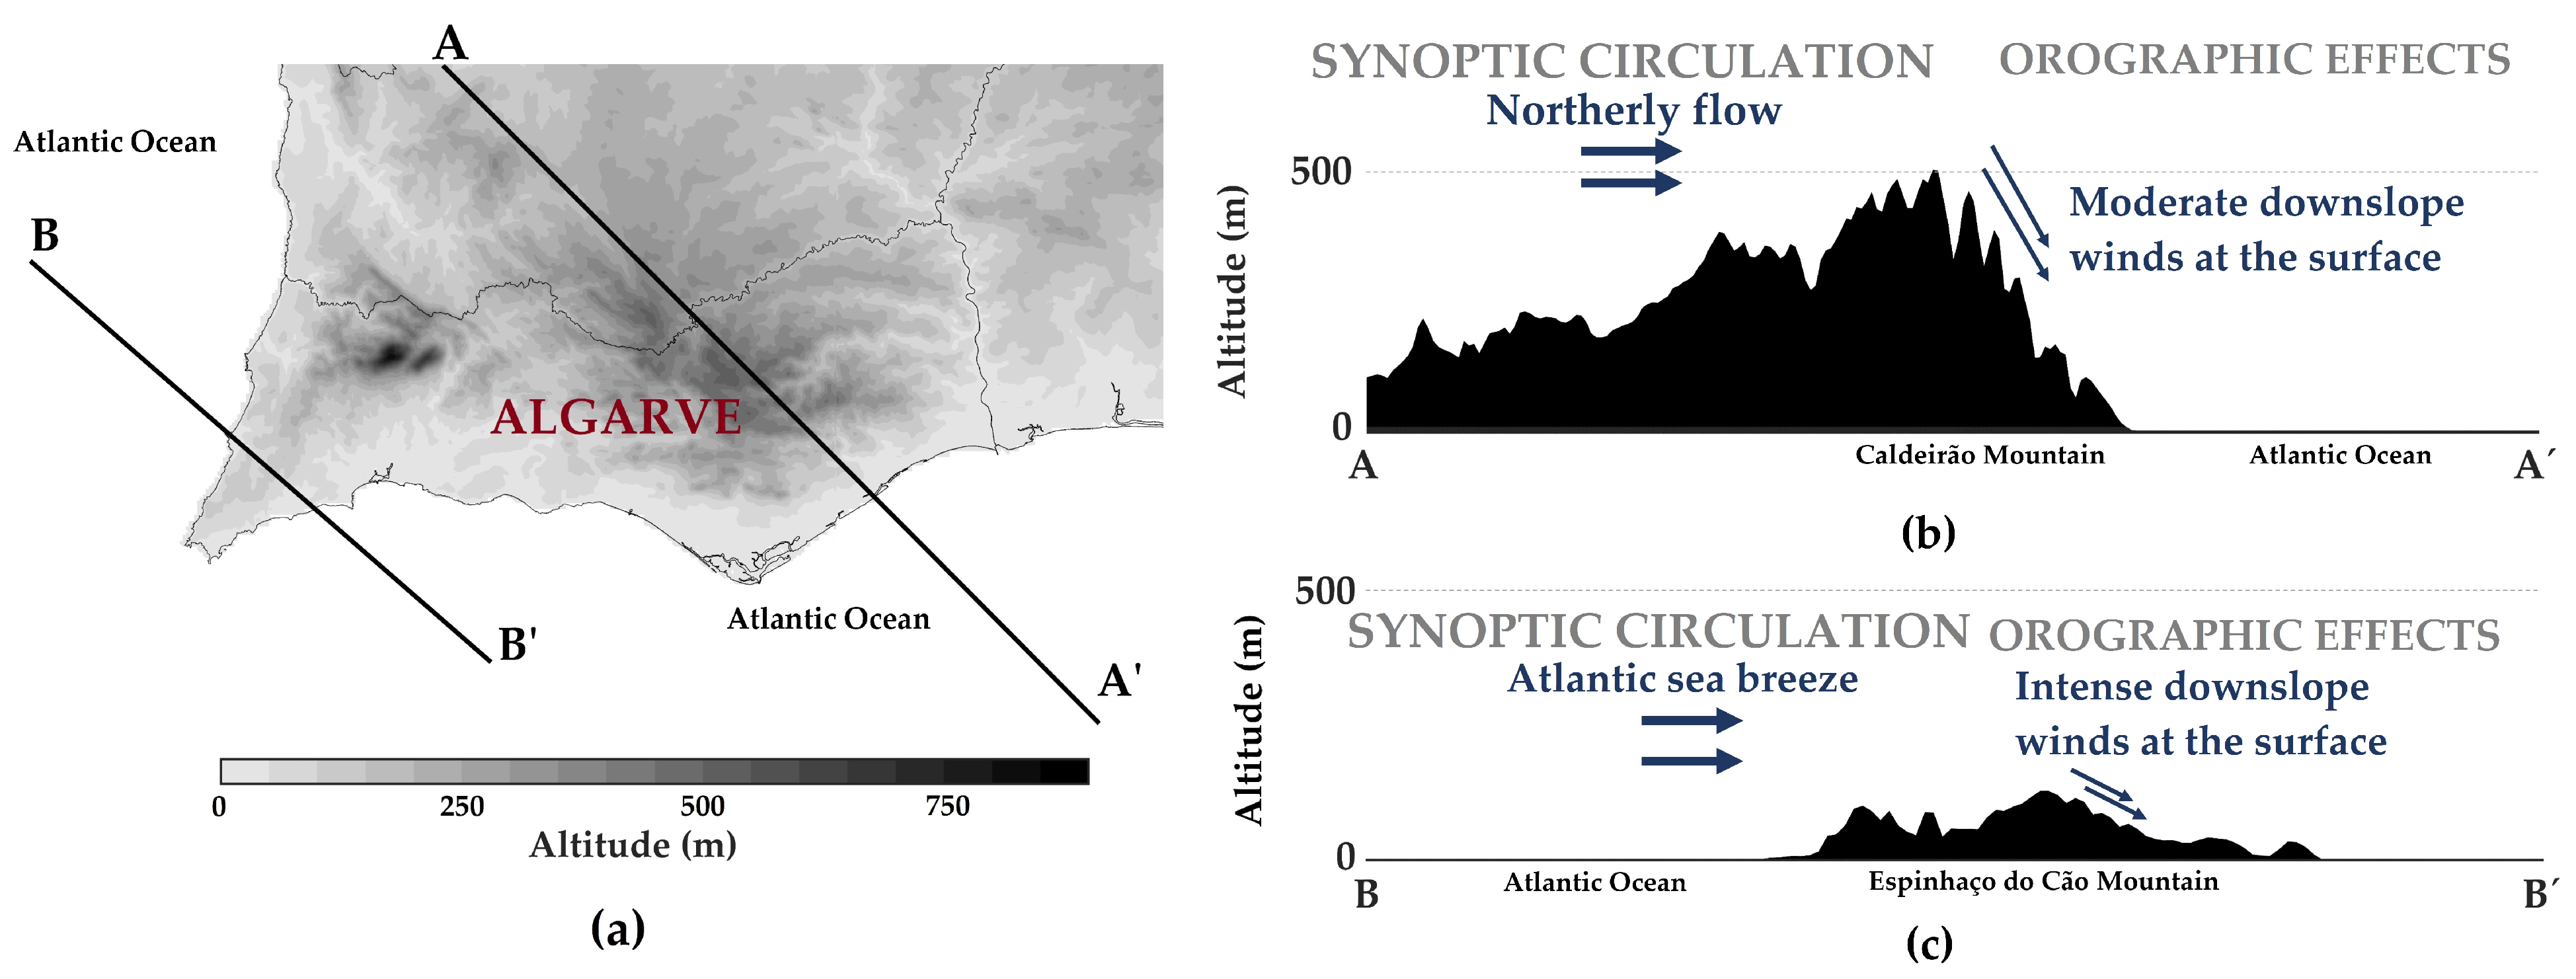
In terms of the air temperature and relative humidity, the ALJ-fire gave us an indication of how fires can occur under conditions in which the air is colder and more humid than those usually seen in the summertime. This represents a typical environment of the coastal zones in contrast with the rest of the Algarve region. However, a similar situation was documented by Couto et al. [21]. The authors verified mild weather conditions favouring the occurrence of fires in the northwestern Iberian Peninsula in the winter of 2021/2022, which was produced mainly by stationary downslope winds. As in the case of winter 2021/2022, it is noteworthy that the simulation of ALJ fire was highlighted not only by the interaction of the airflow with the local mountains that produced an increase in gusty winds and turbulence near the surface, but it was also impacted by the surface conditions that may have potentiated the occurrence of fires. According to the IPMA, the Algarve region faced a period of low precipitation and high evaporation of water from the soil during the winter of 2019/2020 and the spring of 2020 [55]. The absence of precipitation in the Algarve caused a period of prolonged drought and probably had a direct impact on the dryness of fuels in the previous months. The land cover directly influences a greater accumulation of forest fuel and enhances the risk of forest fire, while the intense winds create ideal conditions for fire front propagation. Figure 9 depicts a schematic diagram providing a summary of the results. In Figure 9a, two vertical cross-sections in the Algarve region with a NW–SE orientation are indicated as A-A′ and B-B′. The A-A′ vertical cross-section in the eastern Algarve shows the northerly winds identified by the intense low-level airflow (arrows) located around the 500 m altitude (Figure 9b). This northerly flow is forced to go over the top of the Caldeirão Mountain Range. The orographic effect created by this interaction is seen on the southeastern slope of the mountain in the form of moderate downslope winds close to the surface. In Figure 9c, the second B-B′ vertical cross-section in the Western Algarve shows the circulation of the Atlantic Sea breeze on the northwest side of the Espinhaço de Cão Mountain Range, with a maximum intensity around 250 m altitude (arrows). When interacting with the local orography, this sea breeze crosses the mountain’s top, creating intense downslope winds at the surface on the leeward side of the mountain. Both situations influenced the fire behaviour.
Algarve is a fire-prone region and increasing knowledge about forest fires is essential for better practices of fire management. However, the present study shows the importance of studying the occurrence of forest fires in the other mountains of the Algarve even with reduced burned areas, such as the Aljezur fire event. The atmospheric conditions interacting with a mountainous area can create orographic effects that will increase the fire danger in terms of propitious fire propagation, beyond typical vegetation conditions for fire ignition, even in spring. Our case study results could be useful for other studies about the surface–atmosphere interaction in other regions worldwide that present similar features, for example in the United States and Greece [5,8].

5. Conclusions

The present study analyses the meteorological conditions favouring two distinct fires in the Algarve region with the aim to understand the atmospheric circulation that influenced their dynamics based on atmospheric modelling from the Meso-NH model.
In the TAV-fire case, the Azores anticyclone was closer to the western coast of mainland Portugal, leading to an intensification of the winds from the northwest in Mainland Portugal due to the interaction of the Azores Anticyclone and the Iberian thermal low, which is known as the Coastal low-level jet. In a regional scale context, this phenomenon was identified reaching the Caldeirão Mountain Range, influencing the dynamics of the fire that occurred in Tavira, Eastern Algarve. Due to the orography, the wind intensity increased on the leeward side of the mountain, contributing to the rapid spread of fire and increasing the burned area at the end of the afternoon on 19 July 2012.
On the other hand, in the ALJ fire case, when the Azores Anticyclone was farther away from the western coast of mainland Portugal, a more local circulation regime affected the Western Algarve, especially in the Espinhaço de Cão Mountain Range where the Aljezur fire occurred. The Atlantic Sea breeze prevailing from the west coast of the Algarve, also associated with cold and moist air advection close to the surface, interacted with the orography, creating downslope winds on the leeward side of mountain and thus contributing to the increase in the burnt area in the middle of the afternoon on 19 June 2020.
Moreover, our findings indicate that the ALJ fire occurred in an environment favourable to fire propagation and typical spring conditions, namely lower air temperatures and higher relative humidity, which are not usually identified as conducive to the occurrence of large forest fires. This means that there were also ideal vegetation conditions for fire ignition, which was influenced by the absence of precipitation in the previous seasons (winter and spring), characterizing a prolonged period of drought and probably contributing to a decrease in the fuel moisture content. Thereby, this study confirms that climate variability can influence the occurrence of fires beyond the summer season in mainland Portugal.
The present study shows the benefits of high-resolution atmospheric modelling in assessing such complex situations and supporting planning strategies in the region. In addition, these case studies show the complexity behind forest fires occurrence, reinforcing the need of several factors acting together to generate favourable conditions for fire. Therefore, as further work, the authors suggest the use of atmospheric simulations to assess the fire danger, taking into account not only the atmosphere–orography interactions in the extreme Southern Portugal but also the land cover aspects, namely fuel availability before the fire events. Increasing knowledge and the use of high-resolution simulations to forecast the weather conditions in southern Portugal can support the fire management practices and firefighting strategies and encourage the sustainable development of the region.

Author Contributions

Conceptualisation, C.P., A.H., S.K. and F.T.C.; methodology, C.P., A.H., S.K. and F.T.C.; software, C.P. and F.T.C.; validation, C.P.; formal analysis, C.P. and F.T.C.; investigation, C.P. and F.T.C.; resources, F.T.C.; data curation, C.P.; writing—original draft preparation, C.P.; writing—review and editing, A.H., S.K. and F.T.C.; visualisation, C.P.; supervision, A.H. and F.T.C.; project administration, F.T.C.; funding acquisition, F.T.C. All authors have read and agreed to the published version of the manuscript.

Funding

This research was funded by national funds through the FCT—Foundation for Science and Technology, I.P. under the PyroC.pt project (Ref. PCIF/MPG/0175/2019) and ICT project (Refs. DOI 10.54499/UIDB/04683/2020 and DOI 10.54499/UIDP/04683/2020).

Institutional Review Board Statement

Not applicable.

Informed Consent Statement

Not applicable.

Data Availability Statement

The model output files supporting the conclusions of this article will be made available by the authors on request. ECMWF—MARS catalogue: https://www.ecmwf.int/en/forecasts/dataset/operational-archive, accessed on 11 August 2024.

Acknowledgments

The authors are grateful to the Portuguese Institute for Sea and Atmosphere (IPMA) for providing meteorological data and to the European Centre for Medium-Range Weather Forecasts (ECMWF; https://www.ecmwf.int/) for the provided meteorological analysis.

Conflicts of Interest

The authors declare no conflicts of interest.

Appendix A. Model Verification

Figure A1. (a) The locations of the automatic weather stations in Algarve region; time series point-to-point comparison of (bd) the average air temperature (°C), (eg) the average relative humidity (%), and (hj) the average wind speed (m s−1) from the weather stations located near to the TAV -fire using the model at 2.5 km (d01) and at 0.5 km (d02).
Sustainability 16 06985 g0a1
Figure A2. Time series point-to-point comparison of (ac) the average air temperature (°C), (df) the average relative humidity (%), and (gi) the average wind speed (m s−1) from the weather stations located near to the ALJ-fire using the model at 2.5 km (d01) and 0.5 km (d02).
Sustainability 16 06985 g0a2

References

  1. Fromm, M.; Lindsey, D.T.; Servranckx, R.; Yue, G.; Trickl, T.; Sica, R.; Doucet, P.; Godin-Beekmann, S. The Untold Story of Pyrocumulonimbus. Bull. Am. Meteorol. Soc. 2010, 91, 1193–1210. [Google Scholar] [CrossRef]
  2. Peace, M.; Ye, H.; Greenslade, J.; Kepert, J.D. The Destructive Sir Ivan Fire in New South Wales, Australia; Simulations Using a Coupled Fire—Atmosphere Model. Fire 2023, 6, 438. [Google Scholar] [CrossRef]
  3. Couto, F.T.; Filippi, J.-B.; Baggio, R.; Campos, C.; Salgado, R. Triggering Pyro-Convection in a High-Resolution Coupled Fire–Atmosphere Simulation. Fire J. 2024, 7, 92. [Google Scholar] [CrossRef]
  4. Raphael, M.N. The Santa Ana Winds of California. Earth Interact. 2003, 7, 1–13. [Google Scholar] [CrossRef]
  5. Brewer, M.J.; Clements, C.B. The 2018 Camp Fire: Meteorological Analysis Using in Situ Observations and Numerical Simulations. Atmosphere 2020, 11, 47. [Google Scholar] [CrossRef]
  6. Coen, J.L.; Schroeder, W. The High Park Fire: Coupled Weather-Wildland Fire Model Simulation of a Windstorm-Driven Wildfire in Colorado’s Front Range. J. Geophys. Res. Atmos. 2015, 120, 131–146. [Google Scholar] [CrossRef]
  7. Coen, J.L.; Schroeder, W.; Quayle, B. The Generation and Forecast of Extreme Winds during the Origin and Progression of the 2017 Tubbs Fire. Atmosphere 2018, 9, 462. [Google Scholar] [CrossRef]
  8. Kartsios, S.; Karacostas, T.; Pytharoulis, I.; Dimitrakopoulos, A.P. Numerical Investigation of Atmosphere-Fire Interactions during High-Impact Wildland Fire Events in Greece. Atmos. Res. 2021, 247, 105253. [Google Scholar] [CrossRef]
  9. Čavlina Tomašević, I.; Cheung, K.K.W.; Vučetić, V.; Fox-Hughes, P. Comparison of Wildfire Meteorology and Climate at the Adriatic Coast and Southeast Australia. Atmosphere 2022, 13, 755. [Google Scholar] [CrossRef]
  10. Čavlina Tomašević, I.; Vučetić, V.; Cheung, K.K.W.; Fox-Hughes, P.; Beggs, P.J.; Telišman Prtenjak, M.; Malečić, B. Comparison of Meteorological Drivers of Two Large Coastal Slope-Land Wildfire Events in Croatia and South-East Australia. Atmosphere 2023, 14, 1076. [Google Scholar] [CrossRef]
  11. Koulelis, P.P.; Proutsos, N.; Solomou, A.D.; Avramidou, E.V.; Malliarou, E.; Athanasiou, M.; Xanthopoulos, G.; Petrakis, P.V. Effects of Climate Change on Greek Forests: A Review. Atmosphere 2023, 14, 1155. [Google Scholar] [CrossRef]
  12. Tomshin, O.; Solovyev, V. Synoptic Weather Patterns during Fire Spread Events in Siberia. Sci. Total Environ. 2024, 921, 171205. [Google Scholar] [CrossRef]
  13. Papavasileiou, G.; Giannaros, T.M. Synoptic-Scale Drivers of Fire Weather in Greece. Sci. Total Environ. 2024, 925, 171715. [Google Scholar] [CrossRef] [PubMed]
  14. Sharples, J.J. An Overview of Mountain Meteorological Effects Relevant to Fire Behaviour and Bushfire Risk. Int. J. Wildland Fire 2009, 18, 737. [Google Scholar] [CrossRef]
  15. Čavlina Tomašević, I.; Cheung, K.K.W.; Vučetić, V.; Fox-Hughes, P.; Horvath, K.; Telišman Prtenjak, M.; Beggs, P.J.; Malečić, B.; Milić, V. The 2017 Split Wildfire in Croatia: Evolution and the Role of Meteorological Conditions. Nat. Hazards Earth Syst. Sci. 2022, 22, 3143–3165. [Google Scholar] [CrossRef]
  16. Fox-Hughes, P. Synoptic and Mesoscale Aspects of Exceptional Fire Weather during the New Year Period 2019–20 in Southeastern New South Wales, Australia. Weather. Forecast. 2023, 38, 2237–2252. [Google Scholar] [CrossRef]
  17. Russell, E.N.; Loikith, P.C.; Ajibade, I.; Done, J.M.; Lower, C. The Meteorology and Impacts of the September 2020 Western United States Extreme Weather Event. Weather. Clim. Extrem. 2024, 43, 100647. [Google Scholar] [CrossRef]
  18. Purificação, C.; Andrade, N.; Potes, M.; Salgueiro, V.; Couto, F.T.; Salgado, R. Modelling the Atmospheric Environment Associated with a Wind-Driven Fire Event in Portugal. Atmosphere 2022, 13, 1124. [Google Scholar] [CrossRef]
  19. Couto, F.T.; Salgado, R.; Guiomar, N. Forest Fires in Madeira Island and the Fire Weather Created by Orographic Effects. Atmosphere 2021, 12, 827. [Google Scholar] [CrossRef]
  20. Belo-Pereira, M.; Santos, J.A. Air-Traffic Restrictions at the Madeira International Airport due to Adverse Winds: Links to Synoptic-Scale Patterns and Orographic Effects. Atmosphere 2020, 11, 1257. [Google Scholar] [CrossRef]
  21. Couto, F.T.; Santos, F.L.M.; Campos, C.; Andrade, N.; Purificação, C.; Salgado, R. Is Portugal Starting to Burn All Year Long? The Transboundary Fire in January 2022. Atmosphere 2022, 13, 1677. [Google Scholar] [CrossRef]
  22. Kolden, C.A.; Abatzoglou, J.T. Spatial Distribution of Wildfires Ignited under Katabatic versus Non-Katabatic Winds in Mediterranean Southern California USA. Fire 2018, 1, 19. [Google Scholar] [CrossRef]
  23. Purificação, C.; Campos, C.; Henkes, A.; Couto, F.T. Exploring the Atmospheric Conditions Increasing Fire Danger in the Iberian Peninsula. Q. J. R. Meteorol. Soc. 2024, 1–20. [Google Scholar] [CrossRef]
  24. Andrade, N.; Couto, F.T.; Serra, J. Assessing Fire Risk Perception in the Vale Do Guadiana Natural Park, Portugal. Fire 2023, 6, 243. [Google Scholar] [CrossRef]
  25. VisitAlgarve. Available online: https://visitalgarve.pt/3504/demografia-e-geografia (accessed on 25 May 2024).
  26. Gabinete Técnico Florestal Inter-Municipal de Aljezur, Lagos e Vila do Bispo. Plano Inter-Municipal de Defesa da Floresta Contra Incêndios de Aljezur, Lagos E Vila Do Bispo 2016–2020. Available online: https://www.cm-lagos.pt/images/site/cliente/CADERNO_I_TERRAS_INFANTE.pdf (accessed on 20 March 2024).
  27. Comissão Municipal de Defesa da Floresta Contra Incêndios de Monchique. Plano Municipal de Defesa da Floresta Contra Incêndios. 2022. Available online: http://fogos.icnf.pt/pmdfci/08_Faro/0809/2G/Caderno_I/Texto/PMDFCI_Monchique_Caderno_I.pdf (accessed on 20 March 2024).
  28. Serra do Caldeirão. Guia da Cidade. Available online: https://www.guiadacidade.pt/pt/poi-serra-do-caldeirao-17391 (accessed on 25 May 2024).
  29. Feio, M. A evolução—Do relevo do Baixo Alentejo e Algarve, Laboratório Nacional de Energia e Geologia, Lisboa, 1952. Available online: https://docbase.lneg.pt/docs/Comunicacoes/communicacoes32_algarve.pdf (accessed on 3 July 2024).
  30. Oliveira, P. Considerações Sobre O Clima Do Algarve; Governo de Portugal, Ministério da Agricultura, Do Mar, Do Ambiente e do Ordenamento do Território: Algarve, 2018. Available online: https://www.drapalgarve.gov.pt/ema/images/artigos/DRAPALG%20EMAs%20-%20clima%20no%20Algarve.pdf (accessed on 12 May 2024).
  31. Pedras, C.; Silva, E.; Martins, F.; Fernandez, H.; Lourenço, L.; Lança, R. Incêndio Catraia (Tavira) Livro Guia da Visita Técnica (6 de Novembro de 2015), RISCOS—Associação Portuguesa de Riscos, Prevenção e Segurança, 2015. Available online: https://www.riscos.pt/wp-content/uploads/2018/Outras_Pub/guias/Livro_Visita_Tecnica_Catraia.pdf (accessed on 22 September 2023).
  32. Florestas.pt. Floresta em Portugal Continental, Região a Região—Florestas.pt. Florestas.pt. Available online: https://florestas.pt/conhecer/floresta-em-portugal-continental-regiao-a-regiao/ (accessed on 15 May 2024).
  33. Vila-Viçosa, C.; Arsénio, P. Vegetação Do Sudoeste Português. In A Vegetação de Portugal; Impresa Nacional: Lisboa, Portugal, 2021. [Google Scholar]
  34. Viegas, D.X.; Figueiredo, A.R.; Almeida, M.A.; Reva, V.; Ribeiro, L.M.; Viegas, M.T.; Oliveira, R.; Raposo, J.R. Relatório Do Incêndio Florestal de Tavira/São Brás de Alportel; Ministério da Administração Interna, 2012. Available online: https://www.historico.portugal.gov.pt/media/730414/rel_incendio_florestal_tavira_jul2012.pdf (accessed on 22 September 2023).
  35. ICNF, I.P. Relatório de Estabilização de Emergência do Incêndio da Vilarinha de Junho de 2020; ICNF, I.P, Direção Regional da Conservação da Natureza e Florestas do Algarve, 2020. Available online: https://fogos.icnf.pt/download/REE/2020_001/REE_2020_001.pdf (accessed on 13 March 2023).
  36. Setchell, H. Operational Archive. ECMWF. Available online: https://www.ecmwf.int/en/forecasts/dataset/operational-archive (accessed on 25 May 2024).
  37. Kartsios, S.; Pytharoulis, I.; Karacostas, T.; Pavlidis, V.; Katragkou, E. Verification of a global weather forecasting system for decision-making in farming over Africa. Acta Geophys. 2024, 72, 467–488. [Google Scholar] [CrossRef]
  38. Lac, C.; Chaboureau, J.-P.; Masson, V.; Pinty, J.-P.; Tulet, P.; Escobar, J.; Leriche, M.; Barthe, C.; Aouizerats, B.; Augros, C.; et al. Overview of the Meso-NH Model Version 5.4 and Its Applications. Geosci. Model. Dev. 2018, 11, 1929–1969. [Google Scholar] [CrossRef]
  39. Pergaud, J.; Masson, V.; Malardel, S.; Couvreux, F. A Parameterization of Dry Thermals and Shallow Cumuli for Mesoscale Numerical Weather Prediction. Bound Lay. Meteorol. 2009, 132, 83–106. [Google Scholar] [CrossRef]
  40. Pinty, J.-P.; Jabouille, P. A Mixed-Phase Cloud Parameterization for Use in a Mesoscale Non-Hydrostatic Model: Simulations of a Squall Line and of Orographic Precipitation. In Proceedings of the Conference of Cloud Physics, Everett, WA, USA, 17–21 August 1998. [Google Scholar]
  41. Mlawer, E.J.; Taubman, S.J.; Brown, P.D.; Iacono, M.J.; Clough, S.A. Radiative Transfer for Inhomogeneous Atmospheres: RRTM, a Validated Correlated-k Model for the Longwave. J. Geophys. Res. Atmos. 1997, 102, 16663–16682. [Google Scholar] [CrossRef]
  42. Cuxart, J.; Bougeault, P.; Redelsperger, J.-L. A Turbulence Scheme Allowing for Mesoscale and Large-Eddy Simulations. Q. J. R. Meteorol. Soc. 2000, 126, 1–30. [Google Scholar] [CrossRef]
  43. Verrelle, A.; Ricard, D.; Lac, C. Sensitivity of High-Resolution Idealized Simulations of Thunderstorms to Horizontal Resolution and Turbulence Parametrization. Q. J. R. Meteorol. Soc. 2014, 141, 433–448. [Google Scholar] [CrossRef]
  44. Masson, V.; Le Moigne, P.; Martin, E.; Faroux, S.; Alias, A.; Alkama, R.; Belamari, S.; Barbu, A.; Boone, A.; Bouyssel, F.; et al. The SURFEXv7.2 Land and Ocean Surface Platform for Coupled or Offline Simulation of Earth Surface Variables and Fluxes. Geosci. Model. Dev. 2013, 6, 929–960. [Google Scholar] [CrossRef]
  45. LP DAAC. NASA Shuttle Radar Topography Mission (SRTM), Version 3.0 (SRTM Plus) Product Release; Learn about the Land Processes Distributed Active Archive Center. Available online: https://lpdaac.usgs.gov/news/nasa-shuttle-radar-topography-mission-srtm-version-30-srtm-plus-product-release/ (accessed on 30 April 2023).
  46. Faroux, S.; Kaptué Tchuenté, A.T.; Roujean, J.-L.; Masson, V.; Martin, E.; Le Moigne, P. ECOCLIMAP-II/Europe: A Twofold Database of Ecosystems and Surface Parameters at 1 km Resolution Based on Satellite Information for Use in Land Surface, Meteorological and Climate Models. Geosci. Model. Dev. 2013, 6, 563–582. [Google Scholar] [CrossRef]
  47. Poggio, L.; de Sousa, L.M.; Batjes, N.H.; Heuvelink, G.B.M.; Kempen, B.; Ribeiro, E.; Rossiter, D. SoilGrids 2.0: Producing Soil Information for the Globe with Quantified Spatial Uncertainty. Soil 2021, 7, 217–240. [Google Scholar] [CrossRef]
  48. Hoinka, K.-P.; de Castro, M. The Iberian Peninsula Thermal Low. Q. J. R. Meteorol. Soc. 2003, 129, 1491–1511. [Google Scholar] [CrossRef]
  49. Miranda, P.M.A. Introdução à Meteorologia, IDL, Faculdade de Ciências, Universidade de Lisboa; IPMA: Lisbon, Portugal, 2017. [Google Scholar]
  50. Soares, P.M.M.; Cardoso, R.M.; Semedo, Á.; Chinita, M.J.; Ranjha, R. Climatology of the Iberia Coastal Low-Level Wind Jet: Weather Research Forecasting Model High-Resolution Results. Tellus A 2014, 66, 22377. [Google Scholar] [CrossRef][Green Version]
  51. Cardoso, R.M.; Soares, P.M.M.; Lima, D.C.A.; Semedo, A. The Impact of Climate Change on the Iberian Low-Level Wind Jet: EURO-CORDEX Regional Climate Simulation. Tellus A 2016, 68, 29005. [Google Scholar] [CrossRef]
  52. Lima, D.C.A.; Soares, P.M.M.; Semedo, A.; Cardoso, R.M. A Global View of Coastal Low-Level Wind Jets Using an Ensemble of Reanalyses. J. Clim. 2018, 31, 1525–1546. [Google Scholar] [CrossRef]
  53. Lima, D.C.A.; Soares, P.M.M.; Nogueira, M.; Semedo, A. Global Coastal Low-Level Wind Jets Revisited through the New ERA5 Reanalysis. Int. J. Climatol. 2021, 42, 4491–4507. [Google Scholar] [CrossRef]
  54. Davis, R.E.; Hayden, B.P.; Gay, D.A.; Phillips, W.L.; Jones, G.V. The North Atlantic Subtropical Anticyclone. J. Clim. 1997, 10, 728–744. [Google Scholar] [CrossRef]
  55. IPMA—Monitorização da Seca Meteorológica. IPMA. Available online: https://www.ipma.pt/pt/oclima/observatorio.secas (accessed on 25 May 2024).
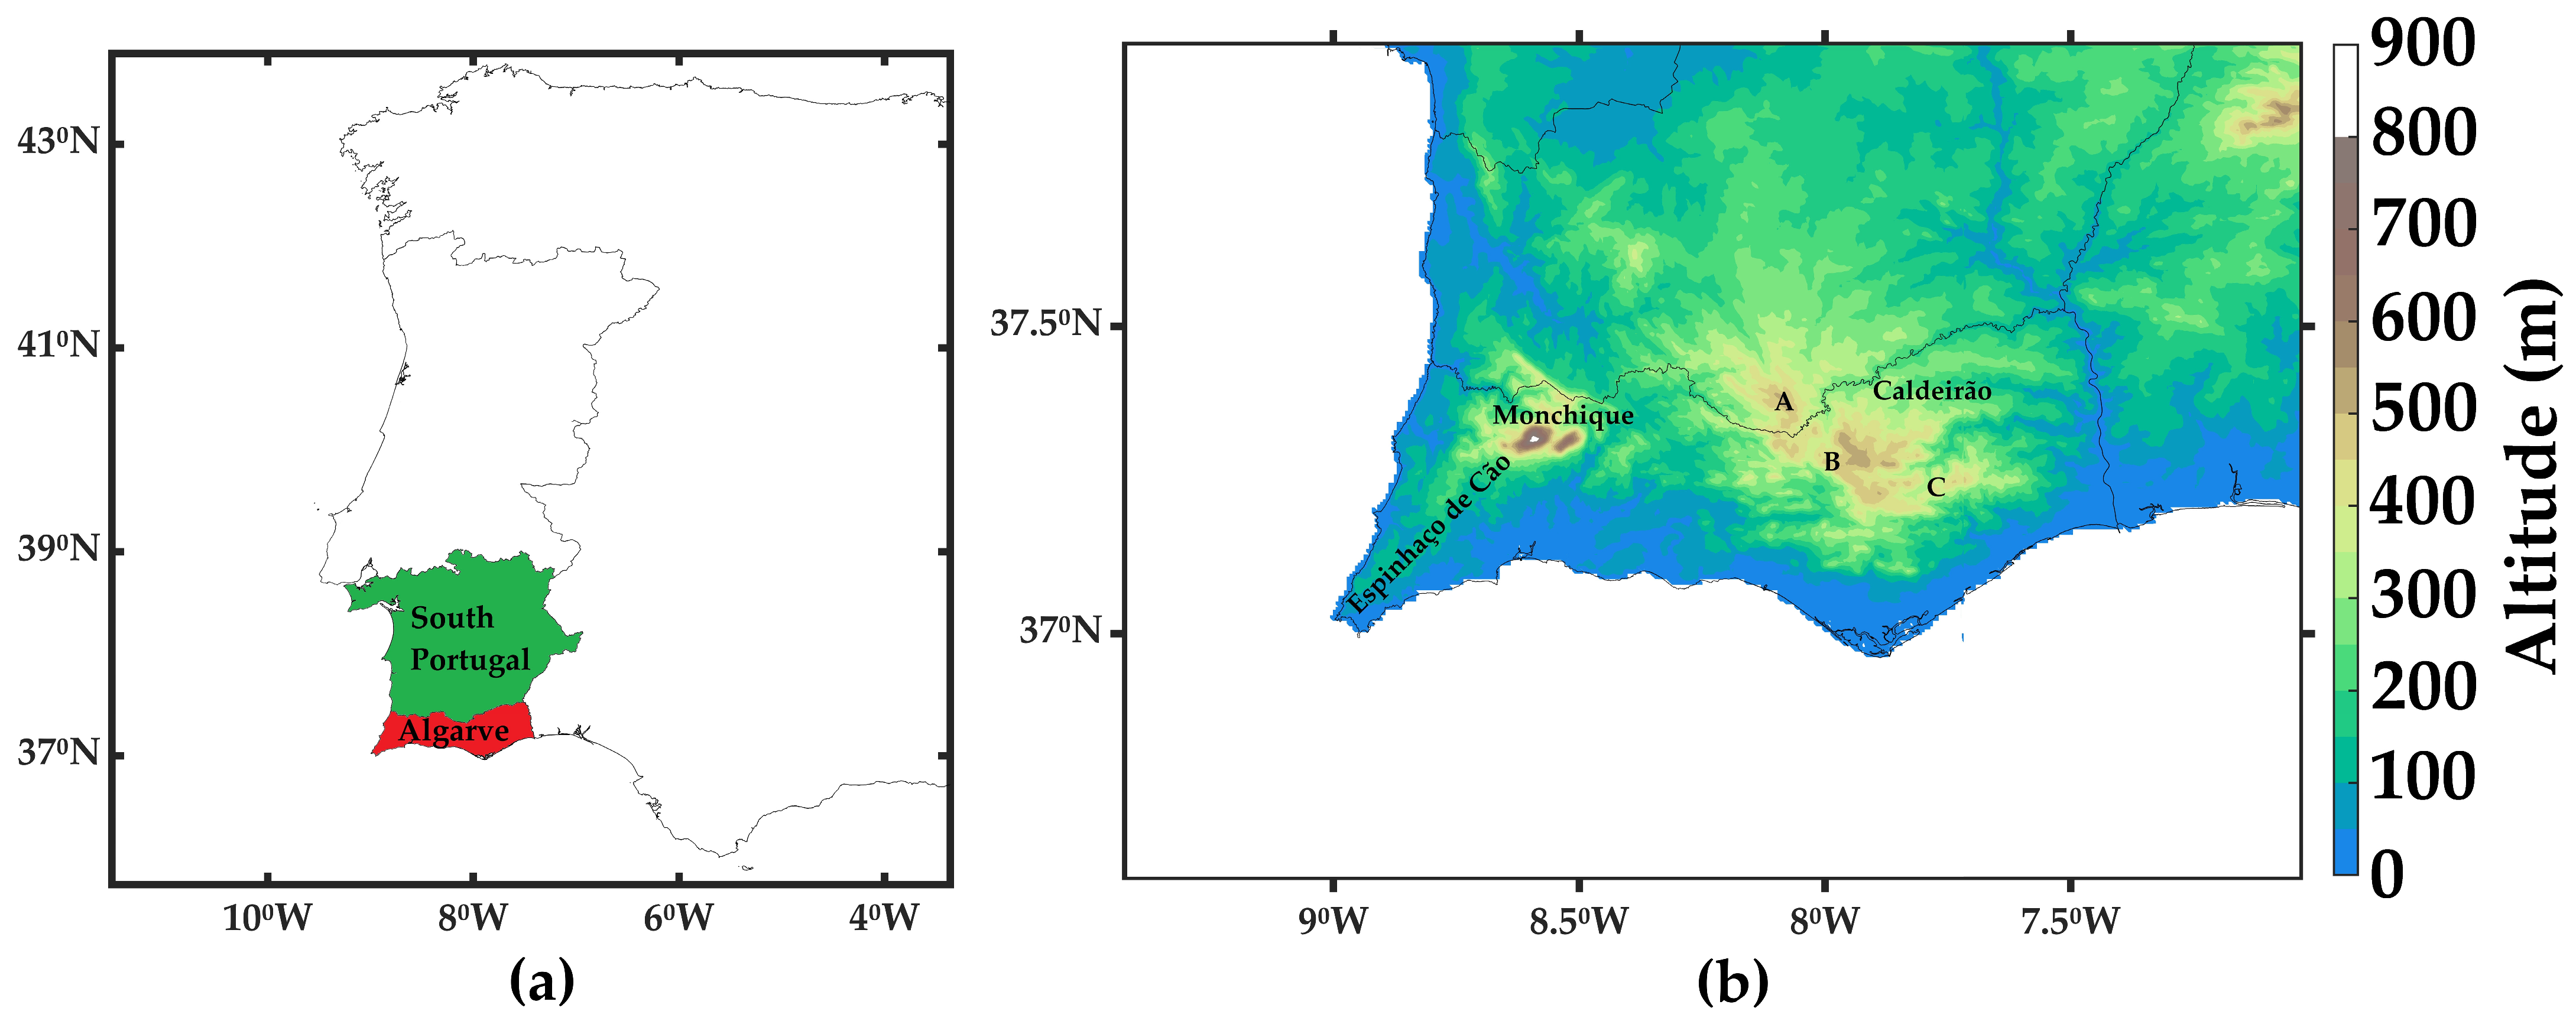
Figure 1. Study region: (a) South Portugal and the Algarve regions; (b) Algarve topography obtained from the Shuttle Radar Topography Mission (SRTM) and the main mountain ranges. The Caldeirão Mountain Range is divided into three axes with small elevations to the north (A), the second is located in the Algarve with the highest point of the mountains (B), and the third is located further south (C).
Sustainability 16 06985 g001
Figure 2. Configuration of the horizontal domains with orography in shades (m) obtained from the SRTM database with resolutions of 2.5 km (d01: orange square) and 500 m (d02: red square) for (a) the TAV -fire case and (b) the ALJ -fire case; For the TAV-fire, the location of the fire ignition (Catraia village) and Tavira are represented by pink and grey circles, respectively. The fire ignition in the ALJ -fire (Vilarinha village) is represented by a pink star and Aljezur city is represented by the grey circle.
Sustainability 16 06985 g002
Figure 3. Large-scale configuration, wind speed (m s−1), wind barbs, and geopotential height at (a) 250 hPa, (b) 500 hPa, and (c) 850 hPa; (d) mean sea level pressure (hPa) and wind speed (m s−1) at 10 m at 1200 UTC on 19 July 2012, according to the ECMWF operational analysis.
Sustainability 16 06985 g003
Figure 4. Meteorological variables simulated at 2500 m resolution: (a) air temperature (°C) at 2 m; (b) relative humidity (%) at 2 m; (c) wind gusts (m s−1) at 10 m; and (d) turbulent kinetic energy (m2 s−2) at the surface for TAV-fire. The location of the fire ignition and Tavira city are represented by the pink and grey circles, respectively.
Sustainability 16 06985 g004
Figure 5. (a) Vertical profile of the wind in Catraia, Tavira county, as simulated in d02 (0.5 km resolution) at 1700 UTC on 18 July 2012 (green line) and at 2000 UTC on 19 July 2012 (red line); (b) 925 hPa wind speed (m s−1) and direction (black arrows) simulated in d01 (2.5 km resolution) at 2000 UTC on 19 July 2012 in both the N-S and NW-SE cross-sections near the Caldeirão Mountain Range, marked as A-A′ and B-B′, respectively; (c) A-A′ vertical cross-section of the wind speed (m s−1) and (d) B-B′ vertical cross-section of the wind speed (m s−1) as simulated in d02 at 2000 UTC on 19 July 2012.
Sustainability 16 06985 g005
Figure 6. Large-scale configuration, wind speed (m s−1), wind barbs, and geopotential height at (a) 250 hPa, (b) 500 hPa, and (c) 850 hPa; (d) mean sea level pressure (hPa) and wind speed (m s−1) at 10 m at 1200 UTC on 19 June 2020, according to the ECMWF operational analysis.
Sustainability 16 06985 g006
Figure 7. Meteorological variables simulated at 2500 m resolution: (a) air temperature (°C) at 2 m, (b) relative humidity (%) at 2 m, (c) wind gusts (m s−1) at 10 m, and (d) turbulent kinetic energy (m2 s−2) at the surface for the ALJ-fire case. The location of the fire ignition is represented by a pink star and Aljezur city is represented by a grey circle.
Sustainability 16 06985 g007
Figure 8. C-C′ vertical cross-sections of (a) the wind speed (m s−1) and (b) vertical velocity (m s−1) simulated at 1600 UTC on 19 June 2020 (d02).
Sustainability 16 06985 g008
Figure 9. Schematic representation of the airflow conditions identified in the two case studies that influenced the fire behaviour. (a) Identification of the A-A′ and B-B′ vertical cross-sections in the Algarve region with a NW–SE orientation; (b) the A-A′ vertical cross-section showing the orographic effect created in response to the mean airflow in the lower troposphere; (c) is the same as (b), but for the B-B′ vertical cross-section.
Sustainability 16 06985 g009
Table 1. Synthesis of the physical parametrisation schemes in the present study.
EXP1 and EXP2
Parametrisation2500 m500 m
Turbulence1D3D
ConvectionNoneNone
Shallow convectionEDKFNone
Cloud microphysicsICE3ICE3
RadiationECMWFECMWF
Table 2. Statistical indices applied for the model verification in TAV -fire case: the Mean Error (ME) and the Root Mean Squared Error (RMSE) for the 2 m air temperature (T2M), 2 m relative humidity (RH2M), and wind speed at 10 m (WIND). The scores were calculated for the nearest point of each station in d02.
VariableStationMERMSE
T2MFaro4.24.2
Martim Longo−3.24.3
Castro Marim0.93.0
RH2MFaro−6.78.7
Martim Longo−4.15.4
WINDCastro Marim−1.83.4
Faro−0.61.4
Martim Longo−0.91.4
Castro Marim−1.21.6
Table 3. Statistical indices applied for the model verification in ALJ -fire case: the Mean Error (ME) and Root Mean Squared Error (RMSE) for the 2 m air temperature (T2M), 2 m relative humidity (RH2M), and wind speed at 10 m (WIND). The scores are calculated for the nearest point for each station in d02.
VariableStationMERMSE
T2MAljezur0.70.7
Monchique (Fóia)3.13.2
Portimão0.50.98
RH2MSagres4.45.1
Aljezur−7.37.3
Portimão−5.05.4
WINDSagres−0.050.5
Aljezur2.82.9
Portimão−0.21.0
Disclaimer/Publisher’s Note: The statements, opinions and data contained in all publications are solely those of the individual author(s) and contributor(s) and not of MDPI and/or the editor(s). MDPI and/or the editor(s) disclaim responsibility for any injury to people or property resulting from any ideas, methods, instructions or products referred to in the content.