Article

Recycled Content for Metals with Refined Classification of Metal Scrap: Micro-Level Circularity Indicator in Accordance with Macro-Level System

1
UACJ Corporation, 3-1-12, Chitose, Minato-ku, Nagoya 455-8670, Japan
2
Department of Advanced Interdisciplinary Studies, Graduate School of Engineering, The University of Tokyo, 4-6-1, Komaba, Meguro-ku, Tokyo 153-8904, Japan
3
Research Center for Advanced Science and Technology, The University of Tokyo, 4-6-1, Komaba, Meguro-ku, Tokyo 153-8904, Japan
4
UTokyo LCA Center for Future Strategy, The University of Tokyo, 4-6-1, Komaba, Meguro-ku, Tokyo 153-8904, Japan
*
Author to whom correspondence should be addressed.
Sustainability 2024, 16(16), 6933; https://doi.org/10.3390/su16166933
Submission received: 21 June 2024 / Revised: 29 July 2024 / Accepted: 9 August 2024 / Published: 13 August 2024

Abstract

:
Transitioning from a traditional linear economy to a circular economy occurs at the micro-level system, encompassing products and companies, which should be monitored. For metals, recycled content as an input-side indicator of recycling quantifies the ratio of metal scrap consumed during production and fabrication. However, conventional methodology struggles to evaluate recycled content uniquely due to the ambiguous classification of new scrap derived from industrial processes. Additionally, the input and output of new scrap between micro-level systems are often inadequately counted, causing inconsistencies in the recognition of secondary input between macro- and micro-level systems. This study introduces a refined classification for metal scrap, precisely distinguishing new scrap by its originating processes. Furthermore, we propose a novel perspective on new scrap, viewing it as a mixture of old scrap and primary raw materials, with only the portion of old scrap being considered secondary raw material. This stance navigates past the binary classification—whether new scrap should be classified as secondary—eliminating ambiguity and allowing for clear identification of secondary raw materials. The developed methodology ensures that all inputs of scrap are accounted for without leakage, and the recycled content of a specific metal is uniquely determined, maintaining consistency with macro-level systems.

1. Introduction

The transition from a traditional linear economy to a circular economy represents a significant shift in sustainability approaches. Essential to advancing this transition are frameworks, evaluation tools, and indicators for measuring and monitoring circularity [1,2]. These indicators are classified across micro (organizations, products, and consumers), meso (symbiotic associations and industrial parks), and macro levels (cities, provinces, regions, or countries), reflecting the various scopes of organizational, industrial, and societal impacts [3]. While the discussion around macro-level indicators has matured, micro-level indicators, crucial for organizational and product-level transitions, remain relatively scarce and in the early stages of development [1]. This is largely because circularity is perceived as a complex system that necessitates fundamental macro-level changes [4]. Furthermore, the challenge lies in integrating these micro-level indicators with broader macro-level frameworks to provide a comprehensive systems perspective [5,6].
In the context of material use, particularly metals, central to the circular economy is maximizing the utilization of secondary raw materials while minimizing reliance on primary resources. Recycling strategies play a critical role here. As the monitoring measures, recycling indicators are classified into input- and output-side metrics [7,8,9]; the former assesses the product supply to society, and the latter evaluates product life cycle completion and transfer to waste management. As an output-side indicator, the end-of-life recycling rate (EoL-RR) provides the ratio of recovered metal scrap to the scrap generation potential [9]. Although EoL-RR directly reflects the status of metal recycling at the end-of-life stage [8], EoL-RR is influenced by product design, collection rates of end-of-life products, and the waste management system. This makes it challenging for upstream producers and fabricators of metals to impact EoL-RR improvements solely [8,9].
As one of the input-side indicators, recycled content quantifies the share of metal scrap in metal production [8]. Monitoring recycled content is crucial for metal producers and fabricators, as it reflects their contribution to recycling efforts. The recycled content is determined during production and fabrication processes and remains constant throughout subsequent manufacturing stages. However, aligning this micro-level metric with macro-level indicators presents complexities concerning inputs and outputs at different system scales. One such complexity arises with “new scrap”, generated during industrial processes and often recycled into the same or different material. When recycled, new scrap crosses system boundaries at the micro level, while it is regarded as circulating within the macro-level system. Addressing the consistency between macro- and micro-level systems, especially concerning new scrap, is essential for developing micro-level indicators for input-side indicators, namely, recycled content.
Therefore, this study aims to develop a methodology for evaluating recycled content at the micro level, considering its alignment with macro-level systems. Section 2 discusses the methodological framework, including the classification of scrap, and the formulation of recycled content. Section 3 explores the applicability of the developed methodology.

2. Methodological Framework

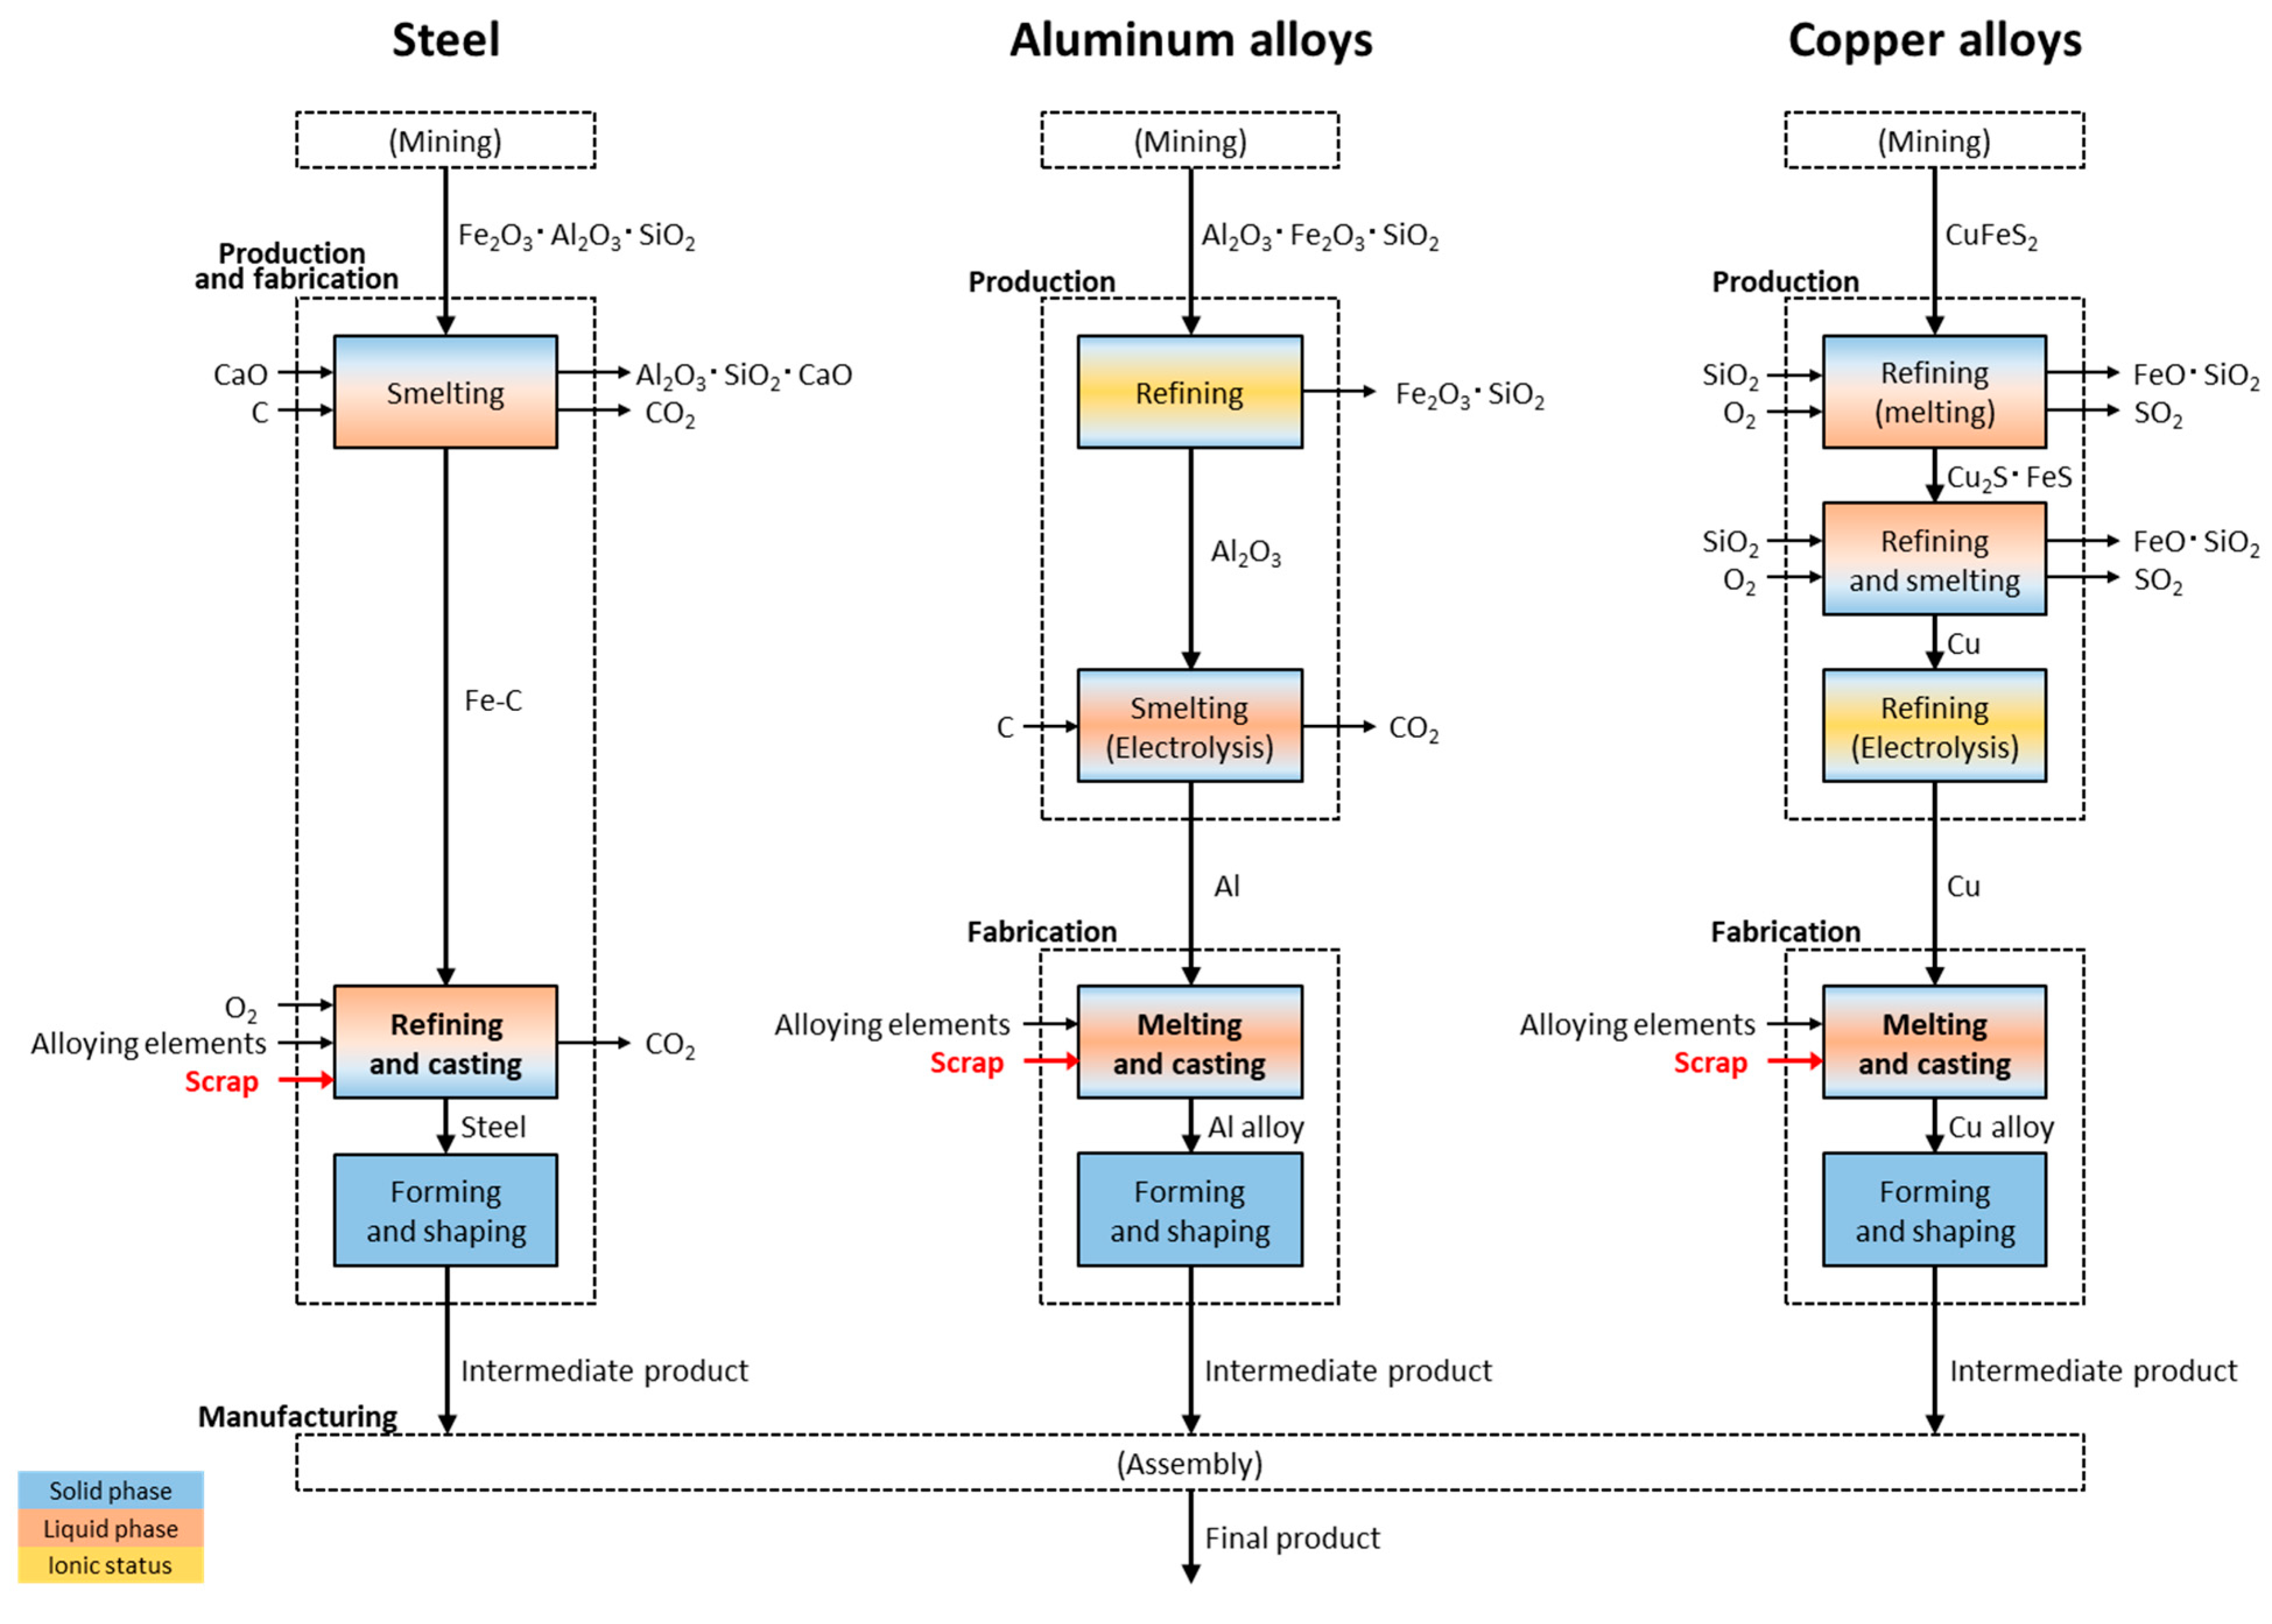
2.1. Classification of Metal Scrap

Recycled content explains the ratio, by mass, of recycled (secondary) material in a product [10]. The conventional definition of the recycled content for a specific metal, e.g., at a micro-level system, was ambiguous, primarily due to differing perspectives on the classification of new scrap. On the one hand, numerous material flow analysis (MFA) studies [7] and reports such as the UNEP report [11] describe new scrap as originating from fabrication or manufacturing processes, and typically transferred to the scrap market rather than recycled within the same facility. These definitions suggest an alignment of new scrap with old scrap in evaluating recycled content. However, considering that the origin of new scrap is an industrial process, new scrap should not be directly equated with old scrap. Conversely, some academia [12,13] regard new scrap as not secondary raw materials, arguing that its utilization does not reduce natural resource consumption or material disposal. Based on this perspective, new scrap generated from the metal derived entirely from old scrap is regarded as a primary raw material. In this case, the origin of new scrap overrides the nature of its original inputs. This case suggests that the binary classification of new scrap may cause discrepancies between macro- and micro-level systems. In other words, considering its origin, the refined classification of new scrap aligns the different systems. In this section, we first classified metal scrap in Section 2.1, followed by the differentiation of secondary input in Section 2.2, and finally, the recycled content is formulated in Section 2.3.
Metal scrap is generated throughout the life cycle of a metal and can be categorized into two types: old scrap and new scrap [7]. The scrap derived from end-of-life products and recycled after waste management is regarded as old scrap. Old scrap is also referred to as post-consumer material [10], end-of-life scrap [14], or obsolete scrap [15,16]. Conversely, the scrap generated during industrial processes is regarded as new scrap, which is often recycled into the same or different metal. New scrap is also referred to as pre-consumer material [10], industrial scrap [15], process scrap [17], or prompt scrap [18]. Since some new scrap is not considered an input to the system depending on where it is generated and consumed, we classified new scrap based on its origin and consumption.
In a supply chain of metals, industrial processes are classified into production, fabrication, and manufacturing in line with MFA studies [19]. Production involves concentration and purification processes like mining, milling, smelting, and refining. Fabrication includes conversion processes such as melting, casting (solidification), rolling, extrusion, and forging. Manufacturing is forming a finished product, for example, pressing, joining, and assembling. The finished product then enters the use phase in society. Upon reaching its end of life, the product is sent to waste management, which includes collection, dismantling, separation, treatment, recycling (primarily as scrap), and disposal (mostly as landfilling) [19]. In these stages, metal scrap is generated and is typically recycled alongside primary raw materials [7,9,11,13]. This is because metal scrap recycling is generally economically and environmentally beneficial if the metal scrap can substitute primary raw materials [20,21,22].
In this study, the target of the recycled content is a specific metal which is defined as a metal for a target product with a particular chemical composition. A specific metal is a micro level system; thus, it reflects the complexity between the micro-level and macro-level systems. By setting this target, metal scrap is further differentiated by whether it originates from itself. Ashby proposed the taxonomy of materials as follows [23], “The Kingdom of Materials can be subdivided into families, classes, subclasses, and members. As an example, the Materials Kingdom contains the family ‘Metals’ which in turn contains the class ‘Aluminium alloys’, the subclass ‘5000 series’ and finally the particular member ‘Alloy 5083 in the H2 heat treatment condition’”. According to the kingdom of materials, a specific metal in this study corresponds to a member. Then, the metal products from different members are considered distinct.
Based on the classification of processes and differentiation above, life cycle process flows of a specific metal and another type of metal are drawn as in Figure 1. Here, the differentiation of two types of metal is irrelevant to an entity which operates the process. In other words, these two types of metal are regarded distinct, even though they are produced by the same facility at different times. Following the flows in Figure 1, scrap is classified into five types based on its origin and consumption: (α) generated from production and fabrication (P&F) of a specific metal and consumed in P&F of the same metal, (β) generated from P&F of a different metal and consumed in P&F of the specific metal, (γ) generated from manufacturing of a product for which the specific metal is used, and consumed in P&F of the specific metal, (δ) generated from manufacturing of a different product and consumed in P&F of the specific metal, and (ε) generated from waste management and consumed in P&F of the specific metal. Typically, (α), (β), (γ), and (δ) are referred to as new scrap, and (ε) as old scrap.
In addition to differentiation by the type of metal and the process, temporal differentiation is considered. In a continuous process of metals, one production cannot be identified. Examples of continuous processes are converting for copper [24] and recovering molten lead from the shaft furnace during the recycling process of lead [25]. Without the temporal differentiation, all products from a continuous process are regarded as the same, even if the production timing gap spans years, which is unrealistic. Here, a specific metal is temporally distinguished by setting the time period necessary for one production. Conversely, in a batch process, one production batch is independent of others. Therefore, the time period can be set as only one batch of a specific metal. The time period is optionally extended to include several batches of a specific metal.
The idea of time period helps distinguish scrap generated over different time spans, contributing to accurate classification. By introducing the time period, “same” in the definition of (α) and (γ) means “derived from the same metal, generated from the same process(es), and recycled within the same time period”. For instance, if scrap from a specific metal is recycled to the process of a specific metal but is not recycled within the same time period, the scrap is regarded as originating from different metal. Note that though (ε) would further be differentiated as the same or different by definition, (ε) does not practically meet the criteria to be “same” since the lifetime of a typical product is longer than the time period. Therefore, in our classification, same or different is not applied for (ε).
Further analysis reveals that metal scrap from production and fabrication (α, β) and manufacturing (γ, δ) hold different statuses. According to the previous or original system of inputs, whether they are derived from the same metal is clarified. Among these inputs, (α) corresponds to home scrap, internal scrap [26], and in-house scrap [27]. Home scrap is output from production and fabrication (P&F), but it is always recycled internally within the process [7] or within the same facility [28]. Practically, almost 100% of home scrap is recycled [29]. Therefore, home scrap is neither regarded as an input nor an output.
In this regard, for the system at a micro-level or above, a part of (β) is consumed within the same facility, regarded as home scrap (recycling). On the other hand, when considered at a product level, such recycling is not regarded as home scrap (recycling), as it derives from a different metal, i.e., a different member in the kingdom of materials. This distinction can be likened to rooms in the home, resulting in the precise terminology “room scrap” for the scrap mentioned above as (β). The scrap (γ) is new scrap generated from manufacturing and recycled back to the original metal within the determined time period. This means (γ) is neither regarded as input nor output, which holds the same status as (α). The classification of scrap is summarized in Table 1.

2.2. Determining Secondary Raw Material Status in Metal Scrap

The next step is how to regard classified metal scrap as secondary raw materials. One of the conventional definitions of secondary raw materials is “recycled materials that can be used in manufacturing processes instead of or alongside virgin raw materials” [30]. Other definitions are “materials and products that can be used as raw materials by simple re-use, or via recycling and recovery” [31], “the basic materials recovered from previous use or waste from which a product is made”, and in life cycle (LC) terms, “the basic materials recovered from previous use or waste that are introduced into the boundaries of the studied system” [32]. Secondary raw materials are sometimes described as secondary supply [13] or secondary materials [33]. In summary, these definitions intend to distinguish primary raw materials from all other inputs that can substitute for primary raw materials. Although recognizing what can be regarded as secondary raw materials is still open for discussion, it is undisputed that metal scrap generated from waste management, denoted as (ε) in this study, is regarded as secondary raw materials. This is because (ε) is derived from end-of-life products that have completed a defined function during the use phase in society. On the other hand, (α), (β), (γ), and (δ) do not derive from waste management but are generated from industrial processes, meaning they have not completed the defined function through the use phase. Consequently, these inputs are not always regarded as secondary raw materials. This raises the question of whether such inputs are not secondary raw materials and whether they should be regarded as equivalent to primary raw materials. Metals are recycled at a relatively high rate after reaching their end of life compared to other industrial materials [7,16]. This fact indicates that a certain amount of recovered metal scrap has been used as an input in the previous production and fabrication of metals, which generated the new scrap. Therefore, the new scrap contains some secondary raw materials and should not be considered equivalent to primary raw materials. Here, we propose to regard the input of (α), (β), (γ), and (δ) as a mix of primary and definitive secondary raw materials referred to (ε). In other words, we regard only (ε), or old scrap, as secondary raw materials. The idea refers to the previous system(s) from which those inputs of metal scrap are generated, which can determine how much old scrap was consumed during the production and fabrication of the original metal, resulting in a system expansion (Figure 2).
For the sake of simplification, we suppose the case where the previous system does not consume any new scrap in Figure 2. If the previous systems consume new scrap, it should be traced back to further previous systems. In theory, it is possible to refer to the previous systems subsequently until new scrap is no longer used. From a conservative perspective, the input with no details because of insufficient traceability should not be regarded as containing old scrap. It should be treated the same as primary raw material.

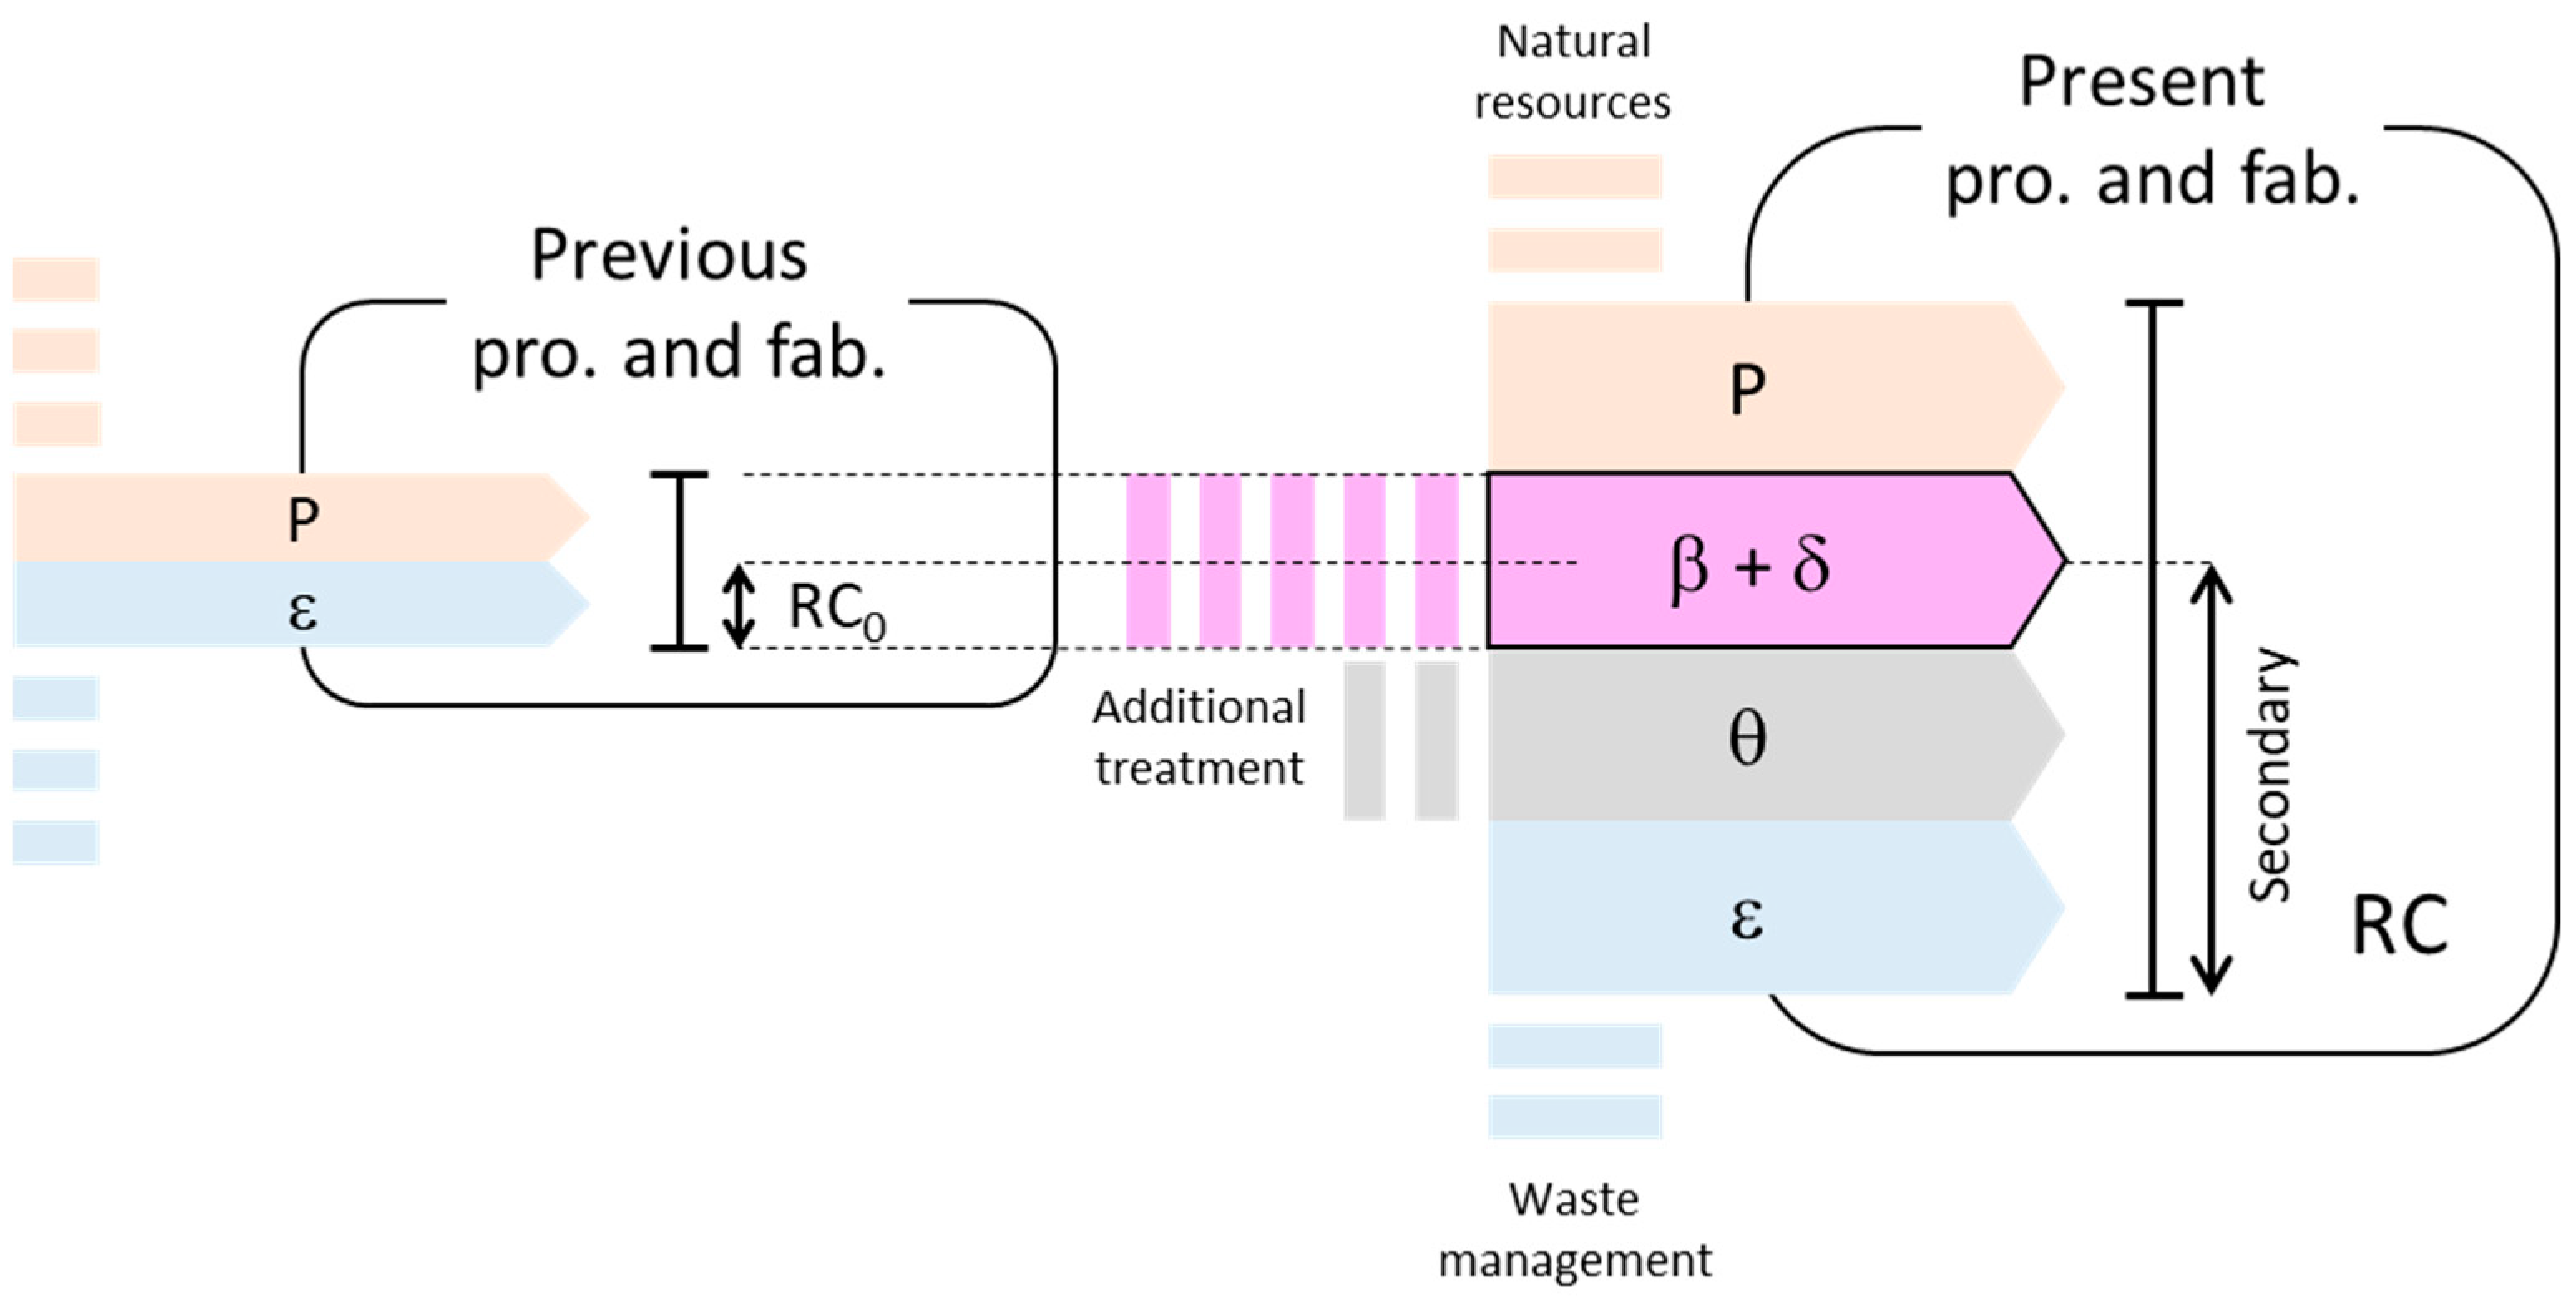
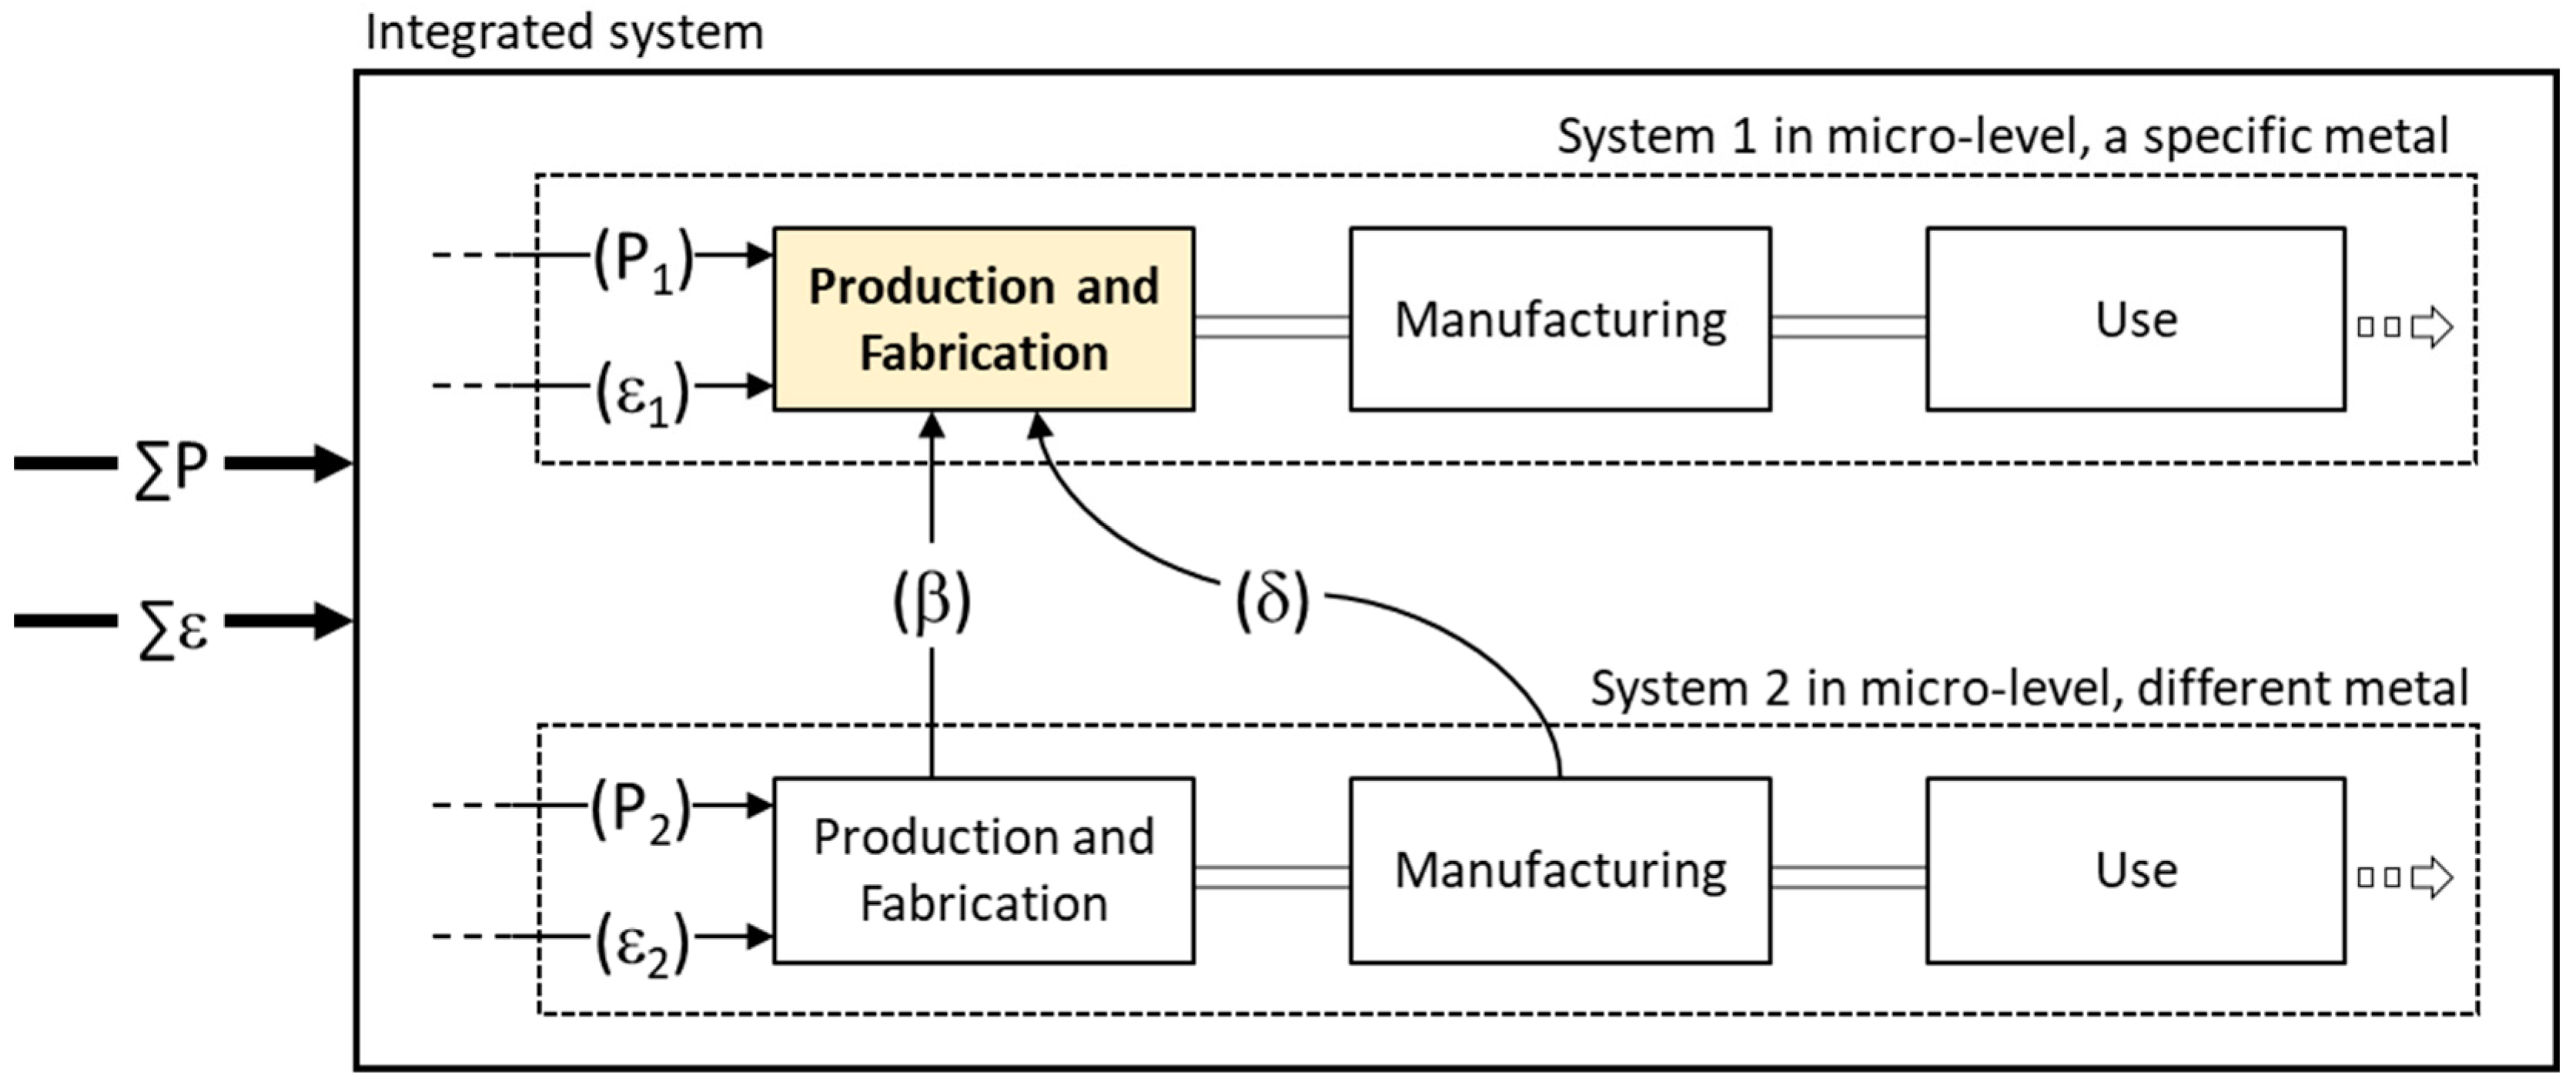
2.3. Formulation of Recycled Content

There are several definitions of recycled content, depending on its purpose and usage. For metals, the United Nations Environment Programme (UNEP) defines recycled content as “the fraction of secondary (scrap) metal in the total metal input of metal production” [11]. This definition is commonly used in many MFA studies to evaluate the recycled content of metals at global [34], regional [35], and nationwide levels [36,37,38]. In this study, we adhere to the UNEP’s definition of recycled content. The difference between other definitions of recycled content will be discussed later.
The recycled content of a specific metal represents the ratio of substances derived from end-of-life products contained in the metal. However, it is technically impossible to quantify the ratio of secondary substances contained in the metal in scope through the analytical detection of recycled metals directly. Therefore, the recycled content of a specific metal is empirically quantified using information on the inputs to the production and fabrication process of the metal as a proxy. During this process, the chemical composition of a specific metal is determined based on the required specification and is proportional to the ratio of the inputs of raw materials. Once the composition is determined, it does not change in subsequent processes. Hence, we focus on the process in which the chemical composition of a specific metal is determined.
The process to determine the recycled content and the related inputs vary depending on the class of metals. Simplified processes of representative metals are depicted in Figure 3. For example, the recycled content of aluminum alloys is calculated based on the input to the melting and casting processes during fabrication, because no scrap or scrap-derived inputs are used in production processes such as refining (Bayer process) and smelting (Hall–Héroult process) [36]. The approach for calculating the recycled content of copper alloys follows the same rationale due to similar production characteristics [39]. Conversely, the recycled content of steel is calculated based on the input to the steelmaking process [40], or refining and casting as integrated processes of production and fabrication shown in Figure 3. It is important to note that the input of metal scrap is not always purely scrap; sometimes, such input includes processed scrap and may even be mixed with primary materials, typically to dilute impurities. In such cases, the primary and scrap metal proportion within the input shall be clearly identified and accounted for separately. The inputs of alloying elements can be treated similarly; if any, the scrap-derived portion of alloying elements is clarified and accounted for separately as primary and secondary. Furthermore, by applying this framework, the recycled content of a composite metal can be expressed as the weighted average of each composed uniform metal. This approach ensures a nuanced and accurate representation of recycled content across various types of metal and their respective production processes. Note that this definition is valid for uniform metals, not for plated materials, clad materials, coated materials, or layered materials.
The recycled content of a specific metal, defined above as the ratio of old scrap in the total inputs, is formulated as Equation (1). The denominator represents the total mass of inputs other than the same metal. The numerator signifies the total mass of old scrap included in the inputs.
R C ( % ) = β + δ × R C 0 ¯ + ε P + β + δ + ε × 100
where:
  • RC is the recycled content of a specific metal.
  • RC0 is the original recycled content of individual input of new scrap.
  • R C 0 ¯ is a weighted average of RC0.
  • P is the mass of the primary raw material input.
  • β is the mass of new scrap input generated from the production and fabrication of a different metal.
  • δ is the mass of new scrap input generated from the manufacturing of a different product.
  • ε is the mass of old scrap input.
(α) and (γ) are not considered in the formula as they only circulate within the same system. When multiple sources contribute to (β + δ), it often happens that RC0 differs by the source. Therefore, R C 0 ¯ is calculated from the mass and RC0 of each source, and is applied to Equation (1).

3. Demonstration and Discussions

3.1. Is New Scrap Secondary Raw Material?

As discussed in Section 2.1, the binary classification of new scrap may cause discrepancies of secondary input between macro- and micro-level systems. The transfer of new scrap between micro-level systems adds complexity to this discussion. Suppose the flows in Figure 4, where system 1 specializes in processing a specific metal and product, while system 2 processes a different metal and product and generates new scrap as co-products. The parameters of inputs depicted in Figure 4 align with those discussed in Section 2.3. The mass of all the inputs is supposed not to be zero.
When the conventional binary classification is applied to the transferred new scrap, (β) and (δ) are regarded as primary or old scrap, assigning the recycled content of these scrap at either 0% or 100%. However, the recycled content of a product from system 2 is never 0% nor 100%. This creates a severe discrepancy between the recycled contents of the product and co-products from system 2, even though the original inputs and processes are common for both. This discrepancy, which is practically challenging and unrealistic, makes the binary classification of new scrap inapplicable when considering the transfer of new scrap between systems.
Moreover, another discrepancy arises when considering an integrated system comprising systems 1 and 2 as subsystems. If (β) and (δ) are regarded as old scrap, the sum of old scrap inputs to the subsystems is (ε1 + ε2 + β + δ). Yet, the input of old scrap to the integrated system, Σε, is equivalent to (ε1 + ε2) because (β) and (δ) are neither inputs nor outputs from the perspective of the integrated system. It is vice versa for the case when (β) and (δ) are regarded as primary. The developed methodology, however, treats new scrap as a mixture of primary and old scrap and accounts only for the portion of old scrap contained within new scrap when evaluating recycled content. As a result, the sum of inputs to micro-level systems is consistent with an integrated system, and eventually even a macro-level system, though the developed methodology operates at the smallest micro-level as the specific metal level. Thus, by establishing a consistent methodology for classifying new scrap, we provide a more straightforward and transparent approach to evaluating recycled content.
Furthermore, the recyclability of new scrap varies significantly. For example, new scrap generated from blanking processes is easily recyclable and can directly serve as input for subsequent production and fabrication processes. However, new scrap from mixed-metal joints necessitates special treatment, such as component separation, to mitigate potential contamination. This study defines such necessary interventions as “the process to recover new scrap that cannot be recycled in its original form”. This additional treatment, thereby, aligns the recycling of otherwise non-recyclable new scrap with the waste management applied to end-of-life products. Consequently, this study posits that new scrap after an additional treatment has the same status as old scrap. Here, Equation (1) is modified as Equation (2) when the inputs include the new scrap after additional treatment.
R C ( % ) = β + δ × R C 0 ¯ + ε + θ P + β + δ + ε + θ × 100
where:
  • θ is the mass of new scrap input after an additional treatment.
Additional treatments include separation, sorting, removing layers, refining, heat treatment, degreasing, and pressing. An additional or extra effort to utilize such scrap as inventions and development can be regarded as the same as the additional treatment. However, it is different from the physical treatment. The challenge lies in establishing protocols to ensure that additional treatments prevent the disposal of new scrap and methods to distinguish between new scrap with and without an additional treatment.

3.2. Evaluation of Recycled Content by Proposed Methodology

The developed formula is demonstrated through five cases, as shown in Table 2. Note that numbers in Table 2 are simplified and are not based on the practical case. This is intended to highlight the difference of recycled content between our methodology and conventional equations. Case 1 represents the baseline scenario, with primary (P) and old scrap (ε) inputs. From cases 2 to 5, additional inputs (β + δ) and (γ) are included alongside primary and old scrap to examine the impact of input types on recycled content. Here, additional treatments for new scrap were not taken into consideration. We assumed that the consumption of old scrap remains constant while the consumption of primary fluctuates based on production and fabrication requirements for the metal. In cases 2 and 3, (β + δ) originates from another metal containing 10% of recycled content ( R C 0 ¯ ). The input of (β + δ) replaces a part of the primary inputs. In cases 4 and 5, (γ) is new scrap returned from the manufacturing process of the same product system. The input of (γ) does not replace the primary. Rather, such a return means that the same amount of the metal was additionally supplied to the manufacturing process. Therefore, for cases 4 and 5, the input mass of (P) and (ε) remains the same as in case 1 because the additional supply and the return are compensated.
Following the scenarios summarized in Table 2, recycled content was calculated using Equation (1). For comparison, we also calculated recycled content based on the conventional definitions, exploring whether new scrap should be considered a secondary raw material. Equation (3) (Conv-RCa) treats new scrap as a secondary raw material, while Equation (4) (Conv-RCb) does not. The Conv-RCb reflects the proportion of old scrap used as input, distinguished and named end-of-life recycled content [35]. The equation parameters align with those discussed in Section 2.3:
C o n v R C a   % = β + γ + δ + ε P + β + γ + δ + ε
C o n v R C b   % = ε P + β + γ + δ + ε
Adopting Conv-RCa, recycled content is up to 80% by incorporating (β + δ) as input. This result shows that the recycled content can be inflated by considering new scrap as a secondary raw material. Furthermore, recycled content is up to 57% with the addition of (γ), produced in larger quantities without any difficulties by deliberately reducing the yield during manufacturing. However, this approach does not affect the consumption of primary resources, which leads to a mismatch between increased recycled content and stable natural resource consumption. Thereby, Conv-RCa limits its ability to reflect circularity as the true value. Following Conv-RCb resulted in stable or lower recycled content than the baseline case 1 as the amount of new scrap increases, based on the perspective that scrap from industrial processes should be equated with primary materials, a view critiqued in Section 2.1.
The developed methodology accounts for old scrap, which is included in inputs of new scrap from different metals for calculating recycled content. Moreover, new scrap returned through closed loops does not inflate recycled content but maintains its value, as shown in cases 4 and 5. Thus, this approach effectively tracks the relationship between the micro-level recycling condition and the macro-level natural resource consumption. This study proposes tracing the origin of the inputs of new scrap to potentially motivate the improvement of the original recycled content (RC0) if previous systems are identifiable. The developed methodology accommodates the nature of metal, which is recycled multiple times within society.

3.3. Comparison of Various Definitions of Recycled Content

In this study, we employed the UNEP’s definition of recycled content, commonly used in MFA studies as an indicator of the utilization of the generated secondary materials [27,41,42]. The UNEP definition of recycled content shows the ratio of secondary raw materials in a metal produced and fabricated in the defined system. Typically, MFA studies set this system at the macro level, such as nationwide or broader. Consequently, metal scrap circulating within such a macro-level system is not considered when evaluating the recycled content at the macro level since this scrap is neither classified as an input nor an output.
In life cycle assessment (LCA) studies, recycled content is used as an indicator of a product’s environmental profile related to recycling. Andreasi Bassi et al. (2021) consider recycled content as an index and target of recycling, in which a methodological framework focusing on increasing material circularity in a product is developed [43]. Ardente and Mathieux (2014) proposed a framework to identify potential measures for improving resource efficiency related to a product in which recycled content is regarded as one of the resource efficiency criteria [44]. Furthermore, recycled content is used as a parameter for recycling modeling in LCA. Niero (2016) evaluated the environmental profile of aluminum beverage cans along with the Cradle to Cradle certification program, which requires a certain amount of recycled content for certification [45]. In LCA studies, the value of recycled content is typically pre-determined, with little discussion around the definition, evaluation methodology, or calculated values of recycled content.
Practically, recycled content is used to make an environmental claim about a product. Various manufacturers use recycled content to highlight the awareness of recycling in their products [46,47]. In this regard, recycled content should be quantified according to universal standards to ensure fairness and avoid greenwashing. ISO 14021, for example, defines recycled content as “the proportion, by mass, of recycled material in a product or packaging”. Other private standards for evaluating the recycled content of a product follow the definition in ISO 14021 [48,49]. According to ISO 14021, the recycled content of a product is calculated as the weighted average of the recycled materials used in the product. While it is straightforward to calculate this average if materials are explicitly differentiated as recycled (100% recycled content) or non-recycled (0% recycled content), complications arise because the recycled content of a material can vary between zero and unity. Therefore, to determine a product’s recycled content, each constituent material’s recycled content should be evaluated. However, the definition provided by ISO 14021 is broad and vague, which can lead to various interpretations and divergent evaluations of recycled content.
The developed methodology addresses these issues effectively; it ensures all inputs of scrap are accounted for without leakage, and the recycled content of a specific metal is uniquely determined, maintaining consistency with macro-level systems. A limitation, however, is that it is often challenging to infinitely trace previous systems due to the insufficient traceability of new scrap. When a previous system cannot be traced further, the evaluated recycled content is invariably less than the actual value. Therefore, according to the developed methodology, recycled content can be closer to the actual value by improving the traceability of new scrap inputs. To achieve the recycled content closest to the truth, it is imperative that not just individual entities but all stakeholders and the entire industry work towards improving the traceability of new scrap.

4. Conclusions

In this study, we introduced a novel classification for metal scrap that refines the conventional classification of new scrap. This approach further classifies industry-originated scrap, e.g., new scrap, down to a specific product level, distinguishing it by the process(es) from which it originates. This refined classification enables the tracking and accounting of metal scrap related to a specific metal at a micro-level system, maintaining the consistency with a macro-level system. Thereby, it offers more detailed monitoring of material circularity at the smallest micro-level. Consequently, we addressed a nuanced perspective on secondary raw materials, positing that only the old scrap component within the new scrap should be considered secondary. It provides a concrete measure of how much primary raw material usage is substituted, thereby quantifying circularity status. Building on this foundation, we developed a methodology for uniquely evaluating recycled content for a specific metal at the micro-level, aligning with definitions commonly utilized in MFA studies focused on metals. This methodology facilitates a precise assessment of input-side metal circularity at the micro level, which is consistent with integrated systems and leads to advancing a bottom-up approach to fostering the transition toward a circular economy.
This study contributes to a more sophisticated understanding and implementation of circular economy principles, particularly in the context of metal recycling. Providing clear classification and evaluation frameworks aims to achieve the recycled content closest to the truth and, consequently, the efficiency of recycling processes and policies.

Author Contributions

Conceptualization, T.S. and I.D.; methodology, T.S. and I.D.; writing—original draft preparation, T.S.; writing—review and editing, I.D.; visualization, T.S. and I.D.; supervision, I.D.; project administration, I.D.; funding acquisition, I.D. All authors have read and agreed to the published version of the manuscript.

Funding

This article is based on results obtained from the projects JPNP21003 and JPNP23002, commissioned by the New Energy and Industrial Technology Development Organization (NEDO), and MEXT/JSPS KAKENHI Grant Number JP21H03660.

Institutional Review Board Statement

Not applicable.

Informed Consent Statement

Not applicable.

Data Availability Statement

The original contributions presented in the study are included in the article.

Conflicts of Interest

Corresponding author Taichi Suzuki is an employee of UACJ Corporation, and a Ph.D candidate at The University of Tokyo. The funders had no role in the design of the study; in the collection, analyses, or interpretation of data; in the writing of the manuscript; or in the decision to publish the results.

References

  1. Saidani, M.; Yannou, B.; Leroy, Y.; Cluzel, F.; Kendall, A. A Taxonomy of Circular Economy Indicators. J. Clean. Prod. 2019, 207, 542–559. [Google Scholar] [CrossRef]
  2. Kristensen, H.S.; Mosgaard, M.A. A Review of Micro Level Indicators for a Circular Economy—Moving Away from the Three Dimensions of Sustainability? J. Clean. Prod. 2020, 243, 118531. [Google Scholar] [CrossRef]
  3. Kirchherr, J.; Reike, D.; Hekkert, M. Conceptualizing the Circular Economy: An Analysis of 114 Definitions. Resour. Conserv. Recycl. 2017, 127, 221–232. [Google Scholar] [CrossRef]
  4. Kirchherr, J.; Yang, N.-H.N.; Schulze-Spüntrup, F.; Heerink, M.J.; Hartley, K. Conceptualizing the Circular Economy (Revisited): An Analysis of 221 Definitions. Resour. Conserv. Recycl. 2023, 194, 107001. [Google Scholar] [CrossRef]
  5. Pauliuk, S. Critical Appraisal of the Circular Economy Standard BS 8001:2017 and a Dashboard of Quantitative System Indicators for Its Implementation in Organizations. Resour. Conserv. Recycl. 2018, 129, 81–92. [Google Scholar] [CrossRef]
  6. Ahmed, A.A.; Nazzal, M.A.; Darras, B.M.; Deiab, I.M. A Comprehensive Multi-Level Circular Economy Assessment Framework. Sustain. Prod. Consum. 2022, 32, 700–717. [Google Scholar] [CrossRef]
  7. Graedel, T.E.; Allwood, J.; Birat, J.-P.; Buchert, M.; Hagelüken, C.; Reck, B.K.; Sibley, S.F.; Sonnemann, G. What Do We Know About Metal Recycling Rates? J. Ind. Ecol. 2011, 15, 355–366. [Google Scholar] [CrossRef]
  8. Reck, B.K.; Graedel, T.E. Challenges in Metal Recycling. Science 2012, 337, 690–695. [Google Scholar] [CrossRef]
  9. Daigo, I.; Iwata, K.; Ohkata, I.; Goto, Y. Macroscopic Evidence for the Hibernating Behavior of Materials Stock. Environ. Sci. Technol. 2015, 49, 8691–8696. [Google Scholar] [CrossRef]
  10. ISO 14021:2016(E); Environmental Labels and Declarations—Self-Declared Environmental Claims (Type II Environmental Labelling). ISO: Geneva, Switzerland, 2016.
  11. United Nations Environment Programme; International Resource Panel. Recycling Rates of Metals: A Status Report; Report of the Working Group on the Global Metal Flows to the International Resource Panel; United Nations Environment Programme: Nairobi, Kenya, 2011. [Google Scholar]
  12. Rombach, G.; Modaresi, R.; Müller, D.B. Aluminium Recycling—Raw Material Supply from a Volume and Quality Constraint System. World Metall. 2012, 7, 157–162. [Google Scholar]
  13. Norgate, T. Metal Recycling: The Need for a Life Cycle Approach; CSIRO: Canberra, Australia, 2013.
  14. Pauliuk, S.; Milford, R.L.; Müller, D.B.; Allwood, J.M. The Steel Scrap Age. Environ. Sci. Technol. 2013, 47, 3448–3454. [Google Scholar] [CrossRef] [PubMed]
  15. Daigo, I.; Hashimoto, S.; Matsuno, Y.; Adachi, Y. Material Stocks and Flows Accounting for Copper and Copper-Based Alloys in Japan. Resour. Conserv. Recycl. 2009, 53, 208–217. [Google Scholar] [CrossRef]
  16. Dubreuil, A.; Young, S.B.; Atherton, J.; Gloria, T.P. Metals Recycling Maps and Allocation Procedures in Life Cycle Assessment. Int. J. Life Cycle Assess. 2010, 15, 621–634. [Google Scholar] [CrossRef]
  17. Milford, R.L.; Allwood, J.M.; Cullen, J.M. Assessing the Potential of Yield Improvements, through Process Scrap Reduction, for Energy and CO2 Abatement in the Steel and Aluminium Sectors. Resour. Conserv. Recycl. 2011, 55, 1185–1195. [Google Scholar] [CrossRef]
  18. Flint, I.P.; Cabrera Serrenho, A.; Lupton, R.C.; Allwood, J.M. Material Flow Analysis with Multiple Material Characteristics to Assess the Potential for Flat Steel Prompt Scrap Prevention and Diversion without Remelting. Environ. Sci. Technol. 2020, 54, 2459–2466. [Google Scholar] [CrossRef] [PubMed]
  19. Graedel, T.E.; Harper, E.M.; Nassar, N.T.; Reck, B.K. On the Materials Basis of Modern Society. Proc. Natl. Acad. Sci. USA 2015, 112, 6295–6300. [Google Scholar] [CrossRef] [PubMed]
  20. Frees, N. Crediting Aluminium Recycling in LCA by Demand or by Disposal. Int. J. Life Cycle Assess. 2008, 13, 212–218. [Google Scholar] [CrossRef]
  21. Frischknecht, R. LCI Modelling Approaches Applied on Recycling of Materials in View of Environmental Sustainability, Risk Perception and Eco-Efficiency. Int. J. Life Cycle Assess. 2010, 15, 666–671. [Google Scholar] [CrossRef]
  22. Moraga, G.; Huysveld, S.; Mathieux, F.; Blengini, G.A.; Alaerts, L.; Van Acker, K.; de Meester, S.; Dewulf, J. Circular Economy Indicators: What Do They Measure? Resour. Conserv. Recycl. 2019, 146, 452–461. [Google Scholar] [CrossRef]
  23. Ashby, M.F. Materials Selection in Mechanical Design, 5th ed.; Butterworth-Heinemann: Oxford, UK; Boston, MA, USA, 2016; ISBN 978-0-08-100610-8. [Google Scholar]
  24. Forsén, O.; Aromaa, J.; Lundström, M. Primary Copper Smelter and Refinery as a Recycling Plant—A System Integrated Approach to Estimate Secondary Raw Material Tolerance. Recycling 2017, 2, 19. [Google Scholar] [CrossRef]
  25. Worrell, E.; Reuter, M.A. (Eds.) Handbook of Recycling: State-of-the-Art for Practitioners, Analysts, and Scientists; Elsevier: Amsterdam, The Netherlands; Boston, MA, USA, 2014; ISBN 978-0-12-396459-5. [Google Scholar]
  26. Kevorkijan, V. The Recycle of Wrought Aluminum Alloys in Europe. JOM 2002, 54, 38–41. [Google Scholar] [CrossRef]
  27. Buchner, H.; Laner, D.; Rechberger, H.; Fellner, J. In-Depth Analysis of Aluminum Flows in Austria as a Basis to Increase Resource Efficiency. Resour. Conserv. Recycl. 2014, 93, 112–123. [Google Scholar] [CrossRef]
  28. Blomberg, J.; Söderholm, P. The Economics of Secondary Aluminium Supply: An Econometric Analysis Based on European Data. Resour. Conserv. Recycl. 2009, 53, 455–463. [Google Scholar] [CrossRef]
  29. Davis, J.; Geyer, R.; Ley, J.; He, J.; Clift, R.; Kwan, A.; Sansom, M.; Jackson, T. Time-Dependent Material Flow Analysis of Iron and Steel in the UK. Resour. Conserv. Recycl. 2007, 51, 118–140. [Google Scholar] [CrossRef]
  30. Strategy for Secondary Raw Materials. Available online: https://www.europarl.europa.eu/legislative-train/carriage/strategy-for-secondary-raw-materials/report?sid=6201 (accessed on 10 May 2024).
  31. Joint Research Center RMIS—Raw Materials Information System. Available online: https://rmis.jrc.ec.europa.eu/?page=policies-and-definitions-2d5b5e (accessed on 10 May 2024).
  32. Eurometaux. Product Environmental Footprint Category Rules (PEFCR) for Metal Sheets for Various Applications; Eurometaux: Brussels, Belgium, 2019. [Google Scholar]
  33. European Commission. Product Environmental Footprint Category Rules Guidance; European Commission: Brussels, Belgium, 2018. [Google Scholar]
  34. Van den Eynde, S.; Bracquené, E.; Diaz-Romero, D.; Zaplana, I.; Engelen, B.; Duflou, J.R.; Peeters, J.R. Forecasting Global Aluminium Flows to Demonstrate the Need for Improved Sorting and Recycling Methods. Waste Manag. 2022, 137, 231–240. [Google Scholar] [CrossRef]
  35. Tercero Espinoza, L.A.; Soulier, M. Defining Regional Recycling Indicators for Metals. Resour. Conserv. Recycl. 2018, 129, 120–128. [Google Scholar] [CrossRef]
  36. Chen, W.-Q. Recycling Rates of Aluminum in the United States: Recycling Rates of Aluminum in the United States. J. Ind. Ecol. 2013, 17, 926–938. [Google Scholar] [CrossRef]
  37. Ding, N. Substance Flow Analysis of Aluminum Industry in Mainland China. J. Clean. Prod. 2016, 133, 1167–1180. [Google Scholar] [CrossRef]
  38. Cooper, D.R.; Ryan, N.A.; Syndergaard, K.; Zhu, Y. The Potential for Material Circularity and Independence in the U.S. Steel Sector. J. Ind. Ecol. 2020, 24, 748–762. [Google Scholar] [CrossRef]
  39. Glöser, S.; Soulier, M.; Tercero Espinoza, L.A. Dynamic Analysis of Global Copper Flows. Global Stocks, Postconsumer Material Flows, Recycling Indicators, and Uncertainty Evaluation. Environ. Sci. Technol. 2013, 47, 6564–6572. [Google Scholar] [CrossRef]
  40. Broadbent, C. Steel’s Recyclability: Demonstrating the Benefits of Recycling Steel to Achieve a Circular Economy. Int. J. Life Cycle Assess. 2016, 21, 1658–1665. [Google Scholar] [CrossRef]
  41. Bailey, R.; Bras, B.; Allen, J.K. Measuring Material Cycling in Industrial Systems. Resour. Conserv. Recycl. 2008, 52, 643–652. [Google Scholar] [CrossRef]
  42. Rombach, G. Raw Material Supply by Aluminium Recycling—Efficiency Evaluation and Long-Term Availability. Acta Mater. 2013, 61, 1012–1020. [Google Scholar] [CrossRef]
  43. Andreasi Bassi, S.; Tonini, D.; Ekvall, T.; Astrup, T.F. A Life Cycle Assessment Framework for Large-Scale Changes in Material Circularity. Waste Manag. 2021, 135, 360–371. [Google Scholar] [CrossRef] [PubMed]
  44. Ardente, F.; Mathieux, F. Identification and Assessment of Product’s Measures to Improve Resource Efficiency: The Case-Study of an Energy Using Product. J. Clean. Prod. 2014, 83, 126–141. [Google Scholar] [CrossRef]
  45. Niero, M. Closing the Loop for Aluminum Cans: Life Cycle Assessment of Progression in Cradle-to-Cradle Certification Levels. J. Clean. Prod. 2016, 126, 352–362. [Google Scholar] [CrossRef]
  46. Apple Environment. Available online: https://www.apple.com/environment/ (accessed on 10 May 2024).
  47. Mercedes-Benz. On the Road to the Circular Economy. Available online: https://group.mercedes-benz.com/responsibility/sustainability/resources/circular-economy.html (accessed on 10 May 2024).
  48. SCS Global Services. Recycled Content Standard, V7.0, Environmental Certification Services; SCS Global Services: Emeryville, CA, USA, 2014. [Google Scholar]
  49. Underwriters Laboratories. Environmental Claim Validation Procedure (ECVP) for Recycled Content, UL2809; Underwriters Laboratories: Northbrook, IL, USA, 2020. [Google Scholar]
Figure 1. Schematic image of classification of scrap indicated in the life cycle process flows of a specific metal and different metal.
Sustainability 16 06933 g001
Figure 2. Schematic image of referring to the origin of new scrap input used in the present production and fabrication. Abbreviations are as follows: pro. for production, fab. for fabrication.
Sustainability 16 06933 g002
Figure 3. Simplified production and fabrication processes of steel, aluminum alloys, and copper alloys. The color of processes shows the phase and status of the metal.
Sustainability 16 06933 g003
Figure 4. Schematic image of input flows between micro-level systems and within the integrated system. (P) for primary raw materials, (β) for new scrap from the production and fabrication of different metal, (δ) for new scrap from the manufacturing of different metal, and (ε) for old scrap.
Sustainability 16 06933 g004
Table 1. Classification of scrap used as an input to the production and fabrication of a specific metal. The characters in the brackets correspond to those in Figure 1. Abbreviations are as follows: P&F for production and fabrication, M for manufacturing, and WM for waste management.
Generated FromConventional ClassificationExpression in This Study
(α)P&F of a specific metal in scopeHome scrapHome scrap
(β)P&F of a different metalfrom the same facilityHome scrapNew (different, P&F) scrap
from a different facilityNew scrap
(γ)M of the productNew scrapNew (same, M) scrap
(δ)M of a different productNew scrapNew (different, M) scrap
(ε)WMOld scrapOld scrap
Table 2. Examples of input to a specific metal and calculated recycled content. The characters in the brackets and expressions of inputs correspond to those in Figure 1.
CaseInputsCalculation
Pβ + δγεRCConv-RCaConv-RCb
160004040%40%40%
2402004042%60%40%
3204004044%80%40%
4600204040%50%33%
5600404040%57%29%
Disclaimer/Publisher’s Note: The statements, opinions and data contained in all publications are solely those of the individual author(s) and contributor(s) and not of MDPI and/or the editor(s). MDPI and/or the editor(s) disclaim responsibility for any injury to people or property resulting from any ideas, methods, instructions or products referred to in the content.

