Article

A Multi-Pollutant Air Quality Analysis with Environmental Justice Considerations: Case Study for Detroit

1
Guangdong Provincial Key Laboratory of Atmospheric Environment and Pollution Control, School of Environment and Energy, South China University of Technology, Guangzhou Higher Education Mega Center, Guangzhou 510006, China
2
State Key Joint Laboratory of Environment Simulation and Pollution Control, School of Environment, Tsinghua University, Beijing 100084, China
3
Department of Civil and Environmental Engineering, University of Tennessee, Knoxville, TN 37996, USA
*
Author to whom correspondence should be addressed.
Sustainability 2024, 16(16), 6931; https://doi.org/10.3390/su16166931
Submission received: 17 June 2024 / Revised: 25 July 2024 / Accepted: 12 August 2024 / Published: 13 August 2024
(This article belongs to the Special Issue Human Exposure to Air Pollution and Environmental Sustainability)

Abstract

:
Over the last two decades, substantial studies have been conducted to assess the feasibility of a multi-pollutant strategy for managing air quality in the United States. Given the inherent complexity of multi-pollutant air quality challenges, including fine particulate matter (PM2.5), ozone (O3), and air toxics, this paper undertook a multi-pollutant analysis at both national and local levels. Our analysis incorporated O3 and PM2.5 concentrations, air toxics that increase the risk of cancer, environmental justice (EJ) data, emissions data, and monitoring data. Initially, we identified counties across the continental U.S. with heightened multi-pollutant exposures and EJ concerns. Subsequently, a case study within the Detroit metropolitan area was conducted, revealing a clear overlap between multi-pollutant and EJ issues, underscoring the disproportionate burden on disadvantaged communities. The analysis of detailed emissions data unveiled potential co-control benefits in this region. Lastly, employing a proximity analysis method, we assessed environmental issues surrounding points of interest such as monitoring sites and emissions sectors, in the Detroit metropolitan area. The results demonstrated that monitoring sites with the highest monitoring value, alongside top-ranked emissions sectors such as electric utilities, coke ovens, and iron and steel production, were likely to exhibit elevated air pollutant concentrations/risks and associated EJ concerns in their vicinity.

Graphical Abstract

1. Introduction

In 2004, the National Research Council (NRC) first recommended adopting a multi-pollutant strategy to manage air quality in the United States (U.S.) [1]. The rationales for transitioning to the multi-pollutant strategy are as follows: (1) pollutants have common emissions sources [2,3]; (2) control strategies can reduce multiple pollutants simultaneously [4,5,6]; and (3) exposure pathways and risks are influenced by multiple pollutants [7,8,9]. Fine particulate matter (PM2.5), ozone (O3), and air toxics represent focal points in multi-pollutant air quality management within the U.S. These pollutants stand out as enduring challenges in air quality regulation due to their significant impacts on human health [1,10,11].
A number of studies and reports have delved into the feasibility of a multi-pollutant strategy in the U.S. For example, research in Detroit demonstrated that a multi-pollutant strategy could effectively reduce the ambient concentrations of multiple air pollutants (e.g., PM2.5, O3, and air toxics), lower public risk, and address community air toxic exposure concerns [12]. Building upon this foundation, the U.S. Environmental Protection Agency (U.S. EPA, Research Triangle Park, NC, USA) and other stakeholders in South Carolina demonstrated that the implementation of a multi-pollutant strategy could yield health and economic benefits while reducing the costs of air pollution control [10]. Additionally, the Bay Area Air Quality Management District (BAAQMD) seamlessly integrated a multi-pollutant strategy into their air quality management plan, aiming to simultaneously curtail emissions contributing to O3, PM2.5, air toxics, and greenhouse gases [13].
As the momentum continued, the Louisville Metropolitan Air Pollution Control District (APCD) developed a multi-pollutant strategy harmonizing emissions and monitoring data to reduce air pollution in the Louisville Metropolitan area [14]. Apart from research within the U.S., international insights further underscore the efficacy of the multi-pollutant strategy. An Asian study illustrated that a multi-pollutant strategy can effectively reduce air quality management costs in the Pearl River Delta region of China [15]. Another European study contemplated the potential transition to a multi-pollutant air quality strategy in rural Denmark [16]. Furthermore, an Italian study provided governmental guidelines for the formulation of multi-pollutant strategies pertaining to air quality management [17].
Nevertheless, it is also important to acknowledge that the aforementioned multi-pollutant strategy studies often possess limited spatial scope, consider a limited number of air pollutants, or might not have included environmental justice (EJ) considerations. In the U.S., EJ issues have gathered broad attention, with a number of studies indicating that disparities in EJ concerns were linked to air pollution [18,19,20,21,22]. Moreover, the U.S. EPA has recommended incorporating EJ considerations into air quality management [23].
Multi-pollutant air quality issues are complex, and U.S. EPA has been seeking to develop a comprehensive screening tool for multi-pollutant air quality planning that is capable of integrating a suite of diverse data sources, including monitoring networks, emissions inventories, multimedia modeling, and risk/benefit-based decision framework systems [24,25]. Currently, U.S. EPA is developing various screening tools for identifying environmental concerns, such as EJScreen, which focuses on EJ matters [26,27], and AirToxScreen, which addresses air toxics exposures [28,29].
Previously, Wesson et al. indicated that there are multi-pollutant air quality problems in Detroit [30]. Subsequently, they compared two contrasting air quality control strategies: (1) the status-quo and (2) the multi-pollutant, risk-based (MPRB) approaches. Their study concluded that employing the MPRB approach could achieve superior reductions in PM2.5 and O3, yield twice the monetized benefits for PM2.5 and O3, and reduce non-cancer risk, leading to greater net benefits. Given that approximately ten years have passed since their study and considering the multi-pollutant nature of the Detroit area, we aim to investigate the current status of multi-pollutant issues in this region.
In this study, we integrated EJScreen and AirToxScreen data, PM2.5 and O3 concentration data, detailed emissions data, and monitoring data to conduct a multi-pollutant analysis with EJ considerations, which could be the first step in developing multi-pollutant strategies in specified areas. The objectives of this study are to (1) identify potential multi-pollutant areas in the continental U.S., (2) investigate monitoring status, as well as potential EJ and multi-pollutant issues in the Detroit metropolitan area (Detroit metro area), (3) analyze emissions information in the Detroit metro area, and (4) perform proximity analysis for points of interest (POIs) in the Detroit metro area.

2. Data and Methods

2.1. Data

In this study, the 2017 National Emissions Inventory (2017 NEI), modeling concentrations and design values (DVs) for O3 and PM2.5, air toxics cancer risk data from AirToxScreen, EJ/demographic indicators from EJScreen, as well as CEJST (Climate and Economic Justice Screening Tool version 1.0) disadvantaged areas, and monitoring data for O3, PM2.5, and air toxics, were included. Table 1 outlines the type, source, and time period of these datasets.

2.1.1. Emissions Data

The emissions data were sourced from the 2017 NEI. The 2017 NEI encompassed a comprehensive range of pollutants, including criteria air pollutants (CAPs), hazardous air pollutants (HAPs), and greenhouse gases (GHGs). The CAPs consist of pollutants such as nitrogen oxides (NOx), volatile organic compounds (VOCs), sulfur dioxide (SO2), and primary PM2.5. The HAPs encompass pollutants such as hydrochloric acid, benzene, and mercury. The GHGs comprise carbon dioxide (CO2), methane (CH4), nitrous oxide (N2O), and sulfur hexafluoride (SF6). In addition, the U.S. EPA classified five source categories in 2017 NEI: “point, nonpoint, onroad, nonroad, and events” [31]. Refer to Text S1 for more information.
In this study, we utilized the county-level and facility-level 2017 NEI from U.S. EPA. Moreover, the following additional processing was conducted on the 2017 NEI. Firstly, we created three pollutant categories and calculated their emissions, CO2e (carbon dioxide equivalent; further details in Table S1), “Gas & VOC (volatile organic compound) HAPs” (including 247 species; details in Table S2), and Heavy Metal HAPs (including 17 species; details in Table S3). Secondly, we categorized the 2017 NEI into 64 sectors, encompassing classifications such as electric utilities, coke ovens, and landfills, among others (details are provided in Table S4).

2.1.2. O3 and PM2.5 Modeled Concentration Data

The 2019 O3 and PM2.5 modeling concentration data at census tract-level were from the U.S. EPA’s OAQPS (Office of Air Quality Planning and Standards) public website. The Community Multiscale Air Quality (CMAQ) model was used by OAQPS to simulate the entire year of 2019 based on 2017 NEI and other data specific to the year 2019 [32]. The 2019 PM2.5 annual concentration represents the average of all 365 model days, while the 2019 8 h O3 seasonal concentration is derived from data between 1 May and 30 September. This 153-day period conforms to the ozone season across most parts of the U.S. [32]. To enhance simulation accuracy, a fusion model (downscaler model) was employed by OAQPS. The downscaler model can integrate monitoring and CMAQ data to generate new spatial predictions [33].
In our study, PM2.5 and O3 concentrations at county-level were calculated as population-weighted averages of all census tracts, within each respective county.

2.1.3. Air Toxics Cancer Risk Data

The air toxics cancer risk data were obtained from AirToxScreen, an advanced screening tool developed by the U.S. EPA to identify air toxics contributing most to population risk. The cancer risk (x in a million) represents the statistical probability of developing cancer over a lifetime (70 years) [34].
In this study, the cancer risk at census tract-level was the aggregation of risks posed by air toxics (including 72 species; details are provided in Table S5), and the county-level cancer risk was calculated from the maximum census tract-level data within each county.

2.1.4. EJ/Demographic Data

We incorporated the “Demographic Index” and two demographic indicators (“Low-Income”, and “People of Color”) obtained from EJScreen. EJScreen is a national environmental justice mapping and screening tool developed by the U.S. EPA, which aims to identify areas with elevated environmental burden or a high proportion of disadvantaged populations [35]. In EJScreen, “Low-Income” is defined as a household with an income less than or equal to twice the poverty level, while “People of Color” is defined as all individuals other than non-Hispanic whites. The “Demographic Index” is a combination of percent low-income and percent people of color, which is calculated by Equation (1).
Demographic Index = (% Low Income + % People of Color)/2
where “% Low Income” stands for the proportion of the low-income population, and “% People of Color” represents the proportion of people of color.

2.1.5. Other Data

O3 and PM2.5 DVs: The DVs data at county-level were from the U.S. EPA’s public website. The DV is a statistical measure that characterizes the air quality status of a specific location in relation to the National Ambient Air Quality Standards (NAAQS). The annual PM2.5 DV is the 3-year average annual mean concentration, while the daily PM2.5 DV is the 3-year average of 98th percentile concentration. The 8 h O3 DV is the 3-year average of the annual fourth highest daily maximum 8 h (MDA8) O3 concentration [36].
O3 and PM2.5 monitoring data: The data were downloaded from the SMAT-CE (Software for the Modeled Attainment Test—Community Edition) tool. The SMAT-CE is used to conduct modeled attainment tests for O3 and PM2.5 by U.S. EPA.
Air toxics monitoring data: The data were obtained from OAQPS’s public website, including 22 HAPs. In this study, we categorized these 22 HAPs into two groups: “Gas & VOC HAPs” (including 15 species; details are provided in Table S6) and Heavy Metal HAPs (including seven species; details are provided in Table S7).
CEJST disadvantaged areas: The data were from the CEJST. CEJST was developed by the Council on Environmental Quality to identify disadvantaged communities that will benefit from Biden’s “Justice40” initiative. The CEJST disadvantaged areas are defined on the website (https://screeningtool.geoplatform.gov/en/methodology, accessed on 2 June 2024).

2.2. Methods

The process of this study is illustrated in Figure 1. Initially, we identified the counties with multi-pollutant (i.e., PM2.5, O3, air toxics) and EJ issues based on DVs, concentrations/risks, and an EJ indicator (“Demographic Index”). Subsequently, a detailed analysis was performed within the Detroit metro area.
Firstly, we examined the monitoring trends and non-attainment issues concerning PM2.5 and O3 in the Detroit metro area. Secondly, we identified the multi-pollutant and EJ issues at census tract level in the Detroit metro area, based on concentrations/risks and socio-economic data. Thirdly, we identified the major emissions source categories, sectors, and point sources related to PM2.5, O3, and air toxics in the Detroit metro area. Finally, we conducted proximity analysis for the POIs identified in this study to investigate the potential environmental challenges, including multi-pollutant and EJ concerns, surrounding them.

2.2.1. Multi-Pollutant and EJ Issues National/Regional Mapping and Screening

We use the value or percentile of a specific indicator (DVs, concentrations, cancer risk, or EJ indicators) to screen areas with potential multi-pollutant or EJ issues. If a county’s or census tract’s designated indicator surpasses the predetermined value or percentile, it will be highlighted on the map using the corresponding color (e.g., red for PM2.5, blue for O3, and yellow for air toxics; refer to Figure S1 for more information). For example, if there are 100 counties and we set the 75th percentile as the threshold for PM2.5 concentration, then the top 25 counties with relatively high concentrations will be displayed on the map.

2.2.2. Proximity Analysis

The proximity analysis method serves to facilitate census tract-level multi-pollutant analysis including screening for EJ considerations. It allows the drawing of a concentric circle(s) for points of interest (such as a monitoring site and facilities). Then, the population-weighted averages and national-level percentiles of all census tracts within the circle(s) (only the census tracts that have more than 50% of their area in the circle(s) are included) will be calculated to generate a “summary plot”. The “summary plot” contains percentiles of PM2.5 concentration, O3 concentration, air toxics cancer risk, and demographic data. The circle’s radius is set to 3 km, since EJ issues and health impacts have been found within the 3 km distance in prior studies in the U.S. [37,38].

3. Case Study

3.1. National Level Analysis of Multi-Pollutant and EJ (Continental U.S.)

In this section, we aim to identify counties that potentially face PM2.5 and ozone issues (based on DVs or concentrations), elevated air toxics cancer risk, and EJ concerns over the continental U.S. (the regions and divisions of the continental U.S. in this study are presented in Figure S2).
The thresholds for PM2.5 annual, PM2.5 daily, and ozone 8 h DVs were set at 12 μg/m3, 35 μg/m3, and 70 ppb (part per billion) respectively, representing the regulatory standards in 2019 according to NAAQS. The example threshold for cancer risk was set to 35 in a million (Figure 2), the same as a similar study in the U.S. [39].
As shown in Figure 2, a total of 46 counties exceed the PM2.5 standard, primarily situated in the Western U.S., while only one county (Allegheny County, PA, USA) is in the Northeastern U.S. There are 115 counties exceeding the ozone standard, predominantly in CA and the Northeastern U.S. Moreover, a total of 201 counties that exceed the cancer risk threshold are mainly located in Pacific, Southern, Northeastern, and East North Central U.S., while the counties shaded in purple, brown, or green are areas where at least two air pollution concerns are noted. Notably, eight counties simultaneously exceed the PM2.5 and ozone standards, and the cancer risk threshold, which means “All Three”, with seven of them located in CA, and the remaining one being Jackson County, OR.
Moreover, the Wayne, Livingston and St. Clair County in the Detroit metro area are colored green, yellow, and blue respectively, indicating the potential multi-pollutant issues in these areas.
In Figure 3, we used the upper 75th percentile values for PM2.5 and ozone concentrations and air toxics cancer risk as example thresholds to identify counties across the U.S. that were experiencing relatively high exposures to these air pollutants, since the upper 75th percentile can provide an intuitive way to classify counties with elevated risk [39]. The counties that potentially experience elevated PM2.5 concentrations are primarily in the Southern and East North Central U.S., along with CA and PA.
A cluster of counties facing elevated air toxics cancer risk is primarily found in the Pacific and Southern U.S. In addition, the distribution of relatively high O3 concentrations is concentrated in the Southwestern U.S., as O3 is a regional pollutant.
The count of counties surpassing any two thresholds is 212 (toxics and ozone), 425 (toxics and PM2.5), and 204 (ozone and PM2.5), respectively, as shown in Figure 3. Moreover, a total of 98 counties meet all three thresholds, with the majority located in GA (30), NC (11), and CA (10).
Wayne, Livingston, Oakland, Macomb, and St. Clair counties in the Detroit metro area are colored brown, yellow, red, brown, and red, respectively. Based on the results of Figure 2 and Figure 3, we can easily identify multi-pollutant air quality issues based on the relative nature of concentrations/risks from air pollutant exposures and thereby focus efforts on reducing such exposures from those sources/emissions that are associated with these potentially harmful effects.
Moreover, based on the analysis of Figure 3, we added another EJ data (demographic index) layer with the 75th percentile threshold. The counties with a higher demographic index are primarily located in the Southern U.S., as well as NM, AZ, and CA. A total of 30 counties meet both “All Three” and EJ thresholds, primarily located in GA (11) and CA (10). These counties are likely to confront challenges related to PM2.5, O3, air toxics, and EJ issues concurrently. The overlay map of the demographic index can be found in Figure S1.

3.2. Air Quality, Air Toxics, and EJ Indicators over Detroit Metro Area

Ambient air monitoring data in 2019 in this area shows that the DVs of O3 (6 sites) and PM2.5 (11 sites) were 66–72 ppb and 7.6–12.1 μg/m3, respectively. The corresponding O3 DVs in St. Clair and Wayne counties exceeded the NAAQS. Most of the monitoring sites are located in Wayne County. The highest PM2.5 monitoring value was measured southwest of downtown Detroit. The historical trend at this site (site id: 261630015) shows annual PM2.5 concentrations declined from 17 (in 2002) to 11 (in 2009) μg/m3, followed by stabilization thereafter. The highest O3 monitoring value was found 8 km (site id: 261630019) northeast of Detroit, near a major airport, and the historical O3 concentrations were reduced from 85 (in 2002) to 70 (in 2020) ppb. These reductions in ambient air concentrations may be attributed to both national trends and local emission reductions. Based on EPA air quality trends in the Upper Midwest region, PM2.5 and O3 concentrations have decreased by 40% and 10% since 2000 [40]. If we look into detailed emissions in Wayne County, most precursor emissions of O3 and PM2.5 decreased significantly during 2008–2020 (Table 2).
The 2019 concentrations data provide clear spatial variations in the O3 seasonal average concentrations (39–43 ppb) and PM2.5 annual average concentrations (7–11 μg/m3). The highest concentration areas are predominantly located in the Detroit area. A similar pattern is observed for air toxics cancer risk (12 to 42 cases in a million), and there are a few census tracts near downtown Detroit that have elevated risks (details in Figure S9). The primary precursors for O3 are NOx and VOCs, while for PM2.5, they are NOx, SO2, and primary PM2.5. The major point sources of NOx, SO2, and primary PM2.5 emissions within the Detroit metro area are situated near the Detroit area (based on 2017 NEI), which may partially account for the spatial variations in O3 and PM2.5 concentrations (emissions will be discussed in detail in Section 3.3).
Similarly to EJScreen, percentiles were employed in this study to identify potential high-risk census tracts within the Detroit metro area. Census tracts were filtered using the 75th percentiles data for O3 and PM2.5 concentrations, as well as air toxic cancer risks, as described in Section 3.1. Figure 4 illustrates the census tracts associated with potential multi-pollutant issues. The potential high O3 concentrations (42.35–43.4 ppb) are located mostly in the northeast of the Detroit area, while the potential high PM2.5 concentrations (10.3–10.9 μg/m3) are located mostly in the northwest of the Detroit area. The census tracts exhibiting potential high air toxics cancer risk (24.04 to 42.10 cases in a million) are located in the southwest of the Detroit area. Notably, some census tracts near downtown Detroit exhibit potential issues with “All Three” pollutants.
Recent studies have suggested disparities in PM2.5, O3, and air toxics exposure across the U.S. [41,42,43,44,45,46]. Therefore, it is imperative to investigate environmental justice and socioeconomic indicators near the Detroit area. Figure S10 presents multi-pollutant issues, demographic index percentile, and CEJST disadvantaged census tracts, specifically zoomed in near the Detroit area. Notably, the maps reveal a clear overlap between census tracts with EJ issues and multi-pollutant issue census tracts near the Detroit area. Figure 5 also confirms that low-income and populations of color are exposed to higher O3 concentrations, PM2.5 concentrations, and air toxics cancer risk in the Detroit metro area. As shown in Figure 5, the demographic index was divided into five groups. The median of PM2.5 concentration increased from 9.51 to 10.45 μg/m3 across these groups, and a similar pattern was observed in the O3 concentrations (from 41.89 to 42.59 ppb) and cancer risk (from 20.38 to 23.12 cases in a million). We also performed statistics for the indicators of “% Low-Income” and “People of Color” individually, as shown in Figure S11. The results for these two indicators were similar to those depicted in Figure 5. These observations underscore the importance of conducting co-benefit emission reduction analyses in this region to mitigate the ambient O3, PM2.5, and air toxics concentrations, thereby minimizing potential health risks, particularly among the disadvantaged groups in this area.

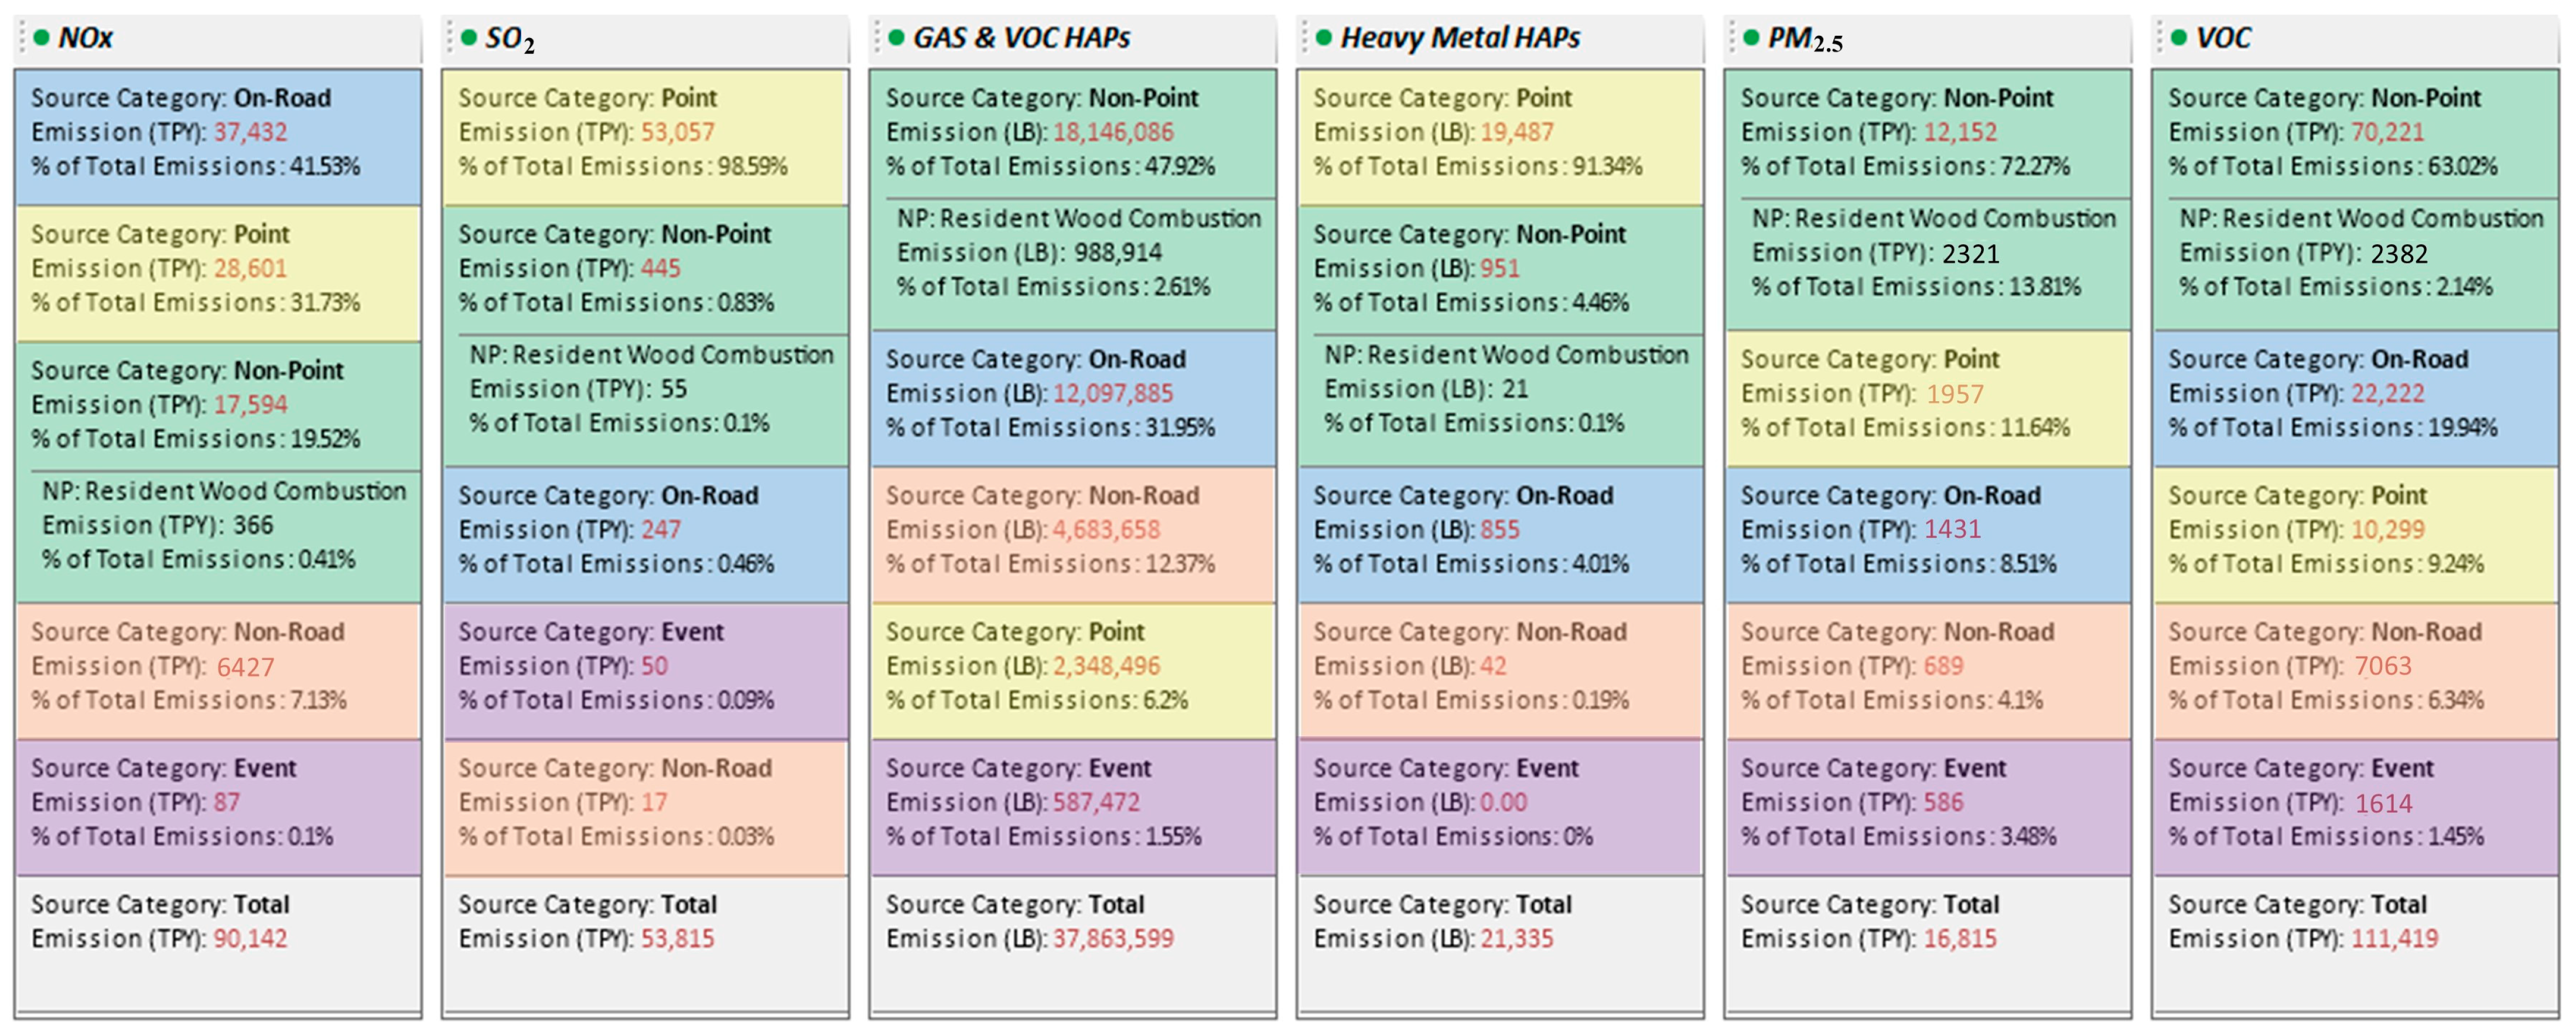
3.3. Emissions Data over Detroit Metro Area

In the Detroit metro area, potential multi-pollutant issue areas related to O3 and PM2.5 concentrations, and air toxics cancer risk are found near Detroit city. O3 and partial PM2.5 are secondary pollutants, so it is important to investigate precursors of O3 and PM2.5. O3 precursors are NOx and VOCs, and PM2.5 precursors are NOx, SO2, VOCs, and primary PM2.5. Air toxics consist of two groups of pollutants, gas/VOC HAPs and heavy metal HAPs. The gas/VOC HAPs are related to VOCs, while heavy metal HAPs are part of PM2.5. Figure 6 shows the corresponding emissions of these six pollutants by source category emissions in the Detroit metro area in 2017. The primary contributor to NOx emissions is the “On-road” source category, followed by the “Point” source category. Overall, the “Point” category dominates the SO2 and “Heavy Metal HAPs” emissions. “Nonpoint” is the major VOC and primary PM2.5 emissions category. Overall, “Nonpoint” and “Point” source categories have significant contributions to precursors’ emissions of O3, PM2.5, and air toxics in the Detroit metro area in 2017.
In 2017, in the Detroit metro area, the top five sectors (sorted by SO2 emissions) were electric utilities (first), coke ovens (second), iron and steel production (third), mineral processing (fourth), and air transportation (fifth), as shown in Figure 7. Notably, the electric utilities sector also ranked as the largest emitter of NOx, while the coke ovens and iron and steel production stood as the top-ranked sectors in terms of NOx, and PM2.5 emissions.
Given that “Point” source category represented the predominant source category of SO2 emissions in 2017 near the Detroit urban area, the major SO2 point source was a coke oven facility, followed by a power plant and then a steel production facility (Figure S12). These facilities were also top-ranked point sources of NOx, PM2.5, VOCs, or air toxics, while the power plant and the steel production facility were also listed as the top-ranked GHGs (in terms of CO2e) point sources in the Detroit metro area. Other studies have demonstrated the co-control benefits of emissions [47,48]. Therefore, it is important to consider the co-benefit emission reduction potential of these point sources, especially since the majority of census tracts near these point sources are identified as CEJST-disadvantaged census tracts.

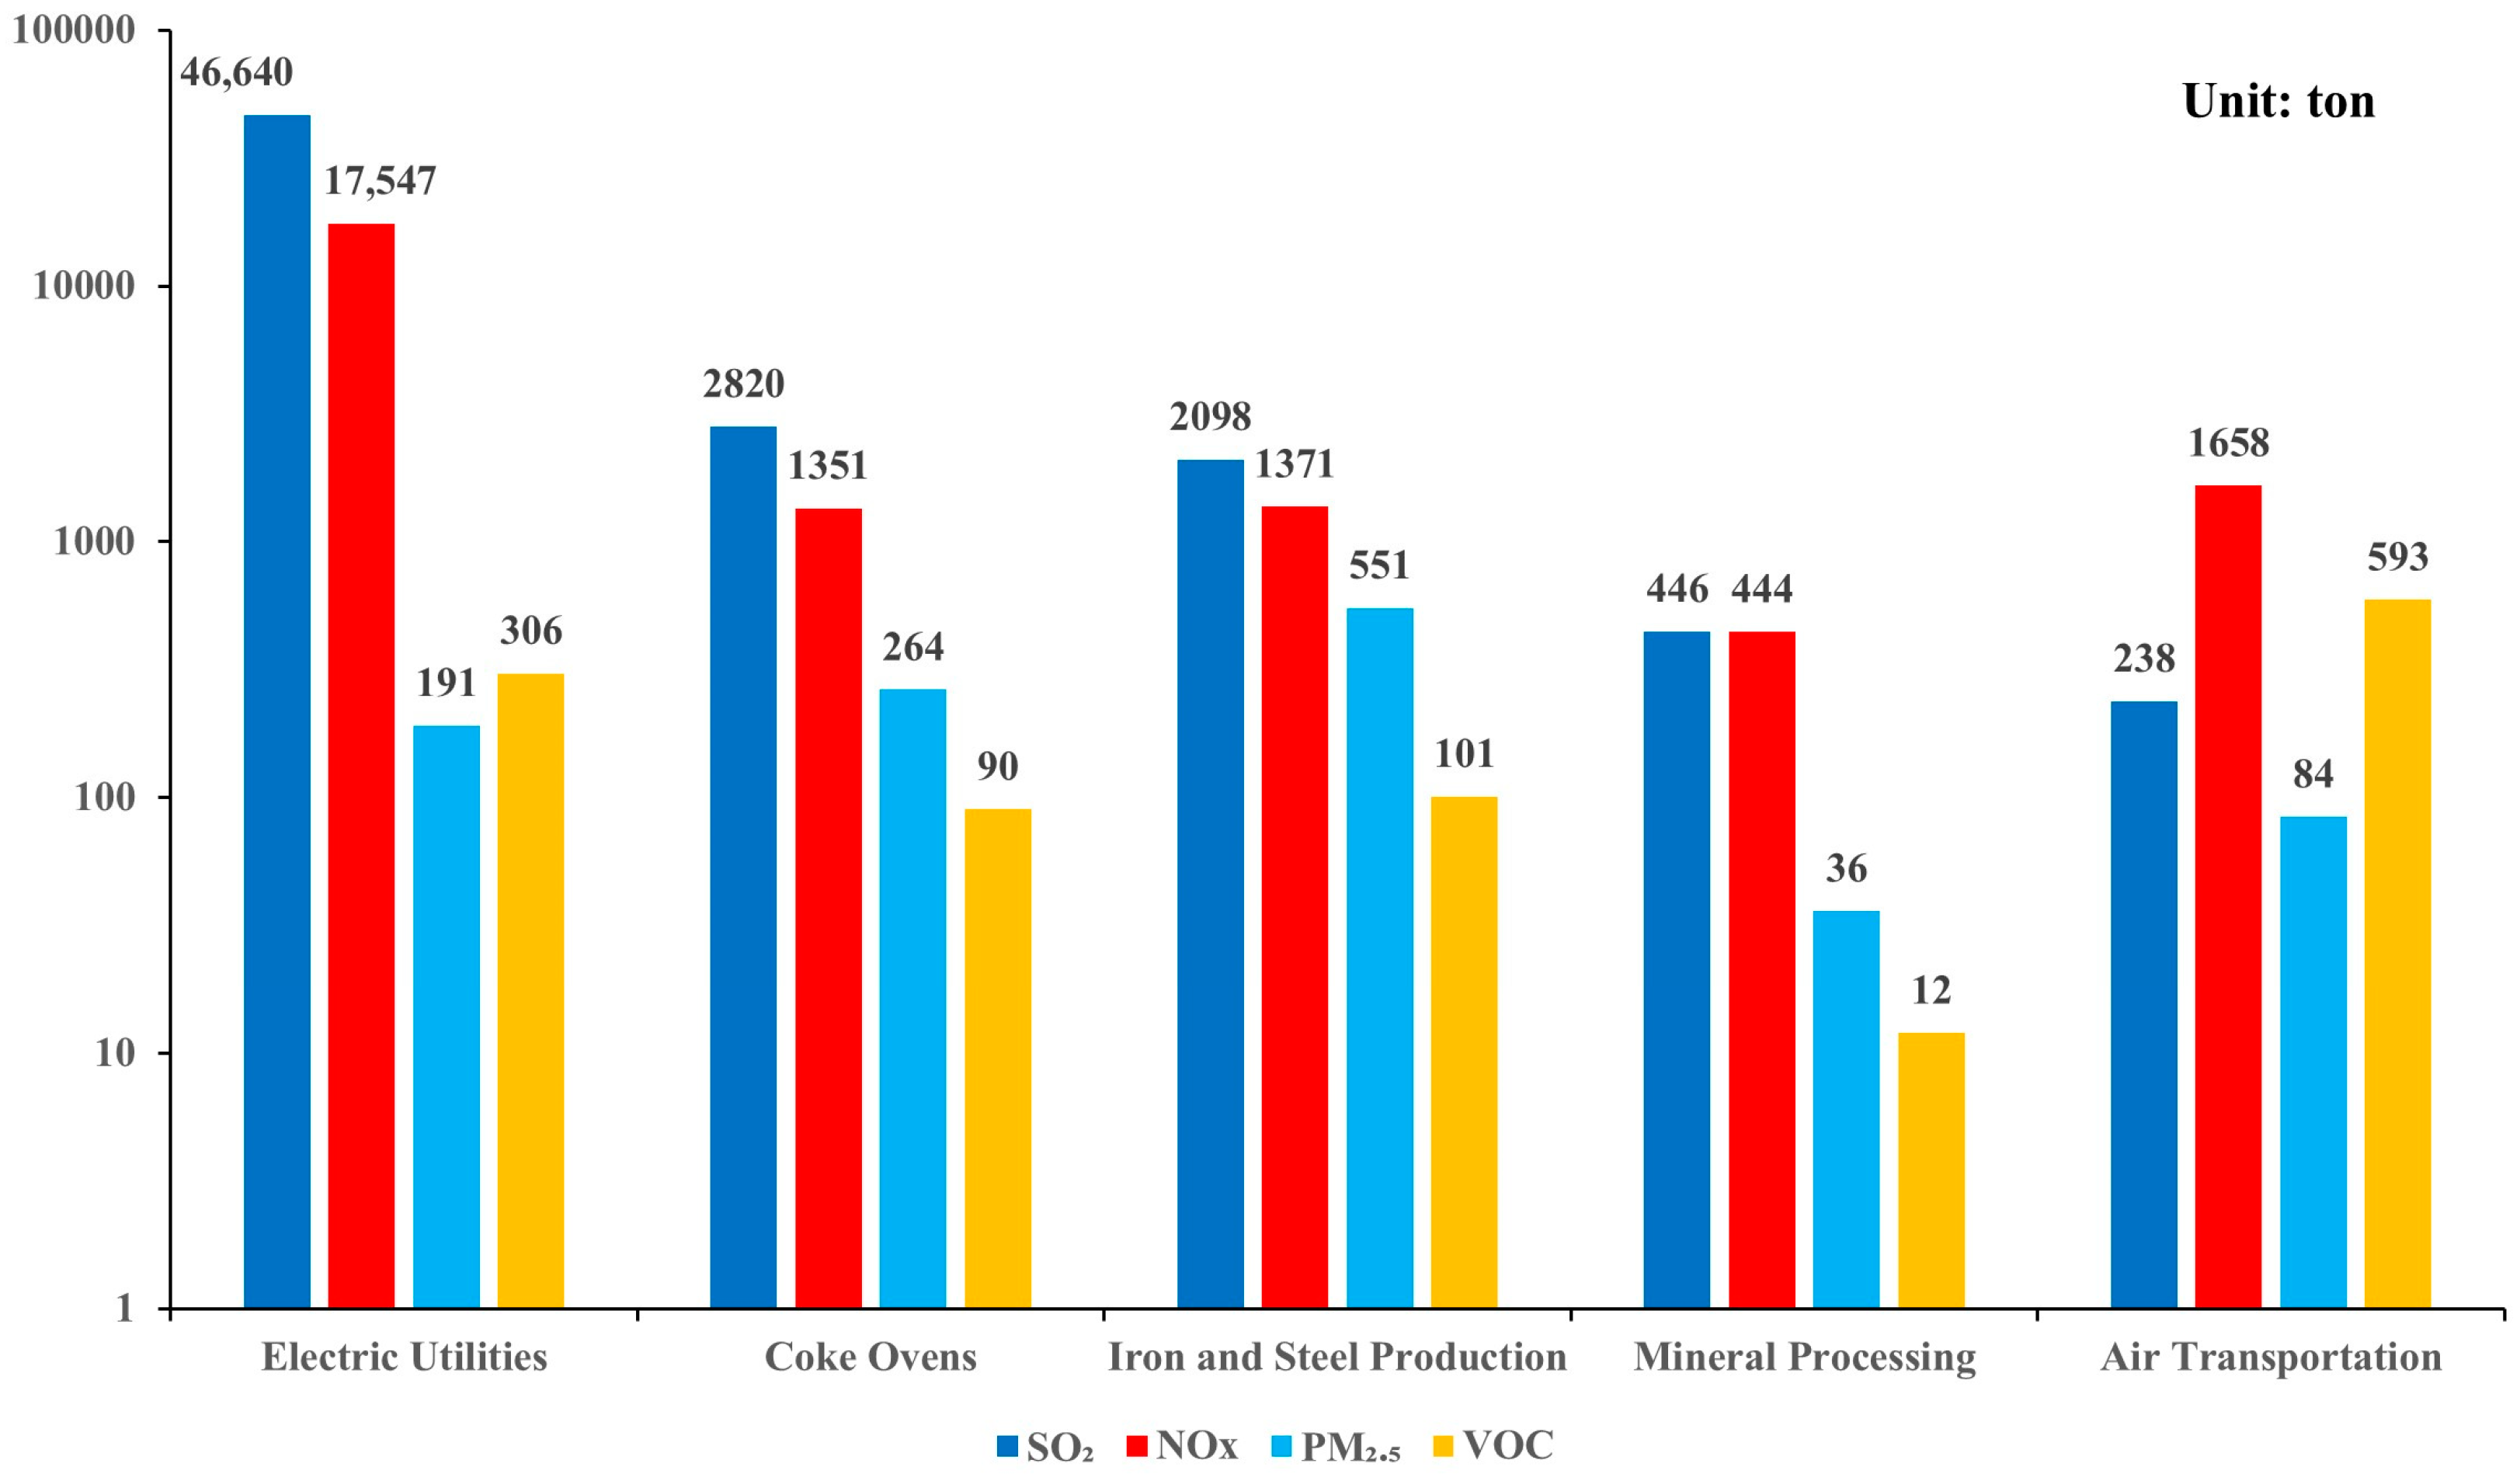
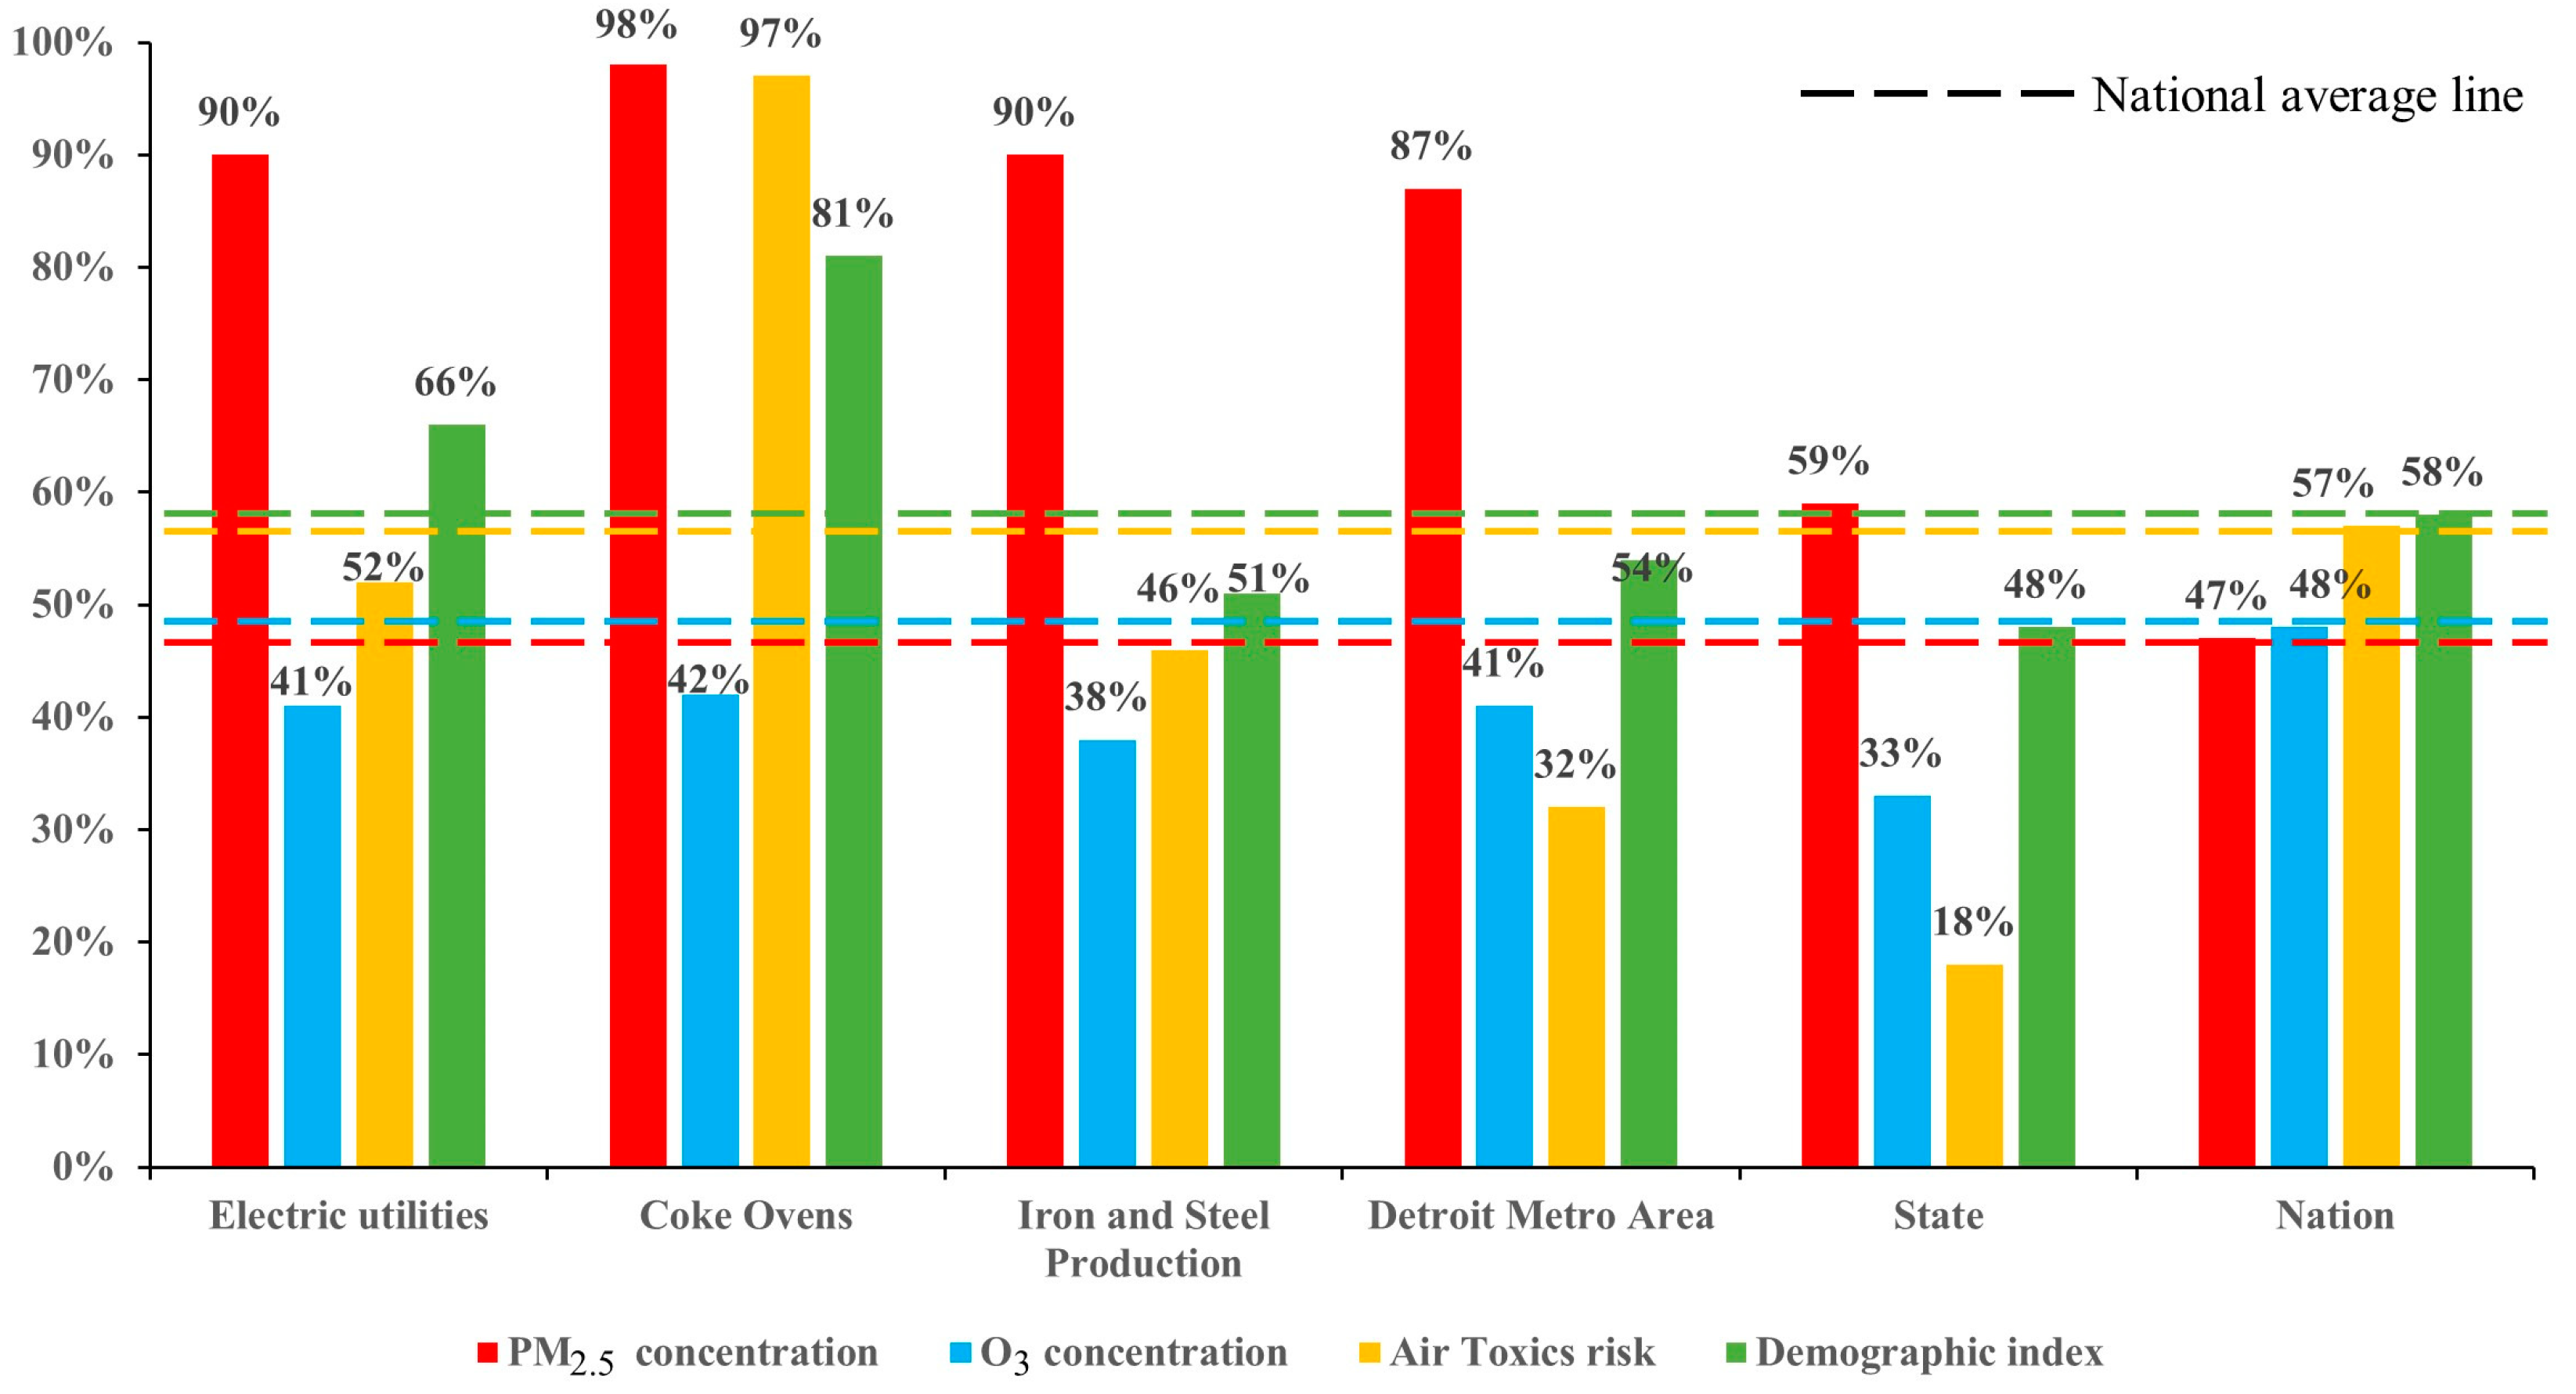
3.4. Proximity Analysis of POIs over Detroit Metro Area

In this section, we employed the proximity analysis method to explore the potential multi-pollutant and EJ issues near the POIs, namely monitoring sites and point sources, at census tract-level.
Given that areas with elevated monitoring values are more likely to pose higher environmental risks [49], the monitoring sites with the highest PM2.5, O3, and air toxics monitoring values are selected for proximity analysis. Figure 8 reveals that the percentiles of PM2.5 concentration and demographic index of these three sites are higher than the Detroit metro area, state, and national averages. Moreover, the percentiles of air toxics risk for the max PM2.5 and air toxics monitoring sites are 85% and 77% respectively, which exceed the national average of 57%, while the percentile of O3 concentration (51%) for the max O3 monitoring site is higher than the national average (48%). It is worth noting that there are not only high ambient air pollutant concentrations/risks but also EJ issues around the monitoring sites with the highest monitoring value in the Detroit metro area.
Based on the results in Section 3.3, the electric utilities, coke ovens, and iron and steel production sectors are significant emitters of pollutant precursors, such as SO2, NOx, primary PM2.5, and HAPs. Considering the strong correlation between emissions and air pollutant concentrations/risks [50] and the significant contributions of point sources to environmental injustice related to air pollution in the Detroit metro area [51], a proximity analysis of these three sectors was conducted, as depicted in Figure 9. The results indicate that the PM2.5 concentration percentiles of these sectors are higher than the averages for the Detroit metro area (87%), state (59%), and nation (47%), while the percentiles of air toxics risk and demographic index for these sectors are higher than the Detroit metro area or state averages, indicating an elevated risk and potential EJ concerns within a 3 km radius surrounding the point sources of these sectors in the Detroit metro area. Additionally, it should be noted that the percentile of air toxics risk for the coke ovens is remarkably high, at 96%, contrasting sharply with the Detroit metro area average of only 32%.

4. Conclusions

In this study, our primary objective was to develop a practical methodology to identify and analyze the nexus of multi-pollutant and EJ concerns over the continental U.S., with a specific focus on the Detroit metro area. To achieve this, we collected and integrated various types of data, including air quality data, such as PM2.5, O3, and air toxic concentrations/risks, detailed emissions data of facilities and counties, historical monitoring data, EJ/demographic data from EJScreen and CEJST, and air toxic data from AirToxScreen. Leveraging this extensive dataset, we conducted a multi-pollutant analysis taking EJ considerations into account.
Initially, we identified and investigated counties with potential multi-pollutant and EJ concerns in the continental U.S., suggesting that these counties could benefit from multi-pollutant control strategies. For instance, based on the outcomes depicted in Figure 2 and Figure 3, we pinpointed Los Angeles County in CA as facing challenges related to PM2.5, O3, and air toxics, thereby indicating its suitability for a multi-pollutant intervention approach. Moreover, Los Angeles County also has a relatively high “Demographic Index” (as shown in Figure S1). Other previous studies have demonstrated the inequalities related to air pollution in low-income communities and communities of color in this county [20,21]. Hence, the relevant air quality management agencies should pay more attention to EJ and multi-pollutant issues within Los Angeles County.
Subsequently, the case study in the Detroit metro area revealed that the areas with potential multi-pollutant issues in the Detroit metro area were predominantly clustered near downtown Detroit, where elevated levels of PM2.5 concentrations, O3 concentrations, and air toxics cancer risks were observed. Notably, most census tracts faced two or three types of pollutant issues in the Detroit city area, potentially because PM2.5, O3, and air toxics have common precursors (as described in Section 3.3). By overlaying maps, we found there may be EJ concerns in the Detroit metro area, where the census tracts with multi-pollutant issues overlapped with disadvantaged communities. Our analysis further unveiled disparities in PM2.5, O3, and air toxics exposure across the Detroit metro area (Figure 5), emphasizing that populations with a higher “Demographic Index” faced heightened environmental risks. These findings underscore the presence of air pollution inequalities affecting low-income and populations of color, aligning with prior studies in the Detroit metro area [52].
Subsequently, we analyzed the emissions related to PM2.5, O3, and air toxics in the Detroit metro area. The results showed that the major emissions categories were “Nonpoint” and “Point”, while the major emissions sectors were “Electric Utilities”, “Coke Ovens”, and “Iron and Steel Production” in the Detroit metro area. Consequently, these emission categories and sectors necessitate targeted focus when devising multi-pollutant strategies within this metropolitan region. Notably, the scrutiny of major point sources suggested the potential for the synergistic control of air pollutants (e.g., PM2.5, O3, and air toxics), alongside greenhouse gases. Finally, we conducted proximity analyses for the selected POIs in the Detroit metro area. The results showed that the high monitoring sites (PM2.5, O3, and air toxics) and major emissions sectors (electric utilities, coke ovens, and iron and steel production) in the Detroit metro area were likely to have higher multi-pollutant concentrations/risks and potential EJ issues within a distance (e.g., 3 km) from them. The results highlighted that when developing or implementing multi-pollutant strategies, it is essential to consider not only the entire region but also the POIs that may have environmental issues around them. Overall, our results manifested the necessity of implementing co-benefit emissions reduction strategies to mitigate public health risks, especially among disadvantaged communities. These findings highlighted the importance of conducting multi-pollutant analyses for urban areas such as Detroit.
The highlights of our study encompass the following: (1) identifying areas with multi-pollutant issues in the continental U.S. (county level) and the Detroit metro area (census tract level); (2) revealing the EJ issues related to multi-pollutant (PM2.5, O3, and air toxics) air quality in the Detroit metro area; (3) identifying the multi-pollutant and EJ issues around the maximum monitoring sites and top-ranked emission sectors. The methodological framework established in this study not only holds relevance for the U.S. context but also offers a reference for conducting multi-pollutant analyses in other countries and regions worldwide. Furthermore, our study provides valuable insights for policymakers and environmental stakeholders to prioritize interventions and develop targeted strategies to address the multi-pollutant issues and EJ concerns in specific locales.
However, there are still certain limitations in this study. For example, the emissions data may lag a couple of years behind the current year, so the most recent emissions patterns may have changed in the U.S. Additionally, uncertainties might arise from the predictions of air quality concentrations from model simulations (e.g., CMAQ) as well as the health risk estimates sourced from AirToxScreen.
In our view, future studies could be expanded to include the following efforts: (1) identifying the plausible causes of multi-pollutant issues in the Detroit metro area and other areas of interest, and exploring viable multi-pollutant co-benefit strategies; (2) integrating additional social-economic/demographic indicators in the EJ analysis of multi-pollutants, such as the proportion of children, elderly individuals, and linguistically isolated populations, given that inequalities have been observed among these vulnerable groups in the U.S.; (3) incorporating climate change indicators in the multi-pollutant analysis, as climate change can not only pose a direct threat to human health [53,54] but also exacerbate air pollution [55]; (4) developing a multi-pollutant air quality planning tool to rapidly identify the areas with multi-pollutant and other environmental issues and helping the air quality management communities develop effective multi-pollutant control strategies.

Supplementary Materials

The following supporting information can be downloaded at: https://www.mdpi.com/article/10.3390/su16166931/s1, Figure S1: The nexus of PM2.5 and ozone concentrations, air toxics cancer risk, and EJ indicator. The results are screened by 75th percentiles based on the continental U.S; Figure S2: Regions and divisions of the continental U.S. (U.S. Census Bureau 2018); Figure S3: The counties with PM2.5 issues (based on DV); Figure S4: The counties with O3 issues (based on DV); Figure S5: The counties with air toxics issues (based on the value of cancer risk); Figure S6: The counties with PM2.5 issues (based on annual average concentration); Figure S7: The counties with O3 issues (based on seasonal average concentration); Figure S8: The counties with air toxics issues (based on the percentile of cancer risk); Figure S9: The spatial distribution of O3 seasonal average concentration (a), PM2.5 annual average concentration (b), and air toxics cancer risk (c) in the Detroit metro area; Figure S10: The overlap of multi-pollutant issues (a), demographic index (b), and CEJST disadvantaged areas (c) near the Detroit area; Figure S11: PM2.5 annual, O3 seasonal modeling concentrations, and air toxics cancer risk, grouped by EJScreen “Low-Income” (a-c) and “People of color” (d-e) group in the Detroit metro area. The specific values for the box plot can be found in Table S8; Figure S12: Map of top 20 SO2 point sources in Detroit metro area. The facilities are ranked by the emissions amounts (right); Table S1: Global warming potential (GWP); Table S2: “Gas & VOC HAPs” species of emissions data; Table S3: Heavy metal HAP species of emissions data; Table S4: Emissions sectors; Table S5: Air toxics species of cancer risk; Table S6: “Gas and VOC HAPs” species in the monitoring data; Table S7: Heavy metal HAP species in the monitoring data; Table S8: The specific values of the box plot for Figure 4 and Figure S11; Text S1: Source categories. Reference [56] is cited in Supplementary Materials.

Author Contributions

Conceptualization, H.Y. and J.-C.J.; data curation, H.Y. and S.L.; formal analysis, J.-C.J., S.L., S.W., J.X. and B.Z.; funding acquisition, Y.Z.; methodology, H.Y., J.-C.J. and S.L.; project administration, Y.Z.; resources, Y.Z.; software, H.Y. and S.L.; supervision, J.-C.J., Y.Z. and S.W.; visualization, H.Y.; writing—original draft, H.Y.; writing—review and editing, J.-C.J., S.L. and Y.Z. All authors have read and agreed to the published version of the manuscript.

Funding

This research was funded by the National Key Research and Development Program of China (No. 2023YFE0121300) and the High-End Foreign Expert Recruitment Program (No. G2023163014L).

Institutional Review Board Statement

Not applicable.

Informed Consent Statement

Not applicable.

Data Availability Statement

The data are contained within the article. There are no other datasets.

Acknowledgments

The authors sincerely acknowledged Jiaoyan Huang for his unwavering support in this research work and paper. His professional guidance has been crucial to our work. We deeply appreciate his dedication and valuable contributions.

Conflicts of Interest

The authors declare no conflicts of interest.

References

  1. National Research Council. Air Quality Management in the United States; National Academies Press: Washington, DC, USA, 2004. [Google Scholar]
  2. Luben, T.J.; Buckley, B.J.; Patel, M.M.; Stevens, T.; Coffman, E.; Rappazzo, K.M.; Owens, E.O.; Hines, E.P.; Moore, D.; Painter, K.; et al. A Cross-Disciplinary Evaluation of Evidence for Multipollutant Effects on Cardiovascular Disease. Environ. Res. 2018, 161, 144–152. [Google Scholar] [CrossRef] [PubMed]
  3. Sakti, A.D.; Anggraini, T.S.; Ihsan, K.T.N.; Misra, P.; Trang, N.T.Q.; Pradhan, B.; Wenten, I.G.; Hadi, P.O.; Wikantika, K. Multi-Air Pollution Risk Assessment in Southeast Asia Region Using Integrated Remote Sensing and Socio-Economic Data Products. Sci. Total Environ. 2023, 854, 158825. [Google Scholar] [CrossRef] [PubMed]
  4. Jonidi Jafari, A.; Charkhloo, E.; Pasalari, H. Urban Air Pollution Control Policies and Strategies: A Systematic Review. J. Environ. Health Sci. Eng. 2021, 19, 1911–1940. [Google Scholar] [CrossRef] [PubMed]
  5. Macpherson, A.J.; Simon, H.; Langdon, R.; Misenheimer, D. A Mixed Integer Programming Model for National Ambient Air Quality Standards (NAAQS) Attainment Strategy Analysis. Environ. Model. Softw. 2017, 91, 13–27. [Google Scholar] [CrossRef]
  6. Wang, Z.; Zhao, H.; Xu, H.; Li, J.; Ma, T.; Zhang, L.; Feng, Y.; Shi, G. Strategies for the Coordinated Control of Particulate Matter and Carbon Dioxide under Multiple Combined Pollution Conditions. Sci. Total Environ. 2023, 899, 165679. [Google Scholar] [CrossRef]
  7. Tan, X.; Han, L.; Zhang, X.; Zhou, W.; Li, W.; Qian, Y. A Review of Current Air Quality Indexes and Improvements under the Multi-Contaminant Air Pollution Exposure. J. Environ. Manag. 2021, 279, 111681. [Google Scholar] [CrossRef] [PubMed]
  8. Tavallali, P.; Gharibi, H.; Singhal, M.; Schweizer, D.; Cisneros, R. A Multi-Pollutant Model: A Method Suitable for Studying Complex Relationships in Environmental Epidemiology. Air Qual. Atmos. Health 2020, 13, 645–657. [Google Scholar] [CrossRef]
  9. Yu, L.; Liu, W.; Wang, X.; Ye, Z.; Tan, Q.; Qiu, W.; Nie, X.; Li, M.; Wang, B.; Chen, W. A Review of Practical Statistical Methods Used in Epidemiological Studies to Estimate the Health Effects of Multi-Pollutant Mixture. Environ. Pollut. 2022, 306, 119356. [Google Scholar] [CrossRef] [PubMed]
  10. U.S. EPA. U.S. EPA—South Carolina Collaboration to Develop a Multi-Pollutant, Risk-Based Air Quality Management Strategy for the Upstate South Carolina Region. 2016. Available online: https://www.epa.gov/sites/default/files/2016-05/documents/usepa-south_carolina_final_report_may_26_16_2.pdf (accessed on 2 June 2024).
  11. Hidy, G.M.; Pennell, W.T. Multipollutant Air Quality Management. J. Air Waste Manag. Assoc. 2010, 60, 645–674. [Google Scholar] [CrossRef]
  12. Fann, N.; Roman, H.A.; Fulcher, C.M.; Gentile, M.A.; Hubbell, B.J.; Wesson, K.; Levy, J.I. Maximizing Health Benefits and Minimizing Inequality: Incorporating Local-Scale Data in the Design and Evaluation of Air Quality Policies. Risk Anal. 2011, 31, 908–922. [Google Scholar] [CrossRef]
  13. Bay Area Air Quality Management District (BAAQMD). Clean Air Plan 2017. 2017. Available online: https://www.baaqmd.gov/~/media/files/planning-and-research/plans/2017-clean-air-plan/attachment-a_-proposed-final-cap-vol-1-pdf (accessed on 2 June 2024).
  14. Louisville Metropolitan Air Pollution Control District (APCD). Multipollutant Stakeholder Group Final Report August 2020. 2020. Available online: https://louisvilleky.gov/air-pollution-control-district/document/finalmpsgreportpdf (accessed on 2 June 2024).
  15. Huang, J.; Zhu, Y.; Kelly, J.T.; Jang, C.; Wang, S.; Xing, J.; Chiang, P.-C.; Fan, S.; Zhao, X.; Yu, L. Large-Scale Optimization of Multi-Pollutant Control Strategies in the Pearl River Delta Region of China Using a Genetic Algorithm in Machine Learning. Sci. Total Environ. 2020, 722, 137701. [Google Scholar] [CrossRef]
  16. Cantuaria, M.L.; Brandt, J.; Lofstrom, P.; Blanes-Vidal, V. Public Perception of Rural Environmental Quality: Moving towards a Multi-Pollutant Approach. Atmos. Environ. 2017, 170, 234–244. [Google Scholar] [CrossRef]
  17. Sofia, D.; Gioiella, F.; Lotrecchiano, N.; Giuliano, A. Mitigation Strategies for Reducing Air Pollution. Environ. Sci. Pollut. Res. 2020, 27, 19226–19235. [Google Scholar] [CrossRef]
  18. Illgner, T.; Lad, N. Data to Improve Air Quality Environmental Justice Outcomes in South Chicago. Front. Public Health 2022, 10, 977948. [Google Scholar] [CrossRef]
  19. Zalzal, J.; Hatzopoulou, M. Fifteen Years of Community Exposure to Heavy-Duty Emissions: Capturing Disparities over Space and Time. Environ. Sci. Technol. 2022, 56, 16621–16632. [Google Scholar] [CrossRef]
  20. Su, J.G.; Morello-Frosch, R.; Jesdale, B.M.; Kyle, A.D.; Shamasunder, B.; Jerrett, M. An Index for Assessing Demographic Inequalities in Cumulative Environmental Hazards with Application to Los Angeles, California. Environ. Sci. Technol. 2009, 43, 7626–7634. [Google Scholar] [CrossRef]
  21. Su, J.G.; Jerrett, M.; Morello-Frosch, R.; Jesdale, B.M.; Kyle, A.D. Inequalities in Cumulative Environmental Burdens among Three Urbanized Counties in California. Environ. Int. 2012, 40, 79–87. [Google Scholar] [CrossRef]
  22. Wen, Y.; Zhang, S.; Wang, Y.; Yang, J.; He, L.; Wu, Y.; Hao, J. Dynamic Traffic Data in Machine-Learning Air Quality Mapping Improves Environmental Justice Assessment. Environ. Sci. Technol. 2024, 58, 3118–3128. [Google Scholar] [CrossRef]
  23. Zhao, J.; Gladson, L.; Cromar, K. A Novel Environmental Justice Indicator for Managing Local Air Pollution. Int. J. Environ. Res. Public Health 2018, 15, 1260. [Google Scholar] [CrossRef] [PubMed]
  24. Scheffe, R.; Hubbell, B.; Fox, T.; Rao, V.; Pennell, W. The Rationale for a Multipollutant, Multimedia Air Quality Management Framework; AWMA: Pittsburgh, PA, USA, 2007; pp. 14–20. [Google Scholar]
  25. U.S. EPA. The Multi-Pollutant Report Technical Concept and Examples. 2008. Available online: https://nepis.epa.gov/Exe/ZyPDF.cgi/P100ZZDJ.PDF?Dockey=P100ZZDJ.PDF (accessed on 2 June 2024).
  26. Greenberg, M.R. Ports and Environmental Justice in the United States: An Exploratory Statistical Analysis. Risk Anal. 2021, 41, 2112–2126. [Google Scholar] [CrossRef] [PubMed]
  27. U.S. EPA. EJScreen: Environmental Justice Screening and Mapping Tool. Available online: https://www.epa.gov/ejscreen (accessed on 2 June 2024).
  28. Mathieu, M.E.; Gray, J.; Richmond-Bryant, J. Spatial Associations of Long-Term Exposure to Diesel Particulate Matter with Seasonal and Annual Mortality Due to COVID-19 in the Contiguous United States. BMC Public Health 2023, 23, 1–15. [Google Scholar] [CrossRef] [PubMed]
  29. U.S. EPA. Air Toxics Screening Assessment. Available online: https://www.epa.gov/AirToxScreen (accessed on 2 June 2024).
  30. Wesson, K.; Fann, N.; Morris, M.; Fox, T.; Hubbell, B. A Multi–Pollutant, Risk–Based Approach to Air Quality Management: Case Study for Detroit. Atmos. Pollut. Res. 2010, 1, 296–304. [Google Scholar] [CrossRef]
  31. U.S. EPA. 2017 National Emissions Inventory: January 2021 Updated Release, Technical Support Document. 2021. Available online: https://www.epa.gov/sites/default/files/2021-02/documents/nei2017_tsd_full_jan2021.pdf (accessed on 2 June 2024).
  32. U.S. EPA. Bayesian Space-Time Downscaling Fusion Model (Downscaler)—Derived Estimates of Air Quality for 2019. 2019. Available online: https://ofmpub.epa.gov/rsig/rsigserver?data/FAQSD/docs/2019_DS_Annual_Report.pdf (accessed on 2 June 2024).
  33. Berrocal, V.J.; Gelfand, A.E.; Holland, D.M. Space-Time Data Fusion Under Error in Computer Model Output: An Application to Modeling Air Quality. Biometrics 2012, 68, 837–848. [Google Scholar] [CrossRef] [PubMed]
  34. U.S. EPA. Technical Support Document EPA’s Air Toxics Screening Assessment 2018 AirToxScreen TSD. 2018. Available online: https://www.epa.gov/sites/default/files/2013-09/documents/cancer_guidelines_final_3-25-05.pdf (accessed on 2 June 2024).
  35. U.S. EPA. EJScreen Technical Documentation for Version 2.2. 2023. Available online: https://www.epa.gov/system/files/documents/2023-06/ejscreen-tech-doc-version-2-2.pdf (accessed on 2 June 2024).
  36. U.S. EPA. Air Quality Design Values. Available online: https://www.epa.gov/air-trends/air-quality-design-values (accessed on 2 June 2024).
  37. Mohai, P.; Saha, R. Which Came First, People or Pollution? Assessing the Disparate Siting and Post-Siting Demographic Change Hypotheses of Environmental Injustice. Environ. Res. Lett. 2015, 10, 115008. [Google Scholar] [CrossRef]
  38. Mohai, P.; Saha, R. Racial Inequality in the Distribution of Hazardous Waste: A National-Level Reassessment. Soc. Probl. 2007, 54, 343–370. [Google Scholar] [CrossRef]
  39. Fann, N.; Wesson, K.; Hubbell, B. Characterizing the Confluence of Air Pollution Risks in the United States. Air Qual. Atmos. Health 2016, 9, 293–301. [Google Scholar] [CrossRef]
  40. U.S. EPA. National Air Quality: Status and Trends of Key Air Pollutants. Available online: https://www.epa.gov/air-trends (accessed on 2 June 2024).
  41. Ash, M.; Boyce, J.K.; Chang, G.; Scharber, H. Is Environmental Justice Good for White Folks? Industrial Air Toxics Exposure in Urban America. Soc. Sci. Quart. 2013, 94, 616–636. [Google Scholar] [CrossRef]
  42. Collins, T.W.; Nadybal, S.M.; Grineski, S.E. A Comparative Approach for Environmental Justice Analysis: Explaining Divergent Societal Distributions of Particulate Matter and Ozone Pollution across U.S. Neighborhoods. Ann. Am. Assoc. Geogr. 2022, 112, 522–541. [Google Scholar] [CrossRef]
  43. Colmer, J.; Hardman, I.; Shimshack, J.; Voorheis, J. Disparities in PM2.5 Air Pollution in the United States. Science 2020, 369, 575–578. [Google Scholar] [CrossRef]
  44. Driver, A.; Mehdizadeh, C.; Bara-Garcia, S.; Bodenreider, C.; Lewis, J.; Wilson, S. Utilization of the Maryland Environmental Justice Screening Tool: A Bladensburg, Maryland Case Study. Int. J. Environ. Res. Public Health 2019, 16, 348. [Google Scholar] [CrossRef]
  45. McFarlin, E.; Bargagli-Stoffi, F.J.; Castro, E.; Schwartz, J.; Dominici, F.; Amini, H. Air Quality Disparities Mapper: An Open-Source Web Application for Environmental Justice. Environ. Model. Softw. 2024, 172, 105881. [Google Scholar] [CrossRef]
  46. Zirogiannis, N.; Byrne, A.; Hollingsworth, A.J.; Konisky, D.M. Polluting under the Radar: Emissions, Inequality, and Concrete Batch Plants in Houston. Environ. Sci. Technol. 2023, 57, 11410–11419. [Google Scholar] [CrossRef] [PubMed]
  47. Cheng, J.; Tong, D.; Zhang, Q.; Liu, Y.; Lei, Y.; Yan, G.; Yan, L.; Yu, S.; Cui, R.Y.; Clarke, L.; et al. Pathways of China’s PM2.5 Air Quality 2015–2060 in the Context of Carbon Neutrality. Natl. Sci. Rev. 2021, 8, nwab078. [Google Scholar] [CrossRef] [PubMed]
  48. Cheng, J.; Tong, D.; Liu, Y.; Geng, G.; Davis, S.J.; He, K.; Zhang, Q. A Synergistic Approach to Air Pollution Control and Carbon Neutrality in China Can Avoid Millions of Premature Deaths Annually by 2060. One Earth 2023, 6, 978–989. [Google Scholar] [CrossRef]
  49. Zhou, W.; Chen, C.; Lei, L.; Fu, P.; Sun, Y. Temporal Variations and Spatial Distributions of Gaseous and Particulate Air Pollutants and Their Health Risks during 2015–2019 in China. Environ. Pollut. 2021, 272, 116031. [Google Scholar] [CrossRef] [PubMed]
  50. Xing, J.; Zheng, S.; Ding, D.; Kelly, J.T.; Wang, S.; Li, S.; Qin, T.; Ma, M.; Dong, Z.; Jang, C.; et al. Deep Learning for Prediction of the Air Quality Response to Emission Changes. Environ. Sci. Technol. 2020, 54, 8589–8600. [Google Scholar] [CrossRef] [PubMed]
  51. Martenies, S.; Milando, C.; Williams, G.; Batterman, S. Disease and Health Inequalities Attributable to Air Pollutant Exposure in Detroit, Michigan. Int. J. Environ. Res. Public Health 2017, 14, 1243. [Google Scholar] [CrossRef] [PubMed]
  52. Schulz, A.J.; Mentz, G.B.; Sampson, N.; Ward, M.; Anderson, R.; De Majo, R.; Israel, B.A.; Lewis, T.C.; Wilkins, D. Race and the Distribution of Social and Physical Environmental Risk: A Case Example from the Detroit Metropolitan Area. Du Bois Rev. Soc. Sci. Res. Race 2016, 13, 285–304. [Google Scholar] [CrossRef]
  53. Keswani, A.; Akselrod, H.; Anenberg, S.C. Health and Clinical Impacts of Air Pollution and Linkages with Climate Change. NEJM Evid. 2022, 1, EVIDra2200068. [Google Scholar] [CrossRef]
  54. Tran, H.M.; Tsai, F.-J.; Lee, Y.-L.; Chang, J.-H.; Chang, L.-T.; Chang, T.-Y.; Chung, K.F.; Kuo, H.-P.; Lee, K.-Y.; Chuang, K.-J.; et al. The Impact of Air Pollution on Respiratory Diseases in an Era of Climate Change: A Review of the Current Evidence. Sci. Total Environ. 2023, 898, 166340. [Google Scholar] [CrossRef]
  55. Smirnova, N.; Shaver, A.C.; Mehta, A.J.; Philipsborn, R.; Scovronick, N. Climate Change, Air Quality, and Pulmonary Health Disparities. Clin. Chest Med. 2023, 44, 489–499. [Google Scholar] [CrossRef] [PubMed]
  56. Forster, P.; Ramaswamy, V.; Artaxo, P.; Berntsen, T.; Betts, R.; Fahey, D.W.; Haywood, J.; Lean, J.; Lowe, D.C.; Myhre, G.; et al. Changes in Atmospheric Constituents and in Radiative Forcing. In Climate Change 2007: The Physical Science Basis; Contribution of Working Group I to the Fourth Assessment Report of the Intergovernmental Panel on Climate Change; Solomon, S., Qin, D., Manning, M., Chen, Z., Marquis, M., Averyt, K.B., Tignor, M., Miller, H.L., Eds.; Cambridge University Press: Cambridge, UK; New York, NY, USA, 2007; p. 212. [Google Scholar]
Figure 1. The flowchart of this study.
Sustainability 16 06931 g001
Figure 2. The nexus of PM2.5 and ozone DVs and air toxics cancer risk. “All Three” (black color) represents “Toxics & PM2.5 & Ozone”. Additional figures for each single pollutant are provided in Supplementary Materials (Figures S3–S5).
Sustainability 16 06931 g002
Figure 3. The nexus of PM2.5 and ozone concentrations and air toxics cancer risk. The results are screened by 75th percentiles based on the continental U.S. Additional figures for each single pollutant are provided in Supplementary Materials (Figures S6–S8).
Sustainability 16 06931 g003
Figure 4. The census tracts have potential multi-pollutant issues related to PM2.5 and ozone concentrations, as well as air toxics cancer risk in the Detroit metro area. The results are screened by 75th percentiles based on the Detroit metro area.
Sustainability 16 06931 g004
Figure 5. PM2.5 annual (a), O3 seasonal (b) modeling concentrations, and air toxics cancer risk (c), grouped by EJScreen demographic index group in the Detroit metro area. A higher EJScreen demographic index indicates a more low-income and people of color population. The specific values for the box plot can be found in Table S8.
Sustainability 16 06931 g005
Figure 6. Summary of NOx, SO2, gas/VOC HAPs, heavy metal HAPs, primary PM2.5, and VOC emissions in the Detroit metro area by source category emissions in 2017. The same source category of different pollutants is marked with the same color. TPY—ton per year; LB—pound.
Sustainability 16 06931 g006
Figure 7. Summary of SO2, NOx, PM2.5, and VOC emissions in the Detroit metro area by source sector emissions in 2017. The top five sectors are listed (sorted by SO2 emissions amounts).
Sustainability 16 06931 g007
Figure 8. The results of proximity analysis for monitoring sites, including the max PM2.5 monitoring site, the max O3 monitoring site, and the max air toxics monitoring site in the Detroit metro area. The monitoring sites of PM2.5, O3, and air toxics with the max monitoring value in 2019 were named as follows: max PM2.5 monitoring site (site id: 261630015), max O3 monitoring site (site id: 261630019), and max air toxics monitoring site (site id: 261630033), respectively. Notably, the max air toxics monitoring site exhibits the highest monitoring values for both “Gas and VOC HAPs” and “Heavy Metal HAPs”. The Detroit metro area, the state (MI), and the nation denote the percentiles of their respective average levels.
Sustainability 16 06931 g008
Figure 9. The results of proximity analysis for sectors, including electric utilities (16 facilities), coke ovens (one facility), and iron and steel production (four facilities) in the Detroit metro area. The results for each sector represent the population-weighted average derived from all census tracts within a 3 km radius of all facilities belonging to that sector.
Sustainability 16 06931 g009
Table 1. Data source.
TypeSourcePeriod
County-level emissions of CAPs, HAPs and GHGsOAQPS public website a2017
Facility-level emissions of CAPs, HAPs and GHGsOAQPS public website a2017
O3, PM2.5 concentration data at census tract-levelOAQPS b 2019
Air toxics cancer risk data at census tract-levelAirToxScreen c2018
O3 and PM2.5 design values at county-levelU.S. EPA public website d2019
O3 and PM2.5 monitoring data (annual) at site-levelSMAT-CE e2002 to 2020
Air toxics monitoring data at site-levelOAQPS public website f2003 to 2020
EJ/Demographic indicators from EJScreenEJScreen g2021
CEJST disadvantaged areas at census-tract levelCEJST h2022
Note: a https://www.epa.gov/air-emissions-inventories/national-emissions-inventory-nei (accessed on 2 June 2024); b https://www.epa.gov/hesc/rsig-related-downloadable-data-files (accessed on 2 June 2024); c https://www.epa.gov/AirToxScreen (accessed on 2 June 2024); d https://www.epa.gov/air-trends/air-quality-design-values (accessed on 2 June 2024); e https://www.epa.gov/scram/photochemical-modeling-tools (accessed on 2 June 2024); f https://www.epa.gov/amtic/amtic-ambient-monitoring-archive-haps (accessed on 2 June 2024); g https://www.epa.gov/ejscreen (accessed on 2 June 2024); h https://screeningtool.geoplatform.gov (accessed on 2 June 2024). OAQPS—Office of Air Quality Planning and Standards; SMAT-CE—software for the Modeled Attainment Test—Community Edition version 2.1; CEJST—Climate and Economic Justice Screening Tool version 1.0; CAPs—criteria air pollutants; HAPs—hazardous air pollutants; GHGs—greenhouse gases.
Table 2. Wayne County historical emissions (unit: ton) from NEI.
Pollutants20082011201420172020
Nitrogen Oxides88,74662,42551,58234,73020,407
Primary PM2.5 84095180529454836070
Volatile Organic Compounds64,15244,85043,75340,30432,600
Sulfur Dioxide55,66243,27234,19815,9526199
Disclaimer/Publisher’s Note: The statements, opinions and data contained in all publications are solely those of the individual author(s) and contributor(s) and not of MDPI and/or the editor(s). MDPI and/or the editor(s) disclaim responsibility for any injury to people or property resulting from any ideas, methods, instructions or products referred to in the content.

