Article

Applying Material Flow Analysis for Sustainable Waste Management of Single-Use Plastics and Packaging Materials in the Republic of Korea

1
National Institute of Environmental Research, Incheon 22689, Republic of Korea
2
Department of Environmental Engineering, Colleage of Engineering, Kyonggi University, Suwon 16227, Republic of Korea
*
Author to whom correspondence should be addressed.
Sustainability 2024, 16(16), 6926; https://doi.org/10.3390/su16166926
Submission received: 10 July 2024 / Revised: 6 August 2024 / Accepted: 7 August 2024 / Published: 13 August 2024
(This article belongs to the Special Issue Sustainable Waste Management in the Context of Circular Economy)

Abstract

:
This study involves a material flow analysis (MFA) of single-use plastics (SUPs) and packaging materials in the Republic of Korea, focusing on their short lifespans and significant contributions to plastic waste. Based on the MFA results, recommended policies for managing packaging materials and SUPs were proposed. In 2021, 6.340 Mt of synthetic resin were produced, with 39.7% (2.518 Mt) utilized for packaging materials and SUPs. The per capita consumption of these materials was 48.7 kg/year, surpassing global averages. The separate collection rate was 54.6%, with films (26.2%) and manufacturing facilities (10.6%) exhibiting the lowest rates. The overall recycling rate was 52.7%, and 981 t of recycled waste was directly placed in soil. The reliability of the MFA results was estimated to be 83.1%, which is an improvement compared to previous studies. Recommendations include reducing plastic use, expanding recycling infrastructure, raising public awareness, and implementing stricter regulations to control soil contamination.

1. Introduction

Owing to their flexibility, low cost, excellent durability, electrical insulation, and processability, plastics are widely used in various industries and our daily lives [1]. From 2010 to 2019, global plastic production has grown by an annual average of 3.1%, from 349 Mt to 460 Mt, respectively [2]. Due to the increase in plastic consumption, the amount of plastic discarded as post-consumer waste is gradually increasing. From 2010 to 2019, the amount of global plastic waste increased at an average annual rate of 3.7%, from 255 Mt to 353 Mt, respectively [3]. Moreover, the amount of plastic waste generated worldwide is estimated to reach 1.014 Gt by 2060 [4]. The plastic waste released into the environment can take centuries to degrade, due to its high resistance to physical and chemical degradation; as plastics contain flame retardants, such as polybrominated biphenyls (PBB) and polybrominated diphenyl ethers (PBDE), and persistent organic pollutants, inappropriate management of plastics can have negative effects on human health and the environment [5,6].
International organizations, such as the Basel Convention and the United Nations Environment Assembly (UNEA), have made efforts to manage plastic waste. At the 14th meeting of the Conference of Parties (COP) to the Basel Convention in 2019, the annexes of the convention were amended to include plastic waste as a regulated material [7]. In the 5th session of the UNEA (UNEA-5.2), the topic “End plastic pollution: Towards an international legally binding instrument” was adopted. This resolution deals with the entire lifecycle of plastics, including production, design, and waste, with the aim of initiating an international convention planned to be completed by the end of 2024 [8]. Thus, the Basel Convention and the UNEA have recognized the importance of the entire lifecycle of plastic waste and are promoting its sustainable waste management (SWM).
With respect to the generated amount of plastic waste, the average annual growth rate in the Republic of Korea is 8.3%, from 6.3 Mt in 2013 to 13.2 Mt in 2022 [9,10]. This number was more than double the annual increase of 3.8% in the overall waste in the Republic of Korea during the same period; thus, the country must establish and implement practical and detailed measures to reduce plastic waste and increase the recycling rate [10].
The Republic of Korea has announced various policies that are in accordance with the international objectives pertaining to plastic-waste management. Despite these efforts, the amount of plastic waste has significantly increased, from 8.9 million tons in 2018, when the first master plan was implemented, to 13.2 million tons by 2022 [10]. This suggests that while various policies were being announced, plastic-waste generation continued to rise, illustrating the need for more stringent measures and innovative strategies.
The Republic of Korea aims to reduce plastic waste by 20% by 2025 and by 50% by 2030 [11,12]. The target recycling rates for plastic waste, starting at 54% in 2020, are 70% by 2030 and 100% by 2040 [12,13]. As part of the measures implemented to increase the recycling rate, efforts are being taken to increase the demand for recycled-plastic products in the industry. The utilization rate of recycled plastics in 2020 was estimated to be 0.2%, and there were plans to increase the rate to 10% by 2025 [12,14]. In creating plastic-management policies, the Republic of Korea has adopted an approach that involves declaring targets and plans to achieve these targets through goal-oriented strategies. For example, the Ministry of Environment is pursuing various strategies in the processes of manufacturing/production, consumption/distribution, and collection/treatment. However, plastic waste is a complex problem due to the limitations pertaining to the reliability of data on waste generation and treatment volumes, as well as the currently imbalanced supply chain; while the policy approach can provide broad solutions to such problems, it does not provide specific methodologies by which to achieve those targets.
To adopt a scientific policy approach for plastic-waste management and pursue specific methods to achieve the related targets, it is important to identify the sectors that use the largest quantities of plastic and plastic products with short lifespans (which results in large consumption of plastics) in order to perform material flow analysis (MFA) [15,16]. In 2021, the global plastic usage per sector was 172 Mt for packaging materials (44%), 70 Mt for building and construction (18%), 31 Mt for vehicles (8%), and 27 Mt for electrical/electronic products (7%) [3]. According to Geyer et al. [17], the mean lifespan of packaging materials is the shortest (around 0.5 years); furthermore, these materials are promptly discarded as waste after consumption, resulting in large amounts of plastic waste. Thus, in terms of both the usage and lifespan of plastics per sector, a priority policy approach needs to be introduced for packaging materials and single-use plastics (SUPs); notably, this policy approach should be based on the MFA of plastics.
Several previous studies have conducted MFAs of packaging materials and SUPs across various countries. Most of these MFA studies have employed different assumptions and models to align system inputs and outputs [18,19,20,21]. However, such approaches often lead to gaps between modeled data and actual data, making it difficult to precisely identify where these gaps occur within the lifecycle. Some studies have utilized measured data to identify these gaps. For instance, Jang et al. [22] conducted an MFA of packaging materials and SUPs in Republic of Korea from 2017 to 2019, reporting that annually 3.14 to 3.23 Mt of packaging materials and SUPs were consumed, with 2.24 to 2.89 Mt of waste generated. Similarly, Lee et al. [23] reported that in 2017, 2.71 Mt of packaging materials and SUPs were consumed in the Republic of Korea, resulting in 2.40 Mt of waste. Lopez-Aguilar et al. [24], through an MFA of packaging materials in Spain, found a significant gap between the official recycling rate of 48% and the study’s finding of 15%. These gaps underscore the necessity of reliability assessments in MFA studies.
The aim of this study is to conduct a comprehensive MFA of packaging materials and SUPs, which have the shortest lifespan and constitute the predominant components of plastic waste. By utilizing a more accurate and updated dataset, this research seeks to generate a more reliable MFA and address existing data gaps. The study also aims to identify key areas for policy intervention to improve plastic-waste management in the Republic of Korea. The current management policies for packaging materials and SUPs in Korea were reviewed, and new strategies for plastic-waste management were proposed based on the MFA results. This approach integrates comprehensive data analysis with policy recommendations, contributing to the sustainable management of plastic waste and providing valuable insights for future policy development.

2. Materials and Methods

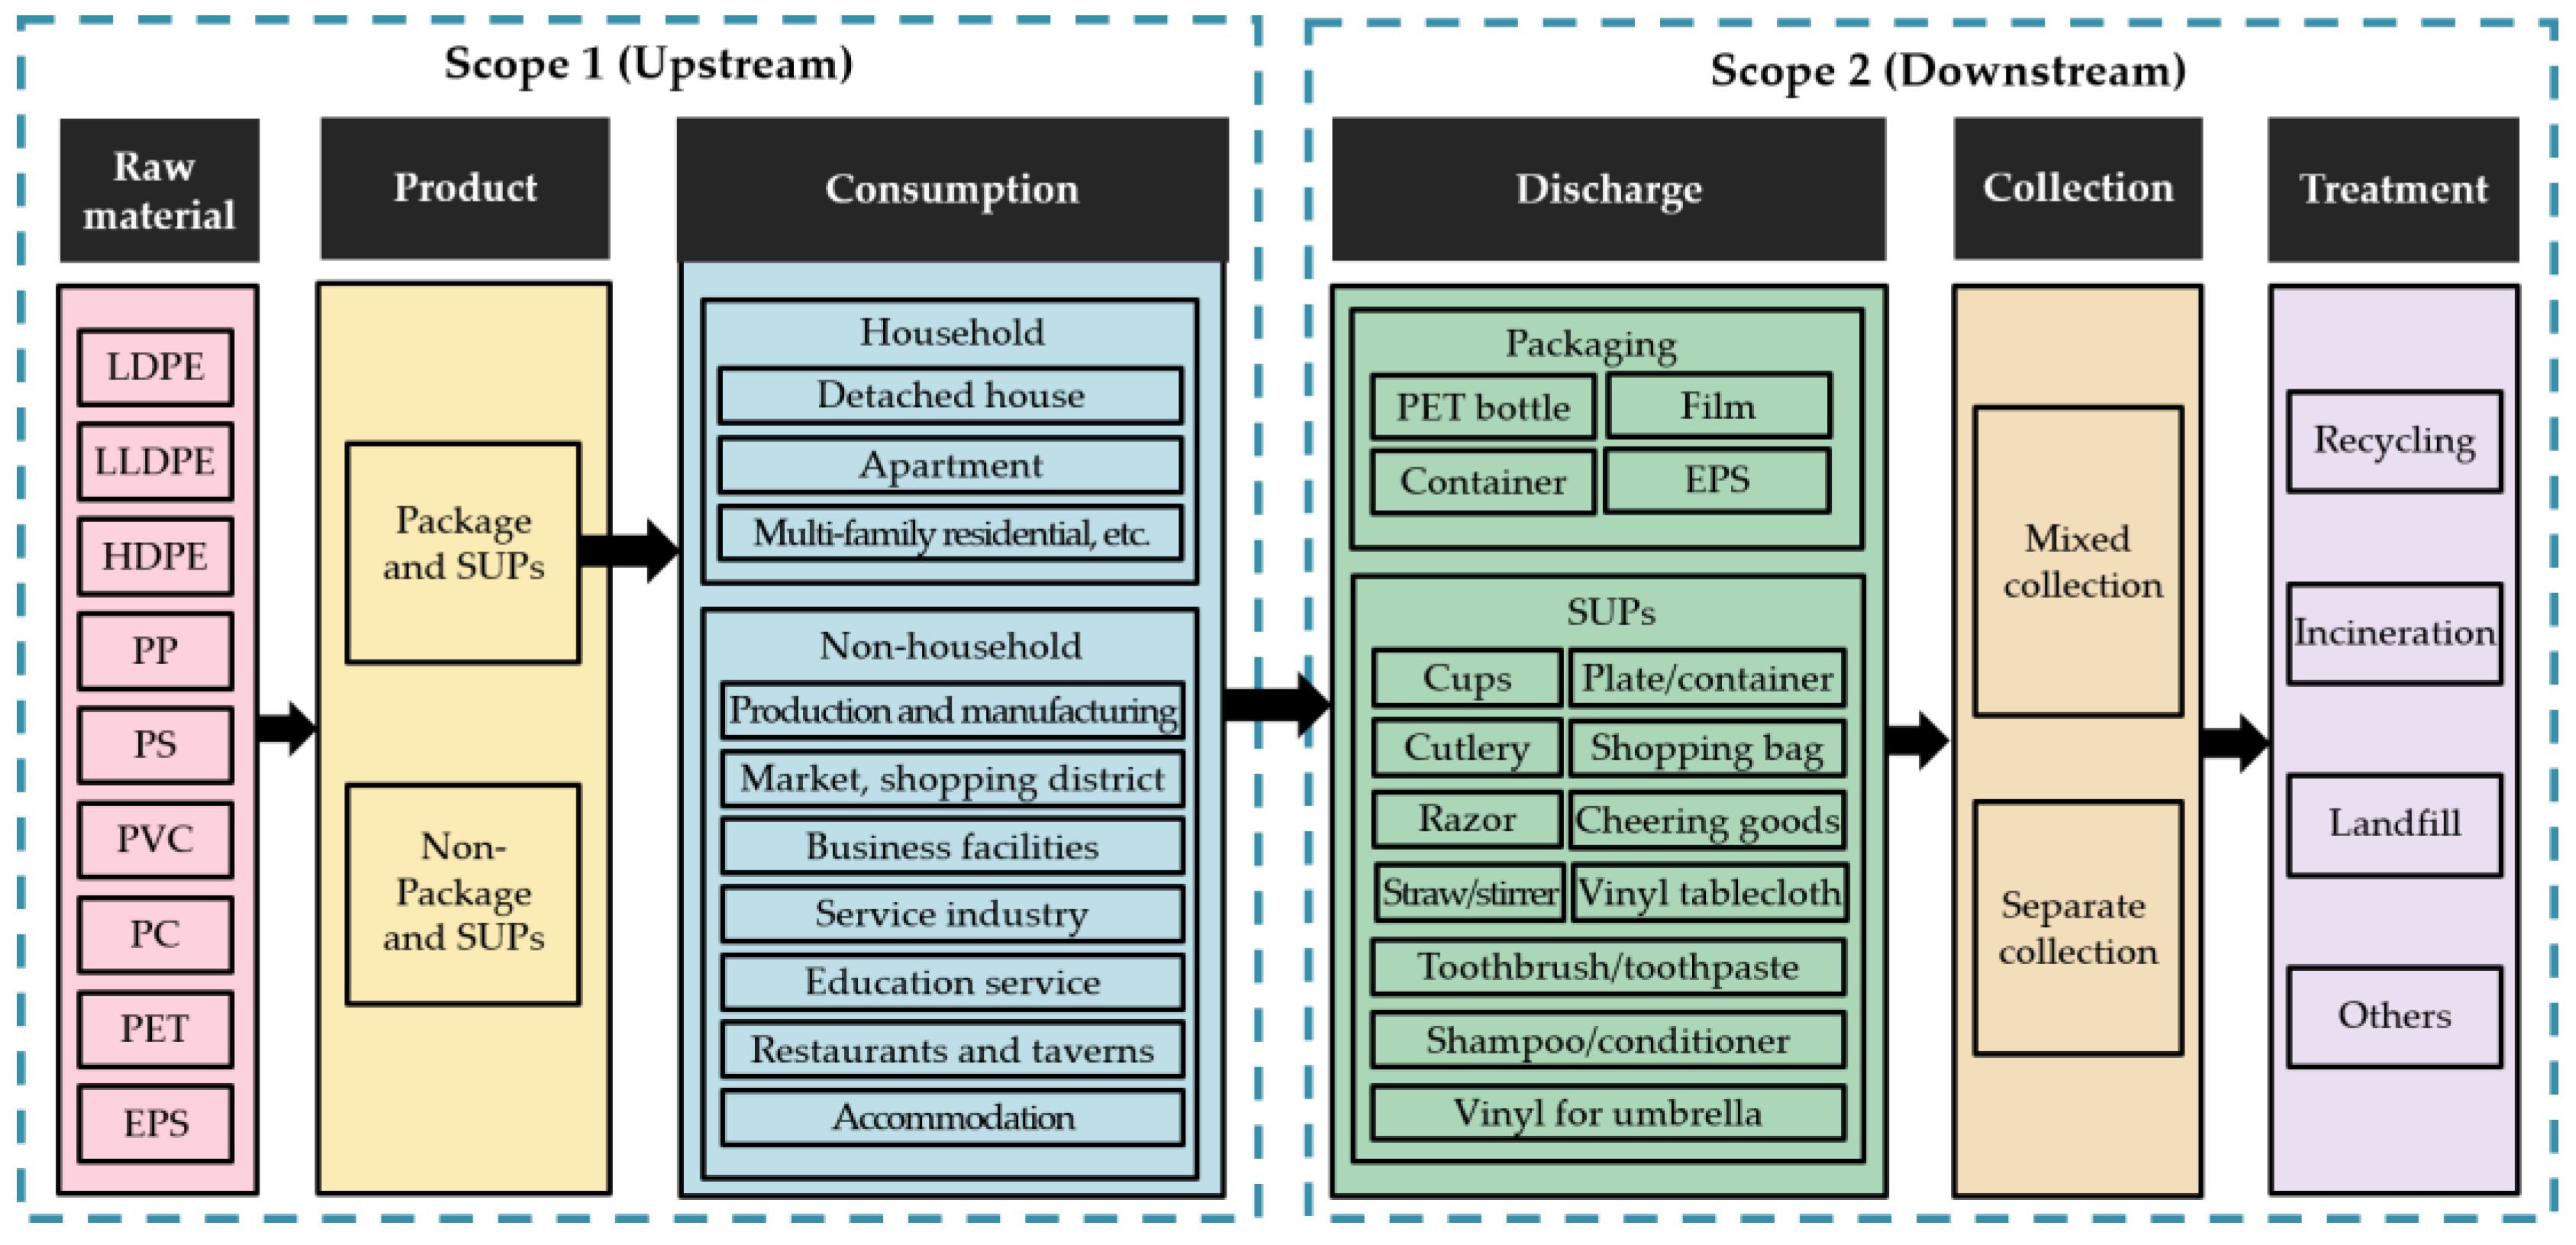
2.1. Data Sources and Method for Material Flow Analysis (MFA)

The foundational data for conducting the MFA of packaging materials and SUPs can be broadly divided into upstream (the production of packaging materials and SUPs from synthetic-resin raw materials and their consumption) and downstream (discharge and treatment as waste) data. Significant discrepancies are observed in these two domains due to the differences in the time it takes for products to be consumed and subsequently discharged as waste, as well as the unverifiable nature of the information regarding flow (e.g., due to the mixing of foreign materials with the plastic waste); therefore, the study was divided into two parts: Scope 1 (pertaining to the upstream data) and Scope 2 (pertaining to the downstream data).
For this study, the MFA was limited to the year 2021, and the Republic of Korea was selected as the target area. The entire range of plastics produced in the country was considered, from the production of synthetic resins (raw materials) to the development of new products and their consumption, discharge, collection, and waste treatment. The details of the scopes and data sources used for the MFA are shown in Figure 1 and Table 1. For synthetic resins at the raw-material stage, nine polymers were investigated: low-density polyethylene (LDPE), linear low-density polyethylene (LLDPE), high-density polyethylene (HDPE), polypropylene (PP), polystyrene (PS), polyvinyl chloride (PVC), polycarbonate (PC), PET, and expanded polystyrene (EPS). The packaging materials and SUPs were also investigated. With respect to consumption, the analysis differentiated between the use of plastics in household and non-household sectors. The household sector was divided into the following categories: detached house, apartment, and multi-family residence. The non-household sector was divided into seven categories: production/manufacturing facility, market/shopping district, business facility, service industry, educational services, restaurant/tavern, and accommodation. The plastic waste was categorized as PET bottles, films, containers, EPS, or SUPs. Furthermore, SUPs were subdivided into 11 product types: disposable plastic cups, plates/containers, cutlery, razors, toothbrush/toothpaste, shampoo/conditioner, plastic bags, cheering goods, vinyl tablecloths, straws/stirrers, and vinyl for umbrellas. Depending on the collection method, two categories were considered: mixed-waste collection (in which the waste was mixed and discharged in standard bags) and separate collection (wherein the waste was segregated before recycling). The following waste-treatment methods were considered: recycling, incineration, landfilling, and others (see Figure 1).
In general, the MFA method is based on mass balance. In this study, the following assumptions were used. All packaging materials and SUPs were sold to the consumers and consumed in the same year in which they had been produced due to their short lifespan. Second, it was assumed that packaging materials and SUPs were collected and treated as waste in the same year. Third, the data gap between the consumption sector and the collection sector was assumed to be due to stock in the consumption sector. Fourth, the amount collected was estimated from the amount discharged without accounting for the plastic leakage into the environment. Fifth, it was assumed that no foreign materials were included in the plastic waste.
The specific methodology for the MFA, based on these assumptions, is described in Supporting Information (SI) Section S1. Table 1 presents the details of the data on packaging materials and SUPs used for conducting the MFA in this study.

2.2. Reliability Assessment

Various approaches were utilized to assess the reliability of the MFA results in this study, including assessment of the reliability of the data and inconsistencies between the upstream and downstream results.
To enhance the reliability of the study, a data-reliability assessment was conducted. The evaluation criteria for data reliability included the publication date and source of information. Based on these criteria, data reliability was classified into 3 levels (A to C). Data with the highest reliability (Level A) were obtained from recent publications by reputable sources, whereas data with lower reliability (Level C) were older and derived from less robust sources. Detailed evaluation criteria and the results of the data-reliability assessment are presented in SI Section S2.1.
In this study, upstream and downstream data were used for the MFA of packaging materials and SUPs, resulting in discrepancies. If the differences between the upstream (consisting of raw materials, products, and consumption) and downstream (consisting of discharge, collection, and treatment) data were large, the reliability of the MFA results was considered to be low [32].
One common method by which to quantify the reliability of the MFA method is to use the standard relative derivation (SRD) to evaluate the relative difference (inconsistency) between the two datasets [33,34]. A large SRD value indicates greater inconsistency between the datasets, implying that the reliability ( R ) of the MFA results is low. Here, SRD is the absolute value of the difference between the input ( x j ) and output value ( x j ^ ) divided by x j for a given flow, j , between supply chains. However, one limitation of this method is that, even if the reliability of the results for waste that constitutes a high proportion of the flow is high, the overall reliability is greatly decreased if the reliability is low for waste constituting a small proportion of flow. The improved SRD ( D ¯ ) used to evaluate the SRD while accounting for the quantity of each waste type, is shown in Equation (1), as follows:
D ¯ = j = 1 n ( | x j x j ^ x j | × W j ) × 100 ( % )
where W j denotes the quantitative weight (%) of the waste and n denotes the number of flows between supply chains.
Note that W j is the quantity of a given flow, j , between supply chains, as a proportion of the total waste, which can be expressed as follows:
W i = M j j = 1 n M j × 100 ( % )
where M j denotes the quantity of waste for the flow j .
The reliability ( R ) of the MFA results was quantified using Equation (3), as follows:
R = 1 D ¯
To ensure accurate quantification, it is necessary to have access to all data on flow between supply chains. Therefore, to compare reliability with that of previous studies, it is most efficient to compare the upstream and downstream data with the largest differences. To evaluate the inconsistencies between the results for the upstream and downstream datasets, the upstream and downstream data were linked and the inconsistencies between these values were compared. The methods used for linking the upstream and downstream data in this study are explained in detail in SI Section S2.2.

3. Results and Discussion

3.1. Policies for Packaging Materials and Single-Use Plastics (SUPs) in the Republic of Korea

The government of the Republic of Korea has announced various policy measures to minimize the negative effects of plastic waste. The major policies include the Master Plan for Recyclable Waste Management (2018), the 1st Master Plan for Resource Circulation (2018), the 2050 Carbon Neutral Strategy of the Republic of Korea (2020), the Reduction and Recycling Measures for the Life Cycle of Plastics (2020), and the Plan to Implement Korean-style Circular Economy for Carbon Neutrality (2021).
Table 2 provides the details of the major policies in place in the Republic of Korea for each stage of packaging material and SUP circulation. At the raw-materials and products stages, the main policies include the expansion of the circular utilization assessment (CUA) system and improvements in materials and structure. The CUA system can evaluate the factors that impede recycling after the consumption and disposal of a product; it is also used as a basis for suggesting improvements in the manufacturing and design stages. Since 2018, this system has been used to evaluate five types of packaging materials and SUPs, including PET containers and PVC wrap, and it was expanded to include plastic containers for beverages in 2021 and for food in 2022, along with the inclusion of other plastic containers in 2023. In 2018, 125 packaging products from 32 companies underwent assessments through the CUA system. Improvements included the use of easily separable adhesives, labels, and lids made from the same material as the body and the transition to transparent bodies. These changes have made the recycling of packaging products more efficient. In addition, as part of the extended producer responsibility (EPR) recycling system, efforts have been taken to reduce the amount of plastics by improving the materials and the structure of the packaging. These efforts include the use of lighter materials, redesigning packaging to use less plastic, and increasing the recyclability of materials.
At the consumption and discharge stages, the country introduced new regulations on the use of SUPs, such as plastic straws and single-use bags; furthermore, a disposable-cup deposit system was being considered to reduce plastic-cup waste. Excessive packaging leads to resource waste and environmental pollution; therefore, the Korean government established new guidelines to prevent excessive packaging. The use and free provision of some SUPs, such as plastic straws, is now banned in the country, thereby reducing the use of SUPs and promoting the use of alternatives. In the disposable-cup-depository system, a resource-circulation fee (USD 0.3 per cup) is deposited separately from the costs associated with the release, importation, and sales of plastic cups; the deposit is returned when the consumer returns the used cup. This approach is effective at increasing the recovery rate of disposable cups and promoting recycling.
At the collection and recycling stages, novel strategies are being pursued, e.g., the construction of a system to monitor the recycling market, thermal degradation of plastic waste, and the development of cutting-edge recycling technologies. The recycling-market monitoring system identifies trends in the recycling market in real-time; new recycling policies can be established based on these real-time data to improve the stability of the recycling market and reinforce resource-circulation systems. The government plans to increase the proportion of plastics treated by thermal degradation from 0.1% in 2020 to 10% in 2030. As of 2020, there were 11 thermal-degradation facilities in the Republic of Korea; an additional four public thermal-degradation facilities were planned to be in operation by 2022. To achieve the 2030 target, it is important to ascertain the amount of plastic waste that can be subjected to chemical recycling and install the necessary chemical-recycling equipment.

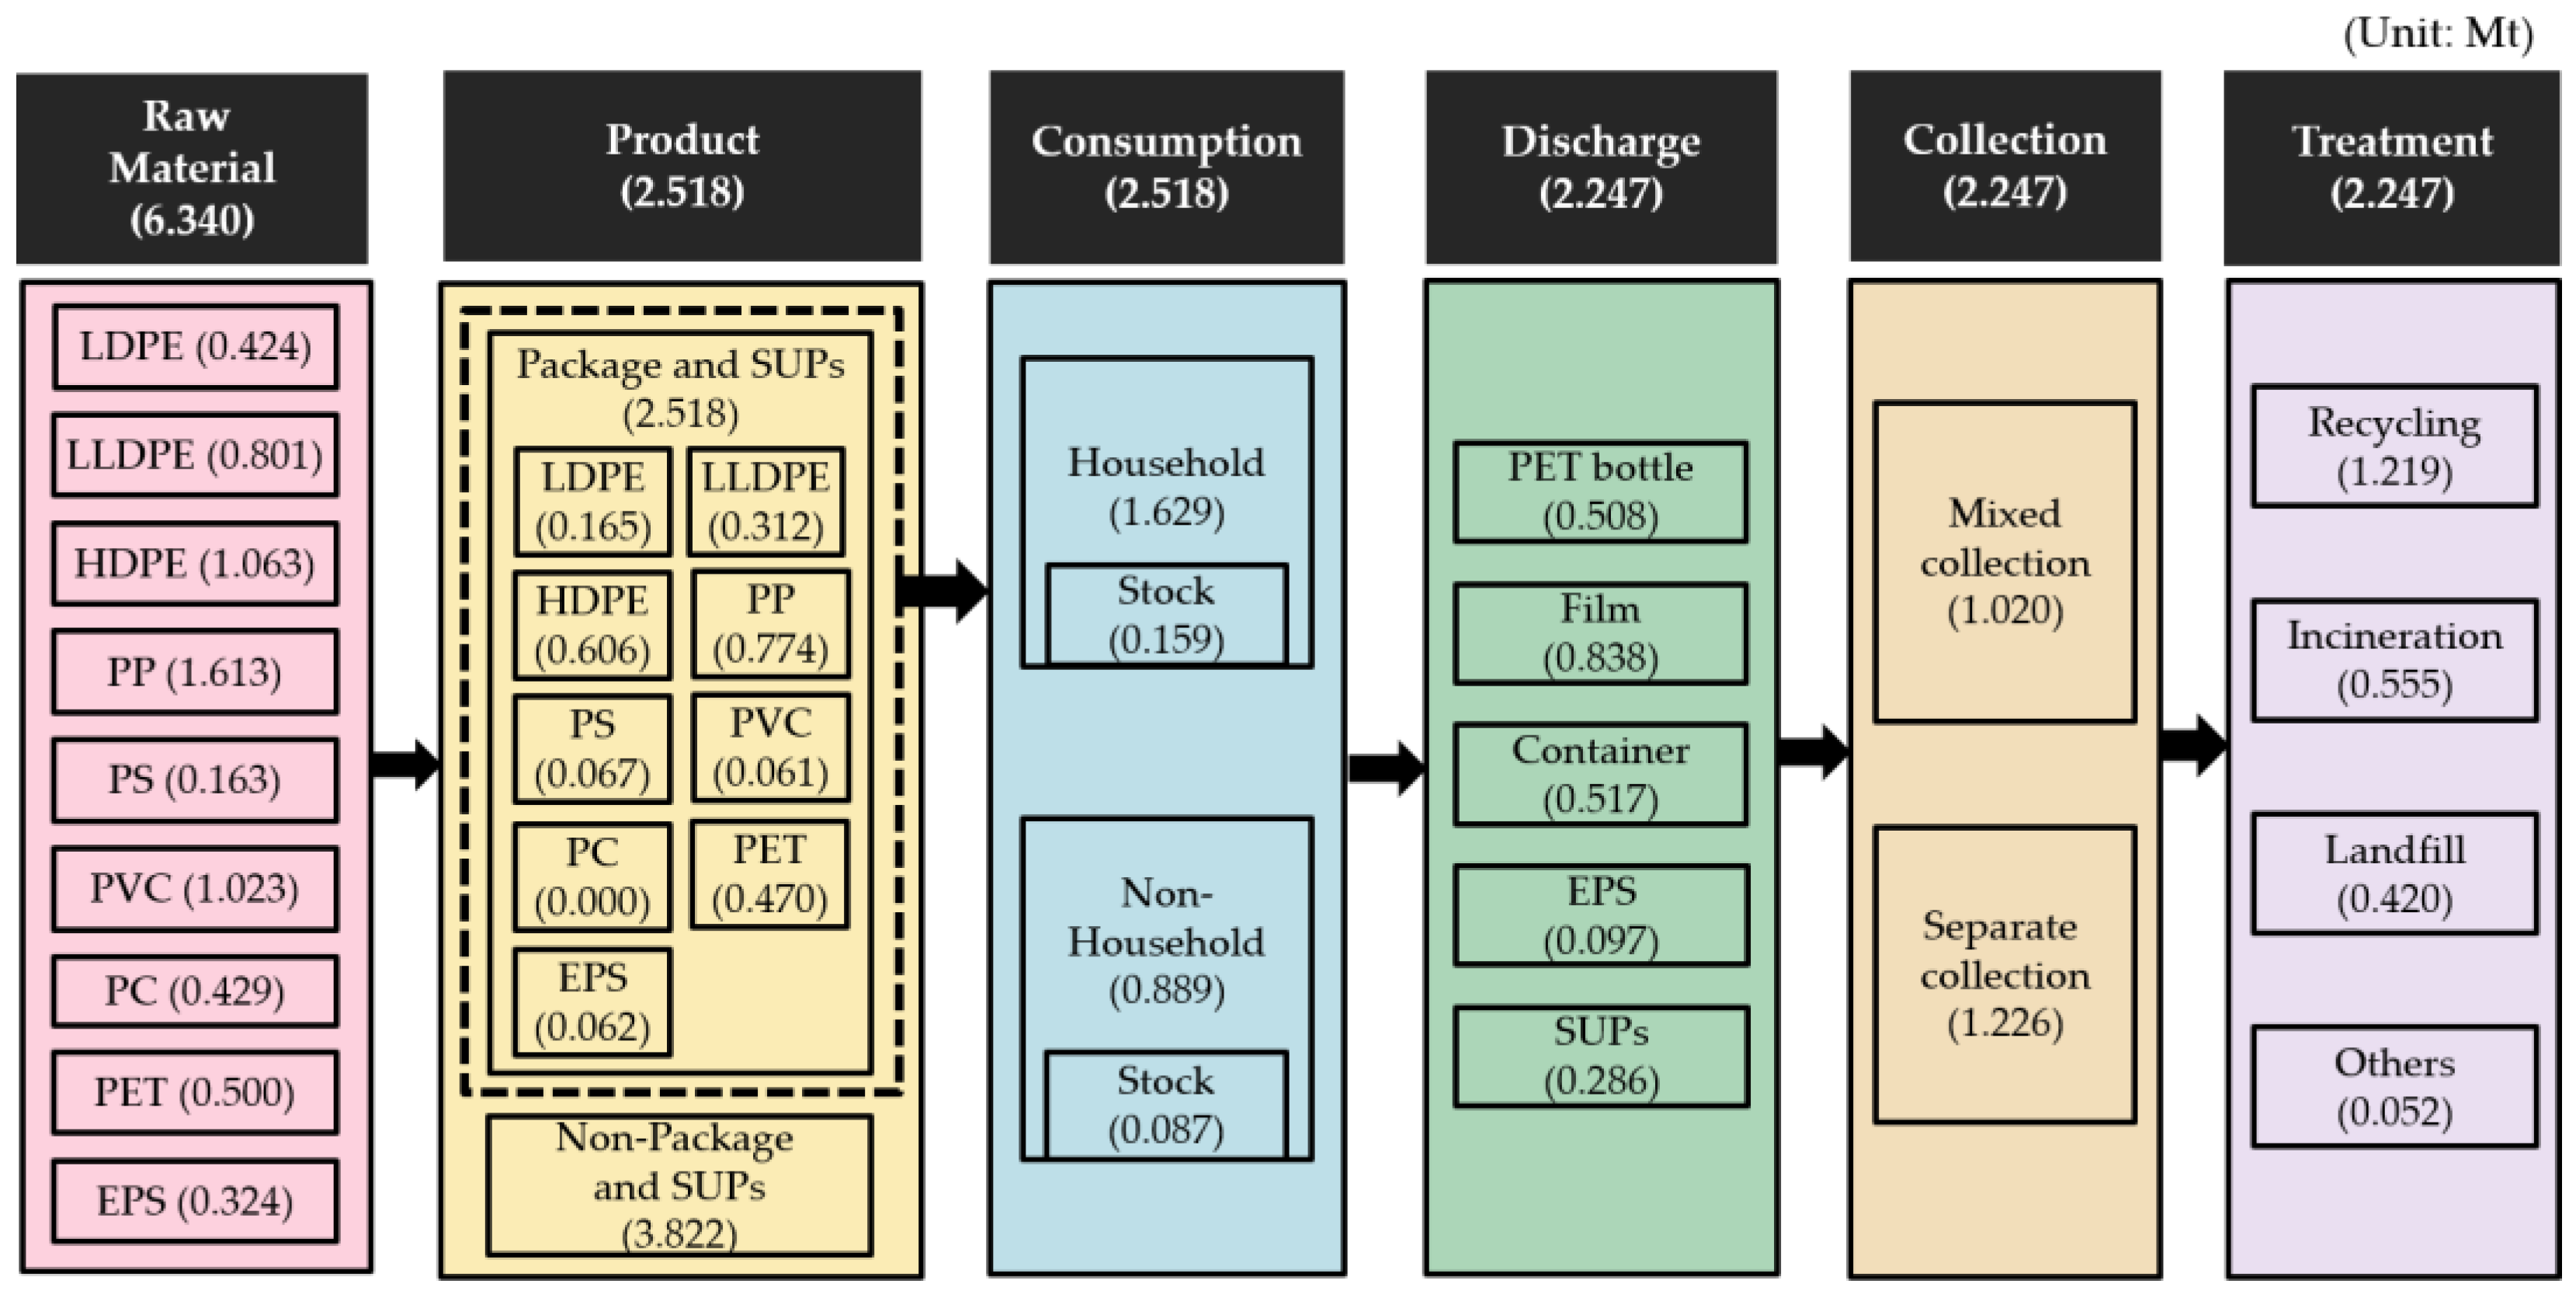
3.2. Material Flow MFA of Packaging Materials and SUPs

Figure 2 presents the results of the MFA for packaging materials and SUPs conducted in our study. The specific results, by stage, are shown in Section 3.2.1, Section 3.2.2, Section 3.2.3, Section 3.2.4 and Section 3.2.5.

3.2.1. Scope 1: Raw-Materials Stage

The amounts of each of the nine synthetic-resin raw materials (LDPE, LLDPE, HDPE, PVC, PP, PS, EPS, PC, and PET) consumed in the Republic of Korea in 2021 are shown Figure 2; the total consumption was 6.340 Mt [26]. The largest portion was attributed to PP (1.613 Mt, 25.4%), followed by HDPE (1.063 Mt, 16.8%) and PVC (1.023 Mt, 16.1%).
According to Plastics Europe [36], in the global production of virgin plastics, the largest portion could be attributed to PP (24.8%), followed by LDPE/LLDPE (18.5%), PVC (16.6%), HDPE/MDPE (16.1%), and PET (8.0%). This was similar to the consumption of synthetic-resin raw materials in the Republic of Korea.

3.2.2. Scope 1: Product Stage

With respect to the raw materials consumed in the Republic of Korea, 2.518 Mt (39.7%) was produced as packaging materials or SUPs, while 3.822 Mt was used in other sectors, such as vehicles, construction materials, and electrical/electronic products. The production amounts, per raw material, for packaging materials and SUPs are shown in Figure 2. The synthetic resin that was mainly produced for use in packaging materials and SUPs was PP (0.774 Mt, 30.8%), followed by HDPE (0.606 Mt, 24.1%) and PET (0.470 Mt, 18.7%).

3.2.3. Scope 1: Consumption Stage

The amounts of packaging materials and SUPs consumed in each sector are shown in Table 3. The amounts of plastic consumed as packaging materials and SUPs in the household and non-household sectors were 1.629 Mt and 0.889 Mt, respectively. In particular, the amount of packaging and SUPs consumed in apartments was the highest, at 1.262 Mt (50.1% of the total consumption). This may be because 51.9% of the population in the Republic of Korea lives in apartments [28]. In the non-household sector, the consumption was highest in manufacturing and production facilities (0.250 Mt; 9.9% of the total consumption); thus, the policies that aim to reduce the consumption of plastic raw materials should focus on such facilities.
The stocks in the household and non-household sectors were estimated to be 0.159 Mt and 0.087 Mt, respectively. Given the assumption that all the packaging materials and SUPs produced in the Republic of Korea in 2021 were consumed within the same year, the actual stock was evaluated based on the stock in the product stage and the usage in the consumption stage.
For a comprehensive analysis, the consumption of packaging materials and SUPs in the Republic of Korea was compared to the consumption in other countries. In 2021, 2.518 Mt of packaging materials and SUPs were produced in the Republic of Korea; when converted to production per person, this value amounted to 48.7 kg/capita/year. Internationally, in 2021, the production of packaging materials and SUPs was 44.0 kg/capita/year in the European Union (EU), 31.9 kg/capita/year in Japan, and 21.8 kg/capita/year worldwide; thus, the production per capita was the highest in the Republic of Korea [36,37,38]. This implies that the consumption of plastic packaging materials and SUPs in the Republic of Korea was also the highest compared to that in the EU, in Japan, or worldwide. Therefore, to reduce the amounts of packaging materials and SUPs, the quantities should be reduced in the consumption stage.

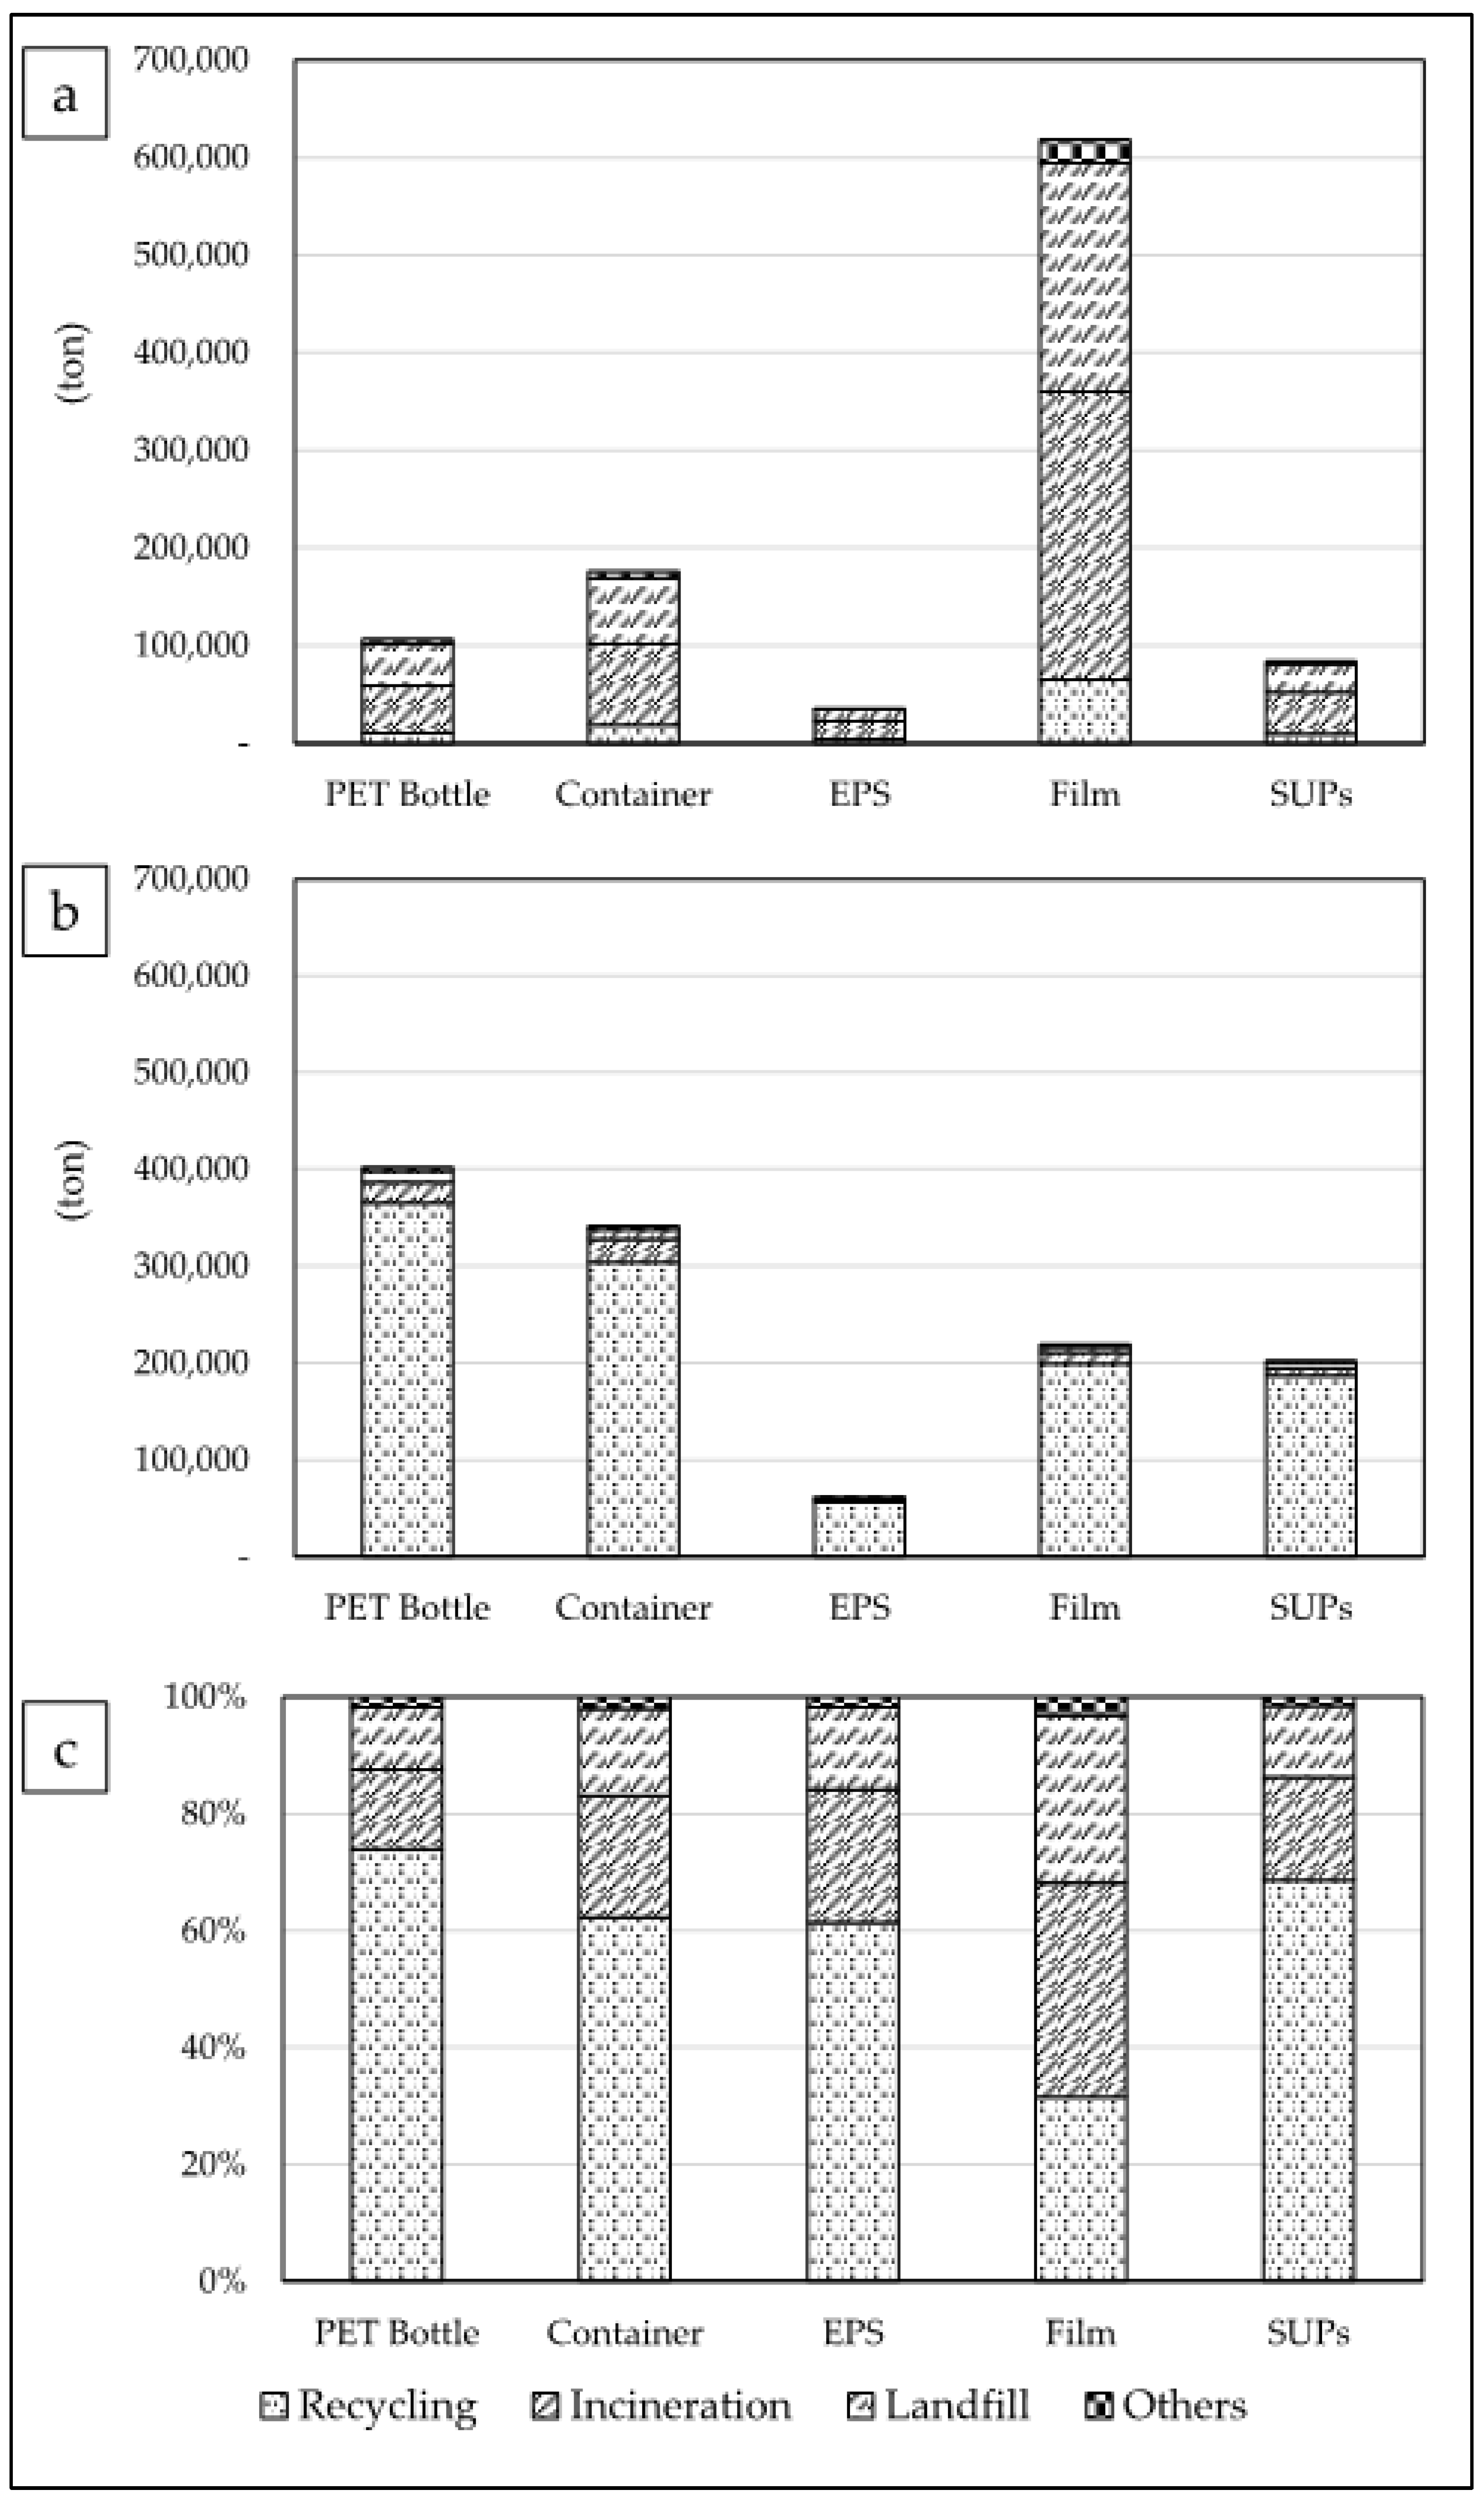
3.2.4. Scope 2: Collection Stage

Waste collection is important for various reasons, including resource retrieval, environmental protection, and the maintenance of public health. In general, to enable the recycling of a large amount of waste, packaging materials and SUPs must be collected separately. With respect to the MFA for the collection stage, it is essential to comprehensively review the amounts of packaging materials and SUPs collected via mixed and separate collection modes.
The Republic of Korea practices two waste-collection methods: mixed (using standard bags) and separate collection (which entails the segregation of plastic waste). The data on the amounts collected, separate collection rates, scope of collection per area, and type of waste generation are shown in Table 4, and the detailed data are provided in SI Section S4 (Tables S5–S7).
The total amount of packaging materials and SUPs collected was 2.247 Mt, of which 54.6% was collected separately. The separate collection rate was highest for PET bottles (79.1%) and lowest for films (26.2%). As films are commonly used in food packaging, they are difficult to collect separately because they are often mixed with a large amount of foreign materials, such as food [39,40,41].
With respect to the separate collection rates by sector, the separate collection rate was lowest in the production and manufacturing sector (10.6%), significantly less than the mean recycling rate of non-household sectors (35.1%). As the waste-collection amounts from manufacturing and production facilities were the highest among the non-residential sectors, strategies should be developed to improve the separate collection rates for such facilities.

3.2.5. Scope 2: Treatment Stage

Figure 3 depicts the state of treatment of collected packaging materials and SUPs. Figure 3a provides the amount of packaging materials and SUPs treated from a mixed collection. The average recycling rate for the mixed collected packaging materials and SUPs was low (10.5%), implying the need to implement policies that encourage waste separation at the discharge stage.
From the 1.020 Mt of packaging materials and SUPs derived from the mixed collection, 0.619 Mt could be attributed to films. Note that films need to be treated using environment-friendly methods; currently, films are incinerated or buried in landfills. To ensure the transition to a circular Due to contamination with food and other foreign matter, it is more appropriate for films to be incinerated or chemically recycled, rather than mechanically recycled [41].
Figure 3b presents the current status of the treatment of separately collected packaging materials and SUPs in the Republic of Korea. In 2021, the recycling rate of separately collected waste in the Republic of Korea was 90.7%. Eriksen et al. [42] reported that, with current technology, less than 42% of plastics can be segregated from mixed collected waste. Thus, separate collection is one of the most effective methods for improving the recycling rates of packaging materials and SUPs.
Figure 3c depicts the rates for recycling, incineration, landfill disposal, and other treatments for all packaging materials and SUPs in the Republic of Korea in 2021. The recycling rate for all packaging materials and SUPs was low (52.7%). The recycling rate for PET bottles was highest (74.0%), followed by those for SUPs (68.6%) and containers (62.3%). Films had the lowest recycling rate (31.6%); this may be because they were generally discharged in the form of mixed collection. In conclusion, the Republic of Korea requires novel strategies to improve the recycling rates of plastics other than PET bottles. To transition to a circular economy, the country must adopt waste-recycling strategies that reduce incineration and landfill disposal.
In the Republic of Korea, in accordance with the “Waste Control Act,” waste recycling is categorized into 10 types. Table 5 presents the data pertaining to the amounts of packaging materials and SUPs recycled with respect to specific recycling types. The majority of packaging materials from mixed collection were recycled by R-9, wherein they were converted to a state from which energy could be retrieved. Meanwhile, the separately collected packaging materials and SUPs were mainly recycled by R-3 (wherein the solid-state resources were retrieved and raw materials were manufactured) and R-10 (wherein the intermediate processed waste was produced). Note that R-5 and R-6 (wherein materials are recycled for agriculture or soil improvement) and R-7 (wherein materials are recycled as embankment material, cover material, road-layer material, or filling material for soil or public water) introduce recycled materials into the environment [43]. Some packaging materials and SUPs were recycled using R-5, with the amounts for the mixed and separate collection being 811 and 170 t, respectively.
After they have been discharged into the environment, plastics can be converted to microplastics (MPs), a persistent pollutant. Soil tends to accumulate MPs more easily than aquatic ecosystems do [44]. Note that MPs are known to have negative effects on the growth, proliferation, feeding, survival, and immunity of animals, plants, and microbes [45,46,47]. Thus, recycling methods that treat plastic packaging and SUPs in such a way that they are placed in direct contact with the soil are not environmentally safe. For this reason, it is important to conduct surveys of waste recycled using R-5 and develop appropriate management strategies.

3.3. Limitations and Reliability of the Material Flow Analysis (MFA) Results

Based on the data source, the MFA was divided into Scope 1 (using upstream data) and Scope 2 (using downstream data). As the data sources for Scopes 1 and 2 were different, there was a data gap that needed to be reviewed. To evaluate the differences between the datasets used in Scopes 1 and 2 in detail, the product groups were identified by the raw material (in this case, PET bottles and EPS were considered). For Scope 1 and Scope 2, the amounts of PET produced were 0.470 and 0.508 Mt, respectively, and those of EPS were 0.062 and 0.098 Mt, respectively.
The gap in the data may be due to the influx of waste via unknown flow and the increase in the waste amount due to the presence of foreign material in waste-plastic products. PET bottles may contain foreign materials in the form of residues of beverages or labels made from other plastic materials. Furthermore, EPS may contain foreign materials made from other plastics. There is a possibility that waste material other than EPS, e.g., foam mesh used for storing fruits or polystyrene paper (PSP), could have entered the flow. It is also difficult to accurately calculate the actual amount of EPS from unknown flow, but the PS category is being expanded to produce EPS.
In MFA studies, reliability assessment is crucial due to various assumptions and uncertainties; however, most studies do not sufficiently address this aspect. In this study, the reliability of packaging materials and SUPs was evaluated by analyzing discrepancies between Scope 1 data and Scope 2 data to identify gaps. The results are shown in Table 6, indicating that the MFA reliability in this study was calculated to be 83.1%. Reliability in other countries ranged from 33.8% to 82.8%, with higher reliability observed in countries like the EU and the US, which have relatively well-established statistical data.
In the Republic of Korea, two MFA studies have been conducted on packaging materials and SUPs that assess both upstream and downstream areas. The reliability of these studies was evaluated, revealing that the inventory reliabilities of Jang et al. [22] and Lee et al. [23] were 79.5% and 74.8%, respectively. Previous studies estimated the production of packaging materials and SUPs in Korea by multiplying the domestic consumption of primary plastic products by the production ratio of packaging materials and single-use products. The only data available for this ratio come from the Korea Petrochemical Industry Association, which surveyed synthetic resin sales by end-use category (excluding PET) from 2011 to 2013 [22]. However, these data are over ten years old and do not reflect current policy changes and industrial conditions, resulting in a low (C-grade) reliability. In contrast, this study utilized data with higher reliability ratings, thereby improving the reliability of the MFA.
The MFA of packaging and SUPs plays a crucial role in the formulation and improvement of environmental policies, necessitating continuous data updates and reliability improvements. To achieve this end, it is essential to obtain more accurate data on distribution coefficients and collect the latest data reflecting the changed environment. Additionally, since information on the mixing of plastic materials, impurity content, and actual consumption is not clear, further data collection is required to secure detailed flow information and enhance reliability. The impact of standard relative deviation ( D ¯ ) values on overall reliability ( R ) was analyzed, revealing that higher D ¯ values indicate greater data variability and uncertainty, which reduces R . Incorporating more recent and reliable data sources helped reduce D ¯ , thereby improving the overall MFA reliability.

3.4. Future Perspectives for the Management of Waste from Packaging Materials and SUPs

3.4.1. Policy Recommendations and Implementation

To effectively manage plastic packaging materials and SUPs in the Republic of Korea, a multifaceted approach is essential. The recommended management strategies emphasize the need to reduce the use of packaging materials and SUPs, expand recycling infrastructure, enhance public awareness about separate collection, and implement regulations to control the types of plastics that come into contact with soil (see Table 7).
First and foremost, the waste-management hierarchy, which prioritizes reduction, reuse, recycling, energy recovery, and disposal, should guide policy development [51,52]. Reducing waste from packaging materials and SUPs is paramount for minimizing the environmental burden [53,54]. This can be achieved by reducing the amount of plastic used during production and by encouraging consumers to lower their consumption of these materials. In the manufacturing and production stages, assessing the materials used in products and the structures of products is crucial. Currently, the Extended Producer Responsibility (EPR) recycling system assesses packaging materials but excludes some SUPs such as disposable table covers, cheering goods, vinyl for umbrellas, disposable razors, straws, and stirrers. Expanding the scope of the EPR system to include these items will significantly reduce SUPs use.
Consumer behavior also plays a vital role in reducing packaging materials and SUPs. Policies that promote the reuse of packaging materials and disposable cups, or expand the scope of single-use plastics (SUPs), support the long-term goal of sustainable waste management by enhancing public awareness. Policies that promote the reuse of packaging materials and disposable cups, or expand the scope of SUPs, will support long-term sustainability goals. The screening of mixed packaging materials and SUPs is currently not cost-efficient [55,56]. Therefore, expanding waste-management infrastructure and raising public awareness about separate collections are critical [57,58,59]. The relatively high separate collection rate of films in apartments (42.5%) compared to the overall rate (26.2%) indicates that convenient, separate collection facilities and administrative efforts to improve waste-separation awareness are effective. Targeting manufacturing and production facilities, which have the lowest separate collection rates, will also enhance overall waste management.
Our study revealed that a part of the recycled plastic waste was placed in direct con-tact with soil. This phenomenon has been highlighted as a crucial issue, considering the potential effects of plastics on soil. Improving legal and institutional frameworks is essential for effective plastic waste management. Current regulations should be reviewed, and stricter guidelines should be established to minimize soil contamination during recycling. Stronger sanctions are needed to prevent waste plastics from being placed in contact with soil at recycling facilities.
A comprehensive approach that includes reducing packaging materials and SUPs, expanding recycling infrastructure, raising public awareness, and implementing strict regulations will help the Republic of Korea minimize the environmental burden of plastic waste, promote resource efficiency, and build an SWM.

3.4.2. Future Research Directions

Future research should focus on several key areas to support the effective management of plastic packaging materials and SUPs waste.
First, future studies should prioritize obtaining more accurate data on distribution coefficients and collecting the latest data that reflect the changing environment. Detailed flow information is essential for enhancing the reliability of MFA, considering the mixing of plastic materials, impurity content, and actual consumption.
Additionally, investigations into consumer behavior and the effectiveness of public-awareness campaigns can provide insights into how to encourage the reduced use and proper disposal of SUPs. Understanding the social and cultural factors that influence waste-management practices will aid in designing more effective educational programs and policies.
Furthermore, expanding research on the effects of plastic waste on soil ecosystems is critical. Detailed analyses of the types, amounts, and distribution of plastic waste materials, as well as the properties of plastic residues in soil, will help assess their potential effects on soil ecosystems and human health [60,61]. This includes studying the degradation processes of different plastics, the formation and impact of microplastics, and the long-term effects on soil health and agricultural productivity. Such research will inform the development of guidelines and regulations to prevent soil contamination.
By addressing these research directions, the Republic of Korea can develop innovative and effective strategies for managing plastic packaging materials and SUPs waste, contributing to a sustainable future.

4. Conclusions

In this study, an MFA was conducted to evaluate the lifecycle of and management strategies for packaging materials and SUPs in the Republic of Korea. The main conclusions of our study are presented below:
The MFA revealed that in 2021, 6.340 Mt of synthetic-resin raw materials were consumed, with 2.518 Mt produced as packaging materials or SUPs. The study found that 54.6% of the collected packaging materials and SUPs were separately collected and that the overall recycling rate for these materials was 52.7%.
The reliability of the MFA results for packaging materials and SUPs was 83.1%, higher than the values from previous studies, which ranged from 33.8% to 82.8%.
The study recommends adopting a multifaceted approach to improve plastic waste management, including reducing the use of packaging materials and SUPs, expanding recycling infrastructure, enhancing public awareness about separate collection, and implementing stricter regulations to control the types of plastics that come into contact with soil. A particular emphasis should be placed on improving the recycling rates of low-recycled materials and targeting sectors with low separate collection rates, such as manufacturing and production facilities.
Future research should focus on obtaining more accurate data on distribution coefficients, investigating consumer behavior and the effectiveness of public awareness campaigns, and studying the effects of plastic waste on soil ecosystems.

Supplementary Materials

The following supporting information can be downloaded at: https://www.mdpi.com/article/10.3390/su16166926/s1. Supporting Information for A material flow analysis of single-use plastics and packaging materials in Republic of Korea [25,27,31,47,48,49,50,62,63,64].

Author Contributions

Conceptualization, H.-J.C. and S.-W.R.; methodology, H.-J.C.; validation, H.-J.C. and S.-W.R.; formal analysis, H.-J.C. and D.H.; investigation, H.-J.C.; resources, D.H., Y.-S.Y. and T.-W.J.; data curation, H.-J.C.; writing—original draft preparation, H.-J.C.; writing—review and editing, D.H., Y.-S.Y. and S.-W.R.; visualization, H.-J.C.; supervision, Y.-S.Y. and T.-W.J.; project administration, Y.-S.Y. and T.-W.J.; funding acquisition, D.H., Y.-S.Y. and T.-W.J. All authors have read and agreed to the published version of the manuscript.

Funding

This research was funded by the Post-Doctoral Fellowship Program of the National Institute of Environmental Research, Republic of Korea (NIER 2024-01-01-068).

Institutional Review Board Statement

Not applicable.

Informed Consent Statement

Not applicable.

Data Availability Statement

The raw data supporting the conclusions of this article will be made available by the authors on request.

Acknowledgments

This work supported by a grant from the National Institute of Environmental Research (NIER), funded by the Ministry of Environment (ME) of the Republic of Korea (NIER-2024-01-01-068). This research builds upon the foundational work presented in my doctoral dissertation titled “Establishment of a plastic waste inventory to promote the circular economy: Focusing on packaging and single-use plastics”, completed at Kyonggi University in 2023.

Conflicts of Interest

The authors declare no conflicts of interest.

References

  1. Gilbert, M. Plastics materials: Introduction and historical development. In Brydson’s Plastics Materials, 8th ed.; Gilber, M., Ed.; Butterworth-Heinemann: Oxford, UK, 2017; pp. 1–18. ISBN 978-03-23-35824-8. [Google Scholar]
  2. OECD. Global Plastics Outlook: Economic Drivers, Environmental Impacts and Policy Options; OECD Publishing: Paris, France, 2022; ISBN 978-92-64-58406-8. [Google Scholar] [CrossRef]
  3. OECD. Plastic Waste by Region and End-of-Life Fate; OECD Environment Statistics: Paris, France, 2023; ISSN 18169465. [Google Scholar] [CrossRef]
  4. OECD. Plastic waste projections to 2060. In Global Plastics Outlook: Policy Scenarios to 2060; OECD Publishing: Paris, France, 2022; pp. 83–108. ISBN 978-92-64-89881-3. [Google Scholar] [CrossRef]
  5. Nnorom, I.C.; Osibanjo, O. Sound management of brominated flame retarded (BFR) plastics from electronic wastes: State of the art and options in Nigeria. Resour. Conserv. Recycl. 2008, 52, 1362–1372. [Google Scholar] [CrossRef]
  6. Necibi, M.C.; Dhiba, D.; El Hajjaji, S. Contaminants of emerging concern in African wastewater effluents: Occurrence, impact and removal technologies. Sustainability 2021, 13, 1125. [Google Scholar] [CrossRef]
  7. UNEP. Terms of reference for the Basel Convention Partnership on Plastic Waste and workplan for the working group of the Partnership on Plastic Waste for the biennium 2020–2021. In Proceedings of the Conference of the Parties to the Basel Convention on the Control of Transboundary Movements of Hazardous Wastes and Their Disposal Fourteenth Meeting, Geneva, Switzerland, 29 April–10 May 2019. [Google Scholar]
  8. UNEP. Resolution Adopted by the United Nations Environment Assembly on 2 March 2022, UNEP/EA.5/Res.14. 2022. Available online: https://digitallibrary.un.org/record/3999257?v=pdf (accessed on 10 May 2024).
  9. Korea Ministry of Environment. National Waste Generation and Treatment Status. 2013, 2014. Available online: https://library.me.go.kr/#/search/detail/5586116 (accessed on 1 August 2024).
  10. Korea Ministry of Environment. National Waste Generation and Treatment Status. 2022, 2023. Available online: https://library.me.go.kr/#/search/detail/5912624 (accessed on 11 May 2024).
  11. Korea Ministry of Environment. Master Plan for Recyclable Waste Management. 2018. Available online: http://www.kwaste.or.kr/bbs/board.php?bo_table=board16&wr_id=277 (accessed on 10 May 2024).
  12. Korea Ministry of Environment. Reduction and Recycling Measures for the Lifecycle of Plastics. 2020. Available online: https://me.go.kr/home/web/board/read.do?menuId=&boardId=1420640&boardMasterId=1 (accessed on 10 May 2024).
  13. Korea Ministry of Environment. The 5th Comprehensive National Environmental Plan (2020–2040). 2019. Available online: https://me.go.kr/home/web/policy_data/read.do?menuId=10259&seq=7448 (accessed on 10 May 2024).
  14. Korea Government. De-Plastic Measures for the Entire Cycle. 2022. Available online: http://www.kwaste.or.kr/bbs/board.php?bo_table=board17&wr_id=185&page=1 (accessed on 10 May 2024).
  15. Choi, H.J.; Rhee, S.W. Material flow analysis of the recycling process for linear type spent fluorescent lamp. J. Korean Soc. Waste Manag. 2016, 33, 537–546. [Google Scholar] [CrossRef]
  16. Meherishi, L.; Narayana, S.A.; Ranjani, K.S. Integrated product and packaging decisions with secondary packaging returns and protective packaging management. Eur. J. Oper. Res. 2021, 292, 930–952. [Google Scholar] [CrossRef]
  17. Geyer, R.; Jambeck, J.R.; Law, K.L. Production, use, and fate of all plastics ever made. Sci. Adv. 2017, 3, e1700782. [Google Scholar] [CrossRef] [PubMed]
  18. Lombardi, M.; Rana, R.; Fellner, J. Material flow analysis and sustainability of the Italian plastic packaging management. J. Clean. Prod. 2021, 287, 125573. [Google Scholar] [CrossRef]
  19. Thomassen, G.; Van Passel, S.; Alaerts, L.; Dewulf, J. Retrospective and prospective material flow analysis of the post-consumer plastic packaging waste management system in Flanders. Waste Manag. 2022, 147, 10–21. [Google Scholar] [CrossRef] [PubMed]
  20. Madden, B.; Jazbec, M.; Florin, N. Increasing packaging grade recovery rates of plastic milk bottles in Australia: A material flow analysis approach. Sustain. Prod. Consum. 2023, 37, 65–77. [Google Scholar] [CrossRef]
  21. Antonopoulos, I.; Faraca, G.; Tonini, D. Recycling of post-consumer plastic packaging waste in the EU: Recovery rates, material flows, and barriers. Waste Manag. 2021, 126, 694–705. [Google Scholar] [CrossRef]
  22. Jang, Y.C.; Son, M.; Pack, J.Y. Plastics Flow Analysis for Korea, 2017–2019. J. Korean Soc. Waste Manag. 2022, 39, 194–206. [Google Scholar] [CrossRef]
  23. Lee, S.R.; Jo, J.H.; Shin, D.W.; Jung, D.W.; Go, I.C.; Lee, C.H.; Hwang, Y.W.; Hong, S.Y. Analysis of the life cycle status and outlook of plastics. In A Study on Plastic Management Strategies for Transitioning to a Circular Economy; Korea Environment Institute: Sejong, Republic of Korea, 2019; pp. 33–61. ISBN 979-11-5980-363-5. [Google Scholar]
  24. Lopez-Aguilar, J.F.; Sevigné-Itoiz, E.; Maspoch, M.L.; Peña, J. A realistic material flow analysis for end-of-life plastic packaging management in Spain: Data gaps and suggestions for improvements towards effective recyclability. Sustain. Prod. Consum. 2022, 31, 209–219. [Google Scholar] [CrossRef]
  25. Jang, Y.C. Strategies for the construction of a circular economy for plastics and to stimulate the use of regenerated materials in the Republic of Korea. In Proceedings of the Forum for the 20th Anniversary of the Extended Producer Responsibility (EPR) System: EPR 2.0, Seoul, Republic of Korea, 1 June 2023. [Google Scholar]
  26. Korea Petrochemical Industry Association. Product Statistics: Synthetic Resin. 2023. Available online: https://www.kpia.or.kr/petrochemical-industry/statistics (accessed on 10 May 2024).
  27. Korea Petrochemical Industry Association. Domestic Sales Status of Synthetic Resin by Usage (Internal Data); Korea Petrochemical Industry Association: Seoul, Republic of Korea, 2014. [Google Scholar]
  28. Statistics Korea. Number of Businesses and Employees by City/Industry/Business Category. 2023. Available online: https://kosis.kr/statHtml/statHtml.do?orgId=101&tblId=DT_1K52D01&vw_cd=MT_ZTITLE&list_id=J2_17_001_001&scrId=&seqNo=&lang_mode=ko&obj_var_id=&itm_id=&conn_path=K2&path=%252Fcommon%252Fmeta_onedepth.jsp (accessed on 16 May 2024).
  29. Statistics Korea. 2021 Population and Housing Census (Register-Based Census). 2022. Available online: https://kostat.go.kr/board.es?mid=a20108070000&bid=11747&act=view&list_no=419981 (accessed on 10 May 2024).
  30. Korea Ministry of Environment. The 6th National Waste Statistics Survey; Korea Ministry of Environment: Seoul, Republic of Korea, 2022.
  31. Korea Ministry of Environment. National Waste Generation and Treatment Status 2021, 2022. Available online: https://library.me.go.kr/#/search/detail/5882048 (accessed on 11 May 2024).
  32. Meylan, G.; Reck, B.K.; Rechberger, H.; Graedel, T.E.; Schwab, O. Assessing the reliability of material flow analysis results: The cases of rhenium, gallium, and germanium in the United States economy. Environ. Sci. Technol. 2017, 51, 11839–11847. [Google Scholar] [CrossRef] [PubMed]
  33. Klinglmair, M.; Zoboli, O.; Laner, D.; Rechberger, H.; Astrup, T.F.; Scheutz, C. The effect of data structure and model choices on MFA results: A comparison of phosphorus balances for Denmark and Austria. Resour. Conserv. Recycl. 2016, 109, 166–175. [Google Scholar] [CrossRef]
  34. Zoboli, O.; Kaner, D.; Zessner, M.; Rechberger, H. Added values of time series in MFA: The Austrian phosphorus budget from 1990 to 2011. J. Ind. Ecol. 2015, 20, 1334–1348. [Google Scholar] [CrossRef] [PubMed]
  35. Choi, H.J. Establishment of a Plastic Waste Inventory to Promote the Circular Economy: Focusing on Packaging and Single-Use Plastics. Ph.D. Thesis, Kyonggi University, Suwon-si, Republic of Korea, 2023. Available online: https://dl.nanet.go.kr/view/callViewer.do?controlNo=KDMT12023000053413&orgId=dl&linkSysId=NADL (accessed on 25 March 2024).
  36. Plastics Europe. Plastics—The Facts; Plastics Europe: Brussels, Belgium, 2022; Volume 2022, pp. 16–23. Available online: https://plasticseurope.org/knowledge-hub/plastics-the-facts-2022/ (accessed on 10 May 2024).
  37. Plastic Waste Management Institute. Plastic Products, Plastic Waste and Resource Recovery [2021]. 2023, pp. 4–7. Available online: https://www.pwmi.or.jp/ei/siryo/ei/ei_pdf/ei52.pdf (accessed on 16 May 2024).
  38. World Bank. GDP Per Capita (Current US$). 2023. Available online: https://data.worldbank.org/indicator/NY.GDP.PCAP.CD (accessed on 26 May 2024).
  39. Grigore, M.E. Methods of recycling, properties and applications of recycled thermoplastic polymers. Recycling 2017, 2, 24. [Google Scholar] [CrossRef]
  40. Imam, S.H.; Glenn, G.M.; Chiellini, E. Utilization of biobased polymers in food packaging: Assessment of materials, production and commercialization. In Emerging Food Packaging Technologies: Principles and Practice; Yam, K.L., Lee, D.S., Eds.; Elsevier Science: Amsterdam, The Netherlands, 2012; pp. 435–468. ISBN 978-1-84569-809-6. [Google Scholar]
  41. Ncube, L.K.; Ude, A.U.; Ogunmuyiwa, E.N.; Zulkifli, R.; Beas, I.N. An overview of plastic waste generation and management in food packaging industries. Recycling 2021, 6, 12. [Google Scholar] [CrossRef]
  42. Eriksen, M.K.; Damgaard, A.; Boldrin, A.; Astrup, T.F. Quality assessment and circularity potential of recovery systems for household plastic waste. J. Ind. Ecol. 2019, 23, 156–168. [Google Scholar] [CrossRef]
  43. Um, N.; Kang, Y.Y.; Kim, K.H.; Shin, S.K.; Lee, Y. Strategic environmental assessment for effective waste management in Korea: A review of the new policy framework. Waste Manag. 2018, 82, 129–138. [Google Scholar] [CrossRef] [PubMed]
  44. Nizzetto, L.; Futter, M.; Langaas, S. Are agricultural soils dumps for microplastics of urban origin? Environ. Sci. Technol. 2016, 50, 10777–10779. [Google Scholar] [CrossRef]
  45. Pojar, I.; Dobre, O.; Lazăr, C.; Baboș, T.; Ristea, O.; Constantin, A.; Cristoiu, N. Microplastic Evaluation in Water and Sediments of a Dam Reservoir–Riverine System in the Eastern Carpathians, Romania. Sustainability 2024, 16, 4541. [Google Scholar] [CrossRef]
  46. Kumar, M.; Xiong, X.; He, M.; Tsang, D.C.; Gupta, J.; Khan, E.; Harrad, S.; Hou, D.; Ok, Y.S.; Bolan, N.S. Microplastics as pollutants in agricultural soils. Environ. Pollut. 2020, 265, 114980. [Google Scholar] [CrossRef] [PubMed]
  47. Pincelli, I.P.; de Castilhos Júnior, A.B.; Matias, M.S.; Rutkowski, E.W. Post-consumer plastic packaging waste flow analysis for Brazil: The challenges moving towards a circular economy. Waste Manag. 2021, 126, 781–790. [Google Scholar] [CrossRef]
  48. Tang, Y.; Mao, J.; Yu, G.; Li, J.; Wang, J. Material flow analysis and statistical entropy evaluation of plastic packaging for express delivery in China. Environ. Sci. Pollut. Res. 2024, 31, 28939–28949. [Google Scholar] [CrossRef] [PubMed]
  49. Hsu, W.T.; Domenech, T.; McDowall, W. How circular are plastics in the EU? MFA of plastics in the EU and pathways to circularity. Clean. Environ. Syst. 2021, 2, 100004. [Google Scholar] [CrossRef]
  50. Heller, M.C.; Mazor, M.H.; Keoleian, G.A. Plastics in the US: Toward a material flow characterization of production, markets and end of life. Environ. Res. Lett. 2020, 15, 094034. [Google Scholar] [CrossRef]
  51. Pires, A.; Martinho, G. Waste hierarchy index for circular economy in waste management. Waste Manag. 2019, 95, 298–305. [Google Scholar] [CrossRef]
  52. Duan, C.; Wang, Z.; Zhou, B.; Yao, X. Global Polyethylene Terephthalate (PET) Plastic Supply Chain Resource Metabolism Efficiency and Carbon Emissions Co-Reduction Strategies. Sustainability 2024, 16, 3926. [Google Scholar] [CrossRef]
  53. Choi, H.J.; Choi, Y.; Rhee, S.W. The strategy for management of plastic waste in Korea through the recycling policy in developed countries. J. Korean Soc. Waste Manag. 2018, 35, 709–720. [Google Scholar] [CrossRef]
  54. Siracusa, V.; Ingrao, C.; Giudice, A.L.; Mbohwa, C.; Dalla Rosa, M. Environmental assessment of a multilayer polymer bag for food packaging and preservation: An LCA approach. Food Res. Int. 2014, 62, 151–161. [Google Scholar] [CrossRef]
  55. Andrady, A.L.; Neal, M.A. Applications and societal benefits of plastics. Phil. Trans. R. Soc. B 2009, 364, 1977–1984. [Google Scholar] [CrossRef]
  56. Rohr, J.R.; Martin, L.B. Reduce, reuse, recycle scientific reviews. Trends Ecol. Evol. 2012, 27, 192–193. [Google Scholar] [CrossRef] [PubMed]
  57. Knickmeyer, D. Social factors influencing household waste separation: A literature review on good practices to improve the recycling performance of urban areas. J. Clean. Prod. 2020, 245, 118605. [Google Scholar] [CrossRef]
  58. Ittiravivongs, A. Factors influence household solid waste recycling behaviour in Thailand: An integrated perspective. In Sustainability Today; Brebbia, C.A., Ed.; WIT Press: Southampton, UK, 2012; pp. 437–448. ISBN 978-1-84564-652-3. [Google Scholar]
  59. Zaikova, A.; Deviatkin, I.; Havukainen, J.; Horttanainen, M.; Astrup, T.F.; Saunila, M.; Happonen, A. Factors influencing household waste separation behavior: Cases of Russia and Finland. Recycling 2022, 7, 52. [Google Scholar] [CrossRef]
  60. Tayebi, S.T.; Sambucci, M.; Valente, M. Waste Management of Wind Turbine Blades: A Comprehensive Review on Available Recycling Technologies with A Focus on Overcoming Potential Environmental Hazards Caused by Microplastic Production. Sustainability 2024, 16, 4517. [Google Scholar] [CrossRef]
  61. Qi, R.; Jones, D.L.; Li, Z.; Liu, Q.; Yan, C. Behavior of microplastics and plastic film residues in the soil environment: A critical review. Sci. Total Environ. 2020, 703, 134722. [Google Scholar] [CrossRef]
  62. European Environnment Agency. Demand for Common Plastics in Packaging and Non-Packaging Applications as a Percentage of Total Demand, by Plastic Type (EU27+3). 2022. Available online: https://www.eea.europa.eu/data-and-maps/figures/demand-for-common-plastics-in (accessed on 5 May 2024).
  63. Nakatani, J.; Maruyama, T.; Moriguchi, Y. Revealing the intersectoral material flow of plastic containers and packaging in Japan. Proc. Nati. Acad. Sci. USA 2020, 117, 19844–19853. [Google Scholar] [CrossRef]
  64. Korea Resource Recirculation Information System. Amount of Packaging Waste Generated and Recycled. 2023. Available online: https://www.recycling-info.or.kr/rrs/stat/envStatDetail.do?menuNo=M13020208&pageIndex=1&bbsId=BBSMSTR_000000000002&s_nttSj=KEC013&nttId=1328&searchBgnDe=&searchEndDe= (accessed on 5 May 2024).
Figure 1. Flowcharts explaining the scopes of material flow analysis (MFA) for packaging and single-use plastics (SUPs) conducted in this study. Abbreviations: polyethylene terephthalate (PET), low-density, polyethylene (LDPE), linear low-density polyethylene (LLDPE), high-density polyethylene (HDPE), polypropylene (PP), polystyrene (PS), polyvinyl chloride (PVC), polycarbonate (PC), expanded polystyrene (EPS).
Sustainability 16 06926 g001
Figure 2. Results for material flow analysis (MFA) of packaging materials and single-use plastics (SUPs) conducted in this study. Abbreviations: polyethylene terephthalate (PET), low-density, polyethylene (LDPE), linear low-density polyethylene (LLDPE), high-density polyethylene (HDPE), polypropylene (PP), polystyrene (PS), polyvinyl chloride (PVC), polycarbonate (PC), and expanded polystyrene (EPS).
Sustainability 16 06926 g002
Figure 3. Treatment of packaging and single-use plastics (SUPs) in the Republic of Korea: (a) mixed collected amount of packaging and SUPs; (b) separately collected amount of packaging and SUPs; and (c) ratio of packaging and SUPs by treatment (recycling, incineration, landfill, others). Abbreviations: polyethylene terephthalate (PET), expanded polystyrene (EPS).
Sustainability 16 06926 g003
Table 1. Sources of data for material flow analysis (MFA) of packaging materials and single-use plastics (SUPs).
ScopeStageDataData Source
Scope 1
(Upstream)
Raw materialRaw-materials statisticsPETJang et al. [25]
OthersKPIA 1 [26]
Production
/consumption
Distribution coefficient by type of synthetic resinKPIA [27]
Scope 2
(Downstream)
Discharge
/collection
Number of people working by areaStatistics Korea [28]
Number of people residing by areaStatistics Korea [29]
Basic unit waste collectionKorea Ministry of Environment [30]
TreatmentResidue-generation factor by waste type
Percentage of treatment by residue
Ratio by waste-treatment methodKorea Ministry of Environment [31]
1 Korea Petrochemical Industry Association.
Table 2. Major strategies for plastic-waste management implemented in the Republic of Korea.
Major Policy (Year)Major Contents
Raw Material-ProductConsumption-DischargeCollection-Treatment
Master Plan for Recyclable Waste Management (2018)
-
Ban on the use of colored PET bottles
-
Material and structure improvements for PET bottles
-
Establish guidelines to prevent overpacking
-
Prohibition on using plastic bags at hypermarkets, etc.
-
Establishment of a system to monitor the recycling market
1st Master Plan for Resource Circulation (2018)
-
Expansion of circular utilization assessment for plastic containers
-
Prohibition on the use and free provision of some of SUPs such as plastic straws
-
Development of recycling technology
2050 Carbon Neutral Strategy of the Republic of Korea (2020)
-
Reinforcing the circulation of raw materials in the manufacturing process
-
Expansion of information on ecofriendly products
-
Intercompany linkage of byproducts, etc.
Reduction and Recycling Measures for the Life Cycle of Plastics (2020)
-
Reduction in the proportion of packaging materials that are difficult to recycle: 34% (′20) → 15% (′25)
-
Decreased proportion of plastic containers: 47% (′20) → 38% (′25)
-
20% reduction in the weight of delivery containers
-
Mandatory ratio of using recycled raw materials: 30% (′30)
-
Construction of 10 public pyrolysis facilities (′25)
Raising the 2030 national greenhouse gas reduction target (2021)--
-
18.6% of 5 million tons of waste plastics are recycled as raw materials for use in the petrochemical industry (′30)
Plan to Implement Korean-style Circular Economy for Carbon Neutrality (2021)-
-
Encouraging the use of reusable containers in the delivery industry (′21~)
-
Prohibition on the use and free provision of disposable products (~′30)
-
Expansion of chemical recycling: 0.1% (′20) → 10% (′30)
Performance management strategic plan (2022)
-
Circular-utilization assessment for plastic containers for food (′22)
-
Deposit system for disposable cups (′22)
-
Expansion of AI-based optical sorting: 9% (′21) → 63% (′26)
Plastic-removal measures for the entire cycle (2022)
-
Rate of the use of recycled raw materials: 30% (′30)
-
Establishment of overpackaging standards for couriers (′24)
-
Adopted from Choi [35].
Table 3. Consumption of packaging material and single-use plastics (SUPs) in each sector.
TypePET Bottle
(Mt)
Container
(Mt)
EPS
(Mt)
Film
(Mt)
SUPs
(Mt)
Total
(Mt)
HouseholdDetached house0.0330.0530.0120.0940.0290.221
Apartment0.2810.2960.0640.4030.2181.262
Multi-family residential, etc. 0.0170.0330.0060.0670.0170.139
Sub-total0.3300.3820.0820.5640.2641.622
Non-householdProduction and manufacturing0.0310.0530.0060.1450.0130.250
Market, shopping district0.0290.0500.0080.0800.0140.181
Business facilities0.0190.0300.0040.0500.0090.113
Service industry0.0230.0380.0050.0570.0140.137
Education services0.0090.0100.0010.0150.0040.040
Restaurants and taverns0.0240.0440.0060.0670.0150.156
Accommodation0.0050.0040.0010.0070.0040.020
Sub-total0.1400.2280.0320.4230.0730.896
Total0.4700.6100.1140.9870.3372.518
Table 4. Separate collection rates for packaging materials and single-use plastics (SUPs) by sector. The background colors represent different ranges of waste collected: <5000 tons (light gray), 5000–10,000 tons (medium gray), 10,000–50,000 tons (dark gray), 10,000 tons ≤ (very dark gray).
Type of WastePET BottleContainerEPSFilmSUPsTotal
Household (%)Detached house7651.253.71845.741.5
Apartment89.879.370.442.583.971.4
Multi-family residential, etc.8160.56025.448.745.8
Sub-total8873.867.236.477.565.2
Non-household (%)Production and manufacturing21.619.124.42.920.810.6
Market, shopping district69.76964.123.36449.2
Business facilities56.54853.111.441.933.9
Service industry71.764.968.416.653.745.9
Education services77.252.651.712.748.344.7
Restaurants and taverns68.268.761.717.750.845.6
Accommodation73.633.639.517.53041.8
Sub-total 57.952.853.912.646.135.1
Total (%)79.16663.426.270.754.6
Table 5. Amount of plastic packaging and single-use plastics (SUPs) recycled in the Republic of Korea in 2021 using different types of recycling.
TypeRecycling CodeMixed Collection
(ton)
Separate Collction
(ton)
Recycling to original formR-1 -10,798
Recycling by simple repair, drying, or washingR-2 -671
Recycling by recovering solid resources or reproducing the raw materialsR-3 -231,731
Recycling by reproducing the productR-4 -49,612
Recycling of organic/inorganic materials for the purpose of aiding agricultural productionR-5811 170
Recycling of organic materials for the purpose of soil improvementR-6 --
Recycling to produce embankment materials, cover material, road-layer material, or filling material for soil or public waterR-7 --
Recycling to a form that allows direct recovery of energyR-8 -106,974
Recycling to a form that enables recovery of energyR-9 106,79363,551
Recycling to make intermediate processed waste for manufacturingR-10 -641,090
Total107,6041,111,599
Table 6. Amount of recycled packaging materials and SUPs by recycling type.
TypeCountryTimeTarget Items Reliability   ( R )Reference
This studyRepublic of Korea2022Packaging materials and SUPs83.1%-
Priror studyBrazil2017Packaging materials33.8%Pincelli et al. [47]
China2020Packaging materials63.2%Tang et al. [48]
EU2016Packaging materials82.8%Hsu et al. [49]
Reuplic of Korea2017–2019Packaging materials and SUPs79.5%Jang et al. [22]
2017Packaging materials and SUPs74.8%Lee et al. [23]
US2017Packaging materials and SUPs82.6%Heller et al. [50]
Table 7. Recommended management strategies for packaging materials and single-use plastics (SUPs).
Management StrategiesContents
ReductionManufacting stage
-
Expansion of the Extended Producer Responsibility (EPR) system to include assessment of the materials and structure of SUPs
Consumption stage
-
Promotion of methods to reuse packaging materials and disposable cup, and expanding the scope of products for which the use of SUPs is controlled.
Improvement in separation collectionExpansion of infrastructure
-
Enhancing infrastructure to improve convenience and separate collection rates, with a focus on manufacturing and production facilities.
Awareness improvement
-
Educational campaigns to raise awareness about separate collection.
Implementation of regulations
-
Improving legal and institutional frameworks for plastic waste management. Enforcing stricter regulations and guidelines to minimize soil contamination during recycling processes.
Disclaimer/Publisher’s Note: The statements, opinions and data contained in all publications are solely those of the individual author(s) and contributor(s) and not of MDPI and/or the editor(s). MDPI and/or the editor(s) disclaim responsibility for any injury to people or property resulting from any ideas, methods, instructions or products referred to in the content.

