
Assessment of Green Innovation Efficiency in Chinese Industrial Enterprises Based on an Improved Relational Two-Stage DEA Approach: Regional Disparities and Convergence Analysis


Abstract
1. Introduction
2. Literature Review
3. Methodology and Data
3.1. Measurement of Green Innovation Efficiency
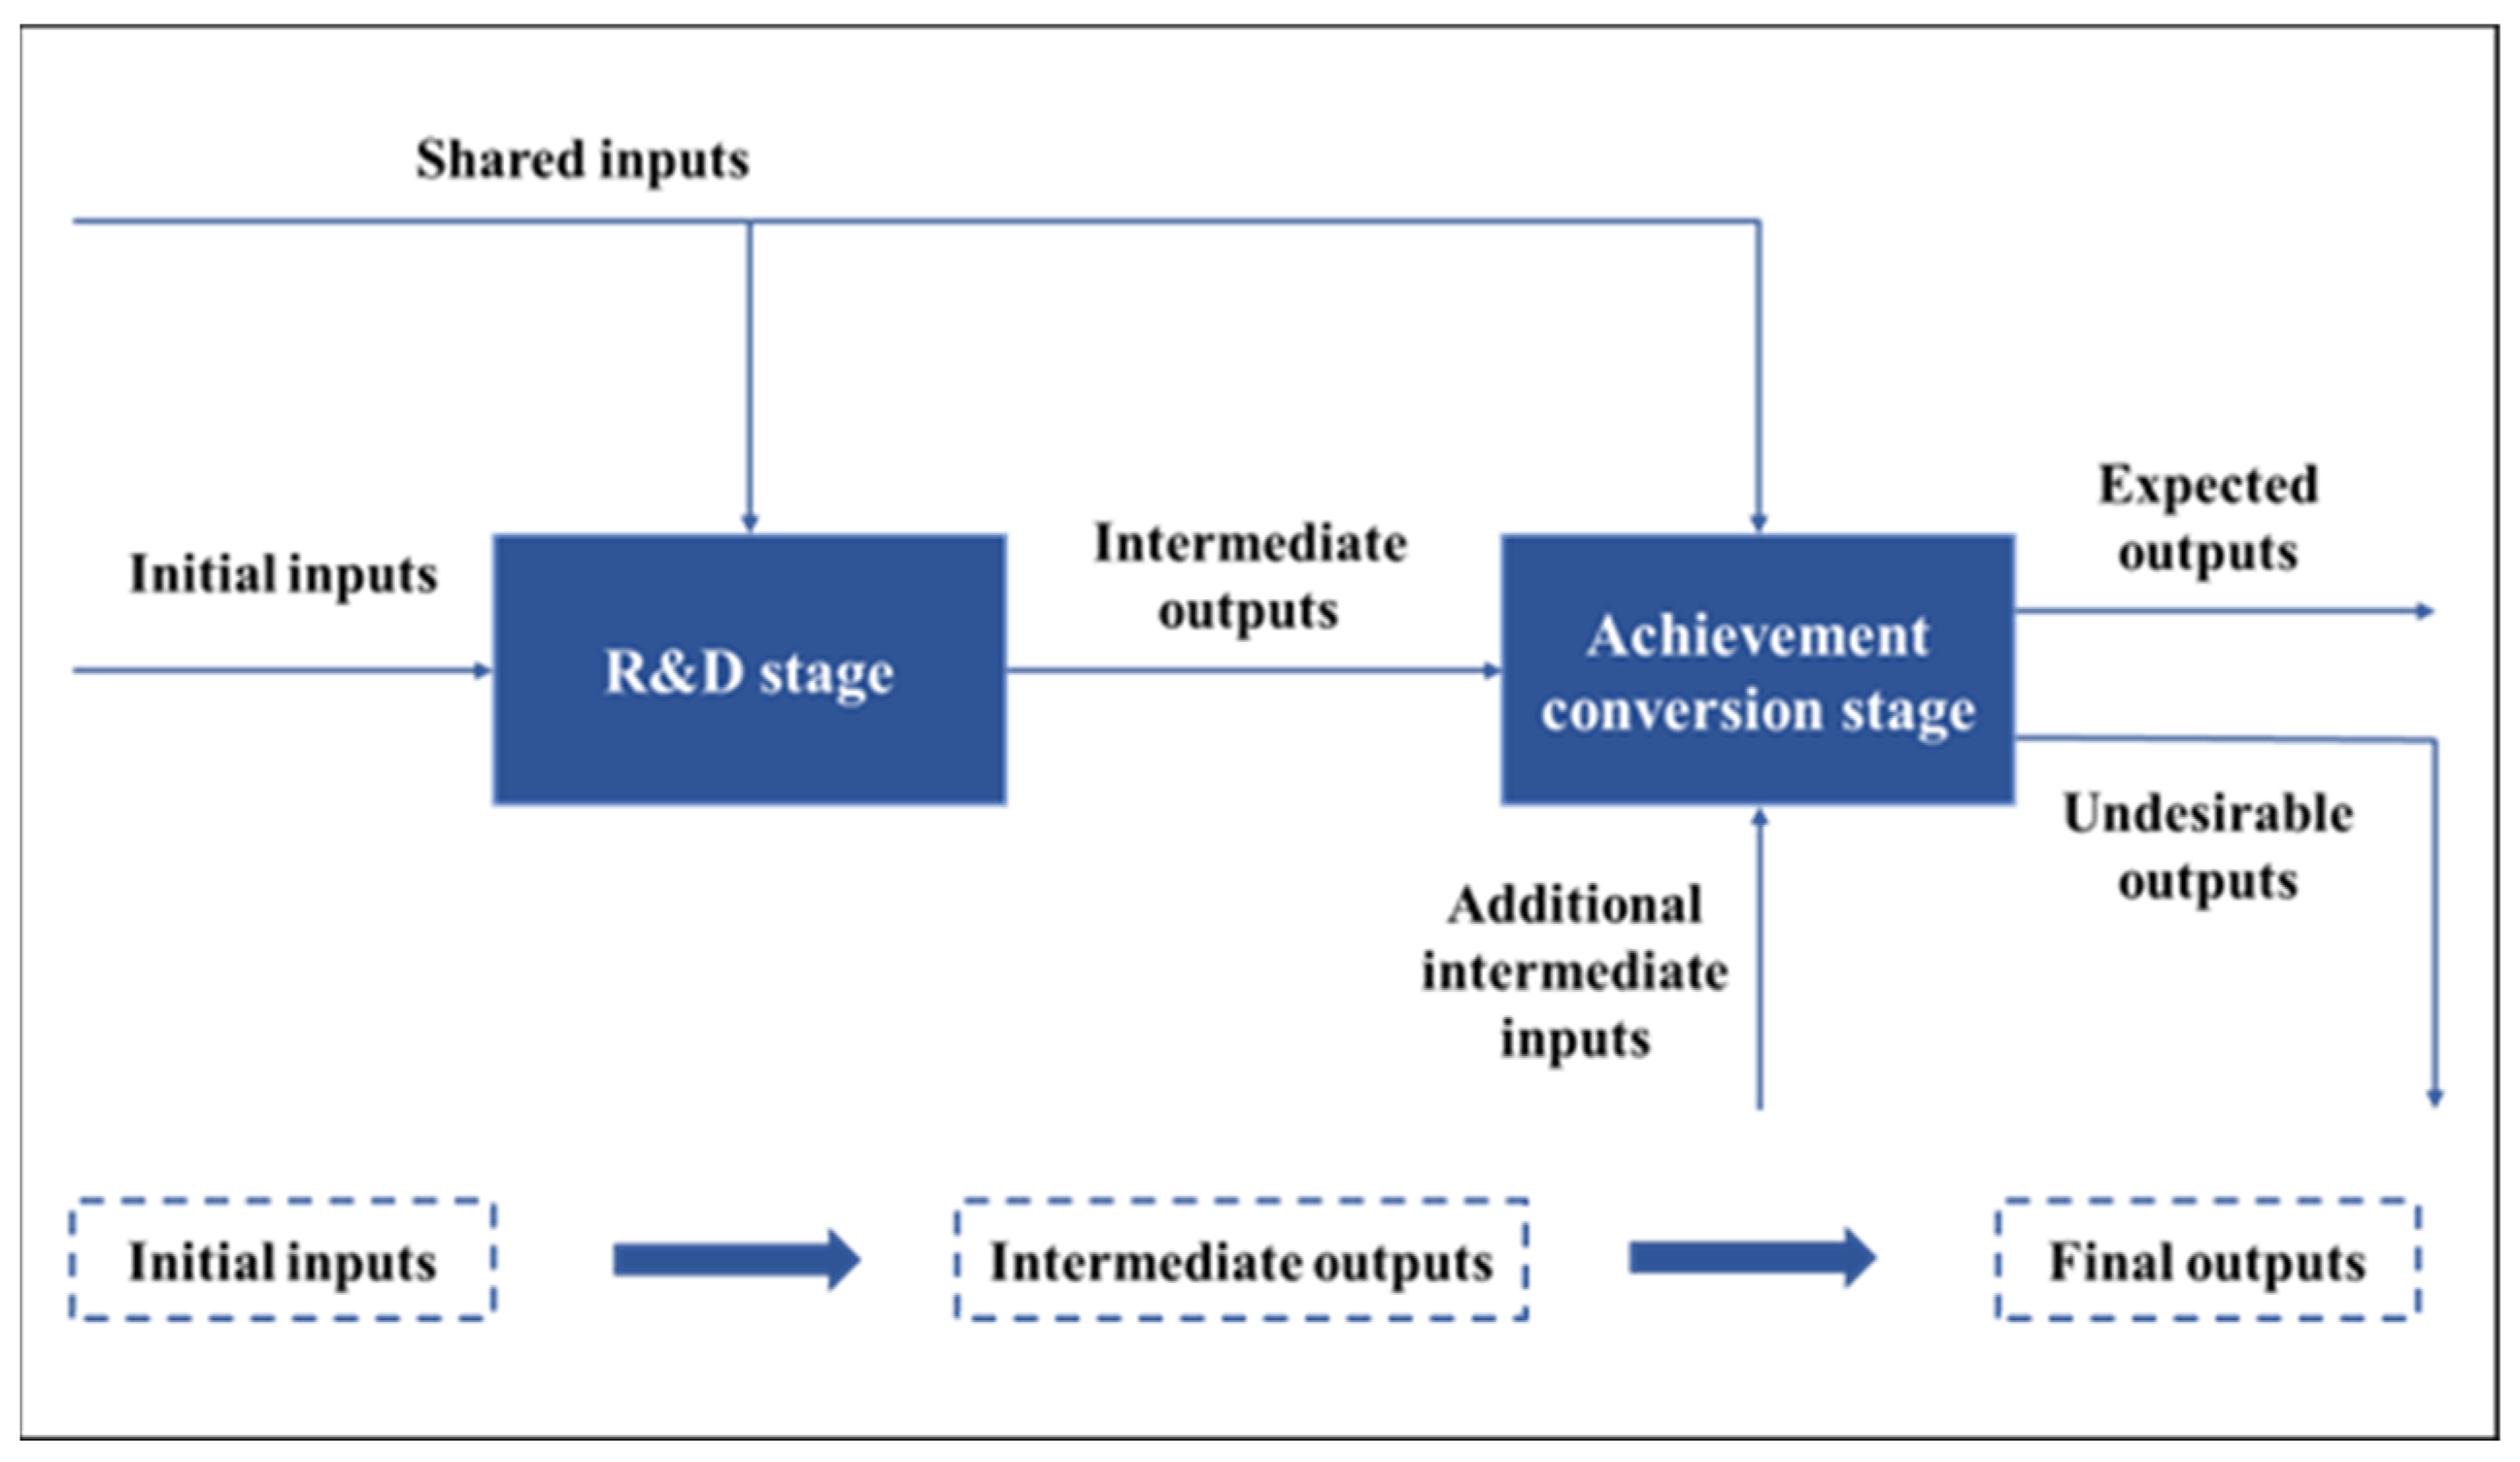
3.1.1. Green Innovation Process of Industrial Enterprises
3.1.2. Design of Green Innovation Efficiency Evaluation Index
- (1)
- Inputs and outputs in the R&D stage
- (2)
- Inputs and outputs in the achievement conversion stage
3.1.3. An Improved Relational Two-Stage DEA Model
3.2. Research Methods on Regional Disparities of Green Innovation Efficiency
3.2.1. Dagum Gini Coefficient and Its Decomposition
3.2.2. Kernel Density Estimation
3.3. Methodology for Assessing the Convergence of Green Innovation Efficiency
- (1)
- σ Convergence
- (2)
- β Convergence
3.4. Sample Selection and Data Sources
4. Results
4.1. Results of Green Innovation Efficiency Measurement
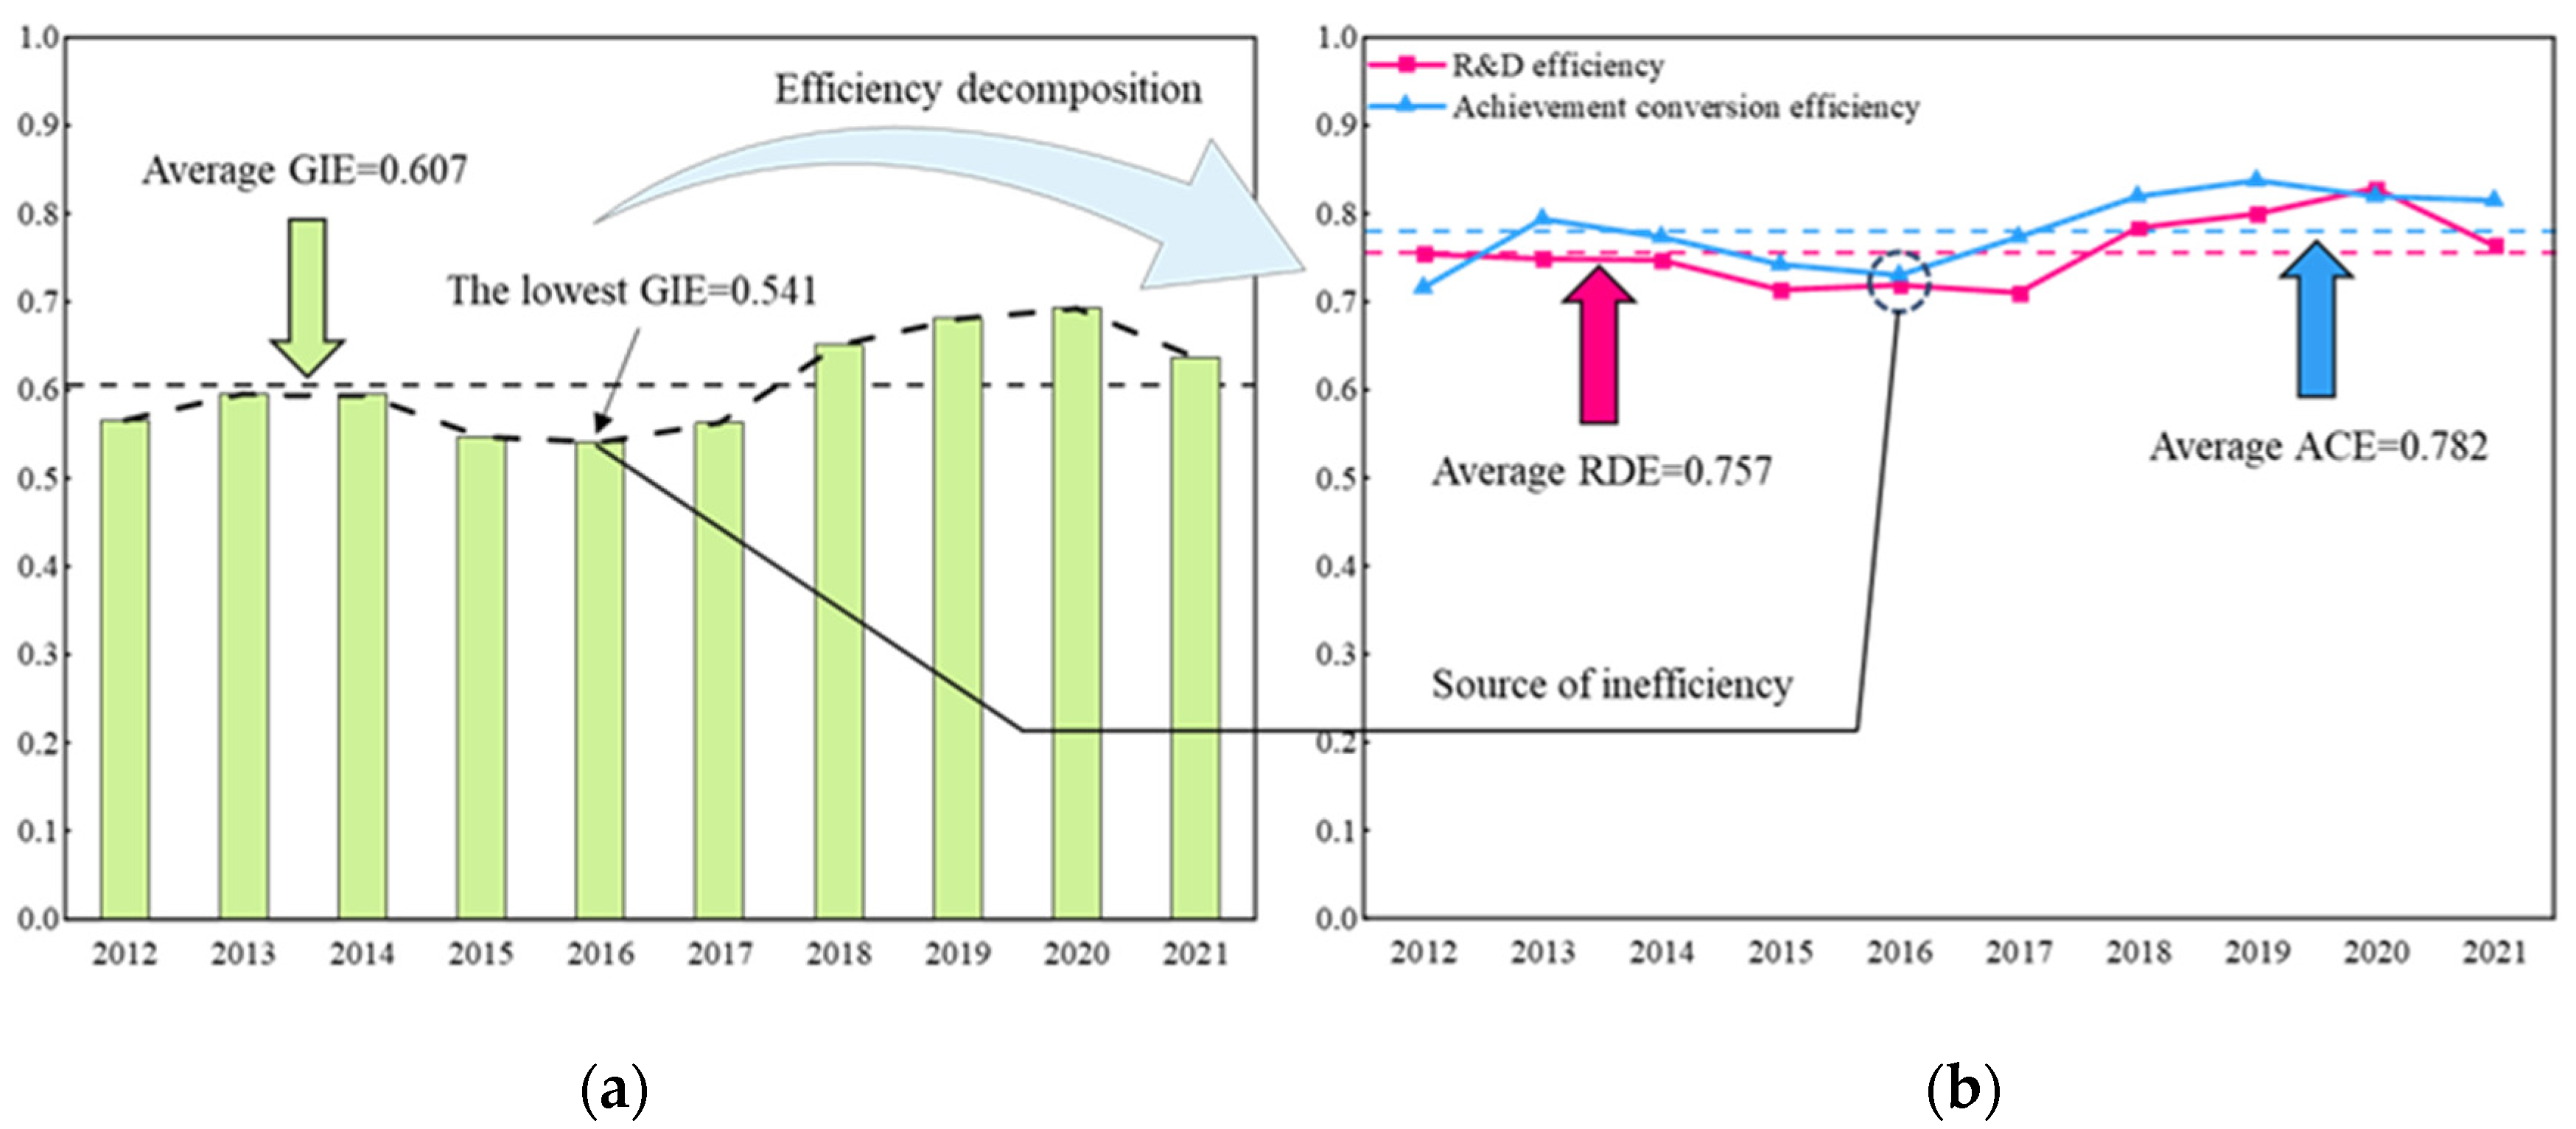
4.1.1. National-Level Analysis
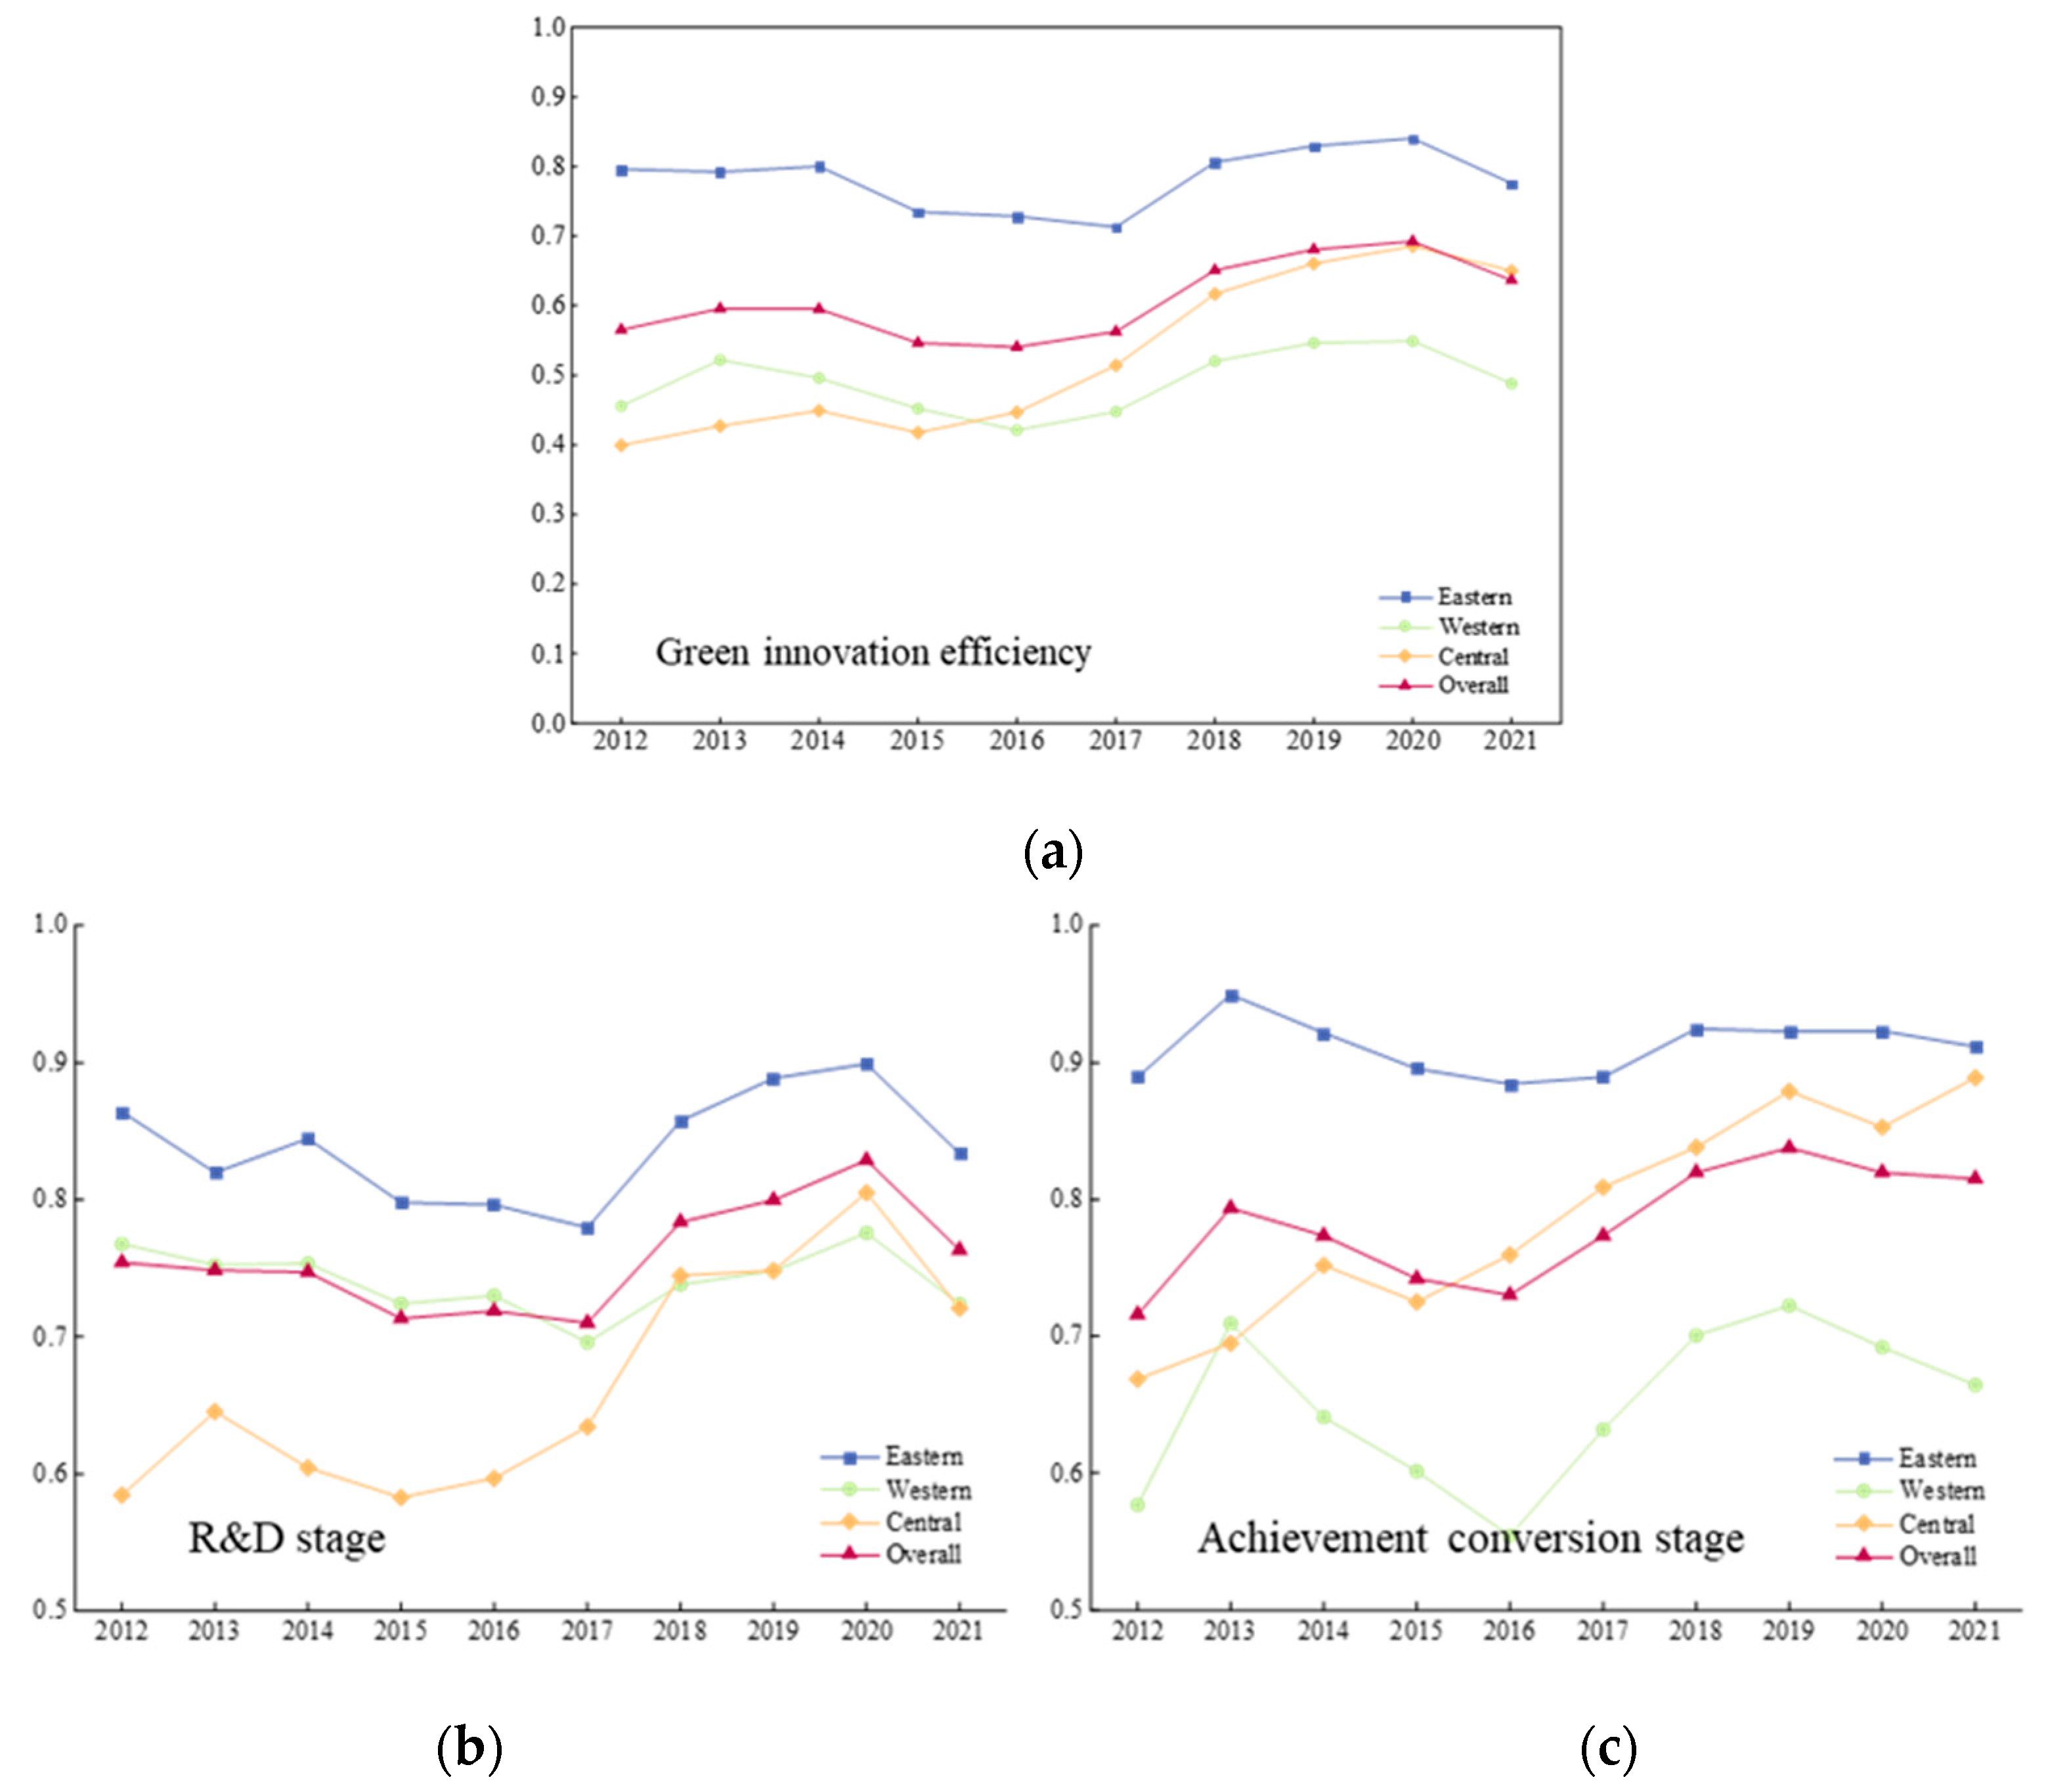
4.1.2. Regional-Level Analysis
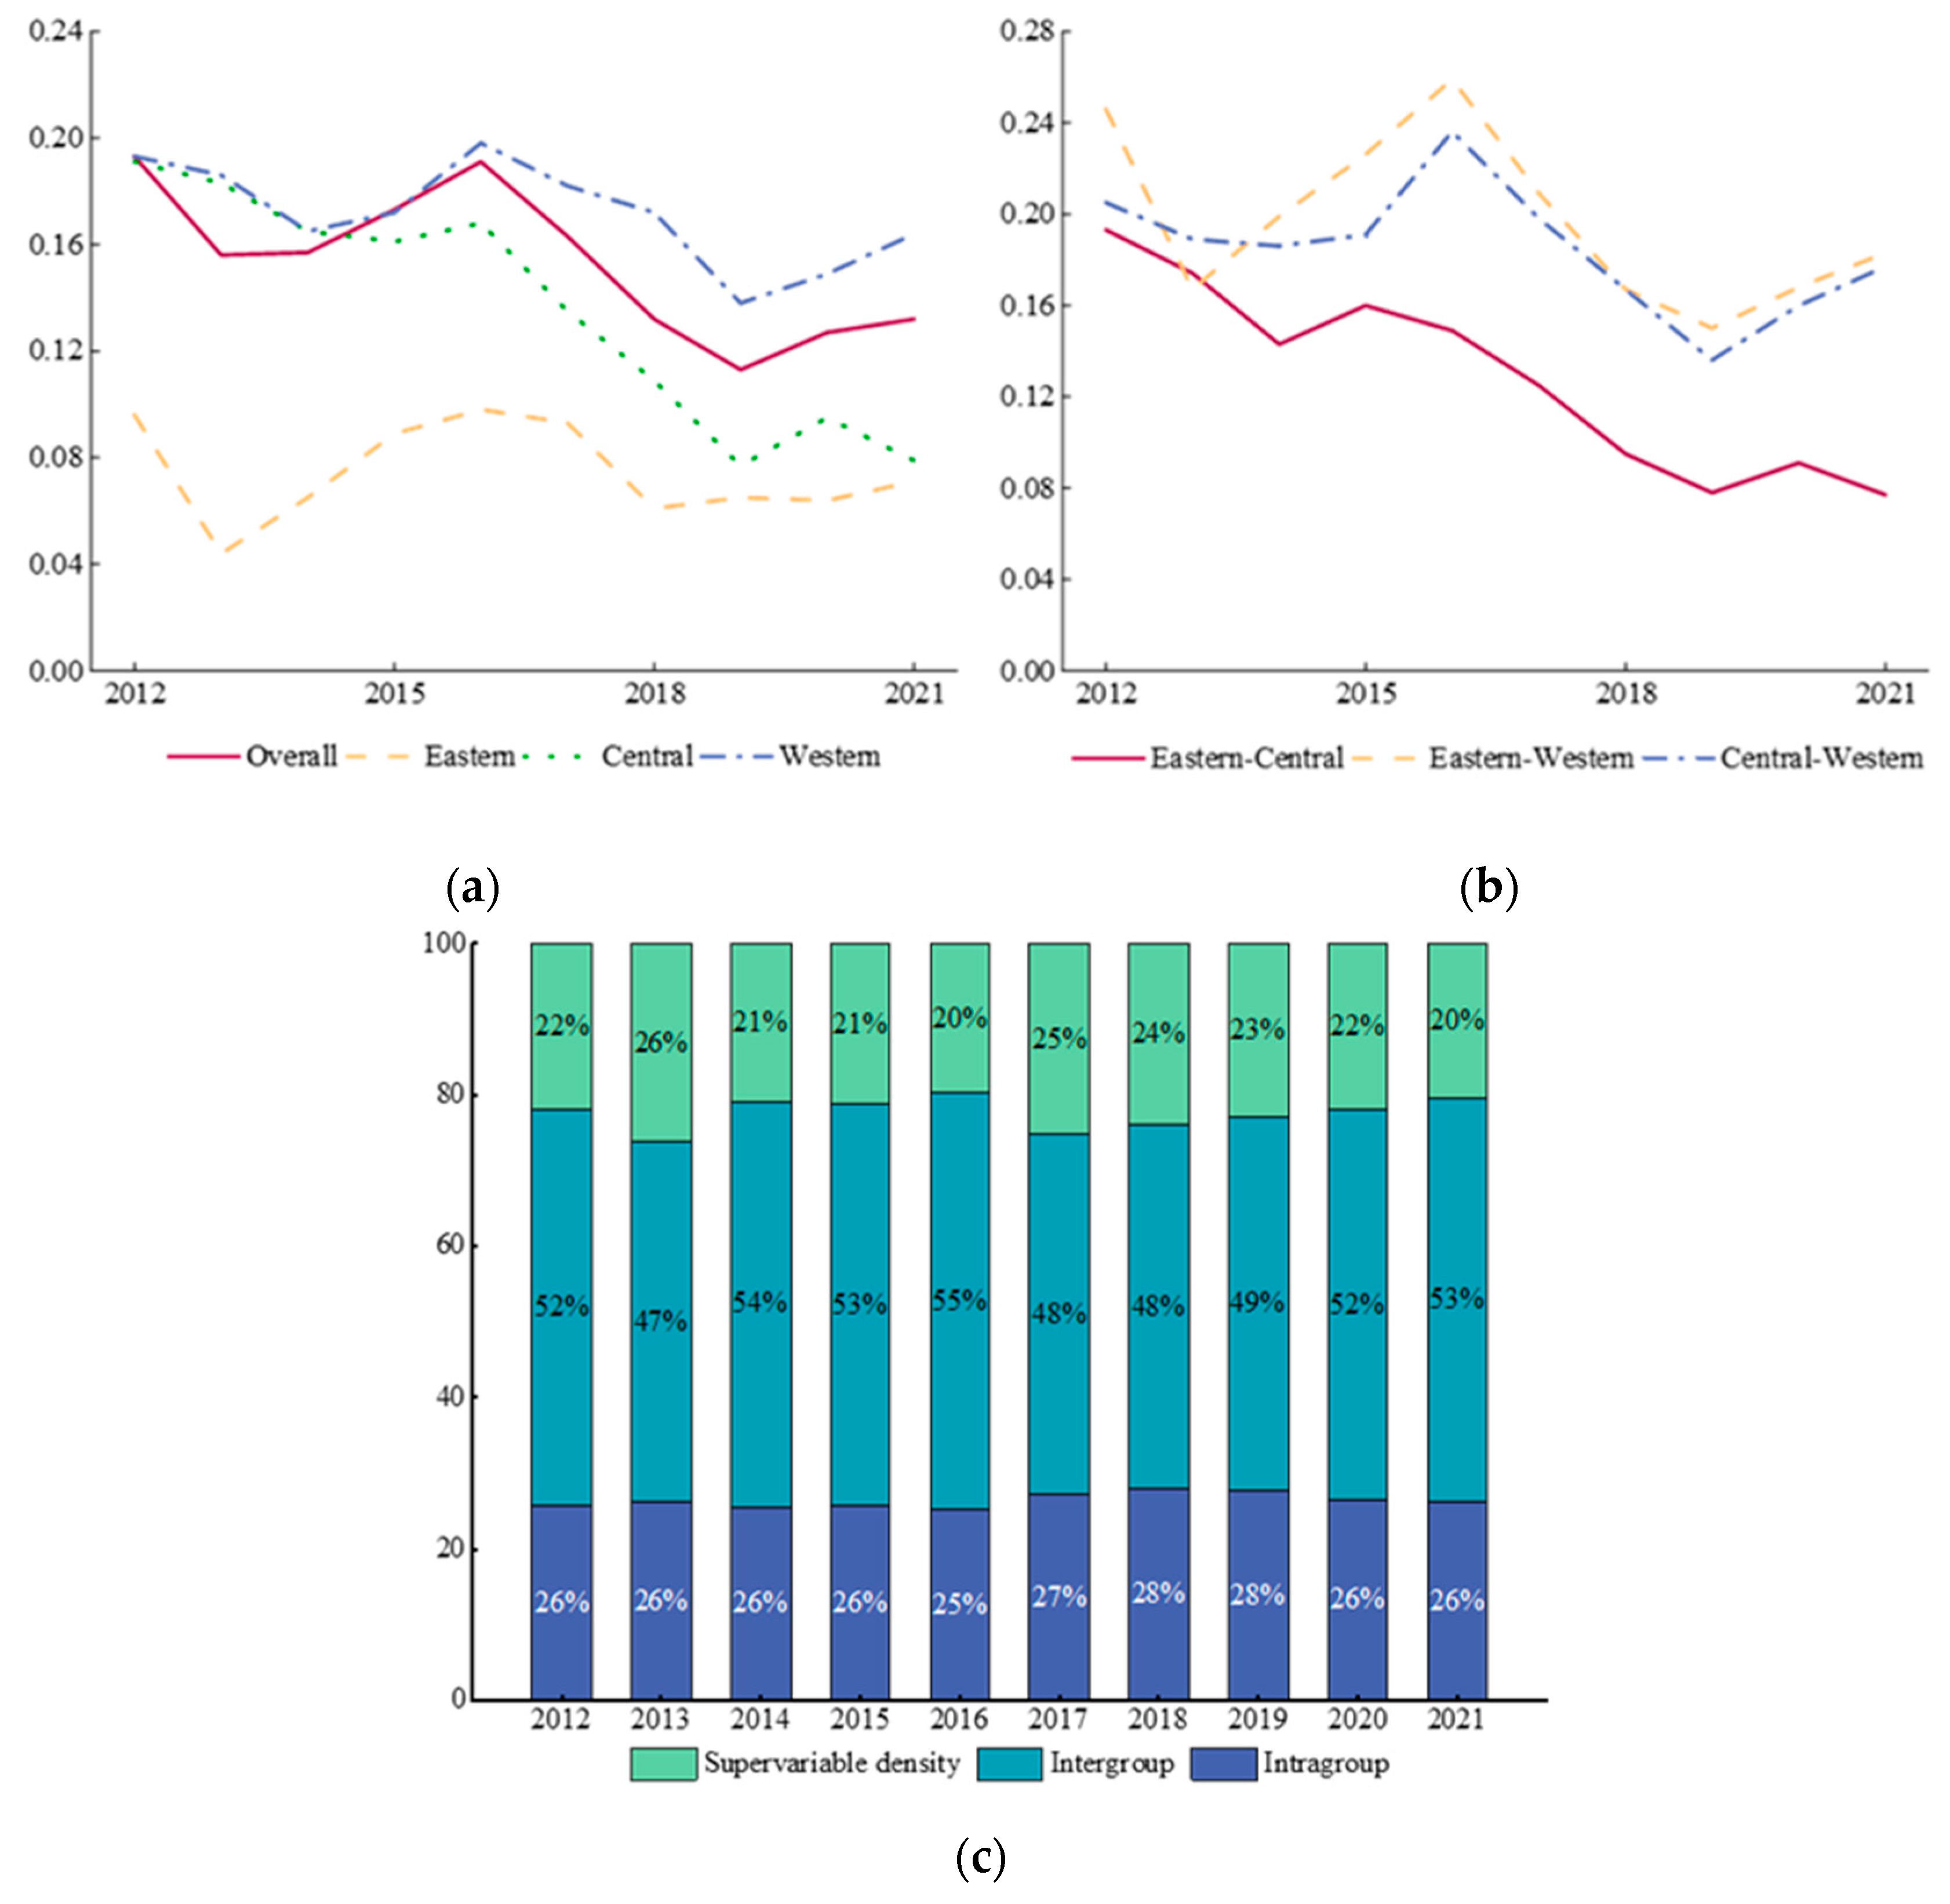
4.2. Regional Disparities in Green Innovation Efficiency and Its Decomposition
4.2.1. Regional Disparities in R&D Efficiency and Its Decomposition
4.2.2. Regional Disparities in Achievement Conversion Efficiency and Its Decomposition
4.3. Dynamic Evolution of Green Innovation Efficiency
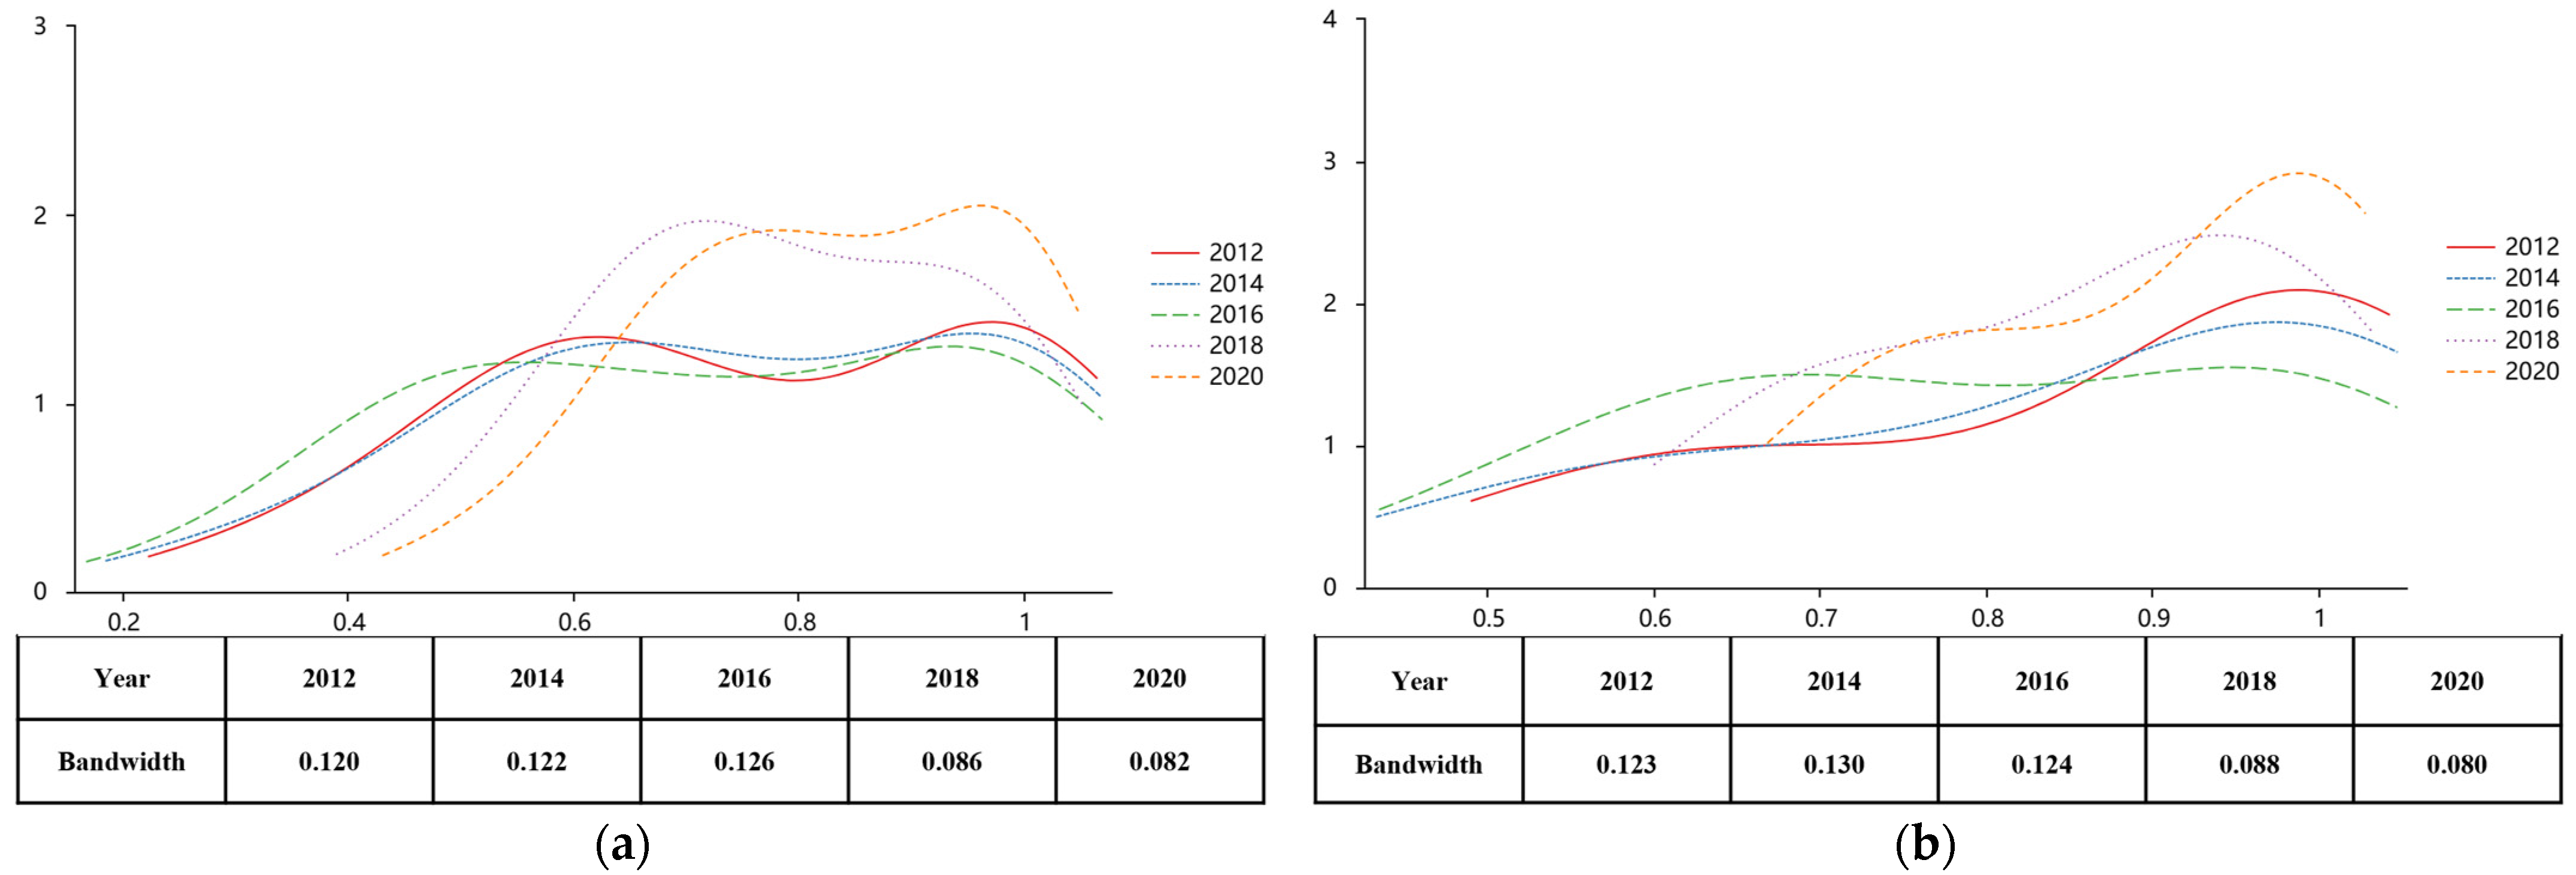
4.3.1. Dynamic Evolution of R&D Efficiency
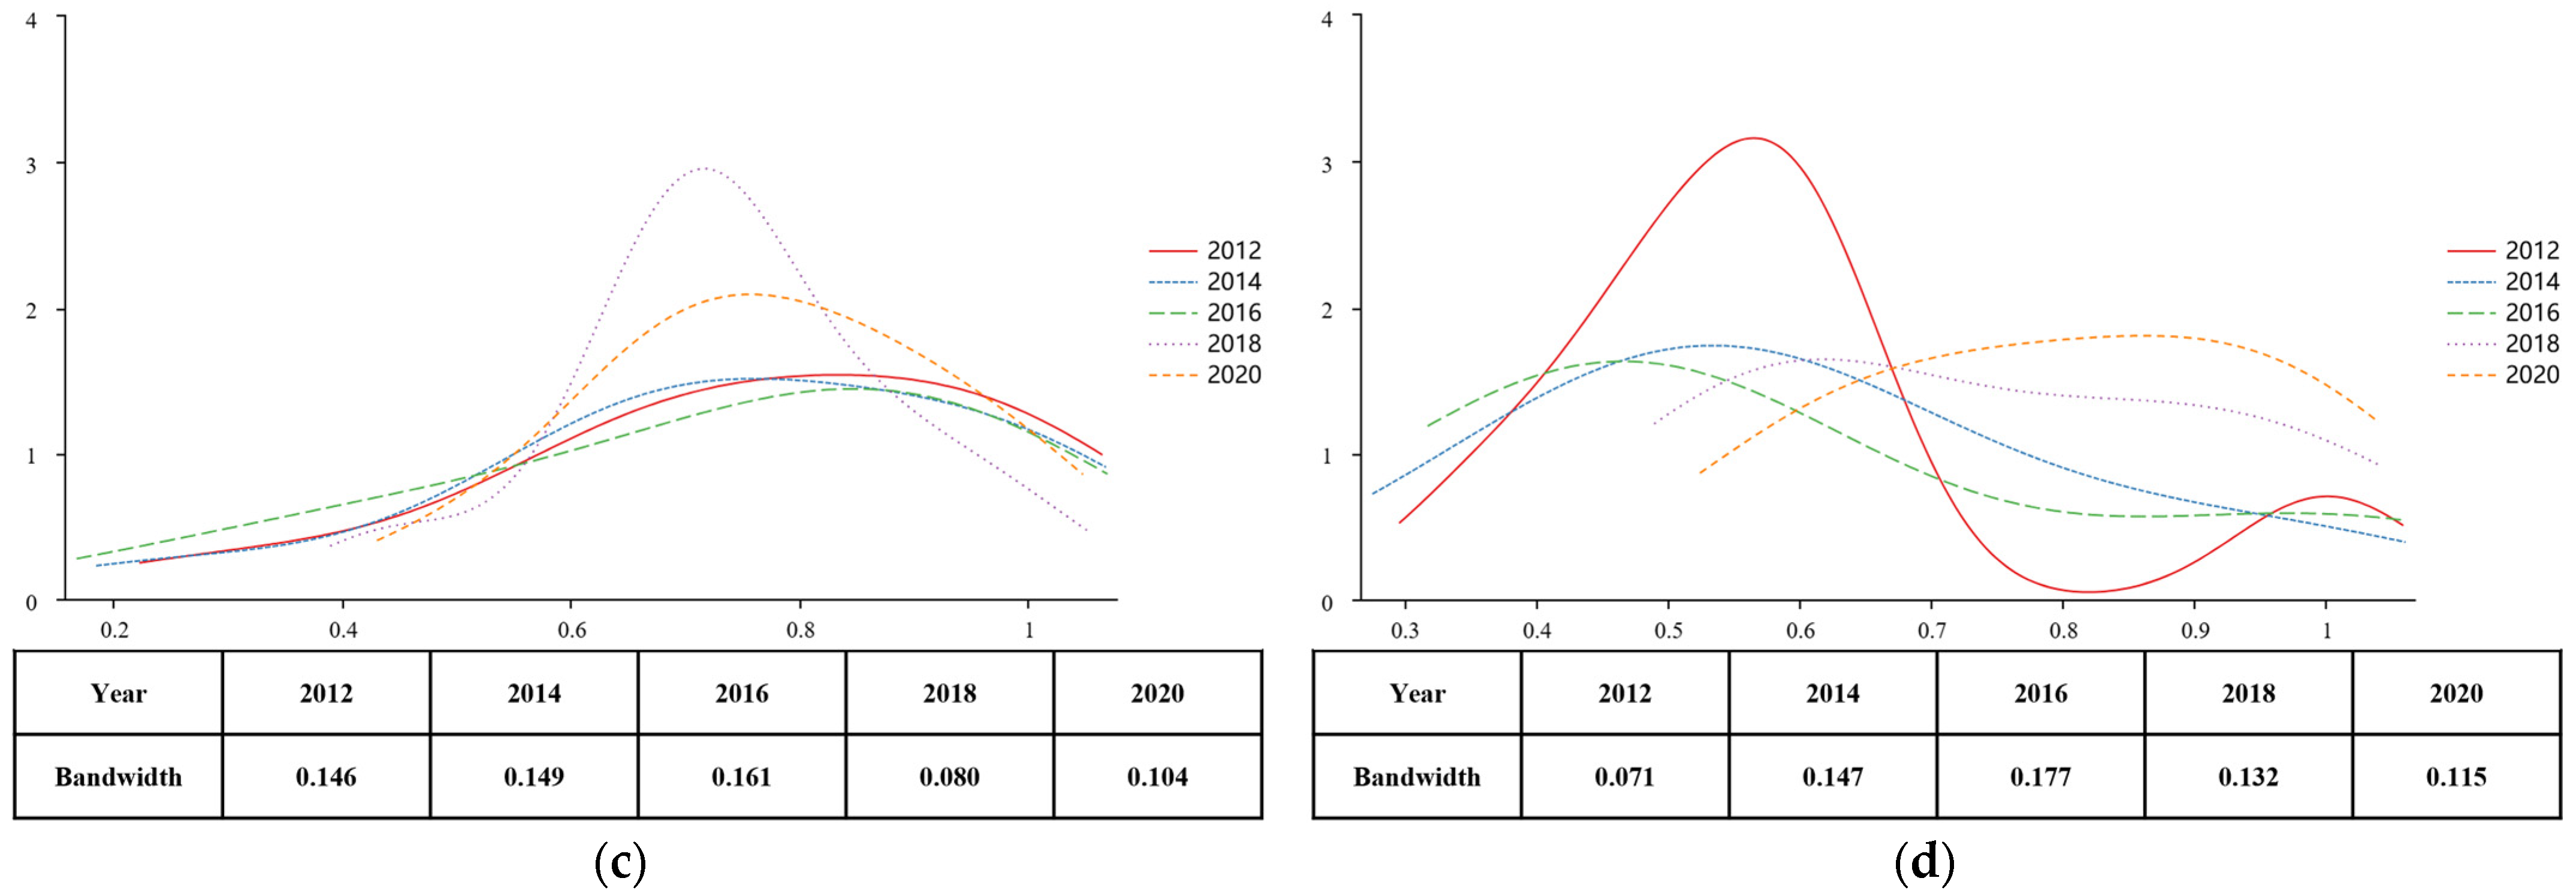
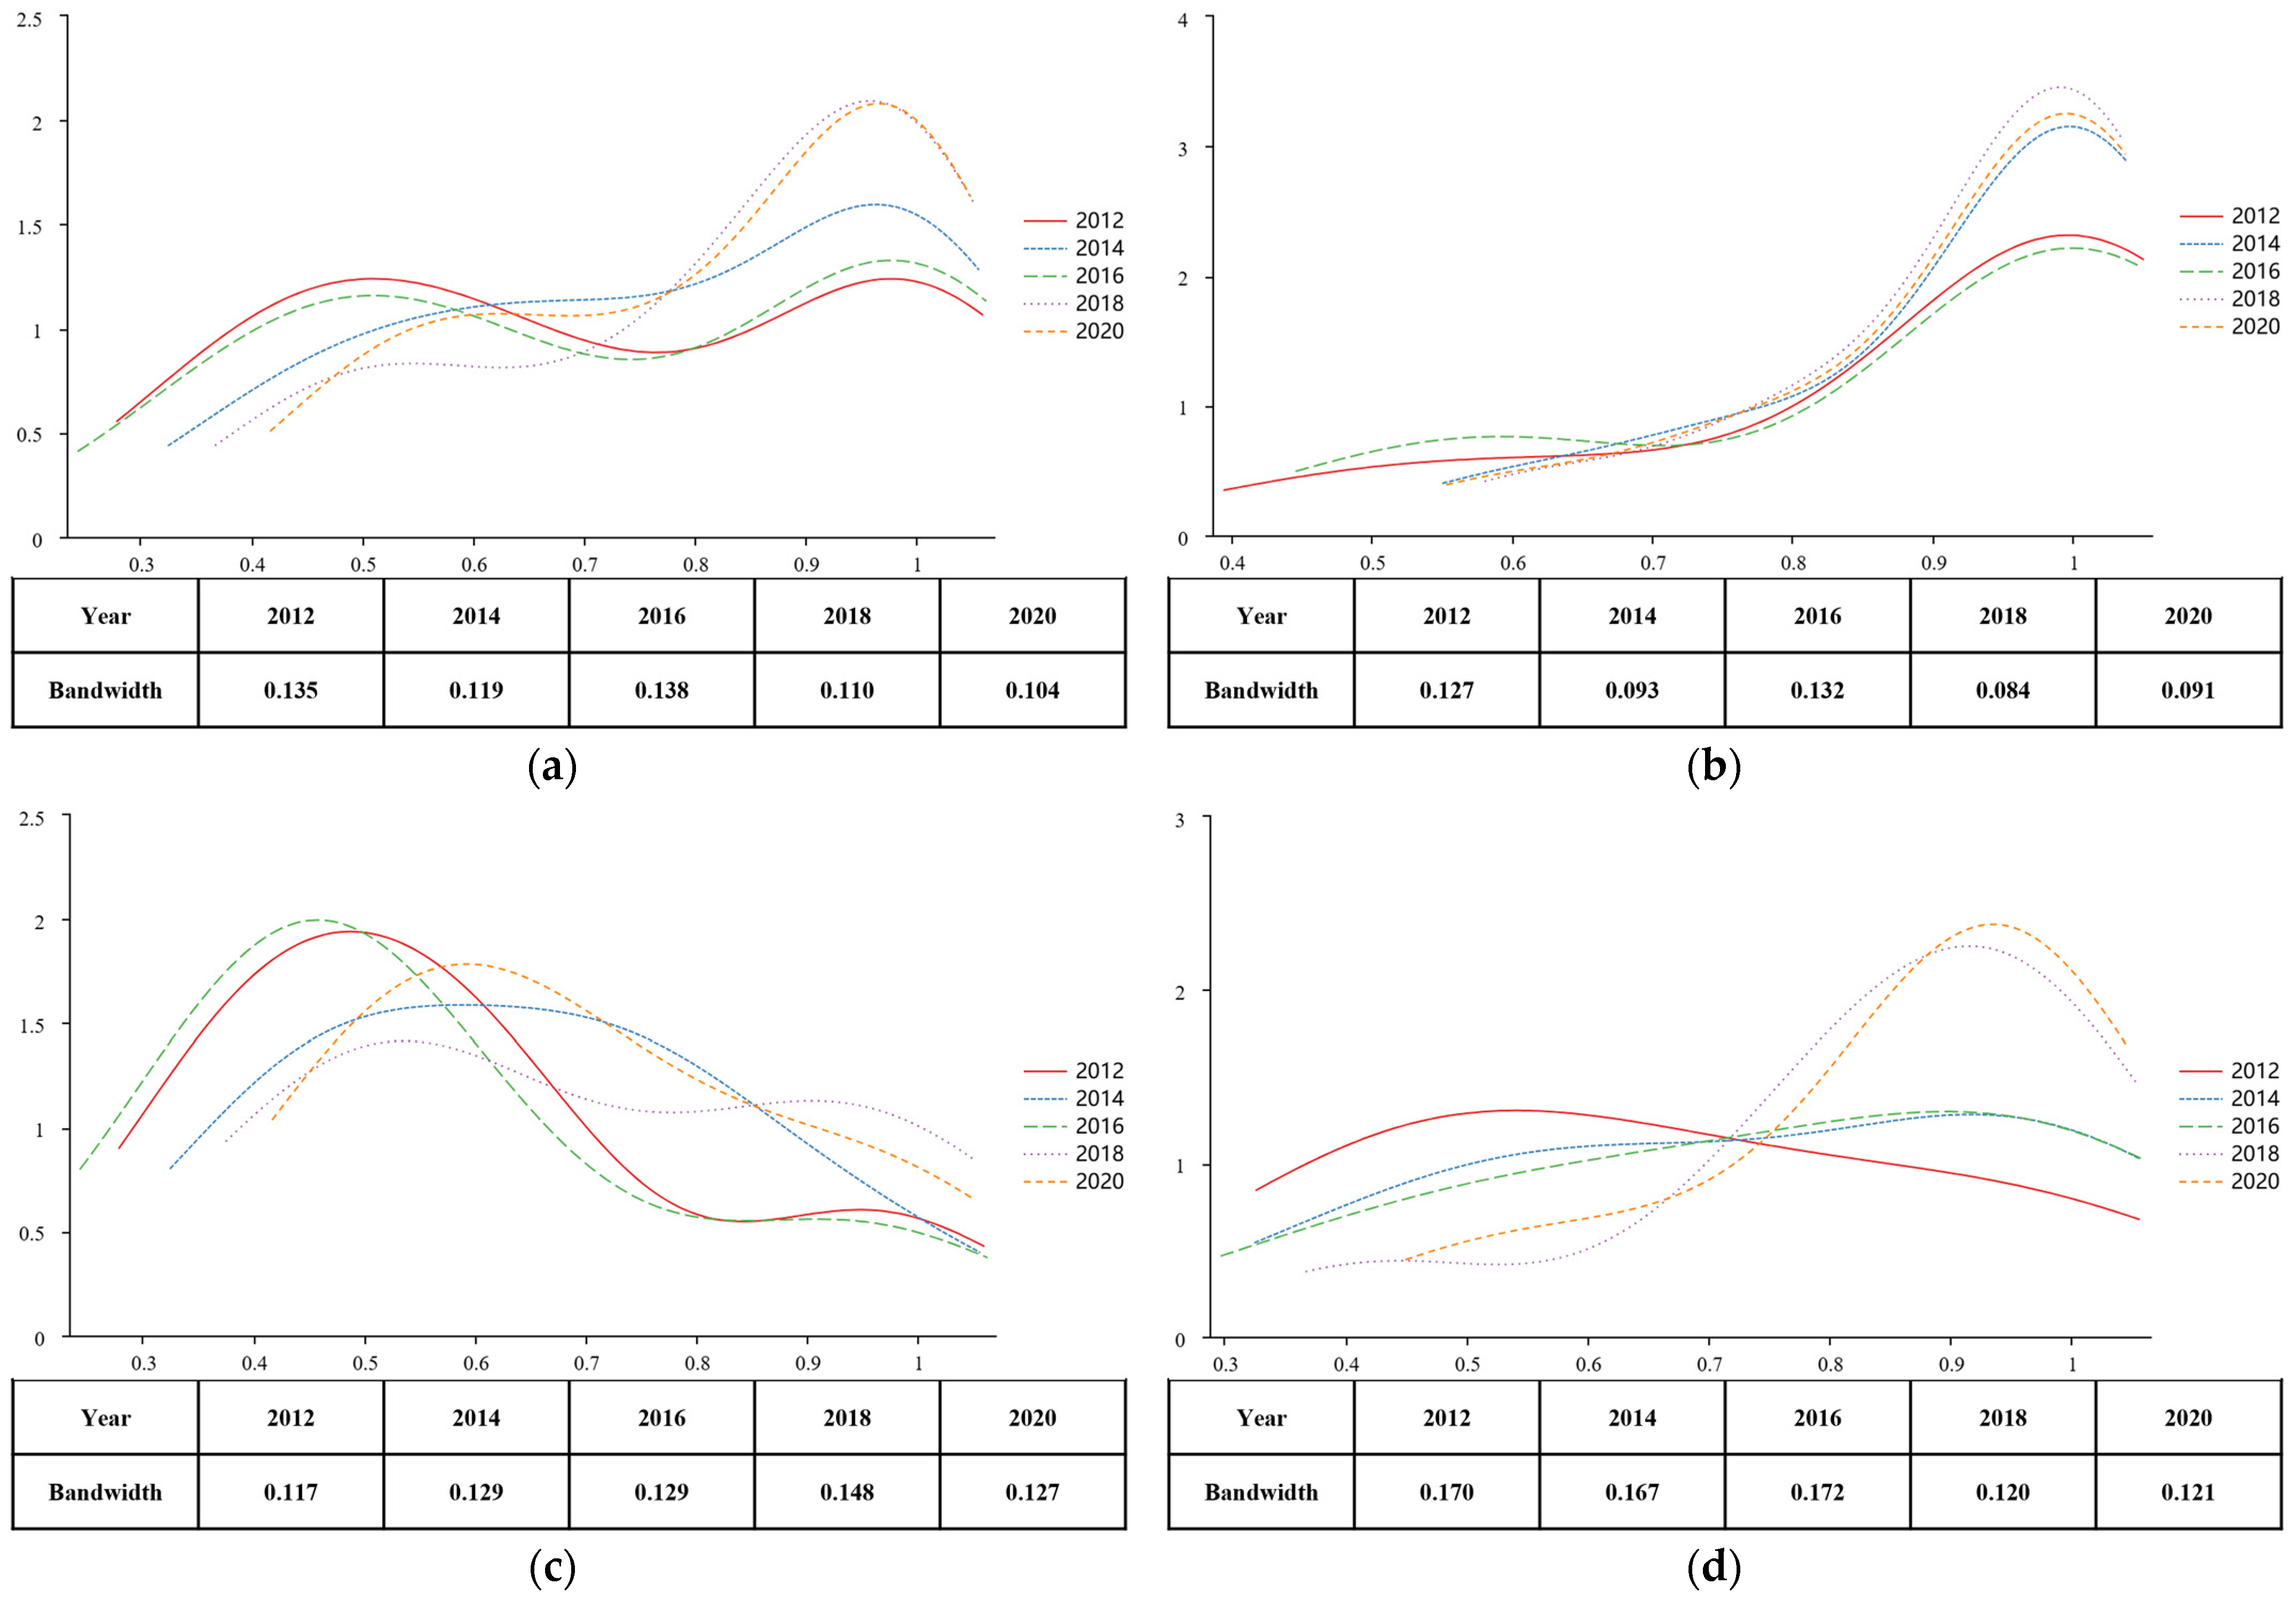
4.3.2. Dynamic Evolution of Achievement Conversion Efficiency
4.4. Convergence Analysis of Green Innovation Efficiency
4.4.1. Convergence Analysis of R&D Efficiency
- (1)
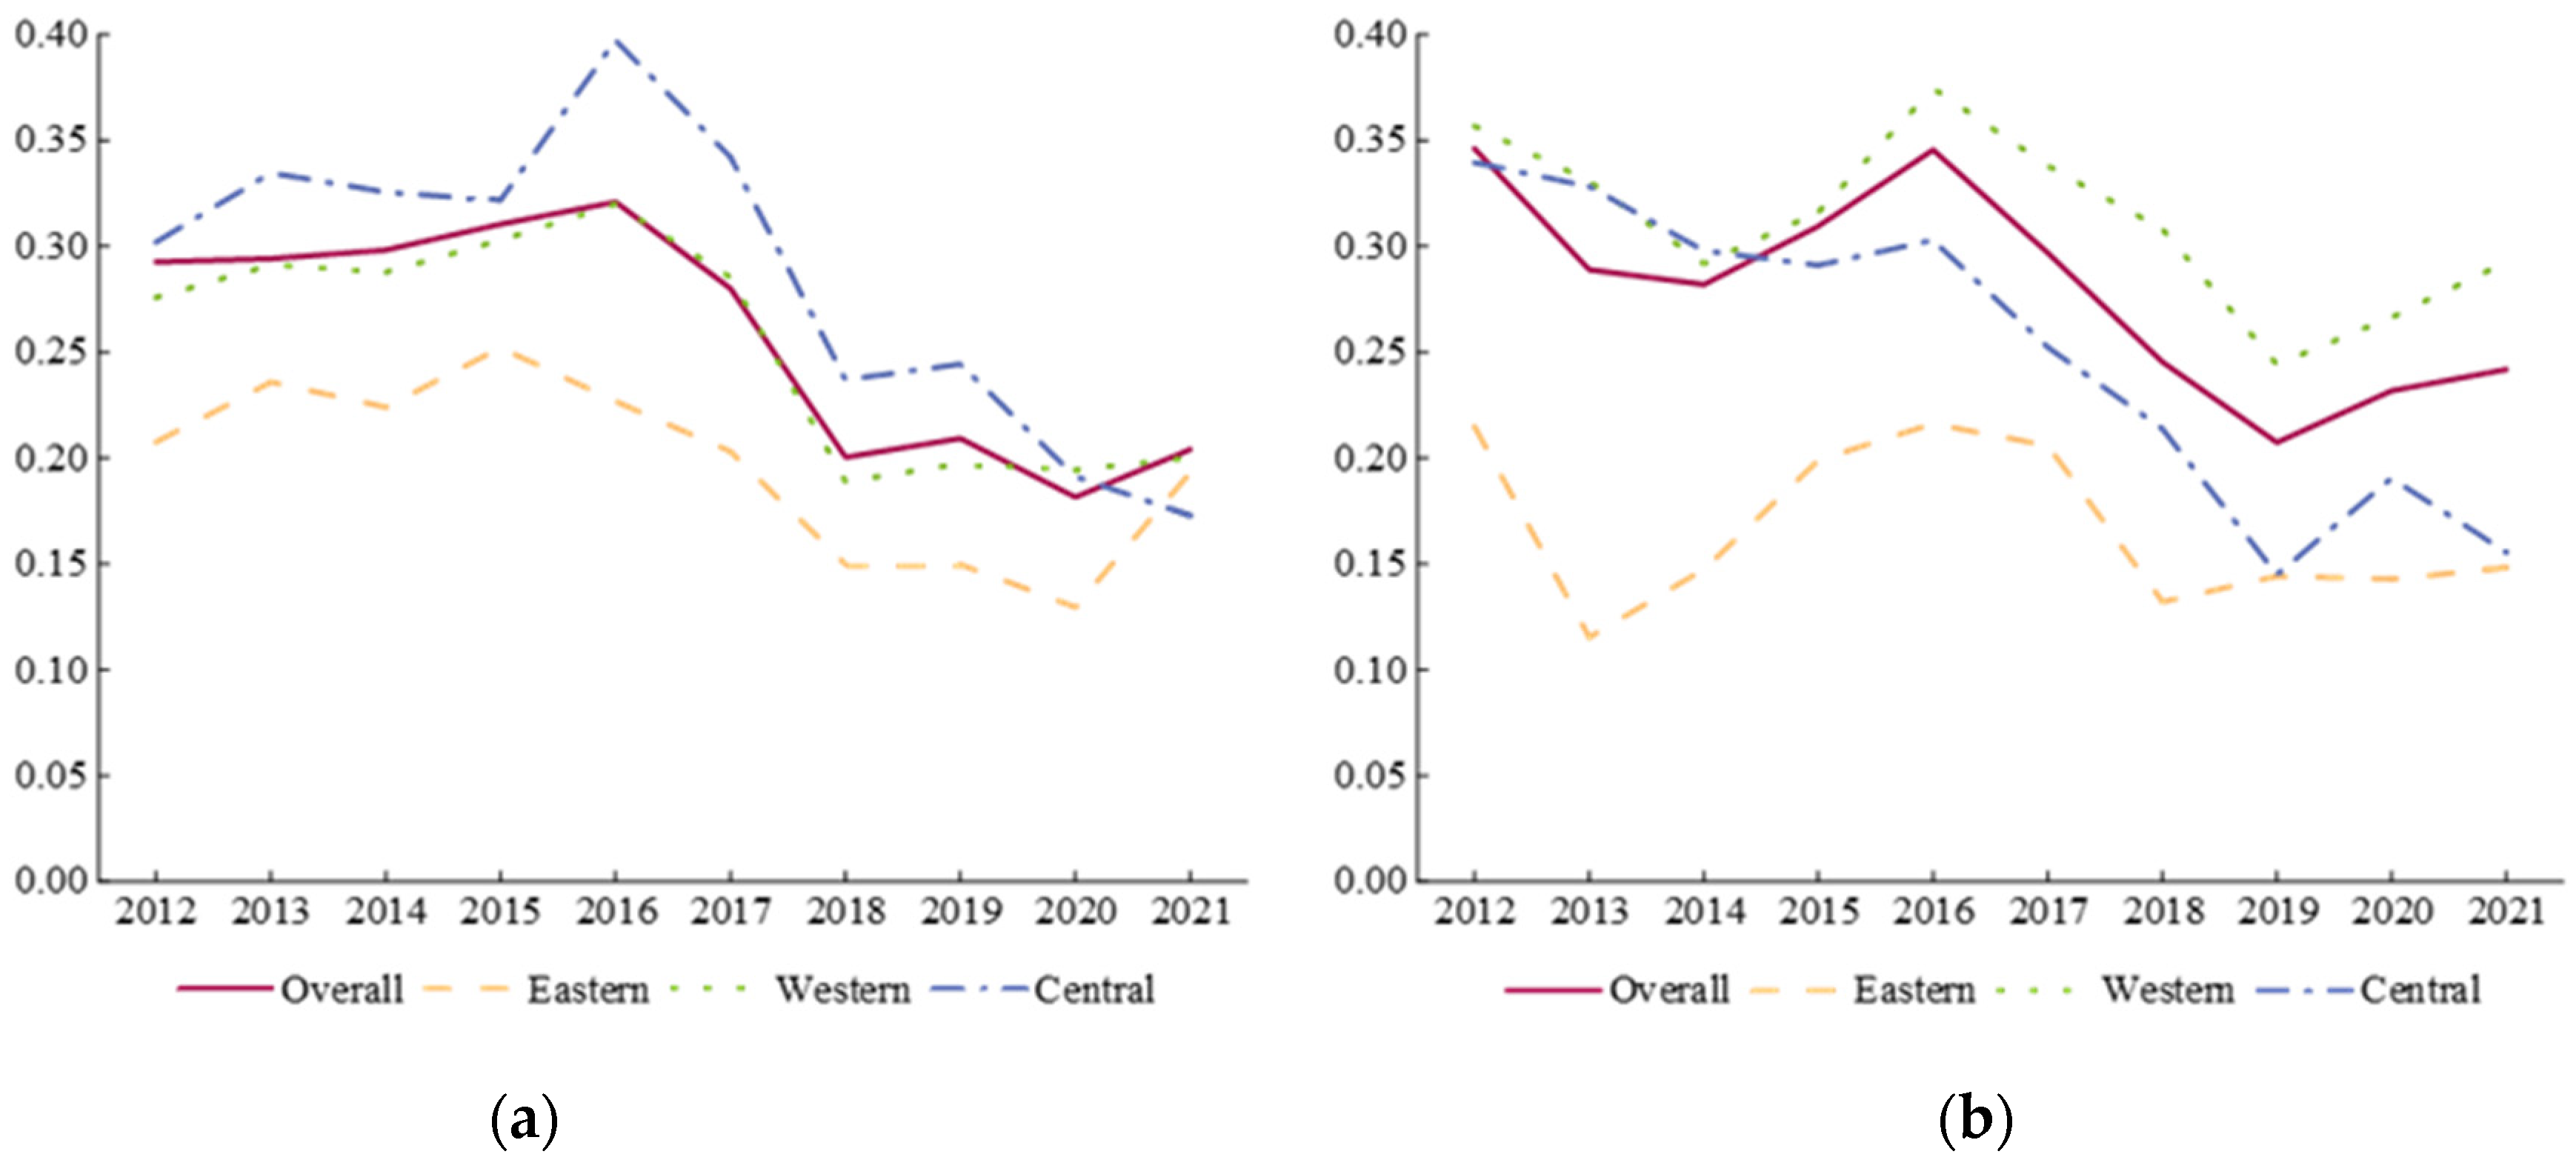
- σ Convergence
- (2)
- β Convergence
4.4.2. Convergence Analysis of Achievement Conversion Efficiency
- (1)
- σ Convergence
- (2)
- β Convergence
5. Discussion
6. Conclusions and Policy Recommendations
6.1. Conclusions
- (1)
- The average GIE of industrial enterprises in China as a whole demonstrates a fluctuating upward trend, and there is potential for further improvement. The low RDE and ACE have become common factors constraining the improvement of GIE in industrial enterprises. Particular attention should be directed toward improving RDE, given that it consistently lags behind ACE across most periods. The eastern region consistently exhibits the highest two-stage efficiency, positioning it as the frontrunner in green innovation. In contrast, the central and western regions are catching up, with the central region demonstrating the fastest rate of improvement in two-stage efficiency.
- (2)
- From the perspective of relative differences, the GIE of Chinese industrial enterprises exhibits characteristics of spatial disequilibrium. The primary source of the overall disparity in RDE has shifted from interregional differences to super-variable density, while the primary contributor to the overall disparity in ACE is still interregional differences, with the largest differences between the eastern and western regions. The Gini coefficients of RDE and ACE for the whole country and the three regions demonstrate a downward trend during the study period, indicating mitigation of regional disparities.
- (3)
- From the perspective of σ convergence, the coefficients of variation of RDE and ACE in the whole country and the three regions show a decreasing trend. Among them, the convergence rate in the central region is the fastest. Considering β convergence, significant absolute and conditional β convergence can be observed in the whole country and the three regions. Their conditional β convergence rate is greater than the absolute β convergence rate, corresponding to a shorter half-life cycle. When considering control variables, the degree of openness, economic level, and industrial structure were found to significantly impact the convergence of the two-stage efficiency of green innovation in industrial enterprises. The coefficients and significance of these variables are heterogeneous across different regions and stages of green innovation.
6.2. Policy Recommendations
- (1)
- Enhance the awareness of green innovation and foster an environment conducive to green innovation. The government should enhance the market mechanism and bolster enterprises’ enthusiasm for independent innovation; support the research, development, and application of green technology; and encourage enterprises to increase investment in green innovation. Efforts should be made to improve the efficiency of R&D, address the deficiencies in green innovation, and ensure the effective transformation of R&D results into productive forces. Simultaneously, stringent environmental protection standards should be established to compel industrial enterprises to reduce their pollution emissions and improve the efficiency of green innovation on the whole.
- (2)
- Reinforce regional connectivity and enhance its leading and driving roles. There are significant regional disparities in green innovation efficiency among industrial enterprises in China. To achieve high efficiency of green innovation in both stages, it is essential to overcome technological and resource flow barriers between regions and take the development path of high driving low. The eastern region has been at the forefront of green innovation, yielding remarkable results and accumulating advanced experience in ecological governance, innovation-driven development, and industrial transformation and upgrading. This experience can serve as a reference and complement for other regions. The green innovation highland can be built by strengthening the radiation-driven role of Beijing, Shanghai, Zhejiang, Guangdong, and other key provinces and cities, and the development of green innovation integration can be gradually promoted.
- (3)
- Combined with the resources and policy advantages, green innovation efficiency should be enhanced with differentiated development. The resource endowment and fundamental conditions for the development of green innovation in industrial enterprises vary across different regions, leading to objective spatial imbalances in green innovation efficiency. Achieving regional coordinated development depends not only on reducing these spatial imbalances but also on understanding the characteristics of industrial green innovation in each region and leveraging their respective advantages to forge distinct paths of green innovation. The government should align regional resource endowments, enhance interregional complementary cooperation, and formulate strategies for differentiated and coordinated development. All regions should fully leverage their local advantages, cultivate competitive industries, and pursue a path of harmonious yet diverse development.
Author Contributions
Funding
Institutional Review Board Statement
Informed Consent Statement
Data Availability Statement
Conflicts of Interest
References
- Li, D.; Cao, C.; Zhang, L.; Chen, X.; Ren, S.; Zhao, Y. Effects of corporate environmental responsibility on financial performance: The moderating role of government regulation and organizational slack. J. Clean. Prod. 2017, 166, 1323–1334. [Google Scholar] [CrossRef]
- Carayannis, E.G.; Grigoroudis, E.; Goletsis, Y. A multilevel and multistage efficiency evaluation of innovation systems: A multiobjective DEA approach. Expert Syst. Appl. 2016, 62, 63–80. [Google Scholar] [CrossRef]
- Aytekin, A.; Ecer, F.; Korucuk, S.; Karamaşa, Ç. Global innovation efficiency assessment of EU member and candidate countries via DEA-EATWIOS multi-criteria methodology. Technol. Soc. 2022, 68, 101896. [Google Scholar] [CrossRef]
- Zhao, P.; Lu, Z.; Kou, J.; Du, J. Regional differences and convergence of green innovation efficiency in China. J. Environ. Manag. 2023, 325, 116618. [Google Scholar] [CrossRef] [PubMed]
- Zhao, N.; Liu, X.; Pan, C.; Wang, C. The performance of green innovation: From an efficiency perspective. Socio-Econ. Plan. Sci. 2021, 78, 101062. [Google Scholar] [CrossRef]
- Guan, J.; Chen, K. Measuring the innovation production process: A cross-region empirical study of China’s high-tech innovations. Technovation 2010, 30, 348–358. [Google Scholar] [CrossRef]
- Li, L.-B.; Liu, B.-L.; Liu, W.-L.; Chiu, Y.H. Efficiency evaluation of the regional high-tech industry in China: A new framework based on meta-frontier dynamic DEA analysis. Socio-Econ. Plan. Sci. 2017, 60, 24–33. [Google Scholar] [CrossRef]
- Bi, K.; Huang, P.; Wang, X. Innovation performance and influencing factors of low-carbon technological innovation under the global value chain: A case of Chinese manufacturing industry. Technol. Forecast. Soc. Change 2016, 111, 275–284. [Google Scholar] [CrossRef]
- Tang, K.; Qiu, Y.; Zhou, D. Does command-and-control regulation promote green innovation performance? Evidence from China’s industrial enterprises. Sci. Total Environ. 2020, 712, 136362. [Google Scholar] [CrossRef]
- Miao, C.-L.; Meng, X.-N.; Duan, M.-M.; Wu, X.-Y. Energy consumption, environmental pollution, and technological innovation efficiency: Taking industrial enterprises in China as empirical analysis object. Environ. Sci. Pollut. Res. 2020, 27, 34147–34157. [Google Scholar] [CrossRef]
- Xu, X.L.; Chen, H.H. Exploring the innovation efficiency of new energy vehicle enterprises in China. Clean Technol. Environ. Policy 2020, 22, 1671–1685. [Google Scholar] [CrossRef]
- Wang, Q.; Hang, Y.; Sun, L.; Zhao, Z. Two-stage innovation efficiency of new energy enterprises in China: A non-radial DEA approach. Technol. Forecast. Soc. Change 2016, 112, 254–261. [Google Scholar] [CrossRef]
- Aigner, D.; Lovell, C.K.; Schmidt, P. Formulation and estimation of stochastic frontier production function models. J. Econom. 1977, 6, 21–37. [Google Scholar] [CrossRef]
- Lin, B.; Luan, R. Are government subsidies effective in improving innovation efficiency? Based on the research of China’s wind power industry. Sci. Total Environ. 2020, 710, 136339. [Google Scholar] [CrossRef] [PubMed]
- Li, G.; Wang, J.; Liu, F.; Wang, T.; Zhou, Y.; Tian, A. Regional Differences and Convergence of Technical Efficiency in China’s Marine Economy under Carbon Emission Constraints. Sustainability 2023, 15, 7632. [Google Scholar] [CrossRef]
- Charnes, A.; Cooper, W.W.; Rhodes, E. Measuring the efficiency of decision making units. Eur. J. Oper. Res. 1978, 2, 429–444. [Google Scholar] [CrossRef]
- Hashimoto, A.; Haneda, S. Measuring the change in R&D efficiency of the Japanese pharmaceutical industry. Res. Policy 2008, 37, 1829–1836. [Google Scholar]
- Fang, Z.; Razzaq, A.; Mohsin, M.; Irfan, M. Spatial spillovers and threshold effects of internet development and entrepreneurship on green innovation efficiency in China. Technol. Soc. 2022, 68, 101844. [Google Scholar] [CrossRef]
- Luo, Q.; Miao, C.; Sun, L.; Meng, X.; Duan, M. Efficiency evaluation of green technology innovation of China’s strategic emerging industries: An empirical analysis based on Malmquist-data envelopment analysis index. J. Clean. Prod. 2019, 238, 117782. [Google Scholar] [CrossRef]
- Namazi, M.; Mohammadi, E. Natural resource dependence and economic growth: A TOPSIS/DEA analysis of innovation efficiency. Resour. Policy 2018, 59, 544–552. [Google Scholar] [CrossRef]
- Qiu, L.; Yu, R.; Hu, F.; Zhou, H.; Hu, H. How can China’s medical manufacturing listed firms improve their technological innovation efficiency? An analysis based on a three-stage DEA model and corporate governance configurations. Technol. Forecast. Soc. Change 2023, 194, 122684. [Google Scholar] [CrossRef]
- Min, S.; Kim, J.; Sawng, Y.-W. The effect of innovation network size and public R&D investment on regional innovation efficiency. Technol. Forecast. Soc. Change 2020, 155, 119998. [Google Scholar]
- Yang, H.; Zhang, X.; Liu, B.; Huang, Y. Evaluation of green low-carbon innovation development efficiency: An improved two-stage non-cooperative DEA model. J. Clean. Prod. 2023, 400, 136662. [Google Scholar] [CrossRef]
- An, Q.; Meng, F.; Xiong, B.; Wang, Z.; Chen, X. Assessing the relative efficiency of Chinese high-tech industries: A dynamic network data envelopment analysis approach. Ann. Oper. Res. 2020, 290, 707–729. [Google Scholar] [CrossRef]
- Tidd, J.; Bessant, J.R. Managing Innovation: Integrating Technological, Market and Organizational Change; John Wiley & Sons: Hoboken, NJ, USA, 2020. [Google Scholar]
- Paradi, J.C.; Rouatt, S.; Zhu, H. Two-stage evaluation of bank branch efficiency using data envelopment analysis. Omega 2011, 39, 99–109. [Google Scholar] [CrossRef]
- Zhang, Y.; Wang, S. Influence of marine industrial agglomeration and environmental regulation on marine innovation efficiency—From an innovation value chain perspective. Mar. Policy 2021, 134, 104807. [Google Scholar] [CrossRef]
- Wang, K.; Huang, W.; Wu, J.; Liu, Y.-N. Efficiency measures of the Chinese commercial banking system using an additive two-stage DEA. Omega 2014, 44, 5–20. [Google Scholar] [CrossRef]
- Kao, C.; Hwang, S.-N. Efficiency decomposition in two-stage data envelopment analysis: An application to non-life insurance companies in Taiwan. Eur. J. Oper. Res. 2008, 185, 418–429. [Google Scholar] [CrossRef]
- Dagum, C. A new approach to the decomposition of the Gini income inequality ratio. In Income Inequality, Poverty, and Economic Welfare; Springer: Berlin/Heidelberg, Germany, 1998. [Google Scholar]
- Liu, F.; Nan, T.; Wang, X. Causes and evolution characteristics of green innovation efficiency loss: The perspective of factor mismatch under local government competition. Sustainability 2022, 14, 8338. [Google Scholar] [CrossRef]
- Tang, K.; Xiong, C.; Wang, Y.; Zhou, D. Carbon emissions performance trend across Chinese cities: Evidence from efficiency and convergence evaluation. Environ. Sci. Pollut. Res. 2021, 28, 1533–1544. [Google Scholar] [CrossRef]
- Gao, K.; Yuan, Y.-J. Spatiotemporal pattern assessment of China’s industrial green productivity and its spatial drivers: Evidence from city-level data over 2000–2017. Appl. Energy 2022, 307, 118248. [Google Scholar] [CrossRef]
- Mingran, W. Measurement and spatial statistical analysis of green science and technology innovation efficiency among Chinese Provinces. Environ. Ecol. Stat. 2021, 28, 423–444. [Google Scholar] [CrossRef]
- Dong, F.; Li, Y.; Qin, C.; Sun, J. How industrial convergence affects regional green development efficiency: A spatial conditional process analysis. J. Environ. Manag. 2021, 300, 113738. [Google Scholar] [CrossRef] [PubMed]
- Hall, L.A.; Bagchi-Sen, S. A study of R&D, innovation, and business performance in the Canadian biotechnology industry. Technovation 2002, 22, 231–244. [Google Scholar]
- Chen, X.; Liu, Z.; Zhu, Q. Reprint of “Performance evaluation of China’s high-tech innovation process: Analysis based on the innovation value chain”. Technovation 2020, 94, 102094. [Google Scholar] [CrossRef]
- Ganotakis, P.; Love, J.H. The innovation value chain in new technology-based firms: Evidence from the UK. J. Prod. Innov. Manag. 2012, 29, 839–860. [Google Scholar] [CrossRef]
- Wang, C.-H.; Lu, Y.-H.; Huang, C.-W.; Lee, J.-Y. R&D, productivity, and market value: An empirical study from high-technology firms. Omega 2013, 41, 143–155. [Google Scholar]
- Zhu, L.; Luo, J.; Dong, Q.; Zhao, Y.; Wang, Y.; Wang, Y. Green technology innovation efficiency of energy-intensive industries in China from the perspective of shared resources: Dynamic change and improvement path. Technol. Forecast. Soc. Change 2021, 170, 120890. [Google Scholar] [CrossRef]
- Hansen, M.T.; Birkinshaw, J. The innovation value chain. Harv. Bus. Rev. 2007, 85, 121–130,142. [Google Scholar]
- Furman, J.L.; Porter, M.E.; Stern, S. The determinants of national innovative capacity. Res. Policy 2002, 31, 899–933. [Google Scholar] [CrossRef]
- Wang, Y.; Pan, J.-F.; Pei, R.-M.; Yi, B.-W.; Yang, G.-L. Assessing the technological innovation efficiency of China’s high-tech industries with a two-stage network DEA approach. Socio-Econ. Plan. Sci. 2020, 71, 100810. [Google Scholar] [CrossRef]
- Zuo, Z.; Guo, H.; Li, Y.; Cheng, J. A two-stage DEA evaluation of Chinese mining industry technological innovation efficiency and eco-efficiency. Environ. Impact Assess. Rev. 2022, 94, 106762. [Google Scholar] [CrossRef]
- Li, J.; Du, Y. Spatial effect of environmental regulation on green innovation efficiency: Evidence from prefectural-level cities in China. J. Clean. Prod. 2021, 286, 125032. [Google Scholar] [CrossRef]
- Song, M.; Zhu, S.; Wang, J.; Zhao, J. Share green growth: Regional evaluation of green output performance in China. Int. J. Prod. Econ. 2020, 219, 152–163. [Google Scholar] [CrossRef]
- Wu, Y. R&D stock, knowledge function and productive efficiency. China Econ. Q. Beijing 2006, 5, 1129. [Google Scholar]
- Hong, J.; Feng, B.; Wu, Y.; Wang, L. Do government grants promote innovation efficiency in China’s high-tech industries? Technovation 2016, 57, 4–13. [Google Scholar] [CrossRef]
- Bronzini, R.; Piselli, P. The impact of R&D subsidies on firm innovation. Res. Policy 2016, 45, 442–457. [Google Scholar]
- Li, D.; Zhao, Y.; Zhang, L.; Chen, X.; Cao, C. Impact of quality management on green innovation. J. Clean. Prod. 2018, 170, 462–470. [Google Scholar] [CrossRef]
- Ren, S.; He, D.; Yan, J.; Zeng, H.; Tan, J. Environmental labeling certification and corporate environmental innovation: The moderating role of corporate ownership and local government intervention. J. Bus. Res. 2022, 140, 556–571. [Google Scholar] [CrossRef]
- Griliches, Z. Patent statistics as economic indicators: A survey. part I. In R&D and Productivity: The Econometric Evidence; National Bureau of Economic Reserch: Cambridge, MA, USA, 1990. [Google Scholar]
- Seiford, L.M.; Zhu, J. Modeling undesirable factors in efficiency evaluation. Eur. J. Oper. Res. 2002, 142, 16–20. [Google Scholar] [CrossRef]
- Liang, L.; Cook, W.D.; Zhu, J. DEA models for two-stage processes: Game approach and efficiency decomposition. Nav. Res. Logist. 2008, 55, 643–653. [Google Scholar] [CrossRef]
- Chen, Y.; Liang, L.; Zhu, J. Equivalence in two-stage DEA approaches. Eur. J. Oper. Res. 2009, 193, 600–604. [Google Scholar] [CrossRef]
- Li, Y.; Chen, Y.; Liang, L.; Xie, J. DEA models for extended two-stage network structures. Omega 2012, 40, 611–618. [Google Scholar] [CrossRef]
- Davis, R.A.; Lii, K.-S.; Politis, D.N. Remarks on some nonparametric estimates of a density function. In Selected Works of Murray Rosenblatt; Springer: New York, NY, USA, 2011; pp. 95–100. [Google Scholar]
- Shen, W.; Shi, J.; Meng, Q.; Chen, X.; Liu, Y.; Cheng, K.; Liu, W. Influences of environmental regulations on industrial green technology innovation efficiency in China. Sustainability 2022, 14, 4717. [Google Scholar] [CrossRef]
- Xiao, Q.; Lu, Z. Heterogeneous Environment Regulation, FDI and the Efficiency of China’s Green Technology Innovation. Mod. Econ. Res. 2020, 4, 29–40. [Google Scholar]
- Li, T.; Li, Y.; An, D.; Han, Y.; Xu, S.; Lu, Z.; Crittenden, J. Mining of the association rules between industrialization level and air quality to inform high-quality development in China. J. Environ. Manag. 2019, 246, 564–574. [Google Scholar] [CrossRef] [PubMed]
- Zhang, Y.; Hu, H.; Zhu, G.; You, D. The impact of environmental regulation on enterprises’ green innovation under the constraint of external financing: Evidence from China’s industrial firms. Environ. Sci. Pollut. Res. 2023, 30, 42943–42964. [Google Scholar] [CrossRef] [PubMed]
- Kleer, R. Government R&D subsidies as a signal for private investors. Res. Policy 2010, 39, 1361–1374. [Google Scholar]
- Change, E.T. Endogenous Technological Change. J. Political Econ. 1990, 98, 2. [Google Scholar]
- Zhou, H.; Wang, R. Exploring the impact of energy factor prices and environmental regulation on China’s green innovation efficiency. Environ. Sci. Pollut. Res. 2022, 29, 78973–78988. [Google Scholar] [CrossRef]
- Fujii, H.; Managi, S. Decomposition analysis of sustainable green technology inventions in China. Technol. Forecast. Soc. Change 2019, 139, 10–16. [Google Scholar] [CrossRef]
- Du, J.-L.; Liu, Y.; Diao, W.-X. Assessing regional differences in green innovation efficiency of industrial enterprises in China. Int. J. Environ. Res. Public Health 2019, 16, 940. [Google Scholar] [CrossRef]
- Yao, M.; Duan, J.; Wang, Q. Spatial and temporal evolution analysis of industrial green technology innovation efficiency in the Yangtze River Economic Belt. Int. J. Environ. Res. Public Health 2022, 19, 6361. [Google Scholar] [CrossRef] [PubMed]
- Xu, S.; Wu, T.; Zhang, Y. The spatial-temporal variation and convergence of green innovation efficiency in the Yangtze River Economic Belt in China. Environ. Sci. Pollut. Res. 2020, 27, 26868–26881. [Google Scholar] [CrossRef] [PubMed]
- Zhao, T.; Zhou, H.; Jiang, J.; Yan, W. Impact of green finance and environmental regulations on the green innovation efficiency in China. Sustainability 2022, 14, 3206. [Google Scholar] [CrossRef]
- Li, D.; Zheng, M.; Cao, C.; Chen, X.; Ren, S.; Huang, M. The impact of legitimacy pressure and corporate profitability on green innovation: Evidence from China top 100. J. Clean. Prod. 2017, 141, 41–49. [Google Scholar] [CrossRef]


| Green Innovation Process | Variable | Unit | Source |
|---|---|---|---|
| Initial inputs | Full-time equivalent of R&D personnel | Man-year | China Science and Technology Statistical Yearbook |
| Intramural expenditure on R&D | CNY 10,000 | China Science and Technology Statistical Yearbook | |
| Shared inputs | Fixed assets | CNY 100 million | China Industrial Statistical Yearbook |
| Intermediate outputs | Number of patent applications | Piece | China Science and Technology Statistical Yearbook |
| Number of new product items | Piece | China Science and Technology Statistical Yearbook | |
| Additional intermediate inputs | Employed personnel | 10,000 person | China Industrial Statistical Yearbook |
| Expenditures on the acquisition and renovation of technology | CNY 10,000 | China Science and Technology Statistical Yearbook | |
| Energy consumption | 10,000 tons of standard coal | China Statistical Yearbook | |
| Expected outputs | Sales revenue of new products | CNY 10,000 | China Science and Technology Statistical Yearbook |
| Undesirable outputs | Environmental pollution index | / | China Environmental Statistical Yearbook |
| Region | Province | GIE | Rank | RDE | Rank | ACE | Rank |
|---|---|---|---|---|---|---|---|
| Eastern | Beijing | 1.000 | 1 | 1.000 | 1 | 1.000 | 1 |
| Tianjin | 0.845 | 8 | 0.931 | 7 | 0.908 | 15 | |
| Hebei | 0.686 | 14 | 0.828 | 11 | 0.828 | 17 | |
| Liaoning | 0.426 | 22 | 0.588 | 25 | 0.725 | 21 | |
| Shanghai | 0.847 | 7 | 0.847 | 9 | 1.000 | 1 | |
| Jiangsu | 0.692 | 13 | 0.692 | 19 | 1.000 | 1 | |
| Zhejiang | 1.000 | 1 | 1.000 | 1 | 1.000 | 1 | |
| Fujian | 0.331 | 28 | 0.566 | 26 | 0.585 | 26 | |
| Shandong | 0.709 | 12 | 0.720 | 17 | 0.984 | 11 | |
| Guangdong | 1.000 | 1 | 1.000 | 1 | 1.000 | 1 | |
| Hainan | 1.000 | 1 | 1.000 | 1 | 1.000 | 1 | |
| Western | Inner Mongolia | 0.540 | 18 | 0.718 | 18 | 0.752 | 20 |
| Guangxi | 0.626 | 17 | 0.804 | 14 | 0.779 | 19 | |
| Chongqing | 0.643 | 16 | 0.669 | 20 | 0.961 | 14 | |
| Sichuan | 0.393 | 26 | 0.812 | 12 | 0.484 | 27 | |
| Guizhou | 0.274 | 29 | 0.602 | 24 | 0.456 | 29 | |
| Yunnan | 0.233 | 30 | 0.550 | 27 | 0.424 | 30 | |
| Shaanxi | 0.419 | 23 | 0.534 | 28 | 0.785 | 18 | |
| Gansu | 0.396 | 25 | 0.662 | 23 | 0.598 | 24 | |
| Qinghai | 1.000 | 1 | 1.000 | 1 | 1.000 | 1 | |
| Ningxia | 0.397 | 24 | 0.664 | 21 | 0.597 | 25 | |
| Xinjiang | 0.447 | 20 | 0.946 | 6 | 0.473 | 28 | |
| Central | Shanxi | 0.445 | 21 | 0.533 | 29 | 0.836 | 16 |
| Jilin | 0.879 | 6 | 0.879 | 8 | 1.000 | 1 | |
| Heilongjiang | 0.507 | 19 | 0.761 | 15 | 0.666 | 22 | |
| Anhui | 0.786 | 10 | 0.809 | 13 | 0.971 | 13 | |
| Jiangxi | 0.822 | 9 | 0.841 | 10 | 0.977 | 12 | |
| Henan | 0.353 | 27 | 0.531 | 30 | 0.665 | 23 | |
| Hubei | 0.661 | 15 | 0.664 | 22 | 0.997 | 10 | |
| Hunan | 0.747 | 11 | 0.747 | 16 | 1.000 | 1 | |
| Average | Overall | 0.637 | 0.763 | 0.815 | |||
| Eastern | 0.776 | 0.834 | 0.912 | ||||
| Western | 0.488 | 0.724 | 0.664 | ||||
| Central | 0.650 | 0.721 | 0.889 | ||||
| Variables | Overall | Eastern | Western | Central | ||||
|---|---|---|---|---|---|---|---|---|
| β | −0.425 *** (−7.15) | −0.542 *** (−8.79) | −0.452 *** (−4.25) | −0.611 *** (−5.90) | −0.243 ** (−2.50) | −0.471 *** (−4.45) | −0.688 *** (−5.36) | −0.881 *** (−5.97) |
| α | −0.151 *** (−4.94) | 4.336 *** (3.94) | −0.137 *** (−4.01) | 0.374 (0.22) | −0.107 ** (−2.13) | 9.666 *** (3.94) | −0.309 *** (−3.37) | 6.354 ** (2.45) |
| 0.095 ** (2.59) | 0.066 (0.55) | 0.084 * (1.86) | 0.098 (0.70) | |||||
| 0.024 (0.25) | 0.494 ** (2.63) | −0.282 * (−1.67) | −0.079 (−0.40) | |||||
| −0.408 *** (−4.04) | −0.105 (−0.65) | −0.860 *** (−3.72) | −0.631 *** (−2.78) | |||||
| 0.014 (0.33) | 0.066 (1.17) | −0.053 (−0.68) | −0.079 (−0.78) | |||||
| 0.022 (0.10) | 0.232 (0.75) | −0.291 (−0.71) | 0.069 (0.13) | |||||
| −0.072 (−0.54) | 0.091 (0.36) | −0.102 (−0.46) | −0.188 (−0.34) | |||||
| Province FE | Yes | Yes | Yes | Yes | Yes | Yes | Yes | Yes |
| Year FE | Yes | Yes | Yes | Yes | Yes | Yes | Yes | Yes |
| s | 0.055 | 0.078 | 0.060 | 0.094 | 0.028 | 0.064 | 0.116 | 0.213 |
| τ | 12.526 | 8.876 | 11.524 | 7.341 | 24.898 | 10.885 | 5.951 | 3.256 |
| R2 | 0.302 | 0.391 | 0.398 | 0.536 | 0.187 | 0.386 | 0.484 | 0.5667 |
| N | 270 | 270 | 99 | 99 | 99 | 99 | 72 | 72 |
| Variables | Overall | Eastern | Western | Central | ||||
|---|---|---|---|---|---|---|---|---|
| β | −0.736 *** (−12.42) | −0.814 *** (−12.86) | −0.793 *** (−9.76) | −0.816 *** (−9.59) | −0.694 *** (−6.94) | −0.799 *** (−7.05) | −0.758 *** (−6.38) | −0.938 *** (−7.04) |
| α | −0.203 *** (−10.13) | −2.128 ** (−2.30) | −0.084 *** (−7.02) | −1.115 (−1.25) | −0.321 *** (−6.22) | −4.391 ** (−2.03) | −0.191 *** (−4.47) | −3.233 (−1.40) |
| 0.104 ** (2.41) | 0.052 (0.66) | 0.105 * (1.70) | −0.143 (−0.85) | |||||
| 0.037 (0.54) | −0.162 ** (−2.21) | 0.106 (0.83) | −0.022 (−0.12) | |||||
| 0.170 ** (2.06) | 0.119 (1.45) | 0.374 * (1.76) | 0.176 (0.86) | |||||
| 0.008 (0.18) | 0.001 (0.01) | −0.077 (−0.85) | 0.068 (0.55) | |||||
| 0.103 (0.38) | −0.149 (−0.60) | 0.197 (0.36) | 0.162 (0.25) | |||||
| −0.028 (−0.21) | 0.205 (1.22) | −0.368 (−1.36) | 0.486 (1.07) | |||||
| Province FE | Yes | Yes | Yes | Yes | Yes | Yes | Yes | Yes |
| Year FE | Yes | Yes | Yes | Yes | Yes | Yes | Yes | Yes |
| s | 0.133 | 0.168 | 0.158 | 0.169 | 0.118 | 0.160 | 0.142 | 0.278 |
| τ | 5.205 | 4.121 | 4.401 | 4.095 | 5.853 | 4.320 | 4.885 | 2.493 |
| R2 | 0.392 | 0.427 | 0.523 | 0.563 | 0.356 | 0.415 | 0.393 | 0.472 |
| N | 270 | 270 | 99 | 99 | 99 | 99 | 72 | 72 |
Disclaimer/Publisher’s Note: The statements, opinions and data contained in all publications are solely those of the individual author(s) and contributor(s) and not of MDPI and/or the editor(s). MDPI and/or the editor(s) disclaim responsibility for any injury to people or property resulting from any ideas, methods, instructions or products referred to in the content. |
© 2024 by the authors. Licensee MDPI, Basel, Switzerland. This article is an open access article distributed under the terms and conditions of the Creative Commons Attribution (CC BY) license (https://creativecommons.org/licenses/by/4.0/).
Share and Cite
Chen, X.; Xu, R. Assessment of Green Innovation Efficiency in Chinese Industrial Enterprises Based on an Improved Relational Two-Stage DEA Approach: Regional Disparities and Convergence Analysis. Sustainability 2024, 16, 6908. https://doi.org/10.3390/su16166908
Chen X, Xu R. Assessment of Green Innovation Efficiency in Chinese Industrial Enterprises Based on an Improved Relational Two-Stage DEA Approach: Regional Disparities and Convergence Analysis. Sustainability. 2024; 16(16):6908. https://doi.org/10.3390/su16166908
Chicago/Turabian StyleChen, Xiaohong, and Ruochen Xu. 2024. "Assessment of Green Innovation Efficiency in Chinese Industrial Enterprises Based on an Improved Relational Two-Stage DEA Approach: Regional Disparities and Convergence Analysis" Sustainability 16, no. 16: 6908. https://doi.org/10.3390/su16166908
APA StyleChen, X., & Xu, R. (2024). Assessment of Green Innovation Efficiency in Chinese Industrial Enterprises Based on an Improved Relational Two-Stage DEA Approach: Regional Disparities and Convergence Analysis. Sustainability, 16(16), 6908. https://doi.org/10.3390/su16166908