

Carbon Footprint Quantification and Reduction Potential of Ecological Revetment in Water Net Region of China: Case Study in Yancheng, Jiangsu Province


Abstract
1. Introduction
2. Materials and Methods
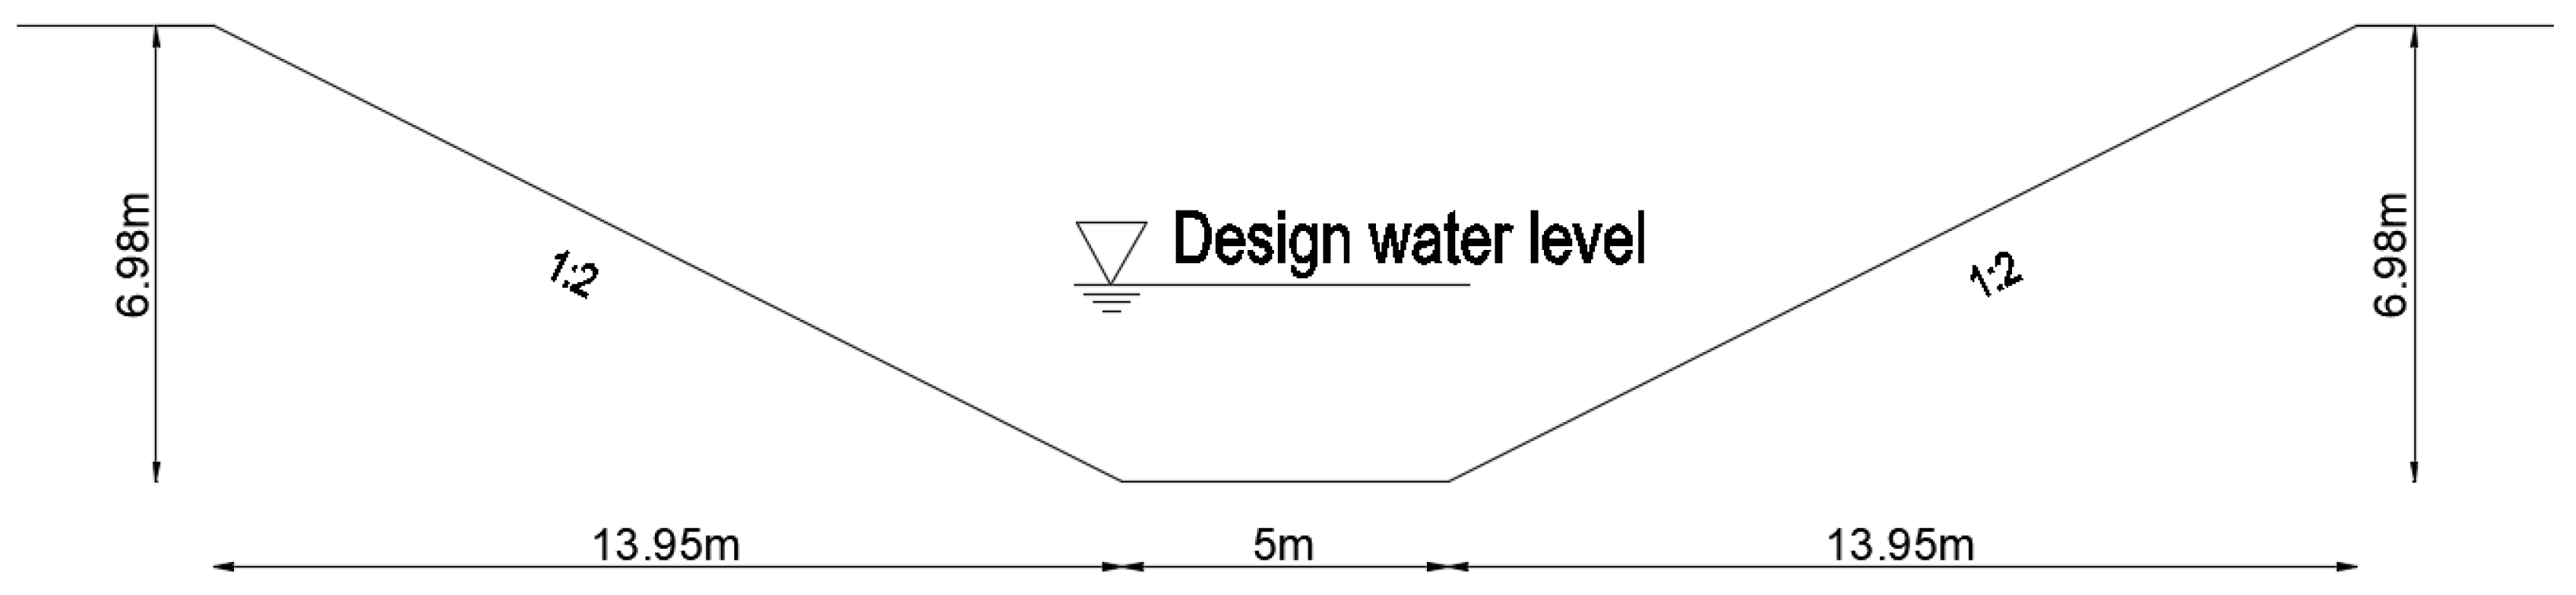
2.1. Research Area
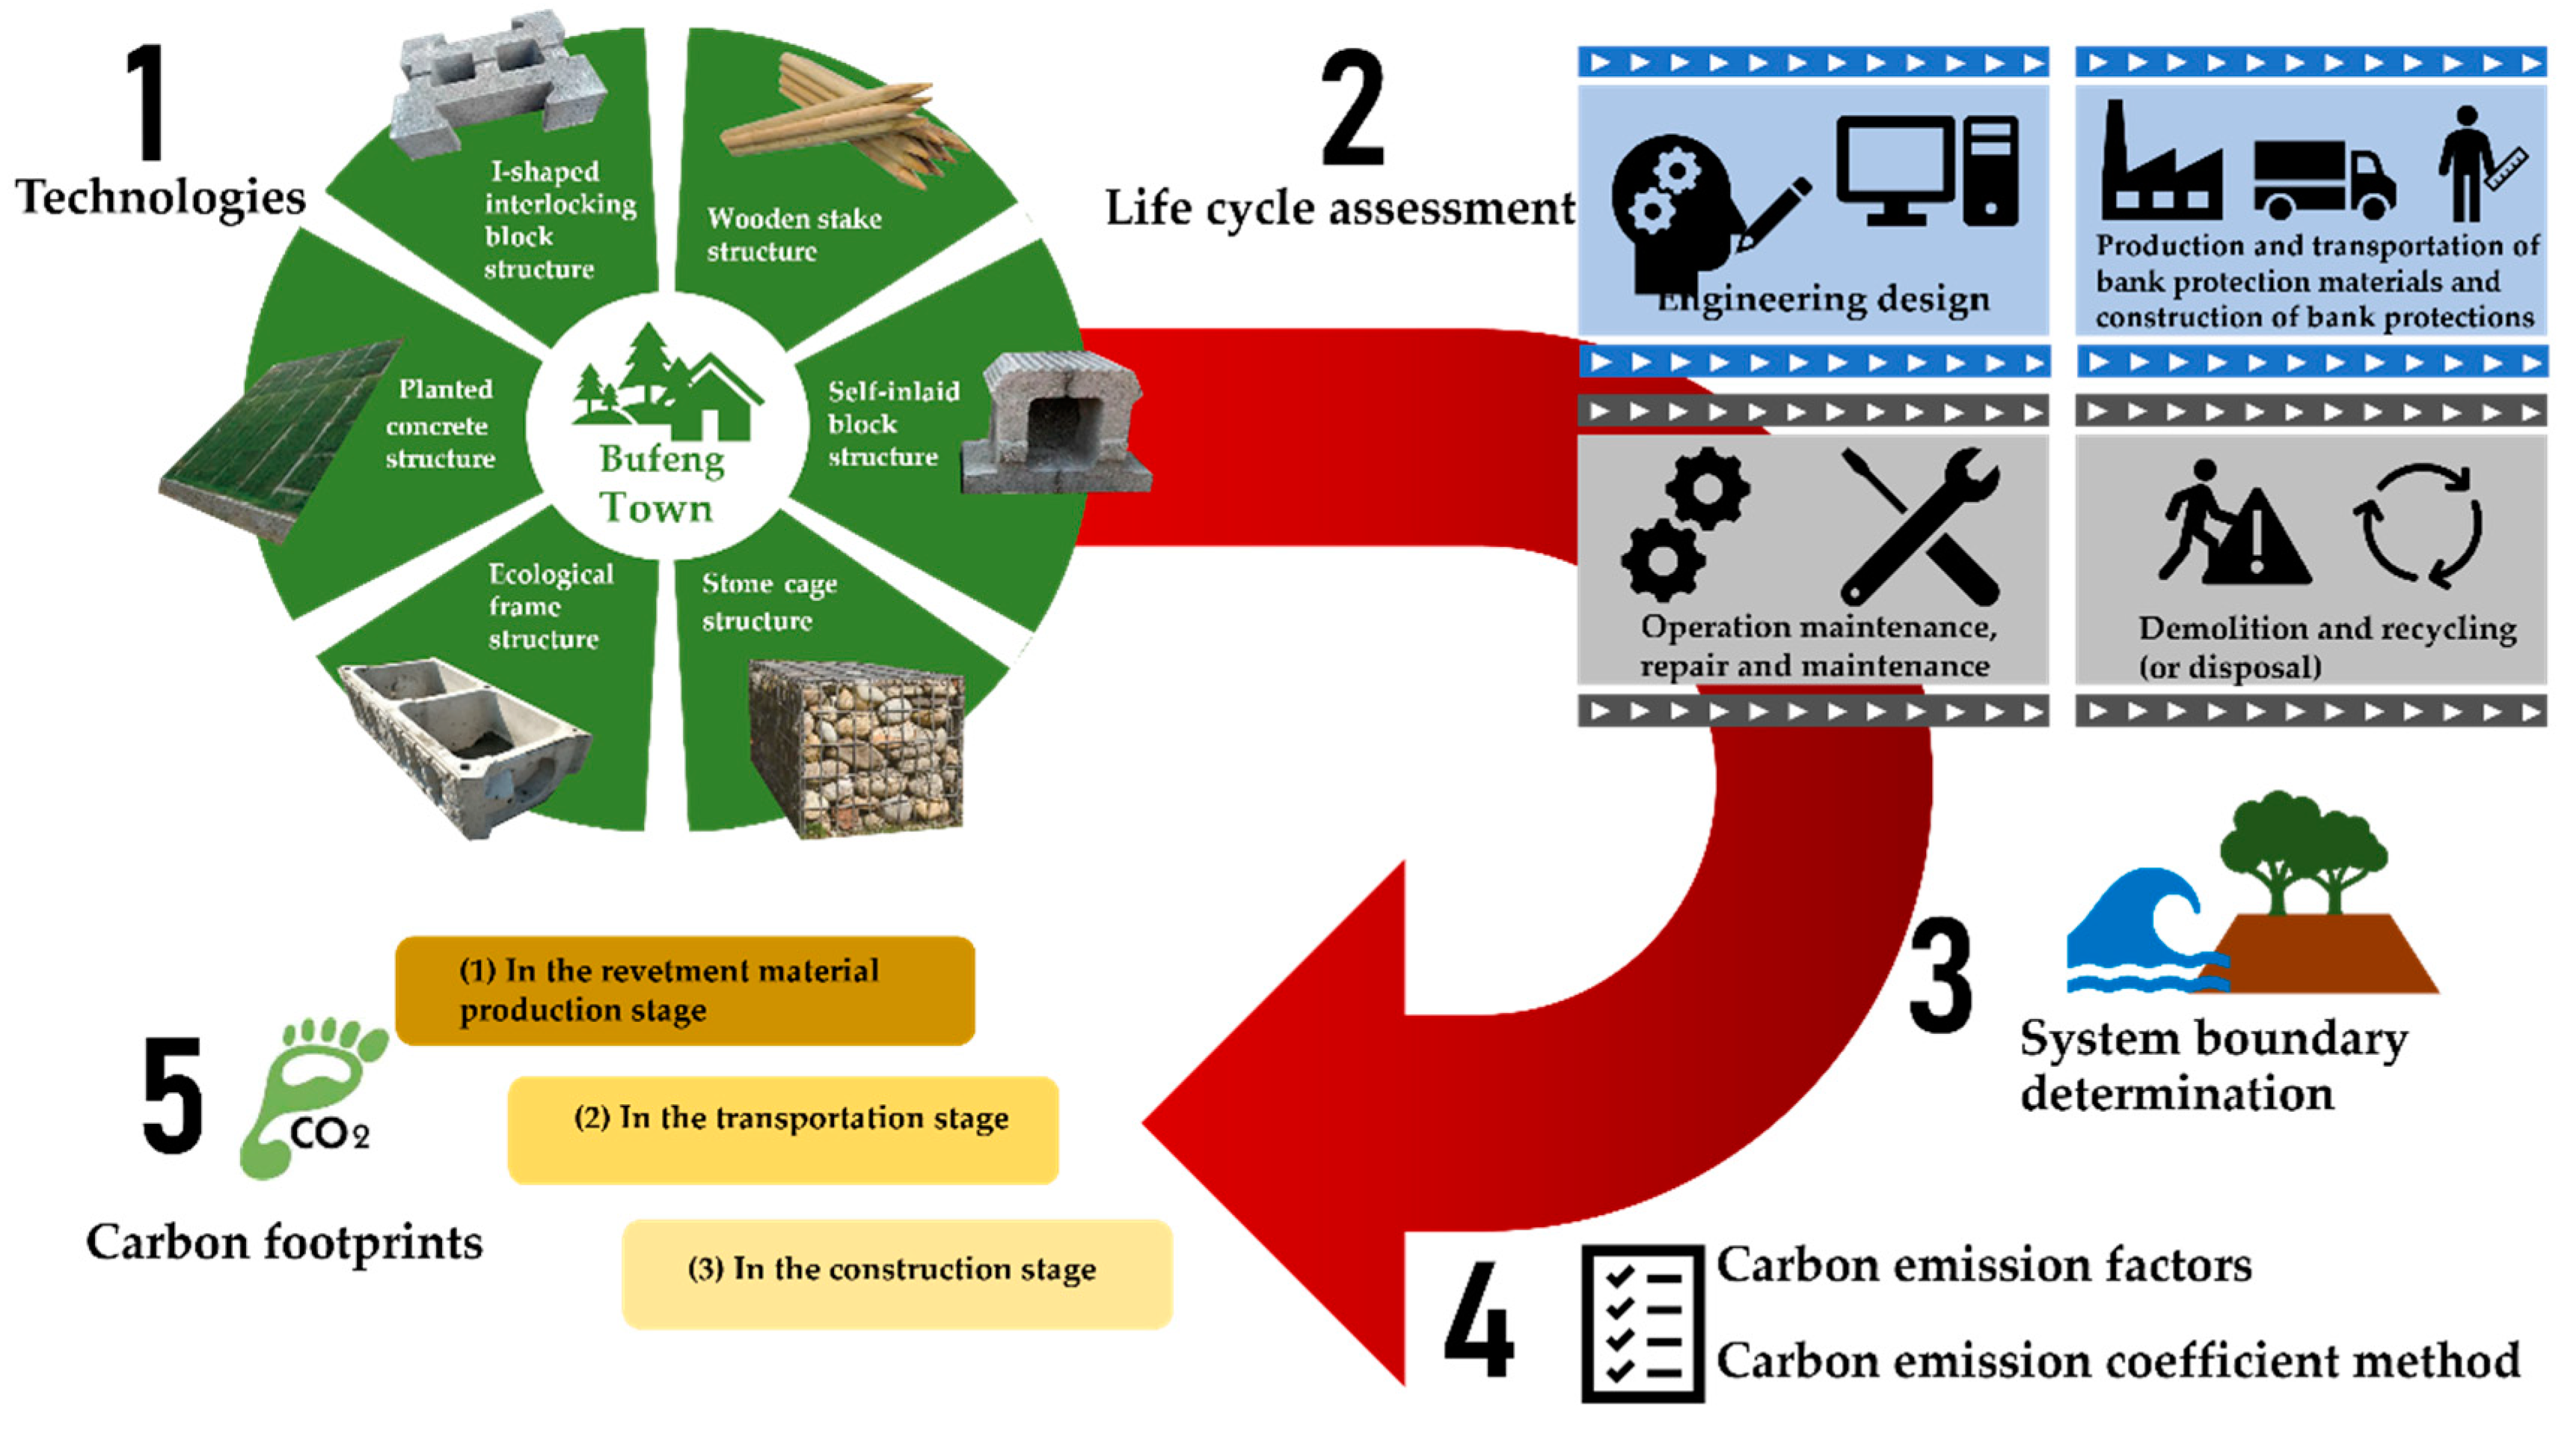
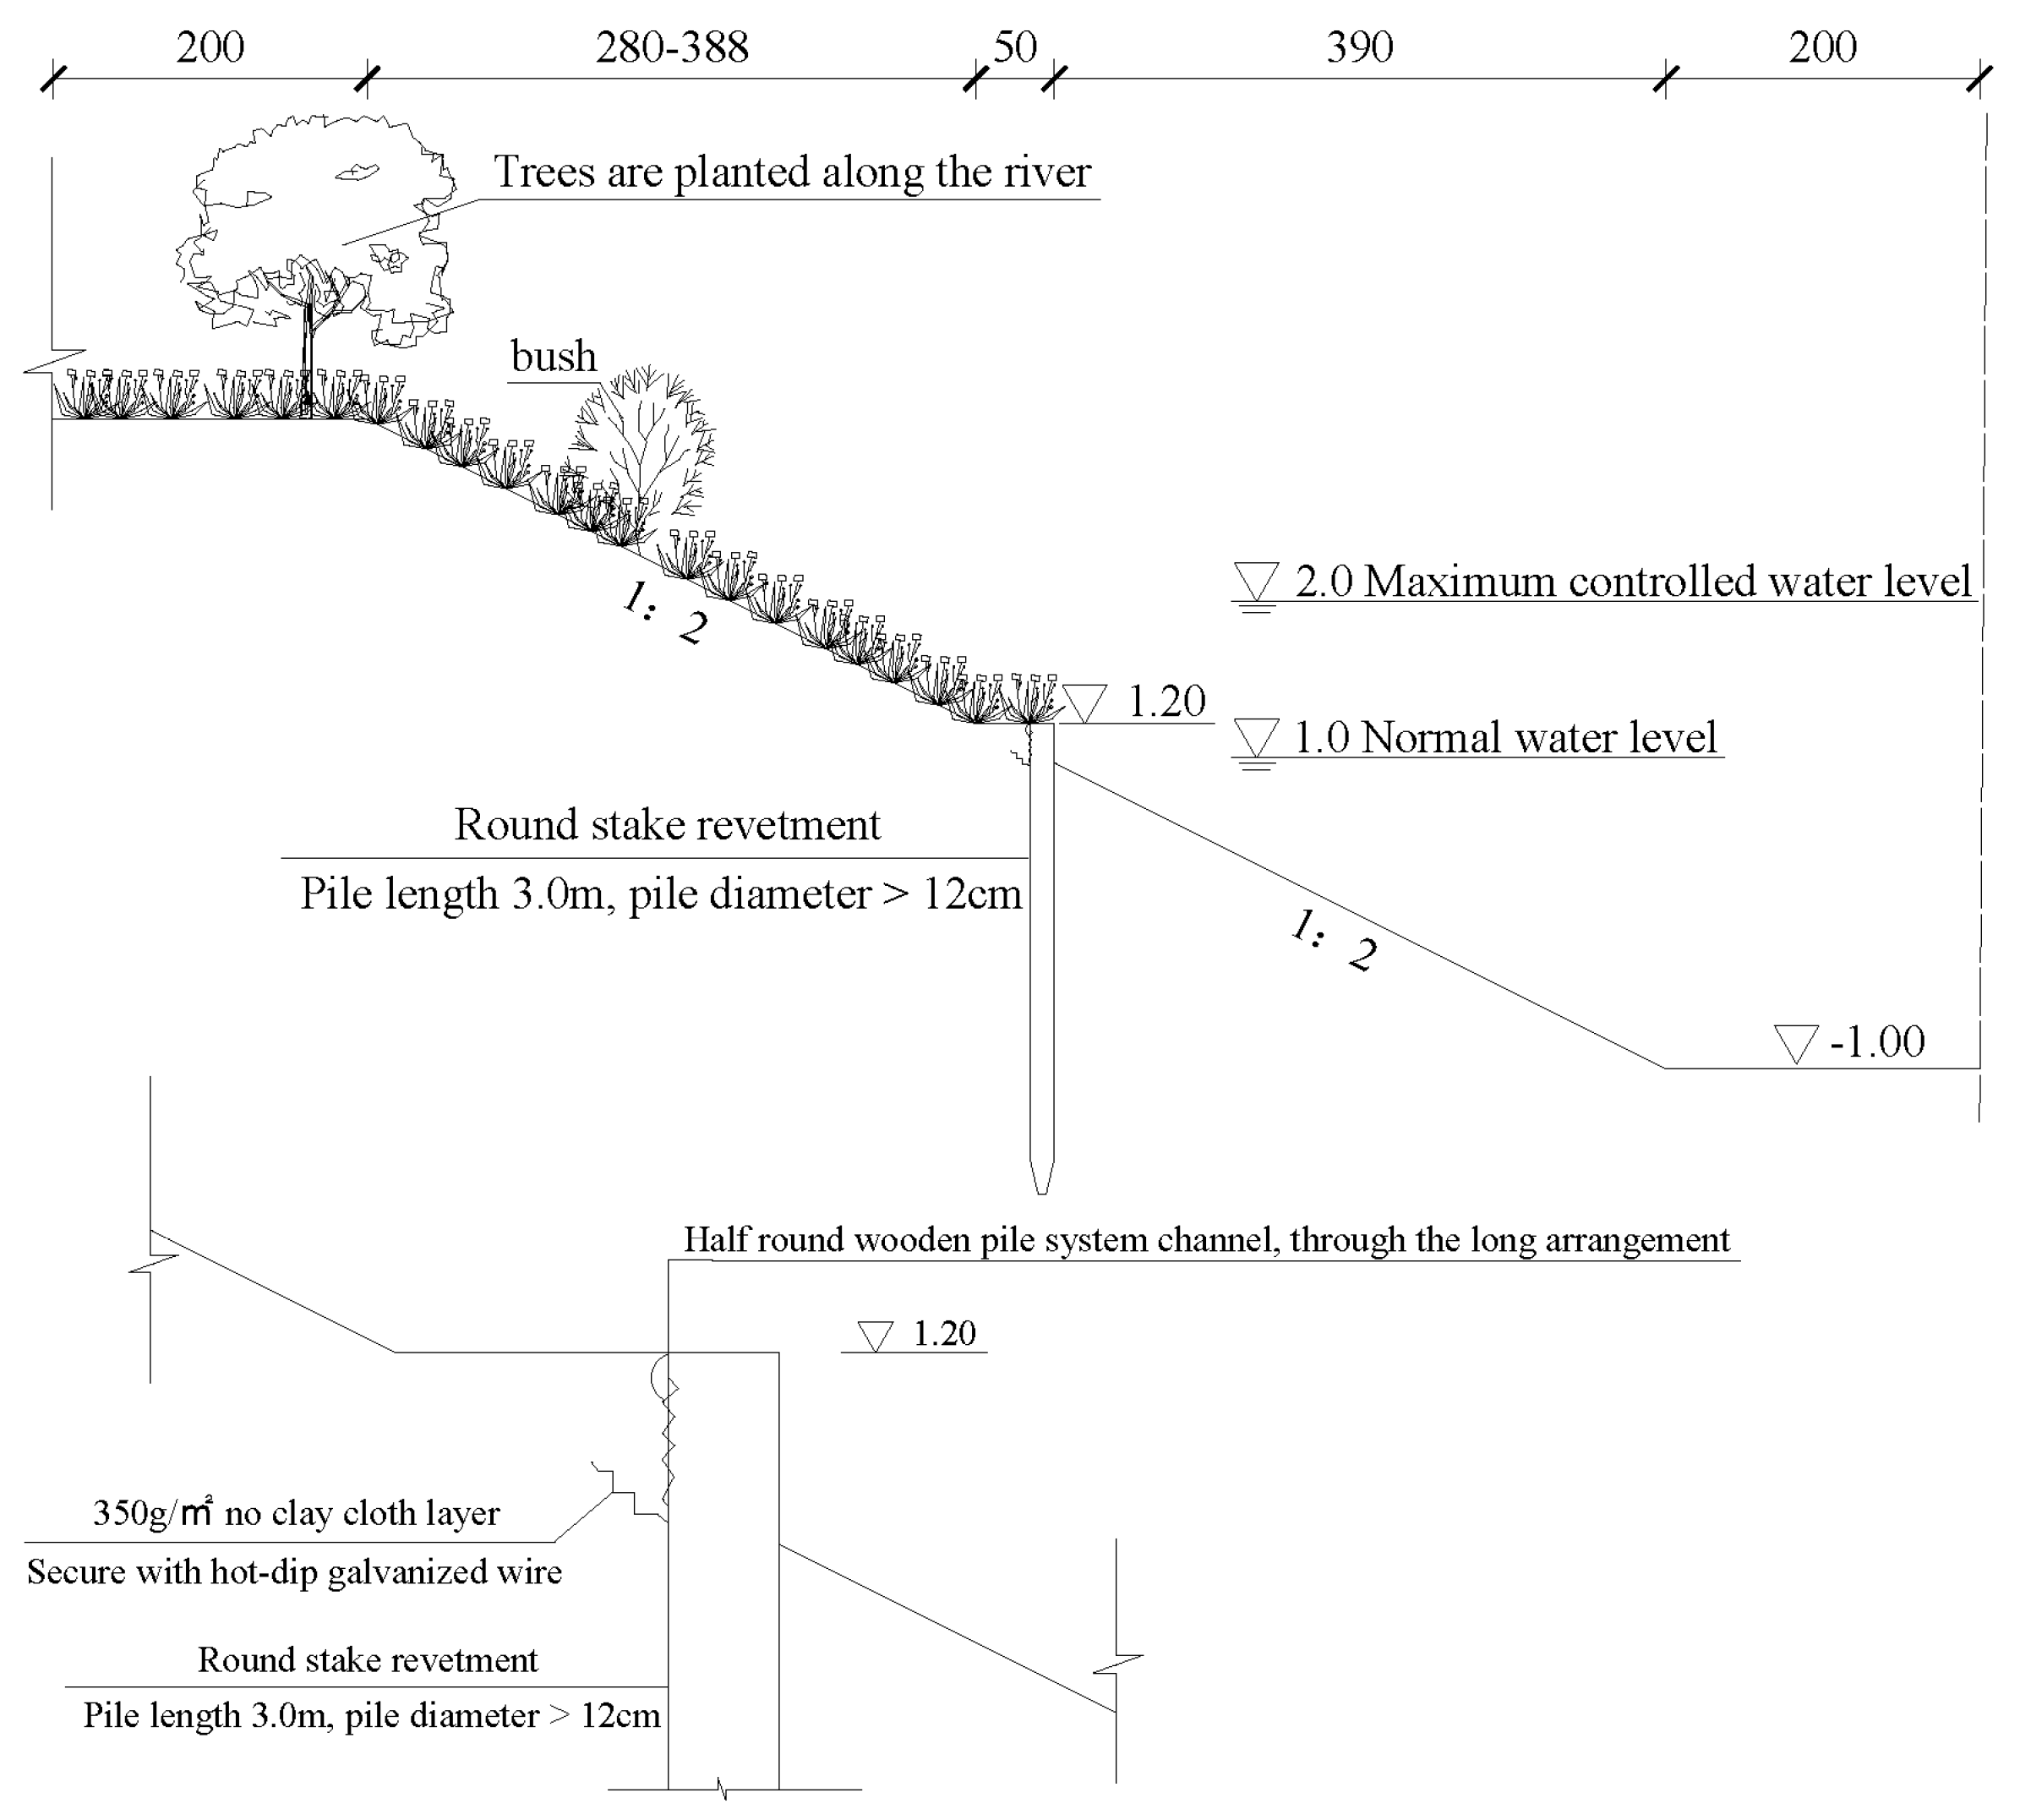
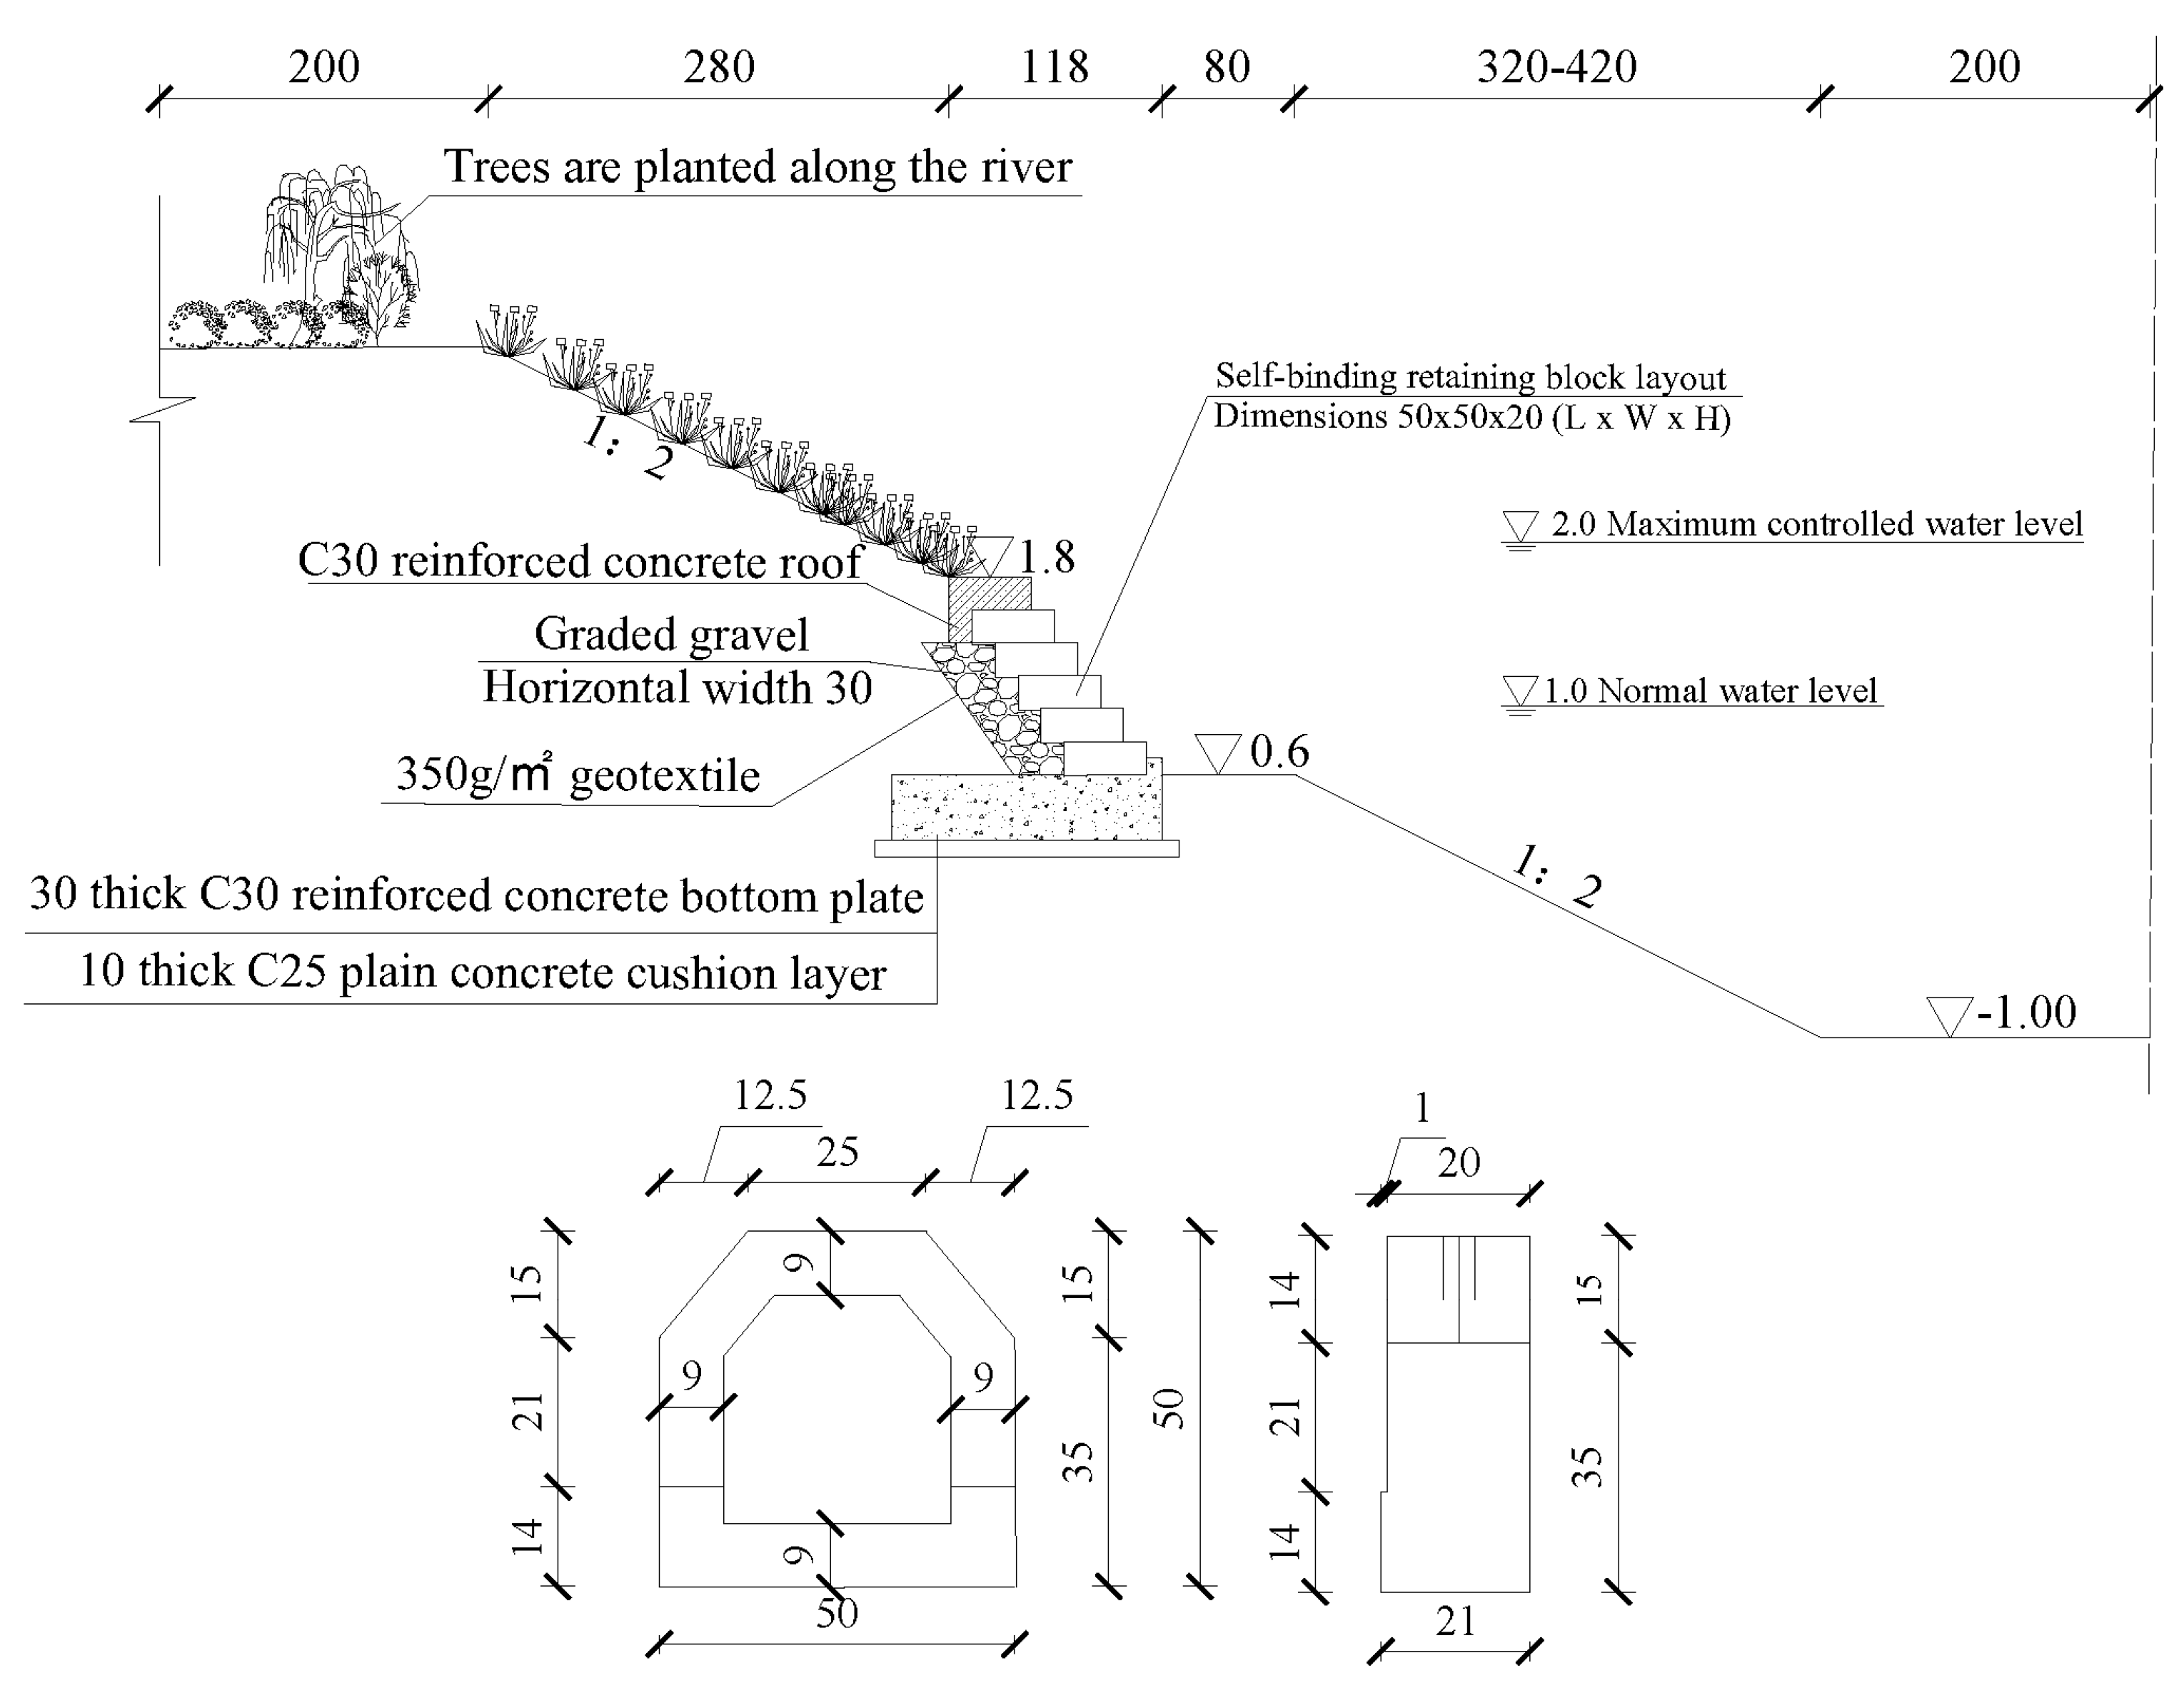
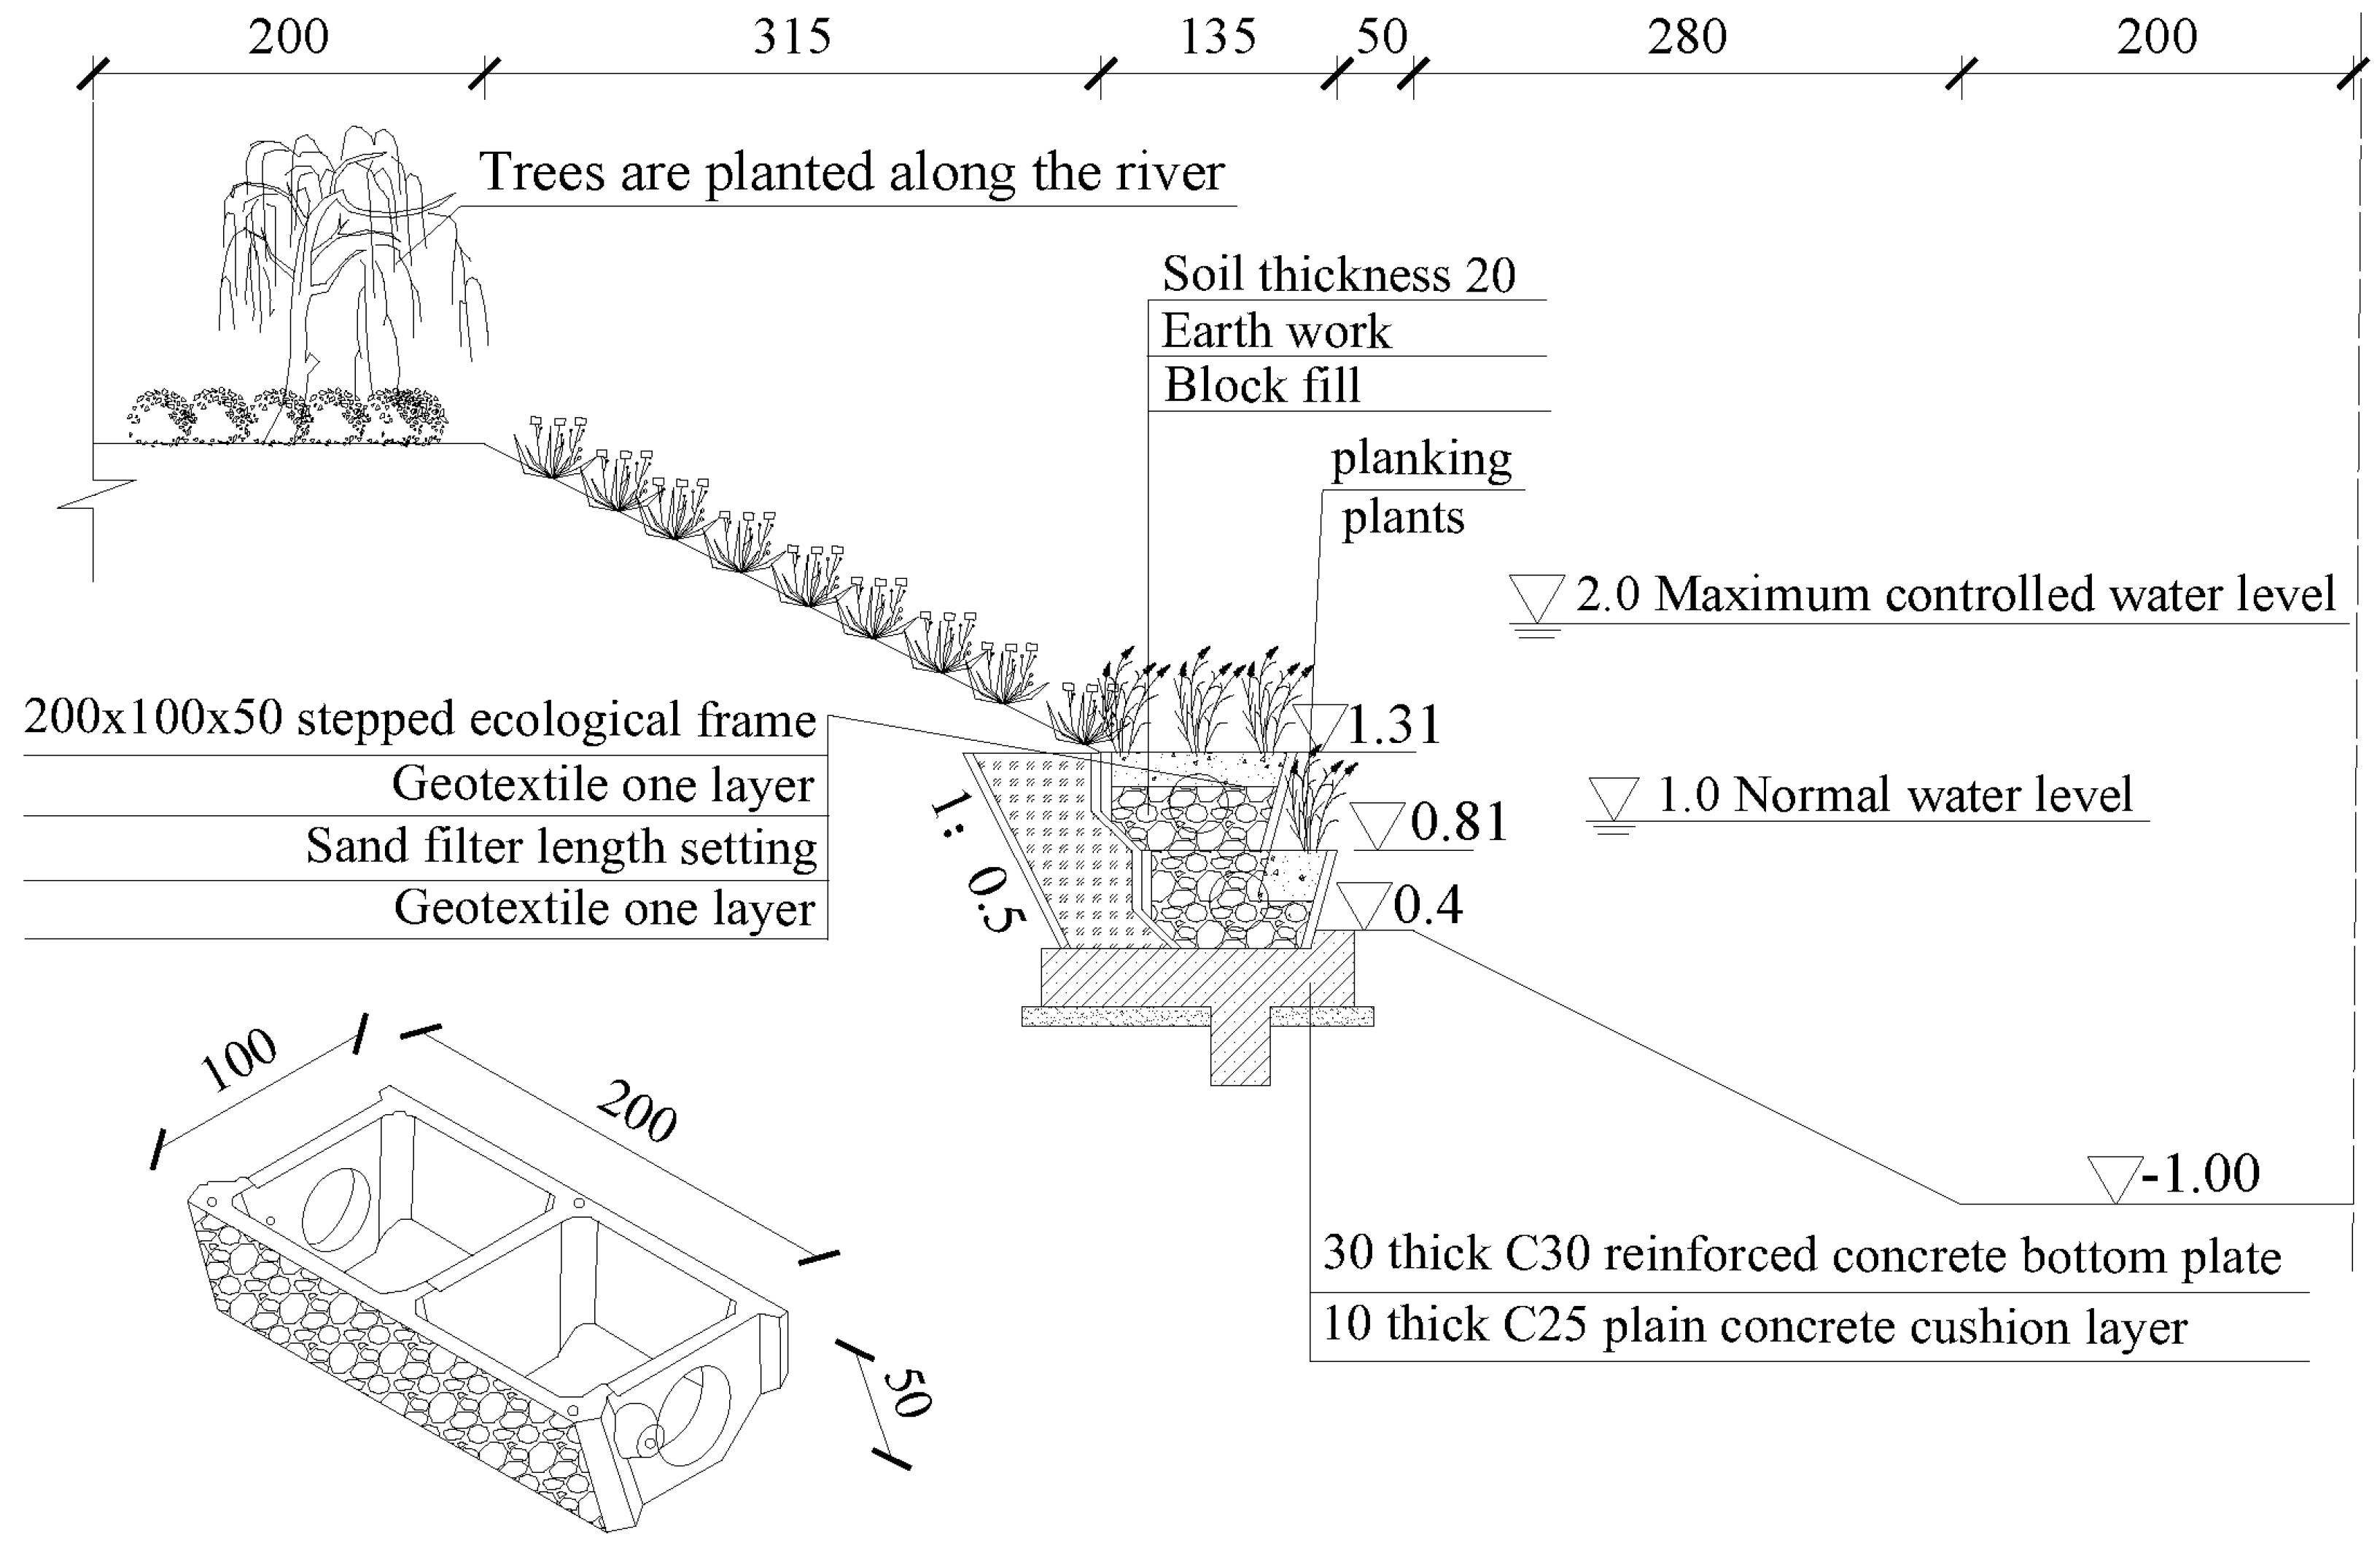
2.2. River Revetment Technologies
- (1)
- Wooden stake structure
- (2)
- Self-inlaid block structure
- (3)
- Stone cage structure
- (4)
- Ecological frame structure
- (5)
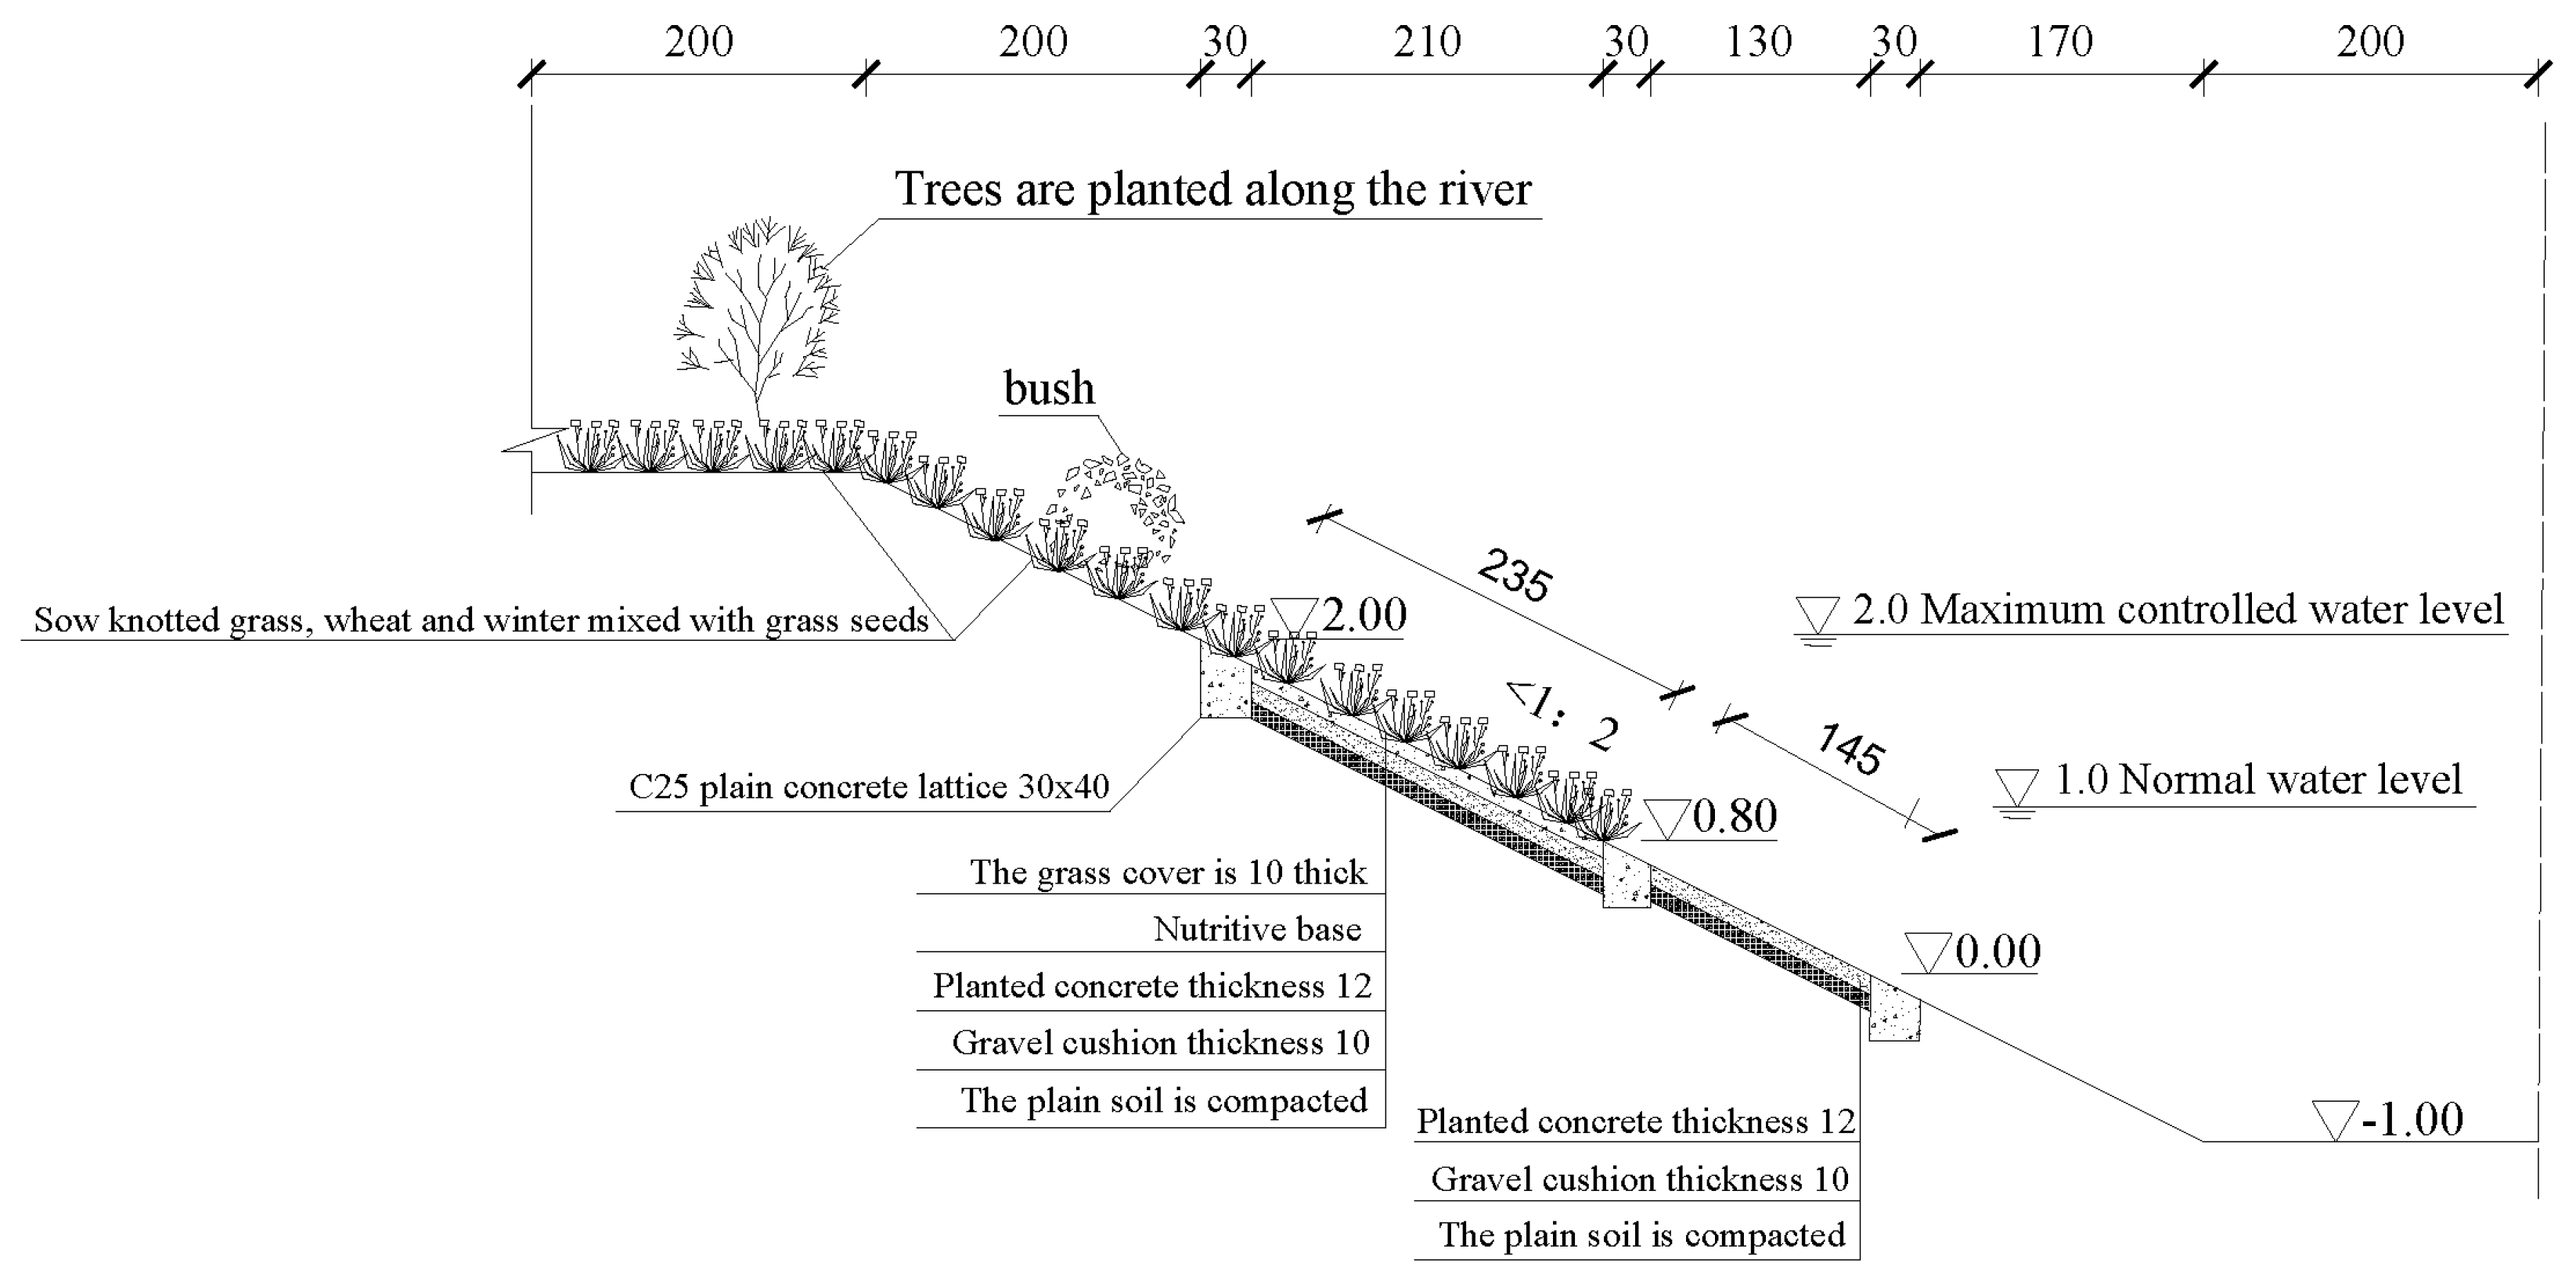
- Planted concrete structure
- (6)
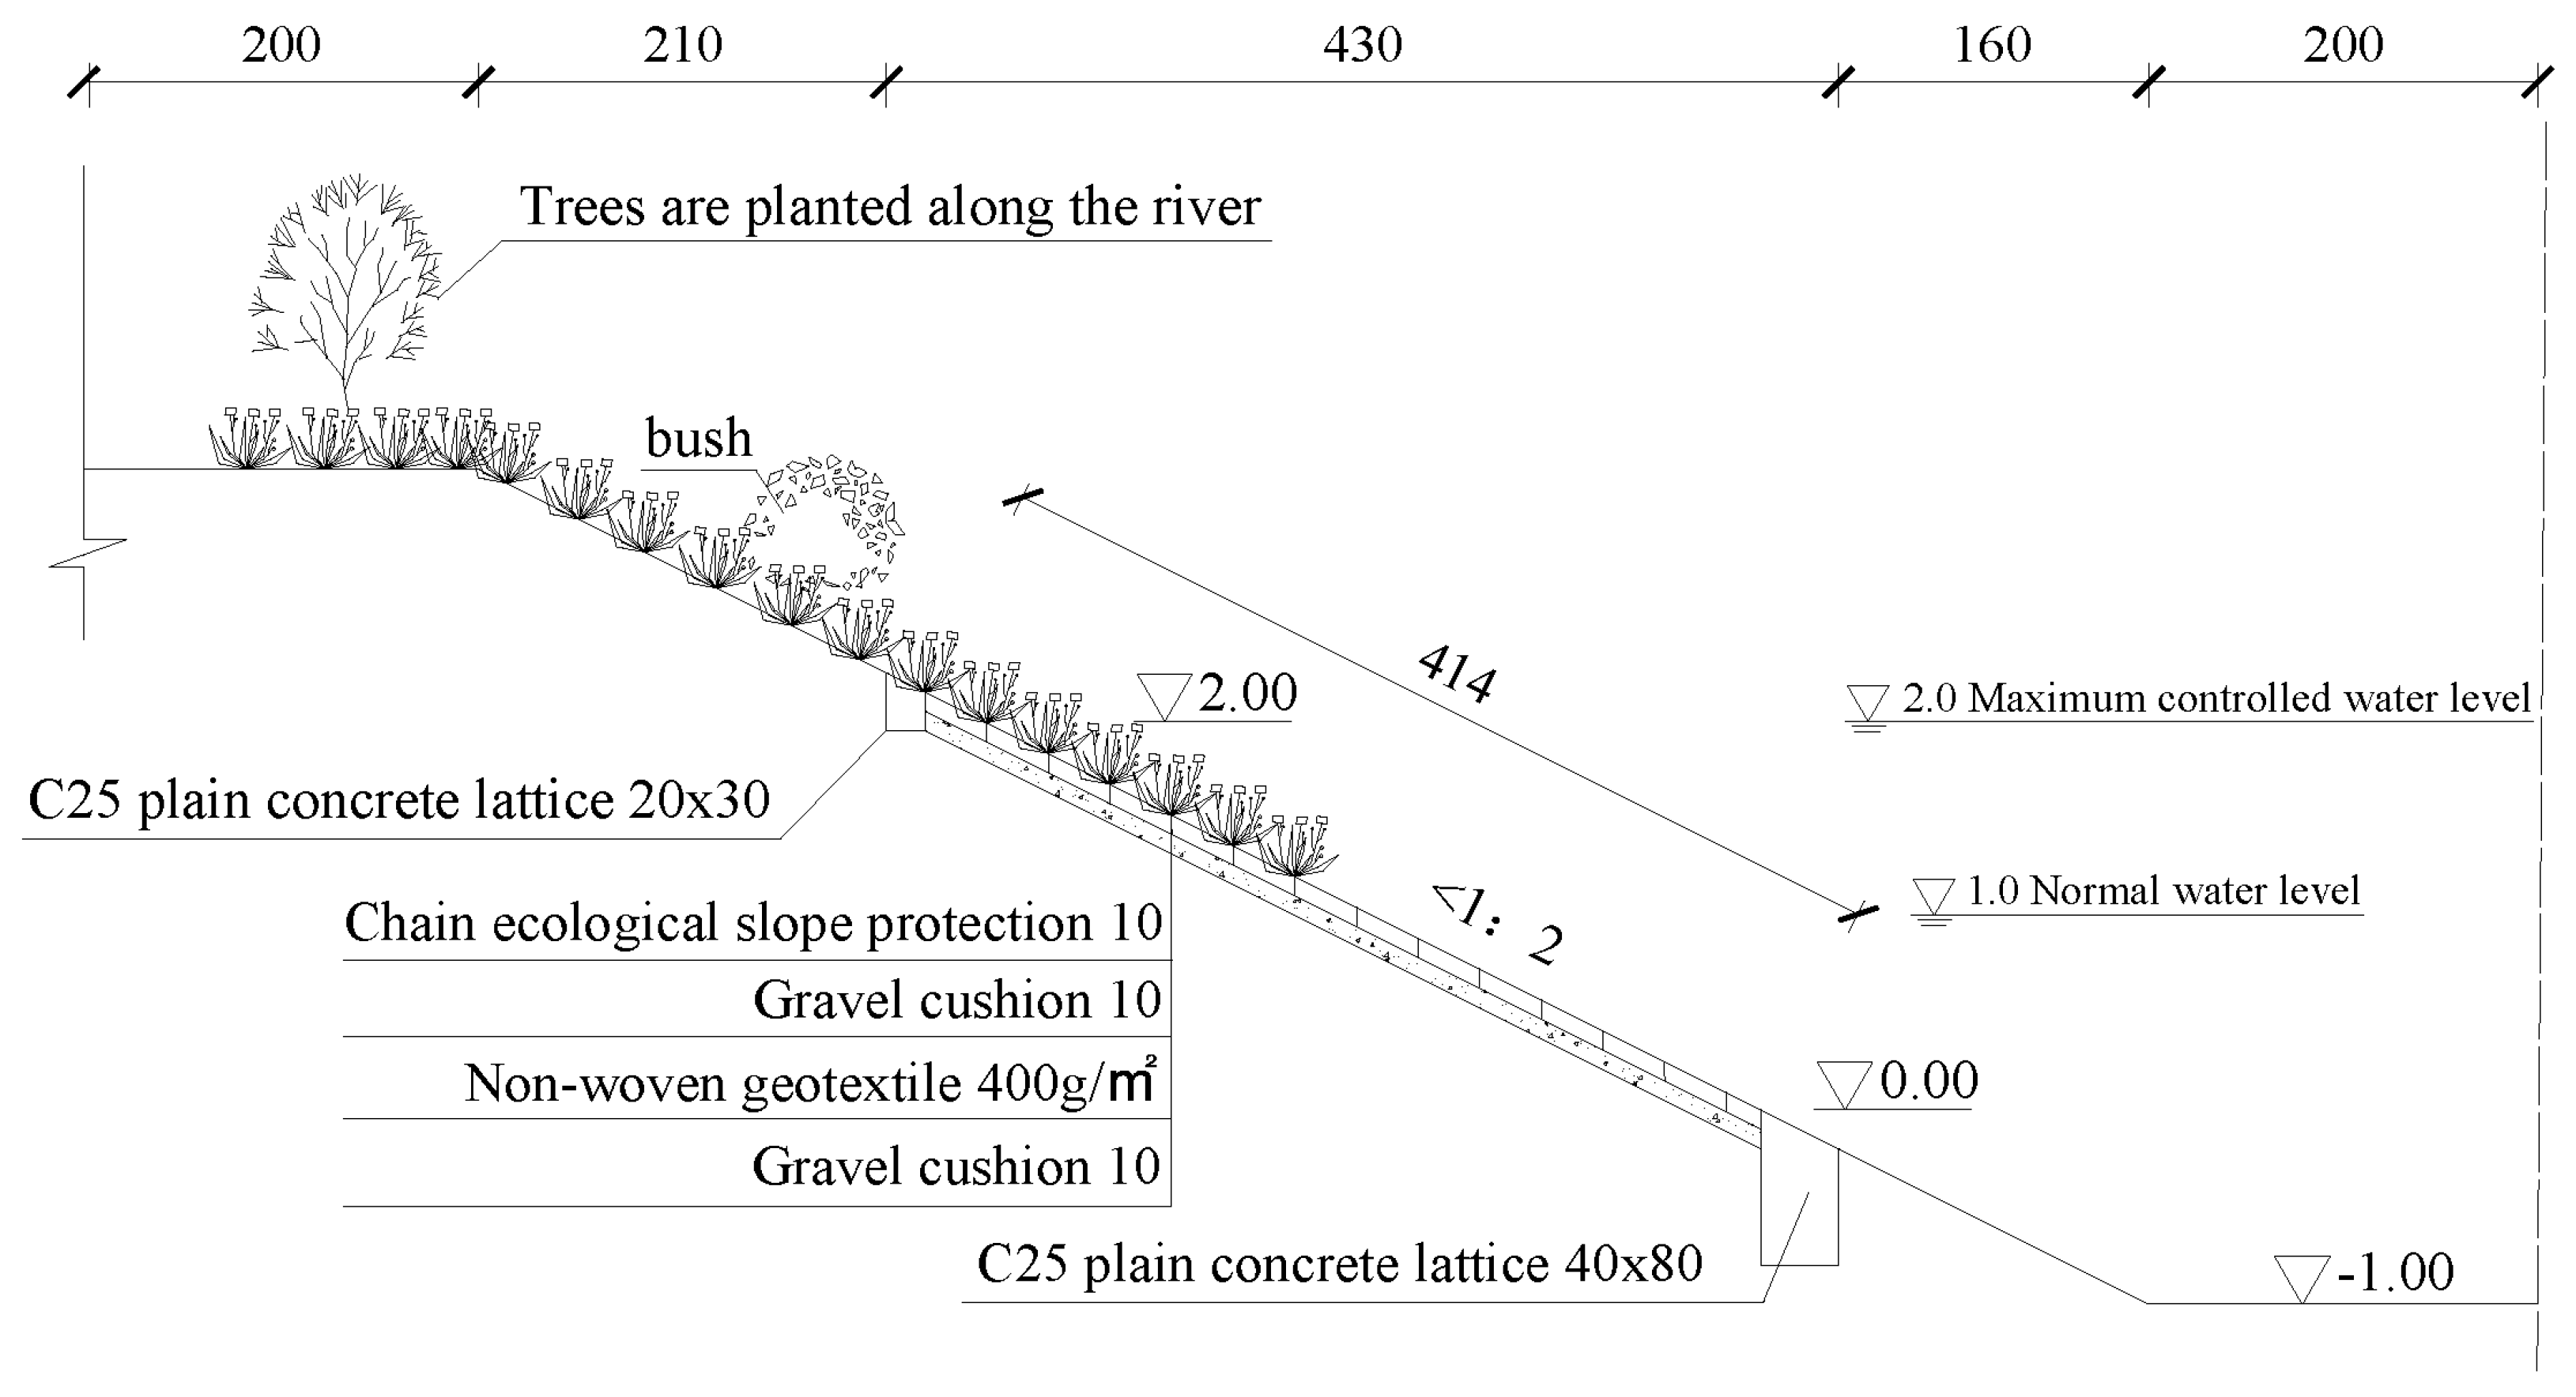
- I-shaped interlocking block structure
2.3. Carbon Emission Calculation
2.3.1. Life Cycle Theory
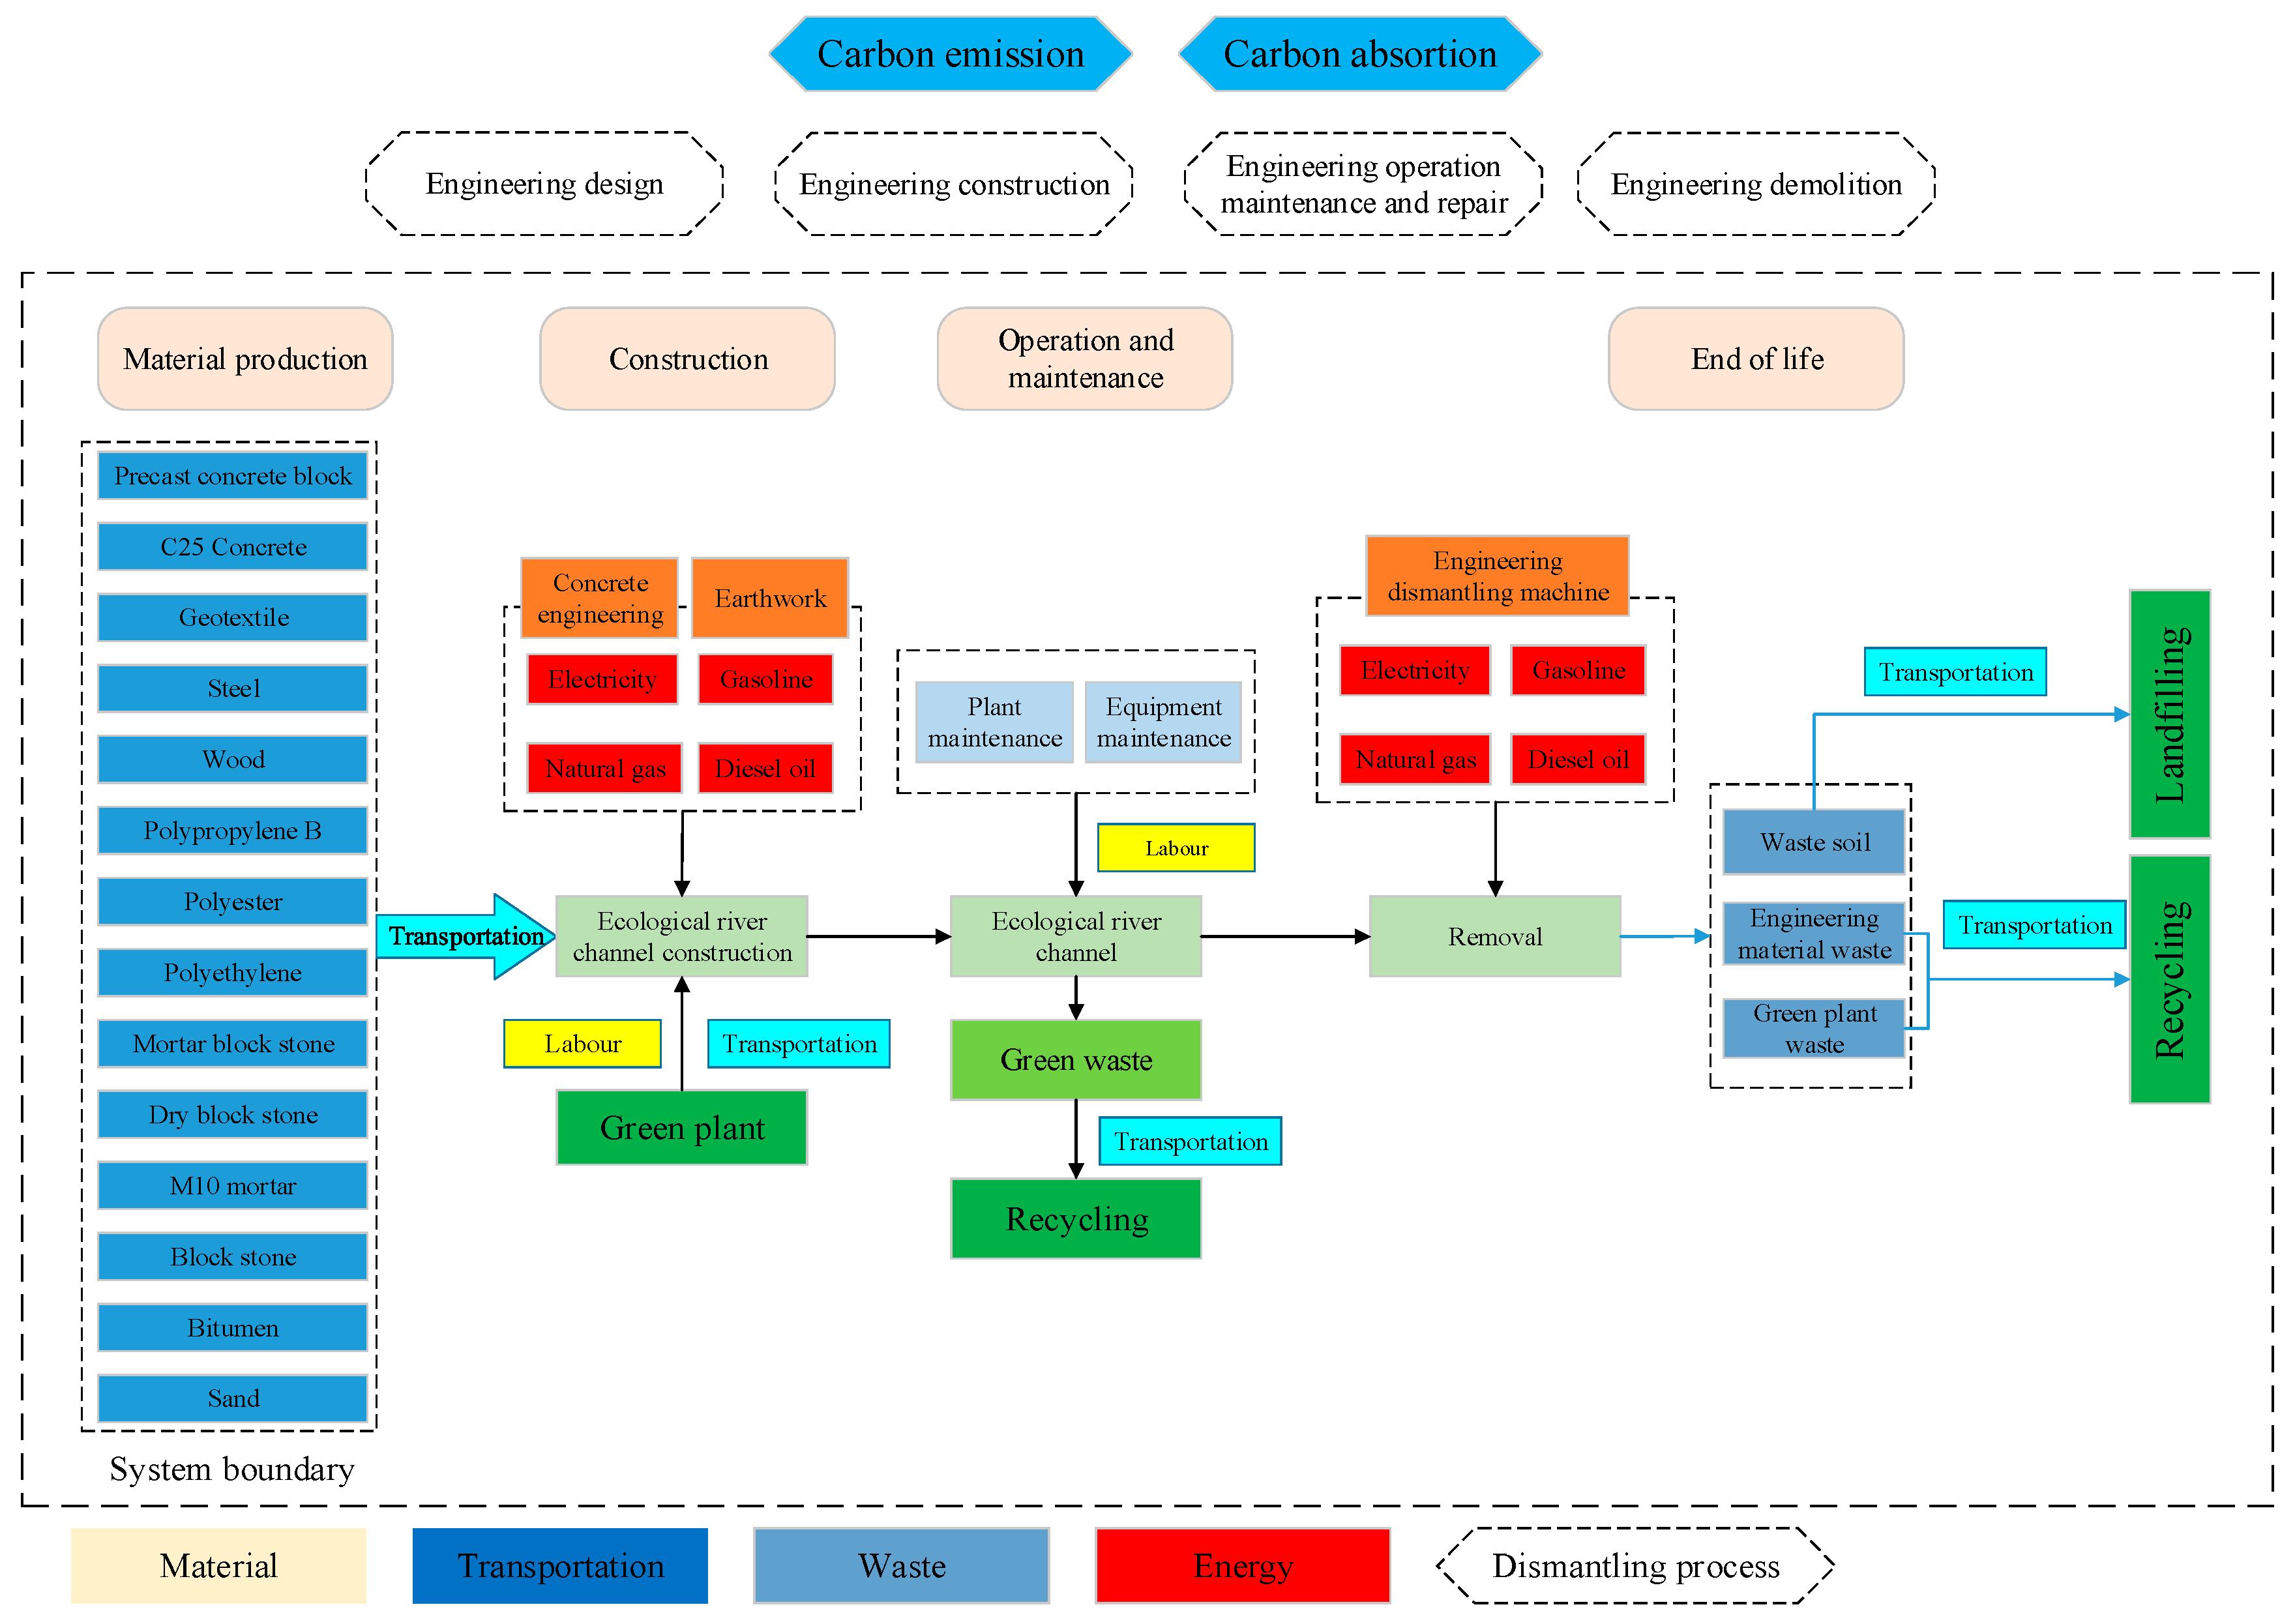
2.3.2. System Boundary Determination
2.3.3. Calculation Process
- (1)
- The carbon emission of the revetment material production stage is calculated as follows:where Mi represents the consumption amount of type i revetment materials (t or m3 according to the attribute of materials), and FBM,i represents the production carbon emission factor of type i materials. By default, all kinds of materials are commodities or prefabricated products.
- (2)
- The carbon emission in the transportation stage of materials is calculated as follows:where represents the carbon emission factor of material transportation when type p transportation mode (i.e., highway transportation by gasoline truck) is adopted; Bi represents the total weight of type i materials (t); and Li represents the distance of type i materials from the origin to the construction site (km).
- (3)
- The carbon emission in the construction stage of the ecological revetment project is calculated as follows:where FMC,j represents the carbon emission factor of type j construction machinery and equipment; Xj represents the total workload of type j machinery and equipment (work shift); and Nj represents the number of type j machinery and equipment.
2.4. Carbon Emission Factors
2.5. Data Analysis
3. Results
3.1. Engineering Quantity Analysis
3.2. Carbon Footprint Analysis
4. Discussion
4.1. Source of Carbon Emission Factor
4.2. Design Process
4.3. Construction Process
4.4. Materials
4.5. Implications
5. Conclusions
- (1)
- Carbon emission factors for ecological revetment technologies could be divided into six sources: earth and rock engineering, building material, transportation engineering, construction machinery and equipment, substrate engineering and labour. In the carbon emission factors of six ecological revetment technologies, building materials have the largest adjusting potential for carbon reduction.
- (2)
- The concrete material emerges as the primary contributor to carbon emissions in ecological river engineering, followed by gasoline truck transportation and earthwork excavation. The concrete material is responsible for 55.37–95.86% of carbon emissions in various ecological river protection technologies, with an average proportion of 69.96%.
- (3)
- In terms of total carbon footprint, the carbon emissions from ecological frame structure were the largest, followed by those of block structures, gabion structures, planted concrete and interlocking blocks. The wooden stake structure has the smallest carbon footprint. Engineers should focus on increasing the optimal allocation of plants to increase the carbon sequestration capacity of ecological revetment technologies.
- (4)
- The choice of ecological revetment technologies is not only related to the realisation of regional water conservancy ecological functions, but it also affects the carbon emissions of water conservancy projects. Engineers and decision-makers should pay great attention to the optimal design of the project, selection of low-carbon materials, and energy saving and emission reduction during construction processes in the future.
Author Contributions
Funding
Institutional Review Board Statement
Informed Consent Statement
Data Availability Statement
Conflicts of Interest
References
- Ding, W. Research on Waterfront Landscape Design of the Tai Lake New Town in Wuzhong, Suzhou Based on the Concept of Urban Double Repair; Northeast Electric Power University: Jilin City, China, 2023. [Google Scholar]
- Chen, X. Study on Landscape Design of Waterfront Greenway under the Concept of "Urban Double Repair"—Take Shanghai Sijingtang Si Bin Greenway (Bingyue Section) as an Example; Nanjing Forestry University: Nanjing, China, 2023. [Google Scholar]
- Veról, A.P.; Battemarco, B.P.; Merlo, M.L.; Machado, A.C.M.; Haddad, A.N.; Miguez, M.G. The urban river restoration index (URRIX)—A supportive tool to asses fluvial environment improvement in urban flood control projects. J. Clean. Prod. 2019, 239, 118058. [Google Scholar] [CrossRef]
- Prior, J. Urban river design and aesthetics: A river restoration case study from the UK. J. Urban Des. 2016, 21, 512–529. [Google Scholar] [CrossRef]
- Rozos, E.; Makropoulos, C.; Maksimovic, C. Rethinking urban areas: An example of an integrated blue-green approach. Water Sci. Technol. Water Supply 2013, 13, 1534–1542. [Google Scholar] [CrossRef]
- Lofton, D.D.; Hershey, A.E.; Whalen, S.C. Evaluation of denitrification in an urban stream receiving wastewater effluent. Biogeochemistry 2007, 86, 77–90. [Google Scholar] [CrossRef]
- Raymond, P.A.; Oh, N.H.; Turner, R.E.; Broussard, W. Anthropogenically enhanced fluxes of water and carbon from the Mississippi River. Nature 2008, 451, 449–452. [Google Scholar] [CrossRef]
- Jiguo, Y. Global warming exacerbates the severe challenges faced by mankind. Democr. Sci. 2023, 5, 42–45. [Google Scholar]
- Wei, L.; Bright, C.; Xiaoxiao, L.; Dianxiu, Y.; Ci, W.; Shuai, S. Under the background of climate warming climate feasibility work thinking. China’s Flood Control. Drought Relief 2023, 11, 1–7. [Google Scholar] [CrossRef]
- Allan, J.D.; Castillo, M.M. Stream Ecology: Structure and Function of Running Waters; Springer: Dordrecht, The Netherlands, 2007. [Google Scholar]
- Pan, B.Z.; Wang, Z.Y.; Xu, M.Z. Macroinvertebrates in abandoned channels: Assemblage characteristics and their indications for channel management. River Res. Appl. 2012, 28, 1149–1160. [Google Scholar] [CrossRef]
- Pan, B.; Yuan, J.; Zhang, X.; Wang, Z.; Chen, J.; Lu, J.; Yang, W.; Li, Z.; Zhao, N.; Xu, M. A review of ecological restoration techniques in fluvial rivers. Int. J. Sediment Res. 2016, 31, 110–119. [Google Scholar] [CrossRef]
- Damashek, J.; Smith, J.M.; Mosier, A.C.; Francis, C.A. Benthic ammonia oxidizers differ in community structure and biogeochemical potential across a riverine delta. Front. Microbiol. 2014, 5, 743–760. [Google Scholar] [CrossRef]
- Qiao, X.J.; Kristoffersson, A.; Randrup, T.B. Challenges to implementing urban sustainable stormwater management from a governance perspective: A literature review. J. Clean. Prod. 2018, 196, 943–952. [Google Scholar] [CrossRef]
- Findlay, S.J.; Taylor, M.P. Why rehabilitate urban river systems? Area 2006, 38, 312–325. [Google Scholar] [CrossRef]
- Tang, W.; Xu, Y.J.; Ma, Y.; Maher, D.T.; Li, S. Hot spot of CH4 production and diffusive flux in rivers with high urbanization. Water Res. 2021, 204, 116624. [Google Scholar] [CrossRef] [PubMed]
- Wang, X.; He, Y.; Chen, H.; Yuan, X.; Peng, C.; Yue, J.; Zhang, Q.; Zhou, L. CH4 concentrations and fluxes in a subtropical metropolitan river network: Watershed urbanization impacts and environmental controls. Sci. Total Environ. 2018, 622, 1079–1089. [Google Scholar] [CrossRef]
- Wang, J.; Wang, X.; Liu, T.; Yuan, X.; Chen, H.; He, Y.; Wu, S.; Yuan, Z.; Li, H.; Que, Z.; et al. pCO2 and CO2 evasion from two small suburban rivers: Implications of the watershed urbanization process. Sci. Total Environ. 2021, 788, 147787. [Google Scholar] [CrossRef] [PubMed]
- Zhang, W.; Li, H.; Xiao, Q.; Li, X. Urban rivers are hotspots of riverine greenhouse gas (N2O, CH4, CO2) emissions in the mixed-landscape Chaohu Lake Basin. Water Res. 2020, 189, 11624. [Google Scholar] [CrossRef]
- Deng, L.; Liu, F.; Chen, Y.; Hou, Y.; Yuan, S. Research progress on influences of urbanization on carbon emissions of rivers. Yangtze River 2023, 54, 80–87. [Google Scholar]
- Wang, J.S.; Kong, L.N.; Lin, M.S.; Min, F.Y. Review on the characteristics and functions of riparian zone. J. Yangtze River Res. Inst. 2011, 28, 28–35. [Google Scholar]
- Jihong, X. Research on Theory and Application of Ecological Riparian Zone Comprehensive Evaluation; Hohai University: Nanjing, China, 2005. [Google Scholar]
- Erhui, G.; Hao, S.R.; Liding, C. Current status and prospects of research on main ecological service functions of riparian vegetation buffer zones. Chin. J. Ecol. 2011, 30, 1830–1837. [Google Scholar] [CrossRef]
- Li, L.; Chen, M.; Zhou, X.; Lu, L.; Wang, Y.; Cheng, X. Evaluation of the preparation and fertilizer release performance of planting concrete made with recycled-concrete aggregates from demolition. J. Clean. Prod. 2018, 200, 54–64. [Google Scholar] [CrossRef]
- He, Y.; Wang, P.; Sheng, H.; Wang, D.; Huang, M.; Cao, C. Sustainability of riparian zones for non-point source pollution control in chongming island: Status, challenges, and perspectives. J. Clean. Prod. 2020, 244, 118804. [Google Scholar] [CrossRef]
- Zhu, W.; Li, J.; Zhang, Y.; Miao, J.; Cheng, M.; Yao, A.; Jing, Z. Hydrothermal synthesis of a novel ecological revetment material by sediment mixed with biochar. J. Clean. Prod. 2021, 326, 129380. [Google Scholar] [CrossRef]
- Liu, S. The Research on Carbon Foot Print Evaluation During the Materialization Phase of Prefabricated Concrete Buildings; Dalian University of Technology: Dalian, China, 2021. [Google Scholar]
- Ren, Q. Study on Carbon Footprint Analysis and Evaluation of Recycling of Old Industrial Buildings during Construction Period; Xi’an University of Architecture and Technology: Xi’an, China, 2021. [Google Scholar]
- Zhang, L. Research on Calculation Model and Application of Green Building Carbon Footprint Based on BIM Technology; Yangzhou University: Yangzhou, China, 2022. [Google Scholar]
- Zuo, Q.; Qiu, Y.; Zhong, T. China’s new journey of water conservancy development under the “carbon peak and neutrality” goals. China Water Resour. 2022, 22, 29–33. [Google Scholar]
- Huang, Y.; Yaoru, L.I.U.; Wenbin, X.U.; Junfeng, L.I. Life cycle carbon emissions of water reservoir and hydroelectric projects: A case study of the Quanmutang project. J. Tsinghua Univ. Sci. Technol. 2022, 62, 1366–1373. [Google Scholar]
- Li, W.L.; Li, J.H.; Sun, J.L. Life cycle assessment of carbon emission in river revetment engineering. Environ. Sci. Technol. 2013, 36, 200–205. [Google Scholar]
- Yu, Y.; Xiao, W.; Wang, Y.; Shang, S.; Wang, H.; Huang, Y. Evaluation of the carbon emission reduction effects of ecological river revetment construction. J. Water Clim. Change 2021, 12, 362–370. [Google Scholar] [CrossRef]
- Rebitzer, G.; Ekvall, T.; Frischknecht, R.; Hunkeler, D.; Norris, G.; Rydberg, T.; Schmidt, W.P.; Suh, S.; Weidema, B.P.; Pennington, D.W. Life cycle assessment: Part 1: Framework, goal and scope definition, inventory analysis, and applications. Environ. Int. 2004, 30, 701–720. [Google Scholar] [CrossRef] [PubMed]
- ISO14040; Environmental Management-Life Cycle Assessment-Principles and Framework. International Standard Organization: Geneva, Switzerland, 1997.
- Li, Z.L. Comparative Study on Environmental Impact of Two Slope Protection Construction Periods Based on LCA; Harbin Institute of Technology: Harbin, China, 2020. [Google Scholar]
- Cui, P. Research on Construction and Application of Building Life Cycle Carbon Emission Factor Bank; Southeast University: Nanjing, China, 2015. [Google Scholar]
- Chen, C. Research on Building Carbon Emission Control and Prediction Based on LCA; Huazhong University of Science and Technology: Wuhan, China, 2013. [Google Scholar]
- Chuke, Z.; Tao, T.; Zhiyin, W.; Haihong, L.U.; Fei, X. Carbon footprint calculation and comparative study of polypropylene products. Green Low Carbon Pet. Petrochem. 2021, 6, 17–23. [Google Scholar]
- GBT_51366-2019; Building Carbon Emission Calculation Standard. China Building and Construction Press: Beijing, China, 2019.
- Li, X.; Xu, H. Life Cycle Evaluation of Steel Based on GaBi Software. Environ. Prot. Circ. Econ. 2009, 29, 15–18. [Google Scholar]
- Shuang, R. Research on carbon emission estimation of textile chemical fiber industry in China. Text. Sci. Res. 2021, 09, 57–61. [Google Scholar]
- Wenjing, W.; Xiang, S.; Ping, Z. Estimation and analysis of energy consumption in the whole process of polyethylene production. Tianjin Chem. Ind. 2016, 30, 21–22. [Google Scholar]
- Jiao, L.; Chen, D.; Yuansheng, L.; Xiwen, Z.; Zequn, Y. Road asphalt carbon footprint research. J. Mod. Chem. Ind. 2016, 4, 12–16. [Google Scholar]
- Ping, Y.; Xiaoqiu, C.; Luyi, M.A. Residential building life cycle carbon research review. Build. Sci. 2011, 27, 9–12+35. [Google Scholar] [CrossRef]
- Zhou, X.J. Analysis of Current situation and Future Trend of Energy consumption in Transportation Industry. China Foreign Energy 2010, 15, 9–18. [Google Scholar]
- Jing, Z.; Jixi, G. Domestic energy consumption and its impact on carbon emission: A case study of Beijing. In Proceedings of the 2010 International Conference on Remote Sensing (ICRS 2010), Hangzhou, China, 5–6 October 2010; Volume 3, pp. 643–646. [Google Scholar]
- Mu, K.; Pan, W.; Wang, L.; Li, T.; Chen, Y.; Ding, D. Research Status and Prospects of Slope Protection Engineering Technology by Vegetation in Ecological River. J. Water Resour. Archit. Eng. 2022, 20, 206–216. [Google Scholar]
- Chen, M.; Chen, C.; Liu, D. Four paths of water conservancy to achieve the goal of “double carbon”. Water Resour. Dev. Res. 2022, 22, 1–4. [Google Scholar]
- Xiaodong, L.; Jie, Z.; Bingjie, P.; Tao, W. Carbon emission calculation of ready-mixed concrete and analysis and research of low carbonization technology path. New Build. Mater. 2022, 49, 160–166. (In Chinese) [Google Scholar]
- Jin, Z.; Xiao, M.; Jianye, A.; Xiaobo, Y.; Ruiyun, W.; Shengjie, W. Evaluation and implementation of low-carbon concrete. Concr. World 2023, 11, 88–91. (In Chinese) [Google Scholar]
- Zhang, Y.M. Assessment of Carbon Footprint and Sequestration of Prefabricated Buildings throughout Life Cycle; Chang’an University: Xi’an, China, 2023. [Google Scholar]
- Lu, X. Uncertainty-Based Carbon Footprint Measurement and Optimization of Logistics Processes in Prefabricated Buildings; Guangdong University of Technology: Guangzhou, China, 2022. [Google Scholar]
- Yi, L.; Jia, L.; Jiong, Z. Water conservancy engineering field in the aspect of carbon reduction measures and progress. Water Resour. Dev. Manag. 2023, 9, 60–64+45+73. [Google Scholar]
- Yong, S.; Zhijun, S.; Fangyu, S.; Xiujin, X.; Deguo, H.; Jia, L.; Yi, L.; Jiong, Z. Development trend and research progress of hydraulic engineering under the background of “dual carbon”. Water Conserv. Dev. Res. 2023, 23, 30–36. [Google Scholar]
- Yijie, L. Revetment engineering of modular design and traditional design cost comparison analysis. J. Build. Econ. 2021, 2, 90–93. [Google Scholar]
- Dan, C.; Wenjian, Y.; Shixiong, Z.; Xiaochun, C.; Lishan, T. Introduction to traditional revetment to the transformation of ecological revetment. J. Inf. Sci. Technol. 2020, 17, 81–83. [Google Scholar]


| Carbon Emission Source | Carbon Emission Factor | Carbon Emission Factor Value | Carbon Emission Factor Unit | Reference |
|---|---|---|---|---|
| A Earth and rock engineering | A1 Levelling land (m3) | 0.023 | kg·m−3 | [38] |
| A2 Earthwork excavation (m3) | 1.086 | kg·m−3 | [38] | |
| A3 Earthwork backfill (m3) | 0.128 | kg·m−3 | [38] | |
| B Building material | B1 Precast concrete block (m3) | 146 | kg·m−3 | [39] |
| B2 C25 Concrete (m3) | 250.54 | kg·m−3 | [39] | |
| B3 Geotextile (m2) | 0.16 | kg·m−2 | [40] | |
| B4 Steel (t) | 1789.06 | kg·t−1 | [41] | |
| B5 Wood (m3) | 10.45 | kg·m−3 | [39] | |
| B6 Polypropylene B (kg) | 0.6114 | kg·kg−1 | [39] | |
| B7 Polyester (kg) | 0.51 | kg·kg−1 | [42] | |
| B8 Polyethylene (kg) | 2.81 | kg·kg−1 | [43] | |
| B9 Mortar block stone (m3) | 114.412 | kg·m−3 | [40] | |
| B10 Dry block stone (m3) | 12.556 | kg·m−3 | [40] | |
| B11 M10 mortar (m3) | 315.39 | kg·m−3 | [40] | |
| B12 Block stone (m3) | 6.05 | kg·m−3 | [38] | |
| B13 Bitumen (t) | 586.52 | kg·t−1 | [44] | |
| B14 Sand (t) | 2.51 | kg·t−1 | [40] | |
| C Transportation engineering | C1 Gasoline truck transport (100 t·km) | 14.21 | kg/100 t·km | [45,46] |
| D Construction machinery and equipment | D1 Mixer (one-shift) | 10.3 | kg/Stage crew | [37] |
| D2 Grout machine (one-shift) | 16.72 | kg/Stage crew | [37] | |
| E Substrate engineering | E1 Fine gravel cushion (m3) | 8.76 | kg·m−3 | [37] |
| E2 Grit cushion (m3) | 2.51 | kg·m−3 | [37] | |
| F Labour | F1 Workforce | 0.3 | kg·d−1 | [47] |
| Carbon Emission Source | Bill of Quantities | Engineering Quantities | |||||
|---|---|---|---|---|---|---|---|
| Wooden Pile Construction | Block Masonry Structure | Stone Cage Structure | Ecological Frame Structure | Porous Concrete for Plant-Growing | Interlocking Segment Structure | ||
| A Earth and rock engineering | A1 Levelling land (m3) | 300.00 | 300.00 | 300.00 | 300.00 | 300.00 | 300.00 |
| A2 Earthwork excavation (m3) | 56.52 | 703.42 | 1251.00 | 893.99 | 286.20 | 241.60 | |
| A3 Earthwork backfill (m3) | 12.50 | 344.00 | 539.00 | 403.25 | 47.00 | 4.70 | |
| B Building material | B1 Precast concrete block (m3) | \ | 50.62 | \ | 105.00 | \ | 78.10 |
| B2 C25 Concrete (m3) | \ | 165.60 | 114.00 | 140.00 | 163.20 | 76.00 | |
| B3 Geotextile (m2) | 100.00 | 200.00 | 300.00 | 644.00 | \ | 828.00 | |
| B4 Steel (t) | 0.10 | 15.79 | 11.09 | 12.96 | \ | \ | |
| B5 Wood (m3) | 56.52 | \ | \ | \ | \ | \ | |
| B6 Polypropylene B (kg) | \ | \ | \ | \ | \ | \ | |
| B7 Polyester (kg) | \ | \ | \ | \ | \ | \ | |
| B8 Polyethylene (kg) | \ | \ | \ | \ | \ | \ | |
| B9 Mortar block stone (m3) | \ | \ | \ | \ | \ | \ | |
| B10 Dry block stone (m3) | \ | \ | \ | \ | \ | \ | |
| B11 M10 mortar (m3) | \ | \ | \ | \ | \ | \ | |
| B12 Block stone (m3) | \ | \ | 150.00 | 144.00 | \ | \ | |
| B13 Bitumen (m3) | \ | \ | \ | \ | \ | \ | |
| B14 Sand (t) | \ | \ | \ | \ | \ | \ | |
| C Transportation engineering | C1 Gasoline truck transport (100 t·km) | 4.53 | 53.48 | 50.98 | 96.98 | 50.57 | 49.43 |
| D Construction machinery and equipment | D1 Mixer (one-shift) | \ | 2.00 | 2.00 | 2.00 | 2.00 | 1.00 |
| D2 Grout machine (one-shift) | \ | 2.00 | 2.00 | 2.00 | 2.00 | 1.00 | |
| E Substrate engineering | E1 Fine gravel cushion (m3) | \ | 59.20 | \ | 101.74 | 76.00 | 82.80 |
| E2 Grit cushion (m3) | \ | \ | \ | \ | \ | \ | |
| F Labour | F1 Workforce | 10.00 | 10.00 | 10.00 | 10.00 | 5.00 | 10.00 |
| Carbon Emission Source | Carbon Emission Factor | Carbon Footprint (kg) | |||||
|---|---|---|---|---|---|---|---|
| Wooden Pile Construction | Block Masonry Structure | Stone Cage Structure | Ecological Frame Structure | Porous Concrete for Plant-Growing | Interlocking Segment Structure | ||
| A Earth and rock engineering | A1 Levelling land | 6.90 | 6.90 | 6.90 | 6.90 | 6.90 | 6.90 |
| A2 Earthwork excavation | 61.38 | 763.91 | 1358.59 | 970.87 | 310.81 | 262.38 | |
| A3 Earthwork backfill | 1.60 | 44.03 | 68.99 | 51.62 | 6.02 | 0.60 | |
| B Building material | B1 Precast concrete block | \ | 7390.52 | \ | 15,330.00 | \ | 11,402.09 |
| B2 C25 concrete | \ | 41,489.42 | 28,561.56 | 35,075.60 | 40,888.13 | 19,041.04 | |
| B3 Geotextile | 16.00 | 32.00 | 48.00 | 103.04 | \ | 132.48 | |
| B4 Steel | 178.91 | 28,252.84 | 19,845.15 | 23,186.22 | \ | \ | |
| B5 Wood | 590.63 | \ | \ | \ | \ | \ | |
| B6 Polypropylene B | \ | \ | \ | \ | \ | \ | |
| B7 Polyester | \ | \ | \ | \ | \ | \ | |
| B8 Polyethylene | \ | \ | \ | \ | \ | \ | |
| B9 Mortar block stone | \ | \ | \ | \ | \ | \ | |
| B10 Dry block stone | \ | \ | \ | \ | \ | \ | |
| B11 M10 mortar | \ | \ | \ | \ | \ | \ | |
| B12 Block stone | \ | \ | 907.50 | 871.20 | \ | \ | |
| B13 Bitumen | \ | \ | \ | \ | \ | \ | |
| B14 Sand | \ | \ | \ | \ | \ | \ | |
| C Transportation engineering | C1 Gasoline truck transport | 64.44 | 759.92 | 724.40 | 1378.03 | 718.57 | 702.37 |
| D Construction machinery and equipment | D1 Mixer | \ | 20.60 | 20.60 | 20.60 | 20.60 | 10.30 |
| D2 Grout machine | \ | 33.44 | 33.44 | 33.44 | 33.44 | 16.72 | |
| E Substrate engineering | E1 Fine gravel cushion | \ | 518.59 | \ | 891.24 | 665.76 | 725.33 |
| E2 Grit cushion | \ | \ | \ | \ | \ | \ | |
| F Labour | F1 Workforce | 7.30 | 7.30 | 7.30 | 7.30 | 3.65 | 7.30 |
| Total (kg) | 927.16 | 79,319.48 | 51,582.43 | 77,926.06 | 42,653.88 | 32,307.51 | |
Disclaimer/Publisher’s Note: The statements, opinions and data contained in all publications are solely those of the individual author(s) and contributor(s) and not of MDPI and/or the editor(s). MDPI and/or the editor(s) disclaim responsibility for any injury to people or property resulting from any ideas, methods, instructions or products referred to in the content. |
© 2024 by the authors. Licensee MDPI, Basel, Switzerland. This article is an open access article distributed under the terms and conditions of the Creative Commons Attribution (CC BY) license (https://creativecommons.org/licenses/by/4.0/).
Share and Cite
Liu, K.; Zhou, B.; Yang, Z.; Zhang, Y.; Ding, D. Carbon Footprint Quantification and Reduction Potential of Ecological Revetment in Water Net Region of China: Case Study in Yancheng, Jiangsu Province. Sustainability 2024, 16, 6902. https://doi.org/10.3390/su16166902
Liu K, Zhou B, Yang Z, Zhang Y, Ding D. Carbon Footprint Quantification and Reduction Potential of Ecological Revetment in Water Net Region of China: Case Study in Yancheng, Jiangsu Province. Sustainability. 2024; 16(16):6902. https://doi.org/10.3390/su16166902
Chicago/Turabian StyleLiu, Kun, Binrong Zhou, Zijie Yang, Yusheng Zhang, and Dianyuan Ding. 2024. "Carbon Footprint Quantification and Reduction Potential of Ecological Revetment in Water Net Region of China: Case Study in Yancheng, Jiangsu Province" Sustainability 16, no. 16: 6902. https://doi.org/10.3390/su16166902
APA StyleLiu, K., Zhou, B., Yang, Z., Zhang, Y., & Ding, D. (2024). Carbon Footprint Quantification and Reduction Potential of Ecological Revetment in Water Net Region of China: Case Study in Yancheng, Jiangsu Province. Sustainability, 16(16), 6902. https://doi.org/10.3390/su16166902