
Multiscale Tea Disease Detection with Channel–Spatial Attention
 ,
,
Abstract
1. Introduction
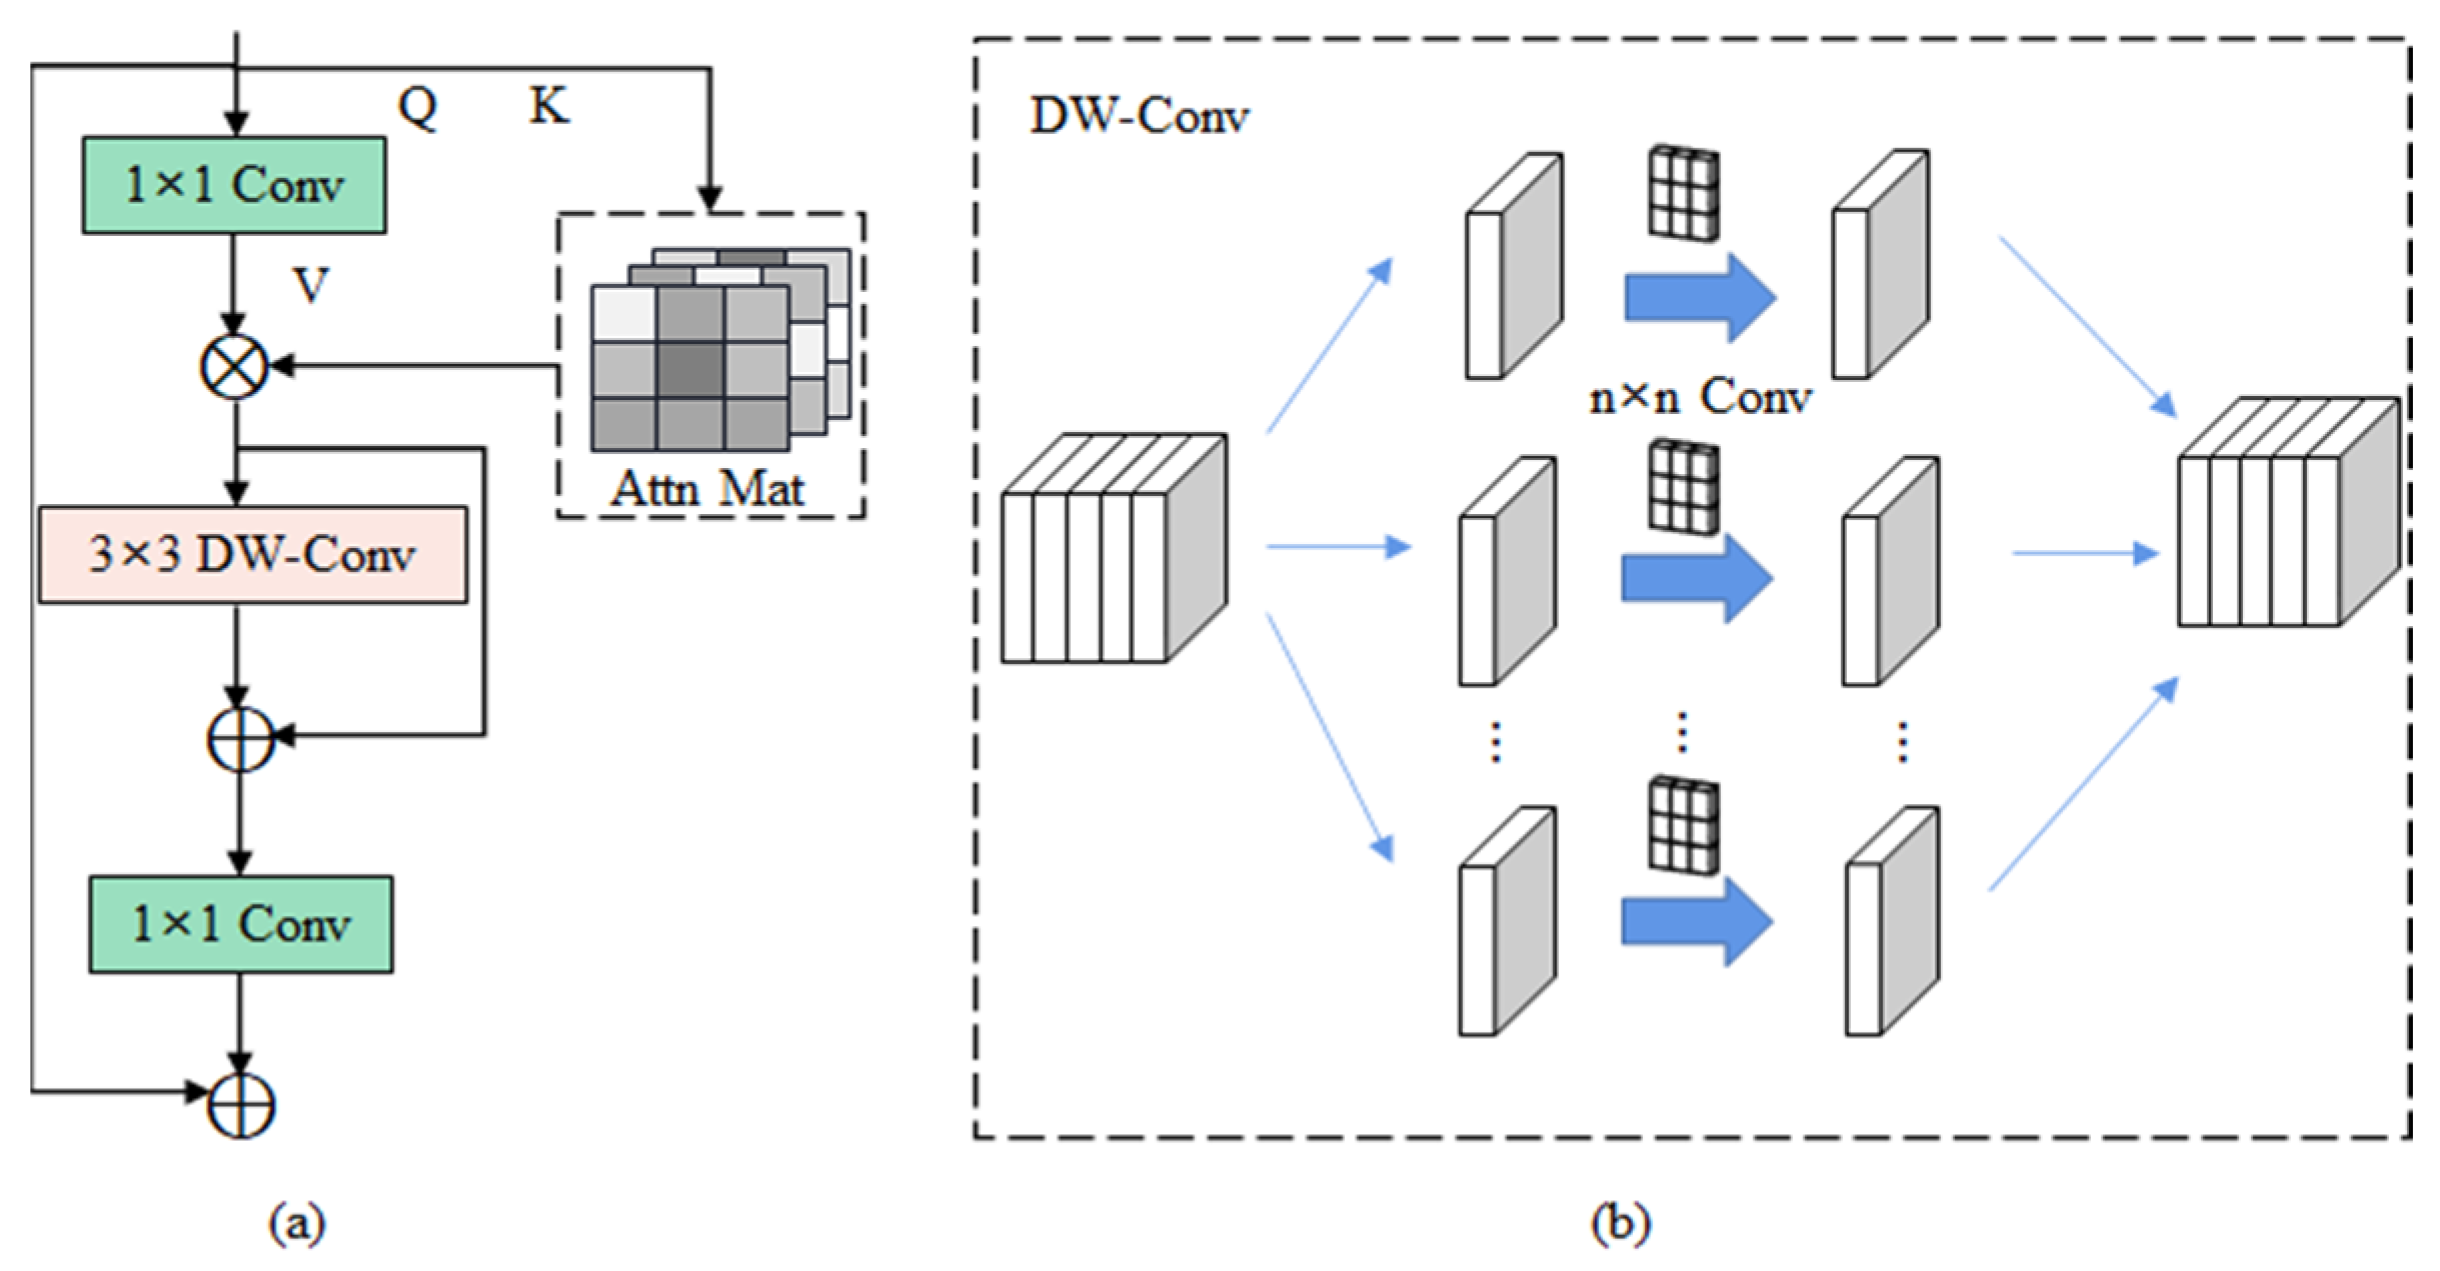
- TCSA enhances the backbone network’s ability to capture long-range dependencies of disease spots on leaves using inverted residual self-attention modules. Additionally, TCSA improves feature fusion in the neck with channel–spatial attention modules, enriching contextual semantic information of diseased regions and eliminating complex background noise.
- This paper designs a channel attention module, named Residual Channel Attention (RCA). RCA uses residual connections to enhance channel interactions and employs two pooling techniques to capture global information from each channel, thereby improving the distinction between diseased and healthy tea leaves.
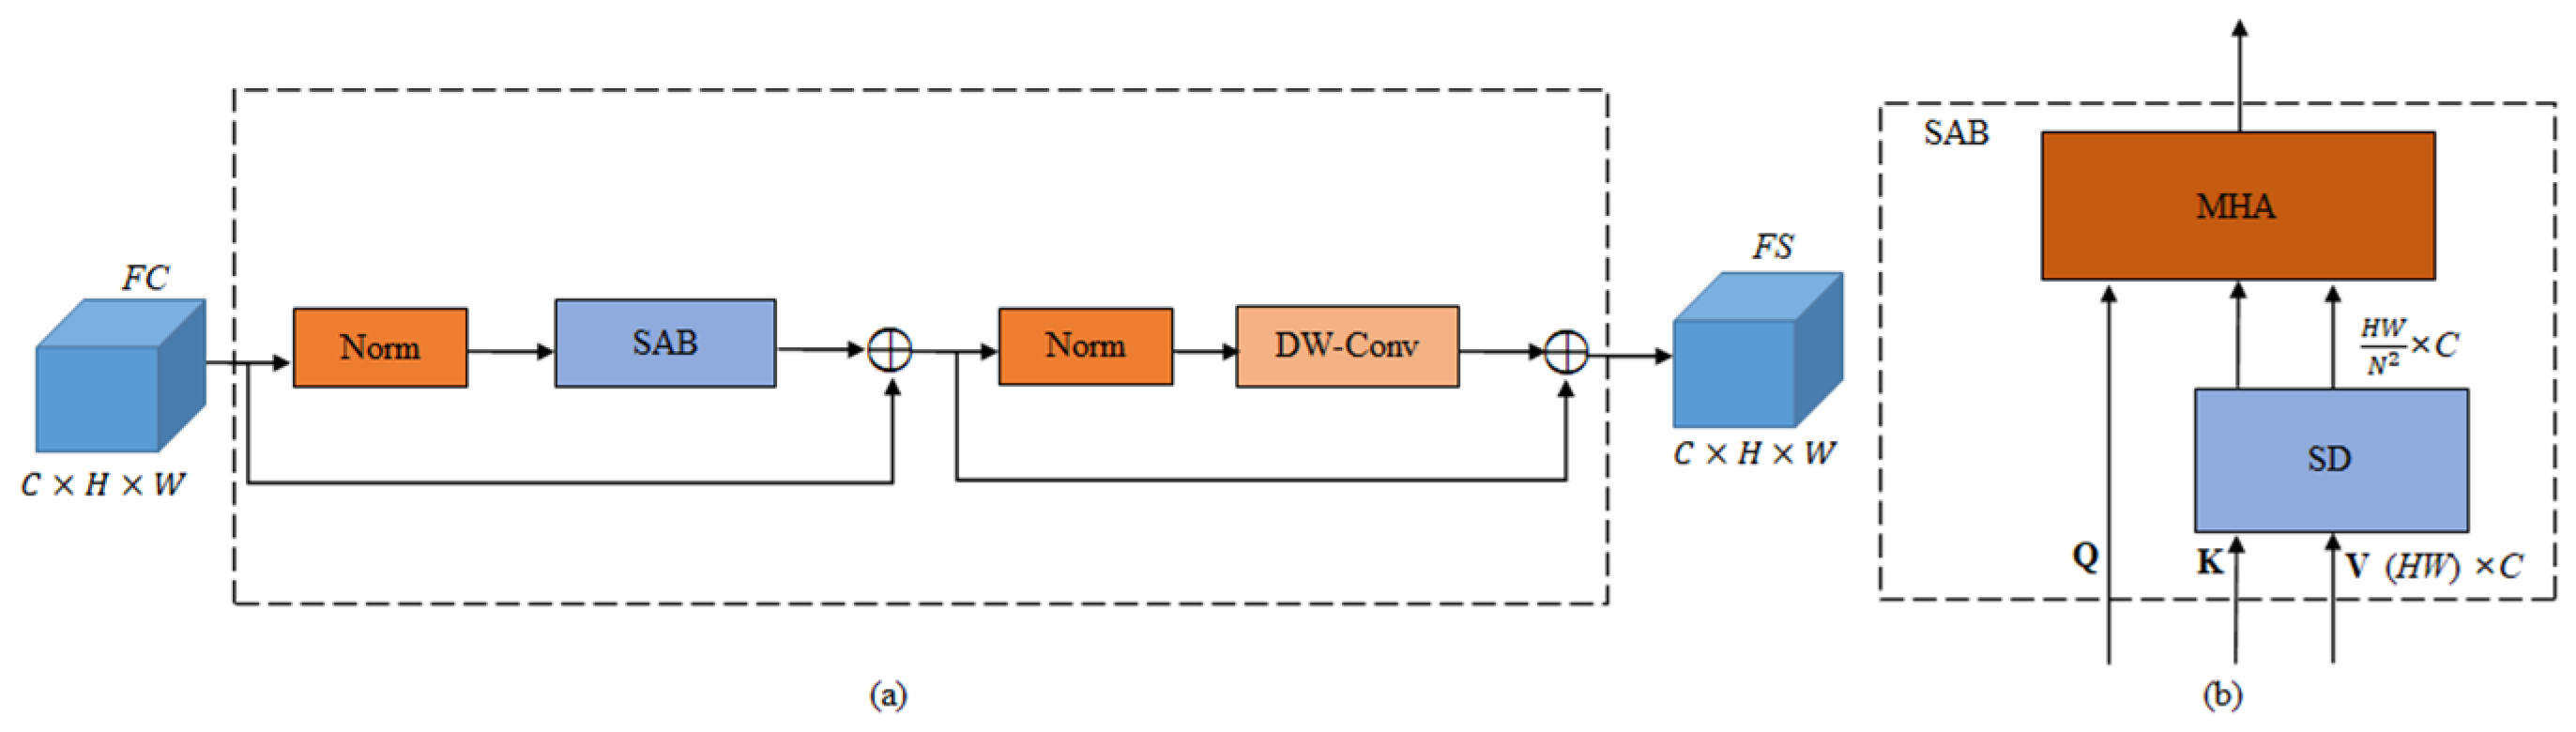
- This paper proposes a spatial attention module called spatial attention (SA). SA optimizes attention computation to reduce computational complexity and introduces Depth-Wise Convolution (DW-Conv) to focus on more informative disease regions, further reducing the computational load.
2. Materials
2.1. Disease Dataset
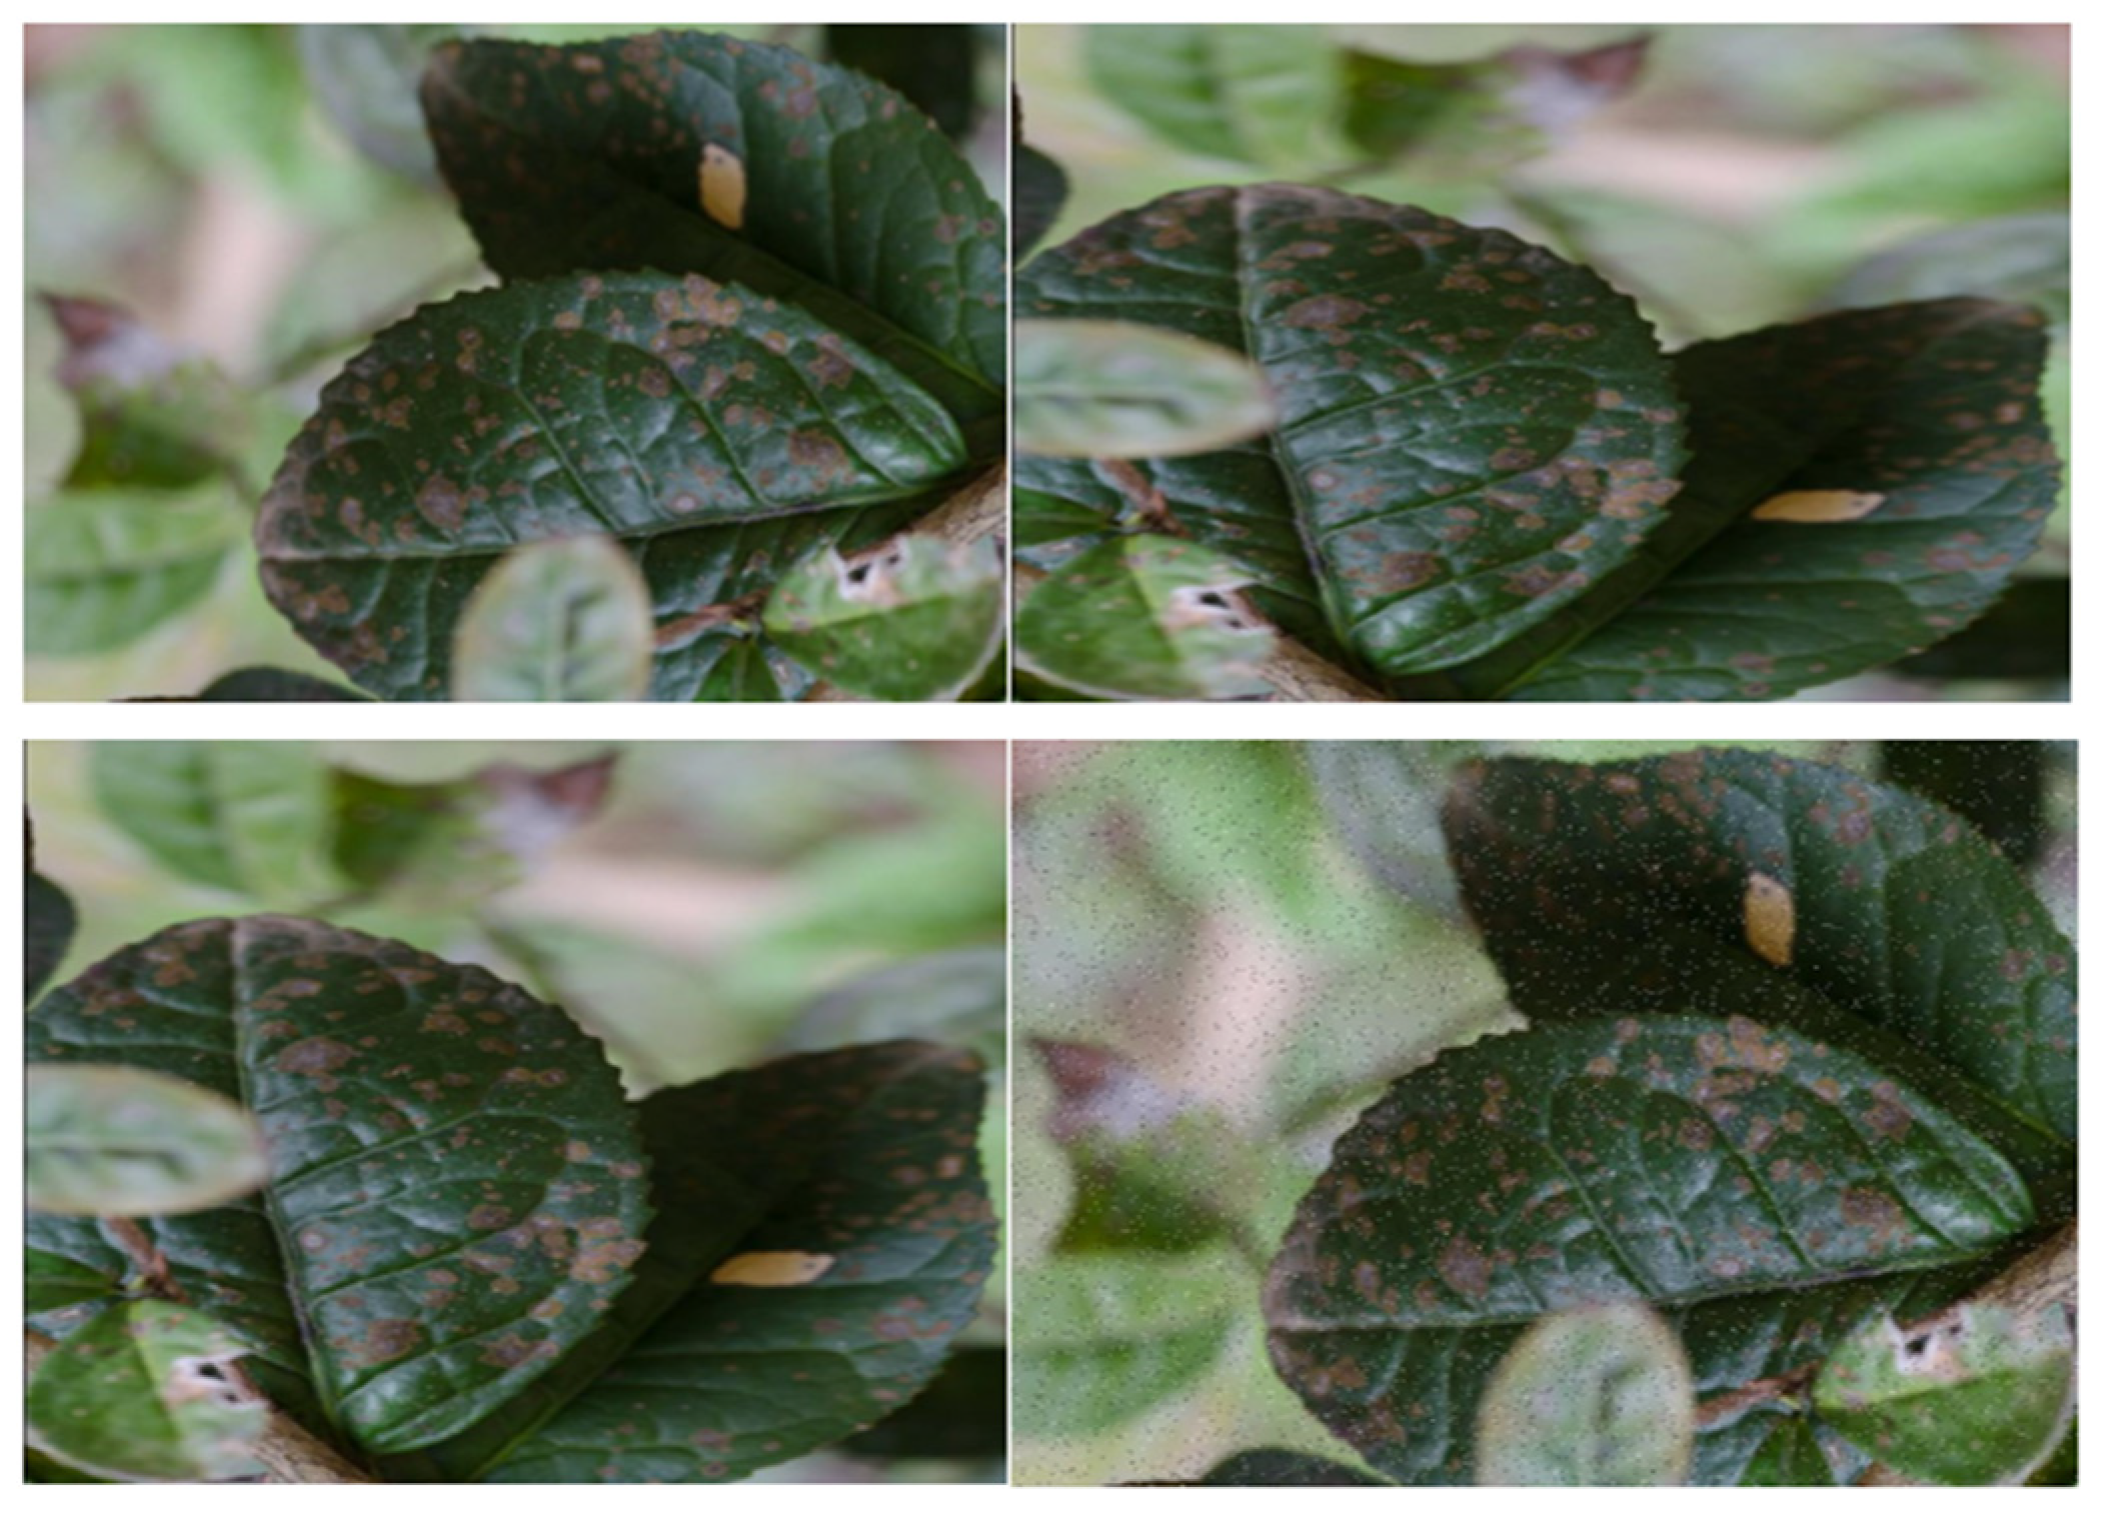
2.2. Data Augmentation
3. Methodology
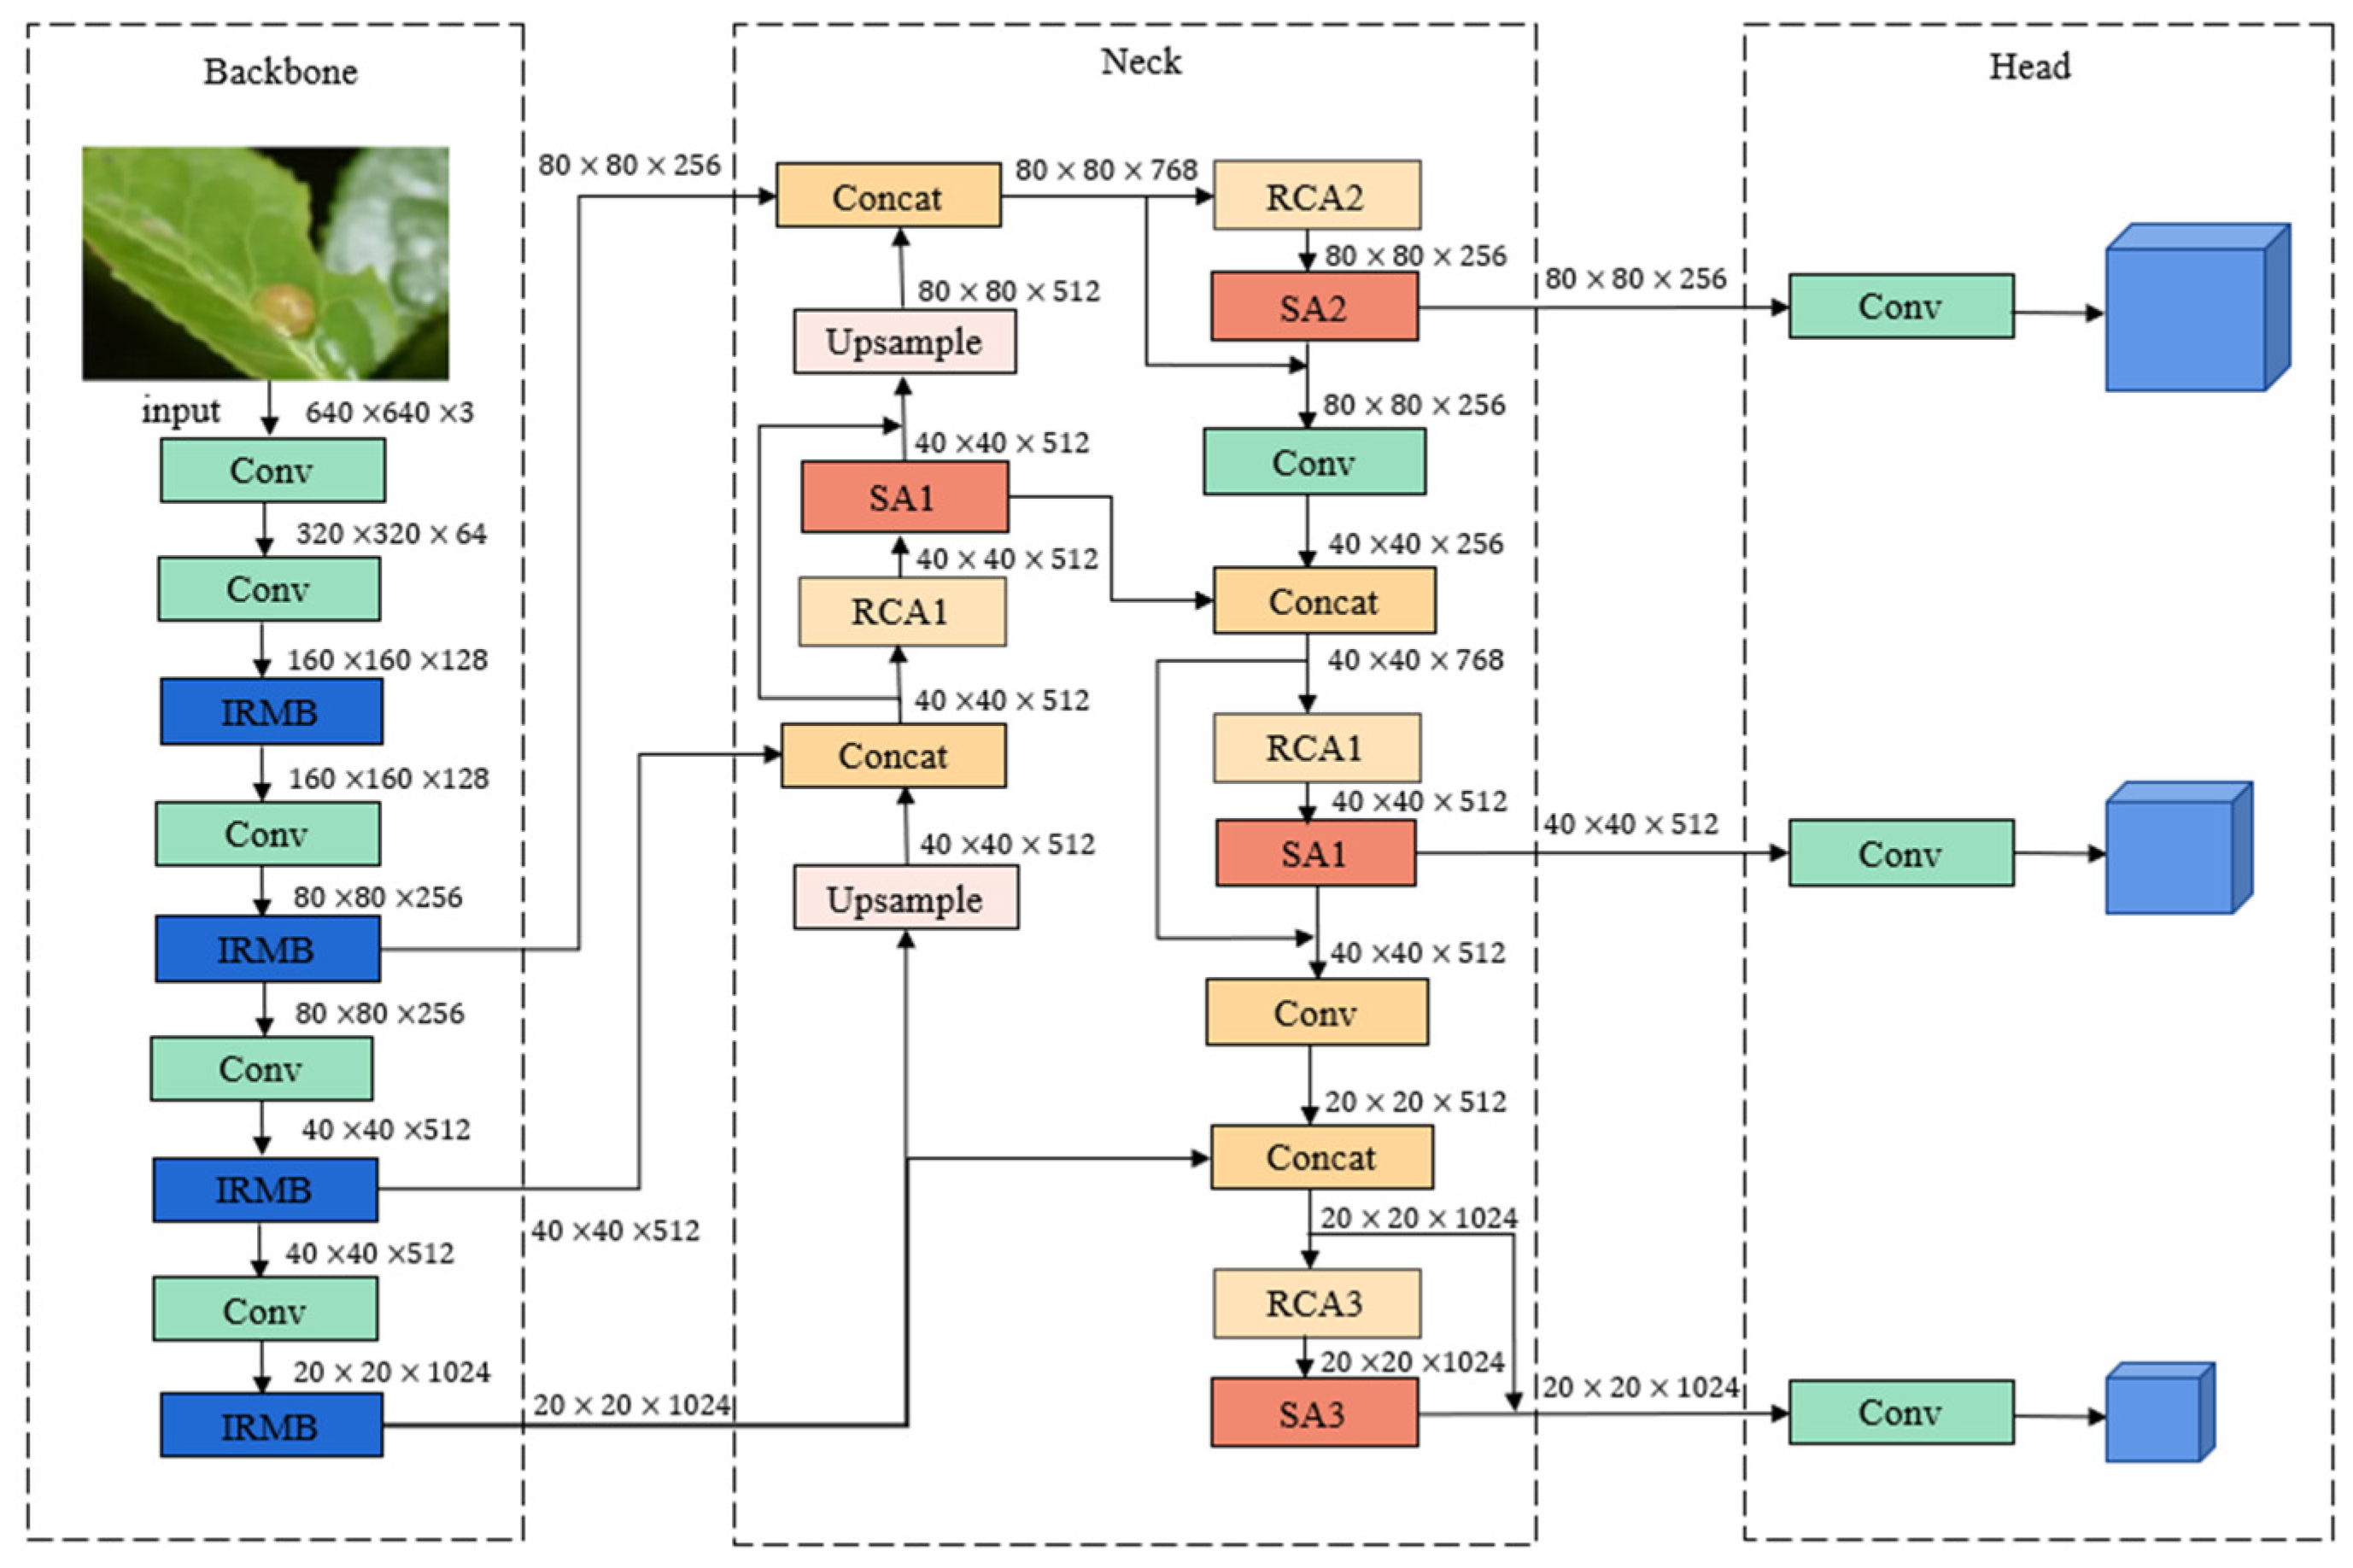
3.1. Backbone
3.2. Neck
3.2.1. Residual Channel Attention Module
3.2.2. Spatial Attention Module
3.3. Head
3.4. Loss Function
4. Experiments
4.1. Dataset and Experimental Setup
4.2. Evaluation Metrics
4.3. Ablation Study
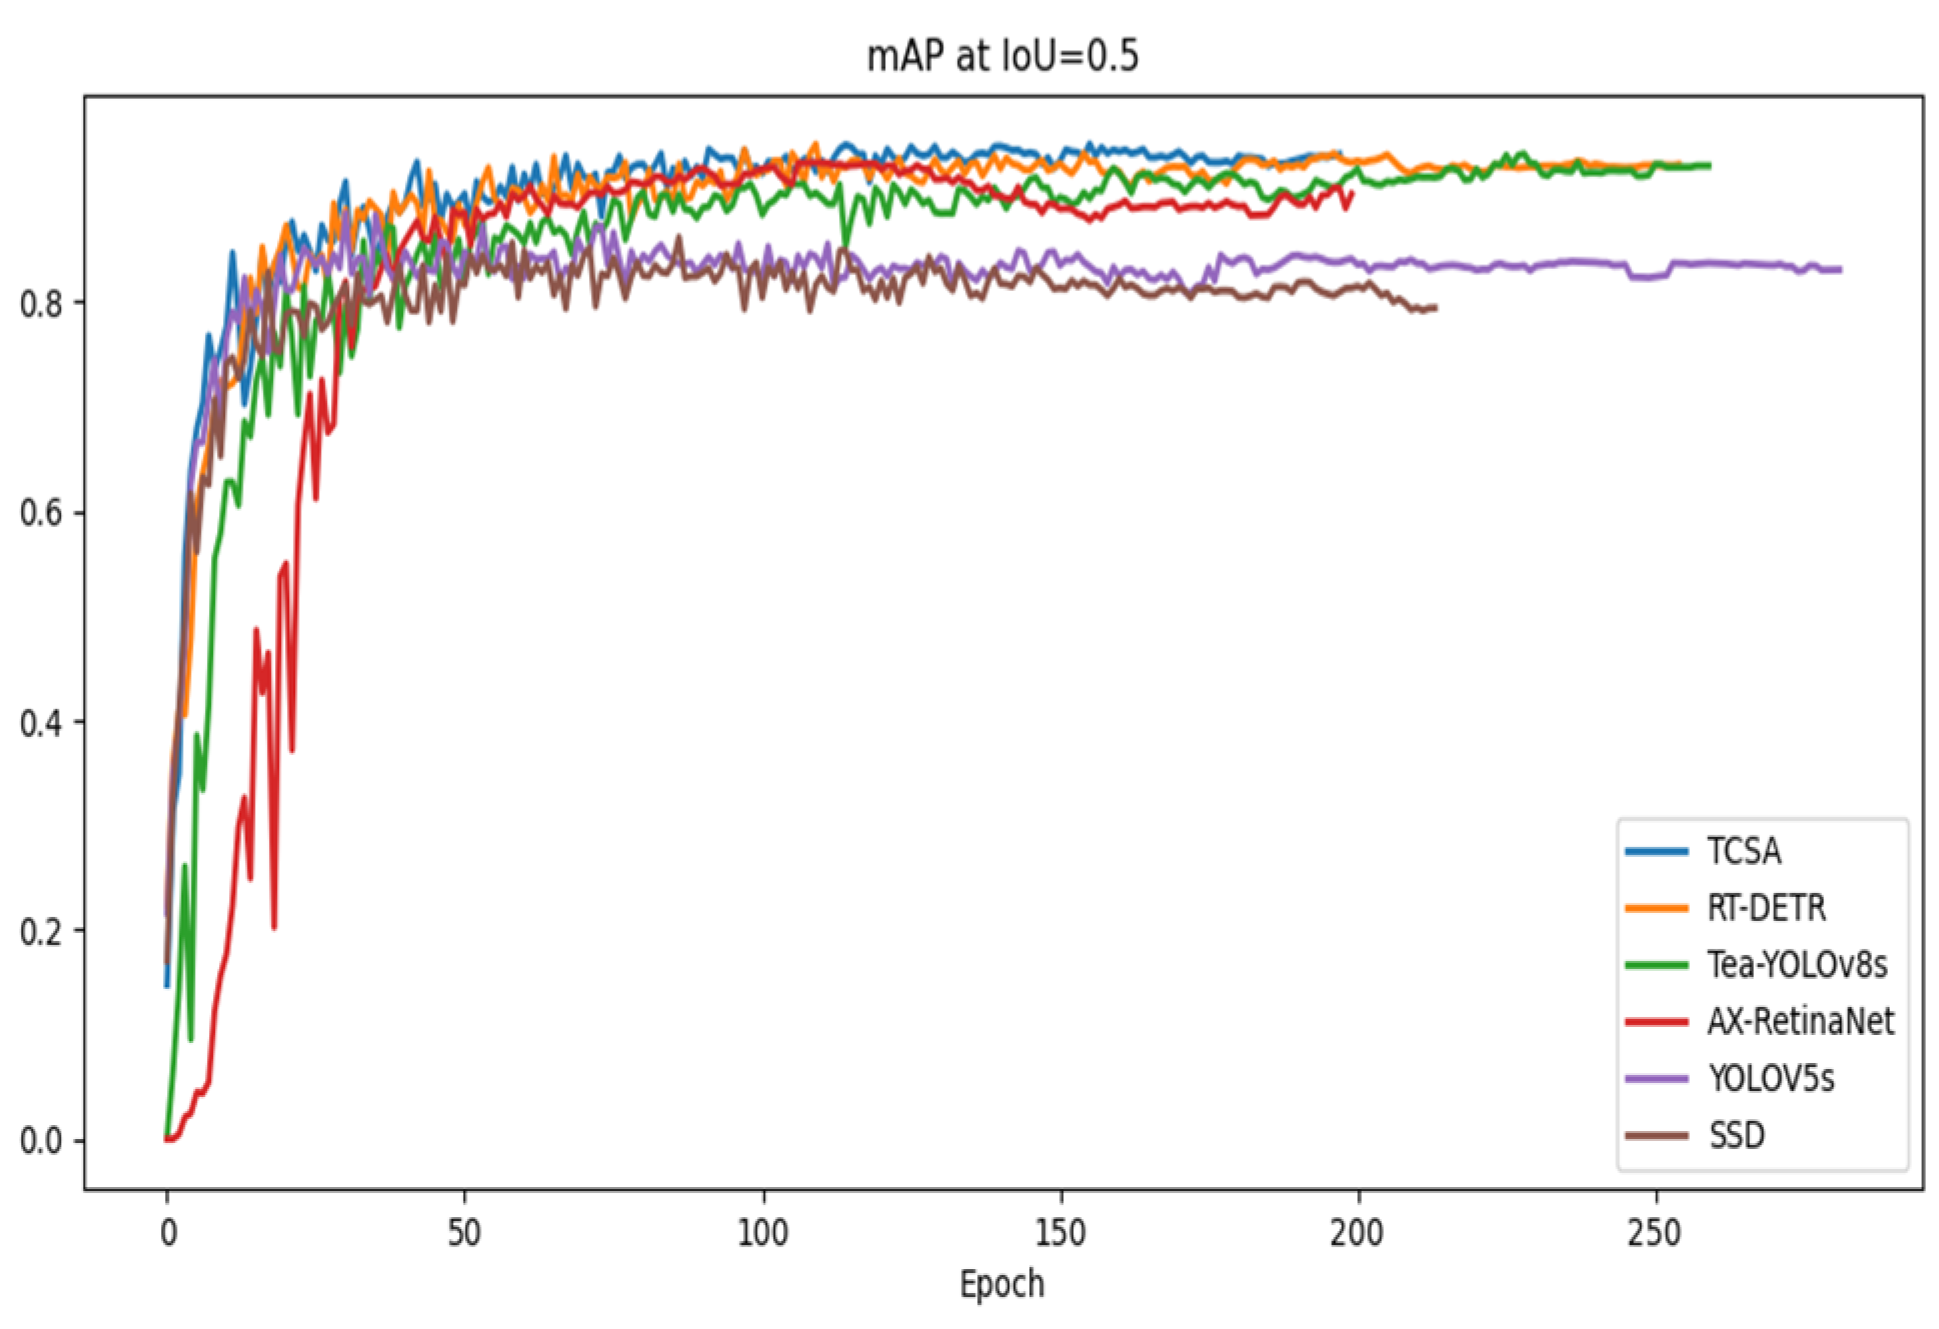
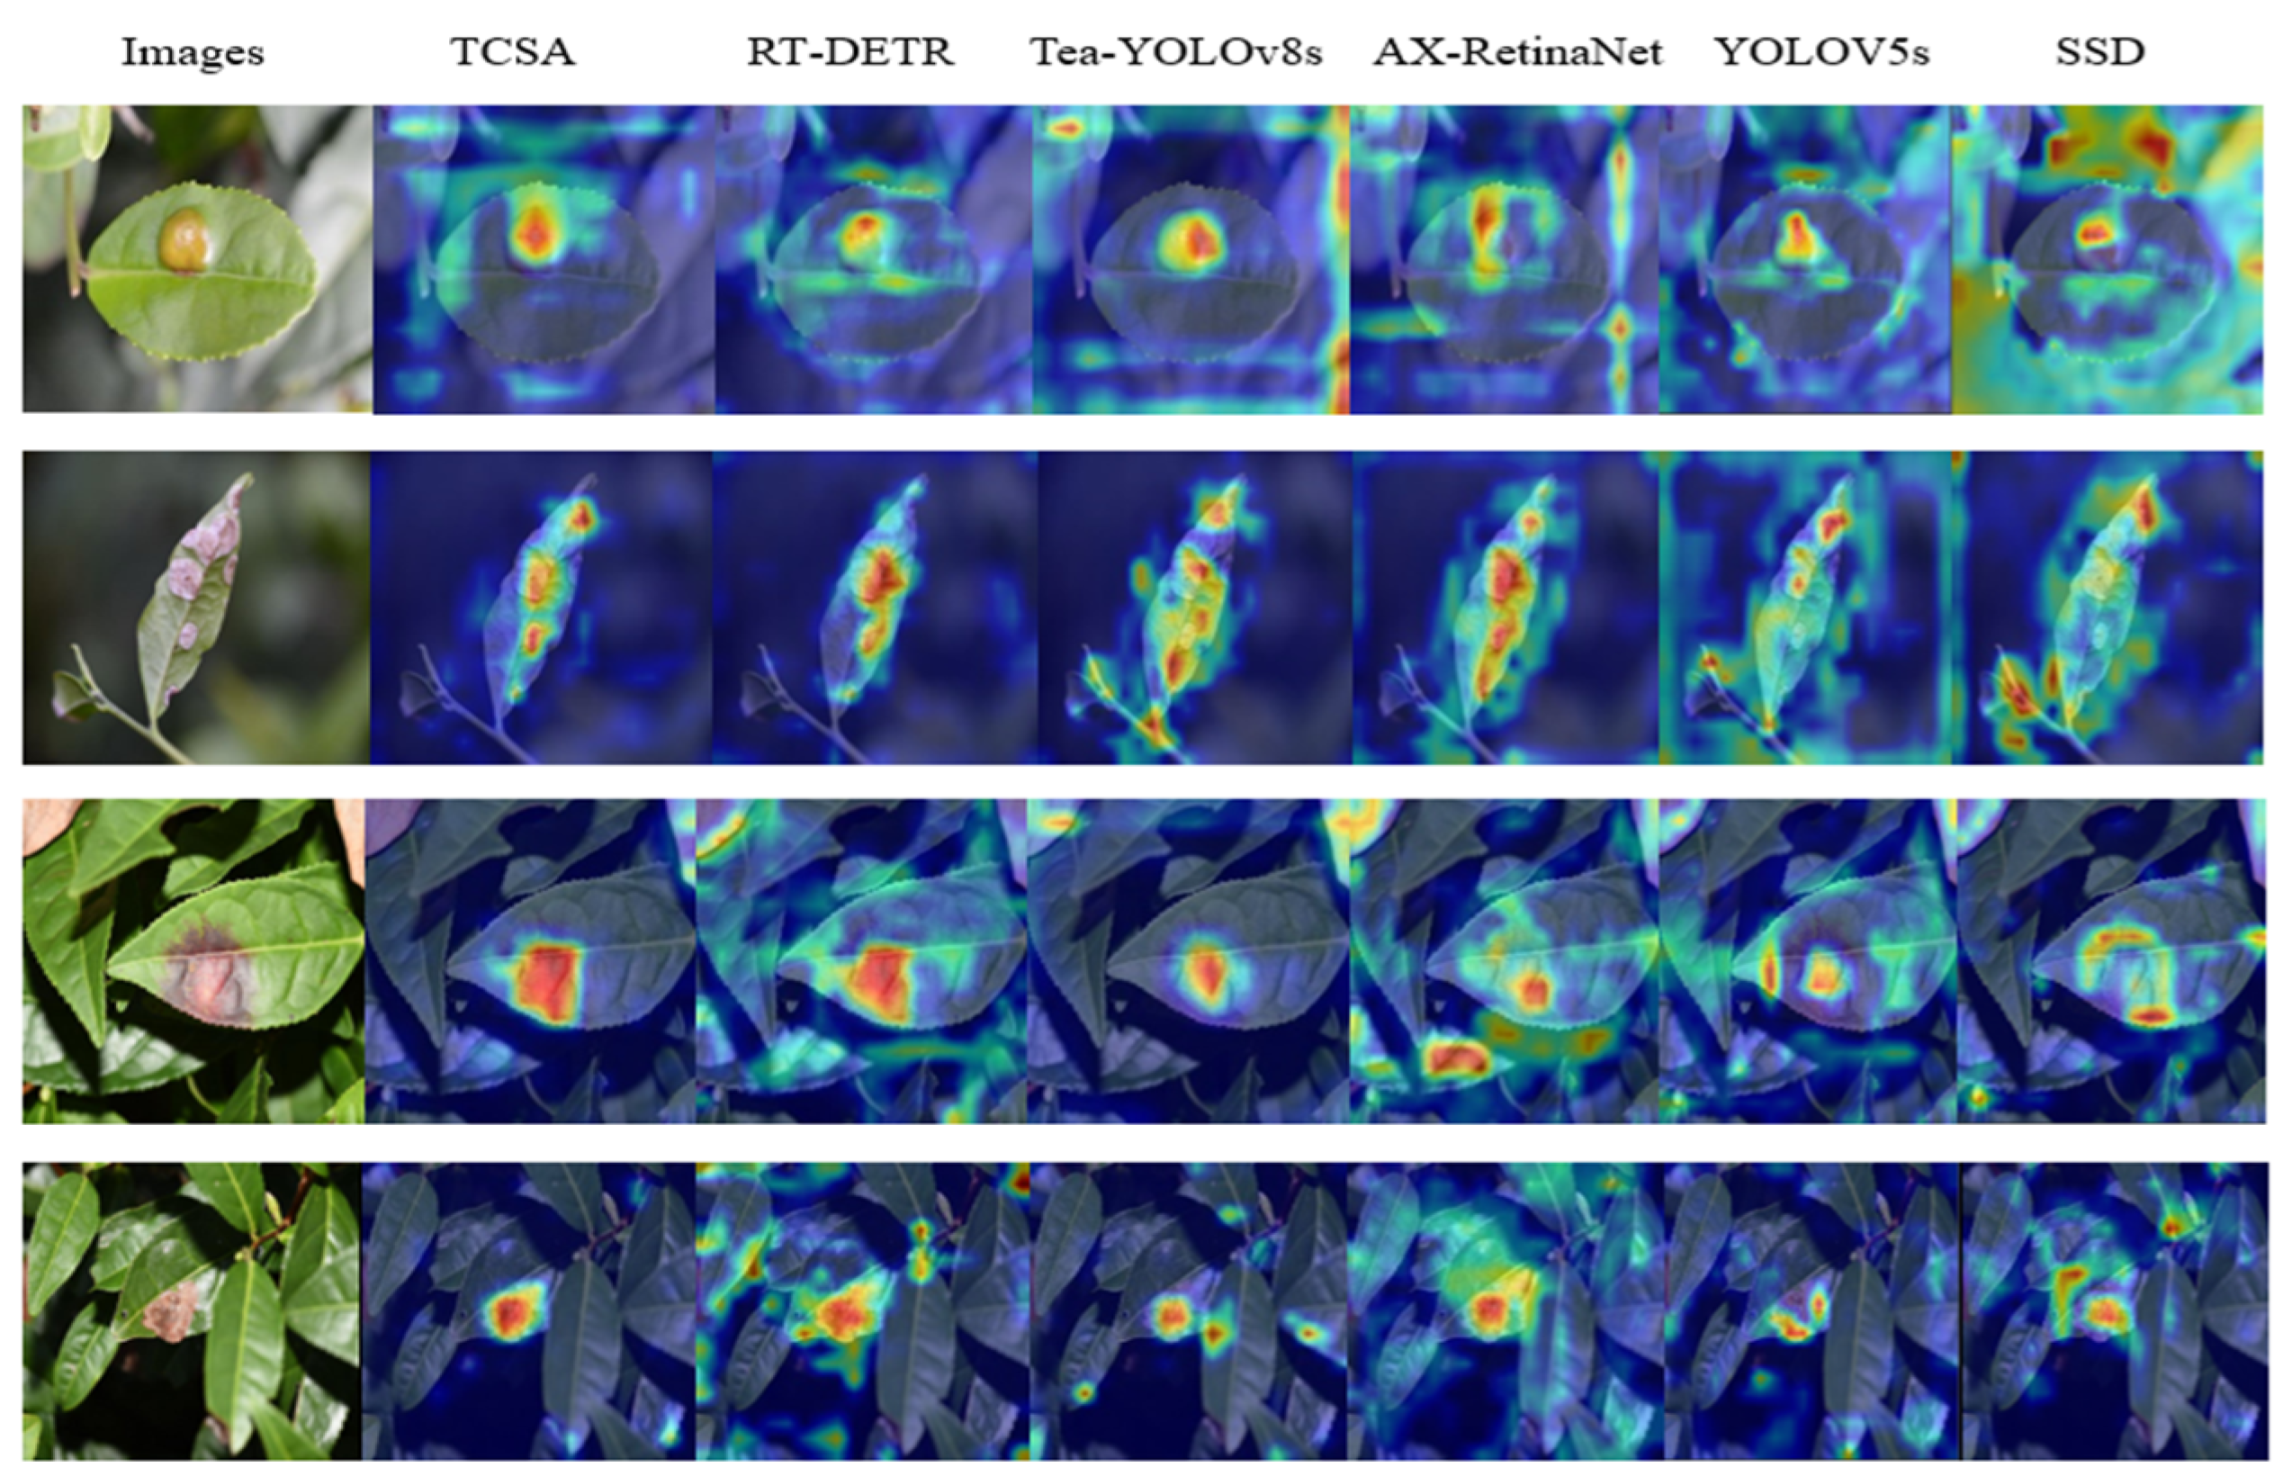
4.4. Comparative Analysis
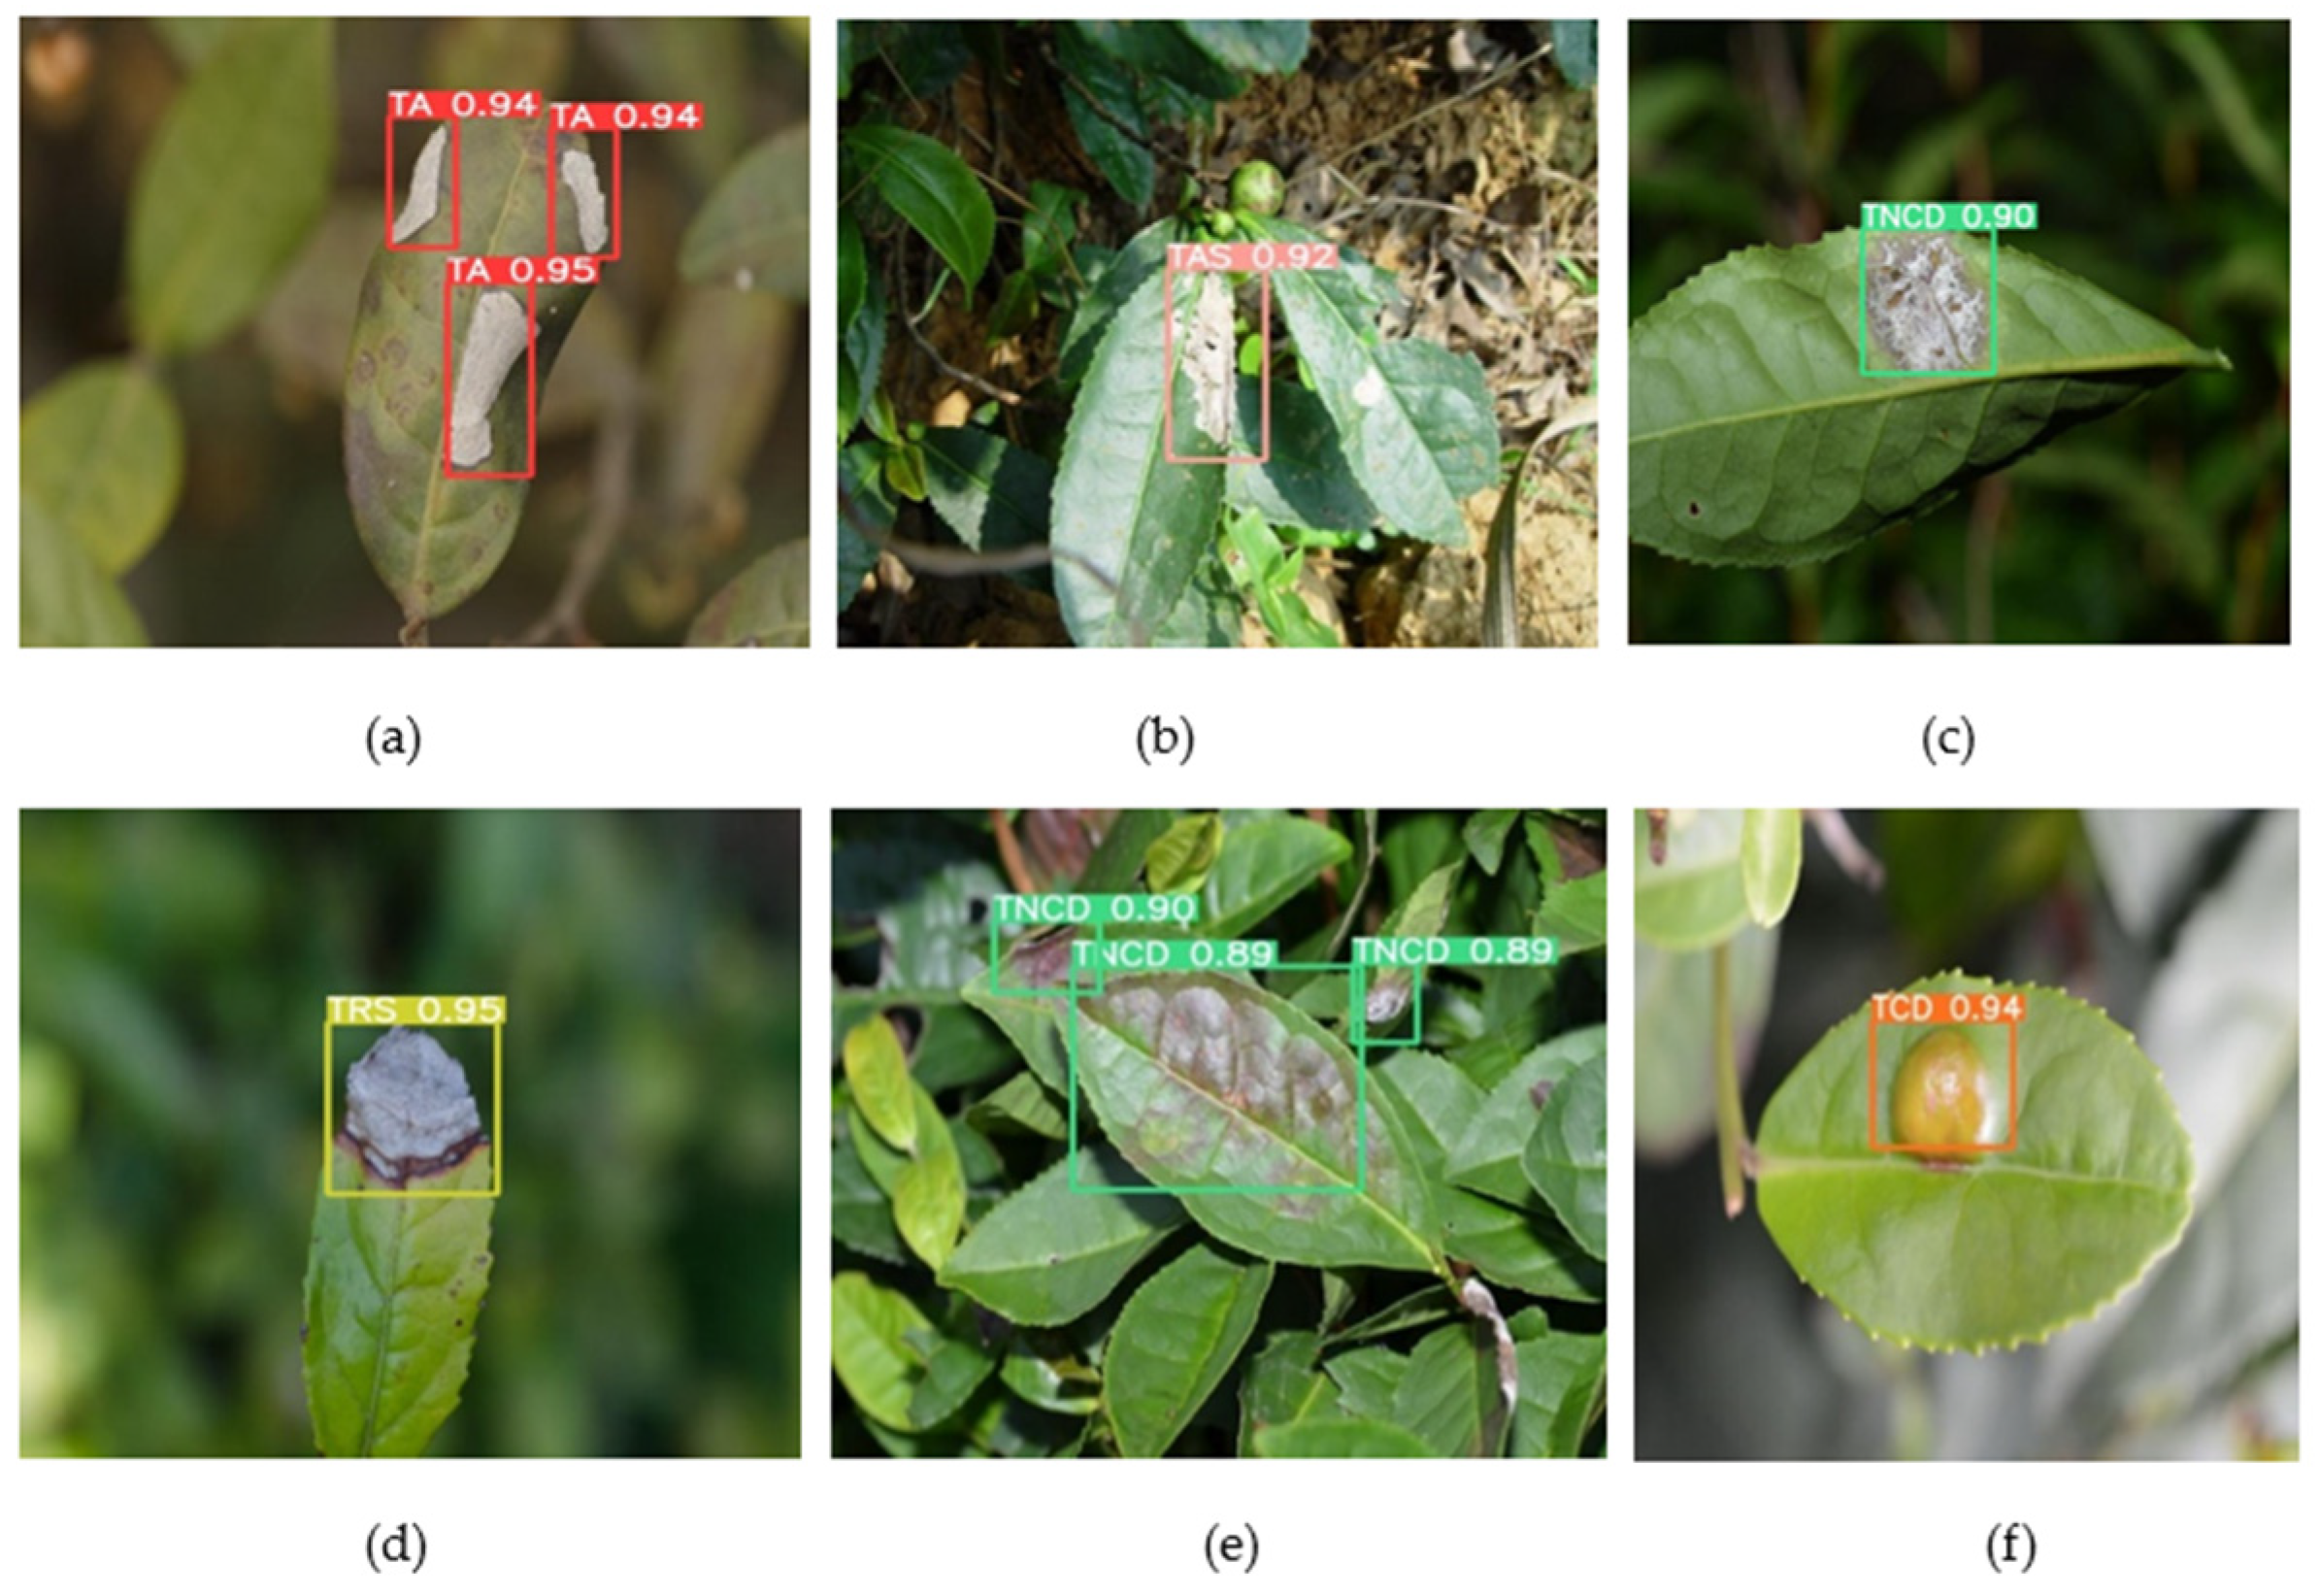
4.5. TCSA’s Performance on Different Diseases
5. Conclusions
Author Contributions
Funding
Institutional Review Board Statement
Informed Consent Statement
Data Availability Statement
Conflicts of Interest
References
- Fang, J.; Sureda, A.; Silva, A.S.; Khan, F.; Xu, S.; Nabavi, S.M. Trends of tea in cardiovascular health and disease: A critical review. Trends Food Sci. Technol. 2019, 88, 385–396. [Google Scholar] [CrossRef]
- Hu, G.; Yang, X.; Zhang, Y.; Wan, M. Identification of tea leaf diseases by using an improved deep convolutional neural network. Sustain. Comput. Inform. Syst. 2019, 24, 100353. [Google Scholar] [CrossRef]
- Long, Z.; Jiang, Q.; Wang, J.; Zhu, H.; Li, B. Research on method of tea flushes vision recognition and picking point localization. Microsyst. Technol. 2022, 2, 41–45. [Google Scholar]
- Zhang, L.; Zou, L.; Wu, C.; Chen, J.; Chen, H. Locating famous tea’s picking point based on shi-tomasi algorithm. Comput. Mater. Contin. 2021, 69, 1109–1122. [Google Scholar] [CrossRef]
- Cardellicchio, A.; Solimani, F.; Dimauro, G.; Petrozza, A.; Summerer, S.; Cellini, F.; Renò, V. Detection of tomato plant phenotyping traits using YOLOv5-based single stage detectors. Comput. Electron. Agric. 2023, 207, 107757. [Google Scholar] [CrossRef]
- Wang, D.; He, D. Channel pruned YOLO V5s-based deep learning approach for rapid and accurate apple fruitlet detection before fruit thinning. Biosyst. Eng. 2021, 210, 271–281. [Google Scholar] [CrossRef]
- Sozzi, M.; Cantalamessa, S.; Cogato, A.; Kayad, A.; Marinello, F. Automatic bunch detection in white grape varieties using YOLOv3, YOLOv4, and YOLOv5 deep learning algorithms. Agronomy 2022, 12, 319. [Google Scholar] [CrossRef]
- Zhou, G.; Zhang, W.; Chen, A.; He, M.; Ma, X. Rapid detection of rice disease based on fcm-km and faster r-cnn fusion. IEEE Access 2019, 7, 143190–143206. [Google Scholar] [CrossRef]
- Sun, C.; Huang, C.; Zhang, H.; Chen, B.; An, F.; Wang, L.; Yun, T. Individual tree crown segmentation and crown width extraction from a height map derived from aerial laser scanning data using a deep learning framework. Front. Plant Sci. 2022, 13, 914974. [Google Scholar] [CrossRef]
- Dai, G.; Fan, J. An industrial-grade solution for crop disease image detection tasks. Front. Plant Sci. 2022, 13, 921057. [Google Scholar] [CrossRef]
- Vaswani, A.; Shazeer, N.; Parmar, N.; Uszkoreit, J.; Jones, L.; Gomez, A.N.; Kaiser, L.U.; Polosukhin, I. Attention is all you need. In Advances in Neural Information Processing Systems; Guyon, I., Luxburg, U.V., Bengio, S., Wallach, H., Fergus, R., Vishwanathan, S., Garnett, R., Eds.; Curran Associates: Red Hook, NY, USA, 2017; Volume 30, pp. 1–11. Available online: https://proceedings.neurips.cc/paper/2017/file/3f5ee243547dee91fbd053c1c4a845aa-Paper.pdf (accessed on 4 May 2022).
- Guo, M.-H.; Xu, T.-X.; Liu, J.-J.; Liu, Z.-N.; Jiang, P.-T.; Mu, T.-J.; Zhang, S.-H.; Martin, R.R.; Cheng, M.-M.; Hu, S.-M. Attention mechanisms in computer vision: A survey. Comput. Vis. Media 2022, 8, 331–368. [Google Scholar] [CrossRef]
- Hu, J.; Li, S.; Samuel, A.; Sun, G.; Wu, E. Squeeze-and-excitation networks. IEEE Trans. Pattern Anal. Mach. Intell. 2020, 42, 2011–2023. [Google Scholar] [CrossRef] [PubMed]
- Liu, L.; Wang, R.; Xie, C.; Yang, P.; Wang, F.; Sudirman, S.; Liu, W. PestNet: An end-to-end deep learning approach for large-scale multi-class pest detection and classification. IEEE Access 2019, 7, 45301–45312. [Google Scholar] [CrossRef]
- Zhang, Y.; Huang, S.; Zhou, G.; Hu, Y.; Li, L. Identification of tomato leaf diseases based on multi-channel automatic orientation recurrent attention network. Comput. Electron. Agric. 2023, 205, 107605. [Google Scholar] [CrossRef]
- Gao, R.; Wang, R.; Feng, L.; Li, Q.; Wu, H. Dual-branch, efficient, channel attention-based crop disease identification. Comput. Electron. Agric. 2021, 190, 106410. [Google Scholar] [CrossRef]
- Bao, W.; Fan, T.; Hu, G.; Liang, D.; Li, H. Detection and identification of tea leaf diseases based on AX-RetinaNet. Sci. Rep. 2022, 12, 2183. [Google Scholar] [CrossRef] [PubMed]
- Sunil, C.; Jaidhar, C.; Patil, N. Tomato plant disease classification using multilevel feature fusion with adaptive channel spatial and pixel attention mechanism. Expert Syst. Appl. 2023, 228, 120381. [Google Scholar] [CrossRef]
- Wang, X.; Cao, W. Bit-plane and correlation spatial attention modules for plant disease classification. IEEE Access 2023, 11, 93852–93863. [Google Scholar] [CrossRef]
- Tang, Z.; Zhang, R.; Peng, Z.; Chen, J.; Lin, L. Multi-stage spatiotemporal aggregation transformer for video person re-identification. arXiv 2023. [Google Scholar] [CrossRef]
- Wang, F.; Wang, R.; Xie, C.; Yang, P.; Liu, L. Fusing multiscale context-aware information representation for automatic in-field pest detection and recognition. Comput. Electron. Agric. 2020, 169, 105222. [Google Scholar] [CrossRef]
- Xie, S.; Sun, H. Tea-YOLOv8s: A tea bud detection model based on deep learning and computer vision. Sensors 2023, 23, 6576. [Google Scholar] [CrossRef] [PubMed]
- Ren, B.; Liu, B.; Hou, B.; Wang, Z.; Yang, C.; Jiao, L. SwinTFNet: Dual-stream transformer with cross attention fusion for land cover classification. IEEE Geosci. Remote Sens. Lett. 2024, 21, 2501505. [Google Scholar] [CrossRef]
- Cao, H.; Wang, Y.; Chen, J.; Jiang, D.; Zhang, X.; Tian, Q.; Wang, M. Swin-Unet: Unet-like pure transformer for medical image segmentation. In Proceedings of the Computer Vision—ECCV 2022 Workshops, Tel Aviv, Israel, 23–27 October 2023; pp. 205–218. [Google Scholar] [CrossRef]
- Hu, Y.; Deng, X.; Lan, Y.; Chen, X.; Long, Y.; Liu, C. Detection of rice pests based on self-attention mechanism and multiscale feature fusion. Insects 2023, 14, 280. [Google Scholar] [CrossRef] [PubMed]
- Sun, Y.; Wu, F.; Guo, H.; Li, R.; Yao, J.; Shen, J. Teadiseasenet: Multiscale self-attentive tea disease detection. Front. Plant Sci. 2023, 14, 1257212. [Google Scholar] [CrossRef] [PubMed]
- Stephen, A.; Punitha, A.; Chandrasekar, A. Designing self-attention-based resnet architecture for rice leaf disease classification. Neural Comput. Appl. 2023, 35, 6737–6751. [Google Scholar] [CrossRef]
- Zeng, W.; Li, M. Crop leaf disease recognition based on self-attention convolutional neural network. Comput. Electron. Agric. 2020, 172, 105341. [Google Scholar] [CrossRef]
- Tholkapiyan, M.; Aruna Devi, B.; Bhatt, D.; Saravana Kumar, E.; Kirubakaran, S.; Kumar, R. Performance analysis of rice plant diseases identification and classification methodology. Wireless Pers. Commun. 2023, 130, 1317–1341. [Google Scholar] [CrossRef]
- He, K.; Zhang, X.; Ren, S.; Sun, J. Deep residual learning for image recognition. In Proceedings of the 2016 IEEE Conference on Computer Vision and Pattern Recognition (CVPR), Las Vegas, NV, USA, 27–30 June 2016. [Google Scholar] [CrossRef]
- Redmon, J.; Farhadi, A. Yolov3: An incremental improvement. arXiv 2018. [Google Scholar] [CrossRef]
- Wang, C.Y.; Mark Liao, H.Y.; Wu, Y.H.; Chen, P.Y.; Hsieh, J.W.; Yeh, I.H. CSPNet: A new backbone that can enhance learning capability of cnn. In Proceedings of the 2020 IEEE/CVF Conference on Computer Vision and Pattern Recognition Workshops (CVPRW), Seattle, WA, USA, 14–19 June 2020. [Google Scholar] [CrossRef]
- Roy, A.M.; Bose, R.; Bhaduri, J. A fast accurate fine-grain object detection model based on yolov4 deep neural network. Neural Comput. Appl. 2022, 34, 3895–3921. [Google Scholar] [CrossRef]
- Xue, Z.; Xu, R.; Bai, D.; Lin, H. Yolo-tea: A Tea Disease Detection Model Improved by YOLOv5. Forests 2023, 14, 415. [Google Scholar] [CrossRef]
- Zhang, J.; Li, X.; Li, J.; Liu, L.; Xue, Z.; Zhang, B.; Jiang, Z.; Huang, T.; Wang, Y.; Wang, C. Rethinking mobile block for efficient attention-based models. In Proceedings of the 2023 IEEE/CVF International Conference on Computer Vision (ICCV), Paris, France, 1–6 October 2023. [Google Scholar] [CrossRef]
- Sharma, V.; Tripathi, A.K.; Mittal, H. CLDA-Net: A novel citrus leaf disease attention network for early identification of leaf diseases. In Proceedings of the 2023 15th International Conference on Computer and Automation Engineering (ICCAE), IEEE, Sydney, Australia, 3–5 March 2023; pp. 178–182. [Google Scholar] [CrossRef]
- Zhang, H.; Wang, Y.; Dayoub, F.; Sunderhauf, N. VarifocalNet: An iou-aware dense object detector. In Proceedings of the 2021 IEEE/CVF Conference on Computer Vision and Pattern Recognition (CVPR), Nashville, TN, USA, 20–25 June 2021. [Google Scholar] [CrossRef]
- Li, X.; Lv, C.; Wang, W.; Li, G.; Yang, L.; Yang, J. Generalized Focal Loss: Towards efficient representation learning for dense object detection. IEEE Trans. Pattern Anal. Mach. Intell. 2022, 45, 1–14. [Google Scholar] [CrossRef] [PubMed]
- Zheng, Z.; Wang, P.; Liu, W.; Li, J.; Ye, R.; Ren, D. Distance-IoU Loss: Faster and better learning for bounding box regression. Proc. AAAI Conf. Artif. Intell. 2020, 34, 12993–13000. [Google Scholar] [CrossRef]
- Liu, W.; Anguelov, D.; Erhan, D.; Szegedy, C.; Reed, S.; Fu, C.Y.; Berg, A.C. Ssd: Single shot multibox detector. In Proceedings of the European Conference on Computer Vision, Amsterdam, The Netherlands, 11–14 October 2016; pp. 21–37. [Google Scholar] [CrossRef]
- Jocher, G.; Chaurasia, A.; Stoken, A.; Borovec, J.; NanoCode012; Kwon, Y.; Michael, K.; TaoXie; Fang, J.; Imyhxy; et al. Ultralytics/yolov5: V7. 0-yolov5 sota real-time instance segmentation. Zenodo 2022. [Google Scholar] [CrossRef]
- Zhao, Y.; Lv, W.; Xu, S.; Wei, J.; Wang, G.; Dang, Q.; Liu, Y.; Chen, J. Detrs beat yolos on real-time object detection. arXiv 2023, arXiv:2304.08069. [Google Scholar]
- Pandey, A.; Jain, K. A robust deep attention dense convolutional neural network for plant leaf disease identification and classification from smartphone captured real-world images. Ecol. Inform. 2022, 70, 101725. [Google Scholar] [CrossRef]
- Liu, Y.; Gao, G.; Zhang, Z. Crop disease recognition based on modified lightweight cnn with attention mechanism. IEEE Access 2022, 10, 112066–112075. [Google Scholar] [CrossRef]


| Backbone (CSPDarkNet53) | IRMB | RCA | SA | mAP |
|---|---|---|---|---|
| √ | 93.3 | |||
| √ | √ | 93.5 | ||
| √ | √ | 93.7 | ||
| √ | √ | 94.1 | ||
| √ | √ | √ | 93.9 | |
| √ | √ | √ | 94.4 | |
| √ | √ | √ | √ | 94.6 |
| Model | P | R | mAP |
|---|---|---|---|
| SSD [40] | 86.5 | 89.1 | 88.4 |
| YOLOv5s [41] | 87.4 | 82.5 | 88.6 |
| Tea-YOLOv8s [22] | 92.7 | 89.2 | 93.3 |
| AX-RetinaNet [17] | 91.7 | 90.8 | 93.4 |
| RT-DETR [42] | 89.6 | 87.8 | 94.2 |
| TCSA | 92.9 | 89.6 | 94.6 |
| Disease | P | R | mAP |
|---|---|---|---|
| Als | 89.5 | 92.0 | 91.7 |
| Tc | 97.4 | 83.3 | 97.0 |
| Clb | 93.8 | 93.9 | 96.5 |
| Eb | 87.3 | 97.4 | 98.5 |
| Tr | 96.3 | 97.2 | 97.5 |
| Rs | 86.4 | 82.4 | 87.1 |
Disclaimer/Publisher’s Note: The statements, opinions and data contained in all publications are solely those of the individual author(s) and contributor(s) and not of MDPI and/or the editor(s). MDPI and/or the editor(s) disclaim responsibility for any injury to people or property resulting from any ideas, methods, instructions or products referred to in the content. |
© 2024 by the authors. Licensee MDPI, Basel, Switzerland. This article is an open access article distributed under the terms and conditions of the Creative Commons Attribution (CC BY) license (https://creativecommons.org/licenses/by/4.0/).
Share and Cite
Sun, Y.; Jiang, M.; Guo, H.; Zhang, L.; Yao, J.; Wu, F.; Wu, G. Multiscale Tea Disease Detection with Channel–Spatial Attention. Sustainability 2024, 16, 6859. https://doi.org/10.3390/su16166859
Sun Y, Jiang M, Guo H, Zhang L, Yao J, Wu F, Wu G. Multiscale Tea Disease Detection with Channel–Spatial Attention. Sustainability. 2024; 16(16):6859. https://doi.org/10.3390/su16166859
Chicago/Turabian StyleSun, Yange, Mingyi Jiang, Huaping Guo, Li Zhang, Jianfeng Yao, Fei Wu, and Gaowei Wu. 2024. "Multiscale Tea Disease Detection with Channel–Spatial Attention" Sustainability 16, no. 16: 6859. https://doi.org/10.3390/su16166859
APA StyleSun, Y., Jiang, M., Guo, H., Zhang, L., Yao, J., Wu, F., & Wu, G. (2024). Multiscale Tea Disease Detection with Channel–Spatial Attention. Sustainability, 16(16), 6859. https://doi.org/10.3390/su16166859