
Estuaries in Northern Spain: An Analysis of Their Sedimentation Rates


Abstract
1. Introduction
- -
- Sedimentation rates (SRs) are used to accurately reconstruct coastal hydrographic responses to climatic and relative sea-level changes.
- -
- Anthropogenic impact, including land reclamation, sewage, industrial, urban, and mining waste disposal, dredging, and changes in watershed use. This also involves determining the sources and timing of anthropogenic pollution, especially heavy metal contaminants.
- -
- Contribution of specific episodes corresponding to well-known and dated catastrophic events.
- -
- The role of salt marshes as drivers of variability in blue carbon stocks and burial rates across European estuarine habitats.
- Generate a comprehensive database with all the survey records conducted to date in northern Spain.
- Investigate the potential presence of a geographical or spatial pattern of SRs in the estuaries of northern Spain and of a correlation with global SR data. Additionally, examine the relationship between SRs and each estuary’s geomorphological characteristics, including size, morphology, and sediment accumulation.
- Analyze whether any temporal trend can be observed in SRs in different estuaries and determine whether any relationship exists between SRs obtained in each estuary and the sea-level rise recorded at different tide gauges.
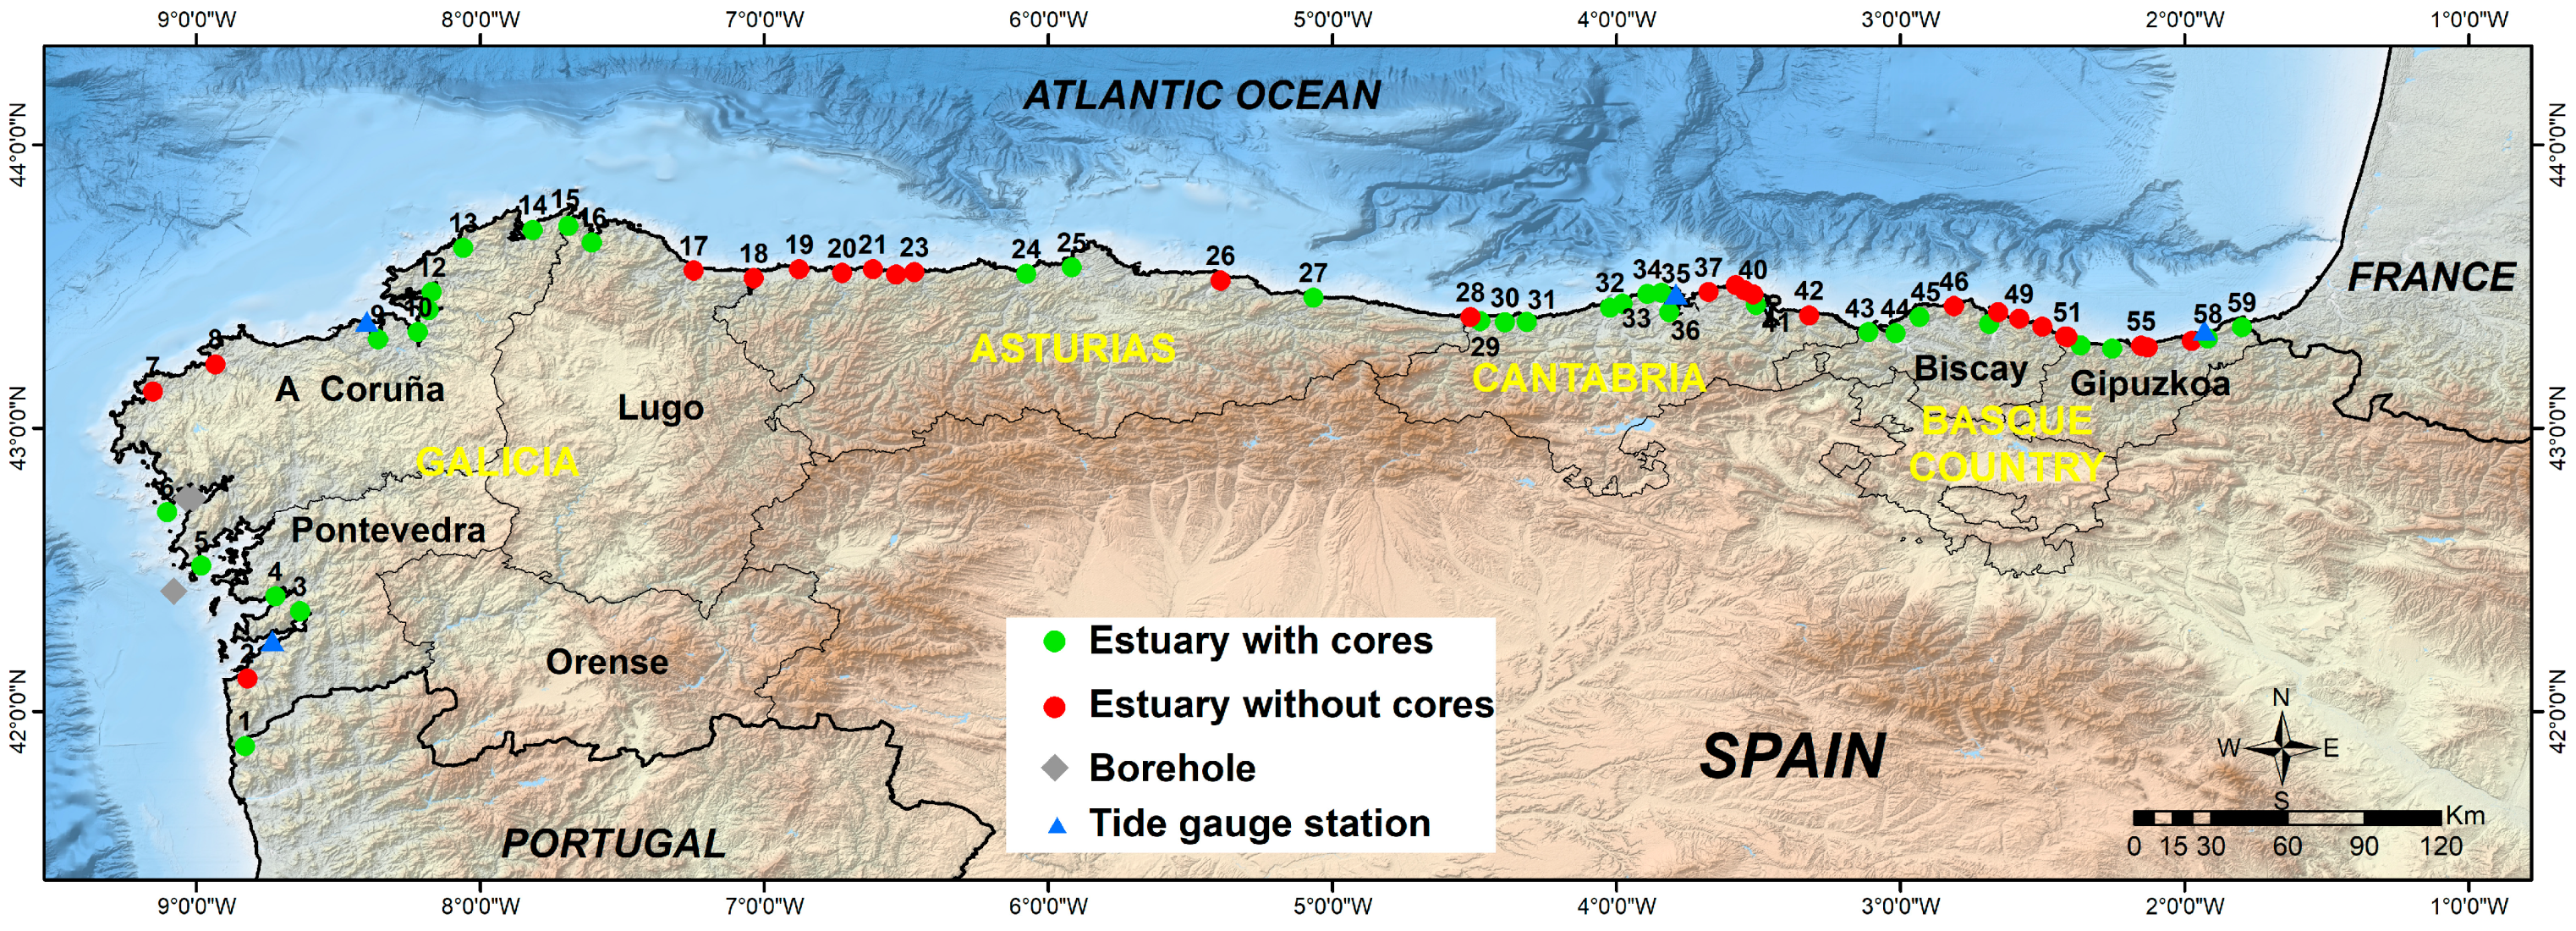
Study Area

| Region/Province | Area (km2) | Population | Density (hab./km2) | Coastline Length (km) |
|---|---|---|---|---|
| Galicia/Pontevedra | 4495 | 946,710 | 210.61 | 398 |
| Galicia/A Coruña | 7950 | 1,123,884 | 141.37 | 956 |
| Galicia/Lugo | 9856 | 324,267 | 32.90 | 144 |
| Asturias/Asturias | 10,604 | 1,006,060 | 94.88 | 401 |
| Cantabria/Cantabria | 5321 | 588,387 | 110.58 | 284 |
| Basque Country/Biscay | 2217 | 1,153,282 | 520.20 | 154 |
| Basque Country/Gipuzkoa | 1909 | 726,712 | 380.68 | 92 |
| Total | 49,625 | 6,173,865 | 138.50 | 2429 |
2. Material and Methods
- (a)
- Embryonic estuaries: surface area <15 ha.
- (b)
- Small estuaries: 15–60 ha.
- (c)
- Medium estuaries: 60–200 ha.
- (d)
- Large estuaries: 200–600 ha.
- (e)
- Very large estuaries: >600 ha.
- (a)
- (b)
- Open estuaries: Significantly larger than the associated river valley, with the widening extending upstream, showing large inlets or lateral bays. Usually located in soft substrates and linked even to geological structures such as faults and thrusts that favored their widening (e.g., Avilés).
- (c)
- River valley estuaries: The estuary’s width is comparable to that of the associated river valley, often bounded by steep slopes.
- (d)
- Mixed: Generally, with a head zone shaped as a valley and an intermediate or outer zone with an open morphology.
- (a)
- Tidal estuaries: Systems with minimal sediment infilling occupying a large part of the estuary alongside relatively deep-water bodies and characterized by a smaller representation of marshes compared with that of bare intertidal flats (mudflats or sands).
- (b)
- Juvenile estuaries: In these systems, the area occupied by marshes is equal to or even greater than that occupied by bare intertidal flats.
- (c)
- Mature estuaries: These estuarine terrains are topographically higher and primarily present marshes with little representation of bare intertidal flats.
- (d)
- Urban estuaries: Given the difficulty in classifying estuarine terrains when their degree of urbanization is very high, we defined them as urban estuaries.
3. Results
| No. | Estuary | Core Code | Period | Lat. N | Long. W | References | SR 1900 | SR 1950 | SR 1965 | SR 2000 | SR 20xx | SR Average |
|---|---|---|---|---|---|---|---|---|---|---|---|---|
| 1 | Miño | Miño | 1900–2000 | 41.87 | 8.82 | [19,33,42] | 0.6 | 0.6 | 0.6 | 0.6 | — | 0.6 |
| 3 | Vigo | C1 | 1963–1999 | 42.34 | 8.61 | [19] | — | — | — | — | — | 4.3 |
| 3 | Vigo | C2 | 1963–1999 | 42.34 | 8.61 | [16,19] | — | — | 1.1 | 6.5 | — | 5.9 |
| 3 | Vigo | C3 | 1963–1999 | 42.34 | 8.61 | [19] | — | — | — | — | — | 5.1 |
| 3 | Vigo | M2 | 1963–1999 | 42.35 | 8.63 | [9] | — | — | 5.0 | 5.0 | — | 5.0 |
| 3 | Vigo | M3 | 1963–1999 | 42.35 | 8.63 | [9] | — | — | 5.0 | 5.0 | — | 5.0 |
| 3 | Vigo | SS10 | 1950–2010 | 42.34 | 8.61 | [84] | — | 4.0 | 6.6 | 6.8 | 5.6 | 5.3 |
| 3 | Vigo | q | 1930–2005 | 42.35 | 8.63 | [85] | 1.5 | 1.5 | 4.0 | 4.0 | 6.1 | 2.3 |
| 3 | Vigo | SSMPA | 1940–2003 | 42.34 | 8.61 | [5,19,31] | — | 6.0 | 3.1 | 6.2 | — | 6.6 |
| 3 | Vigo | T | 1900–2006 | 42.35 | 8.61 | [86] | 0.04 | 0.1 | 2.0 | 1.7 | 5.5 | 2.3 |
| 4 | Pontevedra | Core 1 | 1963–1999 | 42.40 | 8.72 | [46] | — | 1.0 | 1.0 | 1.0 | 1.0 | 1.0 |
| 5 | Arousa | KIGX13 | 1960–1999 | 42.42 | 9.07 | [83] | — | — | 3.0 | 3.0 | 3.0 | 3.0 |
| 6 | Muros | M12BC | 1960–2009 | 42.77 | 8.97 | [39] | — | — | 2.6 | 3.9 | 3.2 | 3.1 |
| 6 | Muros | M5BC | 1900–2009 | 42.73 | 9.02 | [39] | 1.5 | 0.8 | 0.8 | 2.5 | 3.8 | 1.8 |
| 9 | A Coruña | L | 1923–2012 | 43.31 | 8.35 | [13] | — | 5.3 | 5.3 | 7.8 | 7.8 | 6.7 |
| 10 | Betanzos | Betanzos | 1910–2012 | 43.33 | 8.21 | [87] | 0.9 | 3.0 | 3.0 | 6.2 | 8.4 | 3.8 |
| 11 | Ares | Ares | 1910–2012 | 43.41 | 8.18 | [87] | 3.4 | 3.4 | 6.0 | 6.0 | 14.5 | 7.2 |
| 12 | Ferrol | Ferrol | 1880–2012 | 43.51 | 8.15 | [88] | 1.4 | 4.4 | 6.6 | 5.0 | 6.7 | 6.2 |
| 12 | Ferrol | FEN | 1940–2021 | 43.47 | 8.17 | [30] | — | 1.1 | 1.2 | 4.5 | 6.1 | 6.2 |
| 12 | Ferrol | NED | 1946–2021 | 43.50 | 8.16 | [30] | 6.0 | 6.0 | 6.0 | 10.0 | 14.0 | 6.6 |
| 12 | Ferrol | XUV | 1880–2021 | 43.51 | 8.16 | [30] | — | 1.8 | 2.6 | 5.8 | 7.1 | 3.5 |
| 13 | Cedeira | Cedeira | 1976–2012 | 43.63 | 8.05 | [87] | — | — | — | 11.0 | 16.0 | 13.0 |
| 14 | Ortigueira | Ortigueira | 1910–2002 | 43.69 | 7.81 | [47] | 12.0 | 12.0 | 12.0 | 25.0 | — | 12.0 |
| 15 | Barqueiro | Barqueiro | 1910–2002 | 43.71 | 7.68 | [47] | 9.0 | 10.0 | 10.0 | 10.0 | — | 9.0 |
| 16 | Viveiro | Viveiro | 1910–2002 | 43.65 | 7.60 | [47] | 11.0 | 11.0 | 11.0 | 10.0 | — | 10.5 |
| 24 | Nalón | MSE-1 | 1900–2017 | 43.54 | 6.07 | [55] | 3.1 | 2.6 | 2.7 | 3.6 | 4.3 | 3.1 |
| 24 | Nalón | MSE-2 | 1900–2017 | 43.54 | 6.08 | [55] | 2.7 | 3.0 | 3.3 | 4.2 | 6.0 | 3.6 |
| 24 | Nalón | Junquera | 1858–2022 | 43.54 | 6.08 | [15] | 3.0 | 6.6 | 4.5 | 4.5 | 4.5 | 3.0 |
| 24 | Nalón | Muros | 1965–2020 | 43.54 | 6.08 | [15] | — | — | 8.1 | 10.8 | 10.8 | 8.1 |
| 25 | Avilés | Avilés | 1860–2020 | 43.56 | 5.91 | [28] | 0.4 | 0.4 | 0.4 | 0.4 | 0.4 | 0.4 |
| 27 | Ribadesella | Ribadesella | 1900–2021 | 43.46 | 5.06 | [89] | 1.4 | 3.9 | 5.3 | 7.8 | 13.0 | 6.0 |
| 29 | Tina Menor | TM | 1900–2015 | 43.37 | 4.47 | [90] | 0.8 | 2.0 | 2.5 | 5.6 | 7.2 | 3.7 |
| 30 | San Vicente | SV | 1900–2015 | 43.37 | 4.39 | [90] | 0.6 | 1.4 | 1.4 | 3.3 | 3.5 | 1.6 |
| 31 | Oyambre–Capitán | A1M1 | 1960–2018 | 43.38 | 4.32 | [43] | — | — | 0.6 | 0.6 | 0.6 | 0.6 |
| 31 | Oyambre–Capitán | A2M3 | 1960–2018 | 43.38 | 4.33 | [43] | — | — | 3.3 | 3.3 | 3.3 | 3.3 |
| 31 | Oyambre–La Rabia | n | 1904–1998 | 43.38 | 4.31 | [56] | 0.8 | 2.2 | 2.2 | 2.2 | — | 1.5 |
| 31 | Oyambre–La Rabia | NM3 | 1960–2018 | 43.38 | 4.31 | [43] | — | — | 2.9 | 2.9 | 2.9 | 2.9 |
| 31 | Oyambre–La Rabia | NP2 | 1960–2018 | 43.38 | 4.31 | [43] | — | — | 3.5 | 3.5 | 3.5 | 3.5 |
| 31 | Oyambre–La Rabia | o | 1880–2005 | 43.37 | 4.31 | [56] | 1.8 | 4.3 | 4.3 | 4.3 | — | 3.1 |
| 32 | San Martín–Suances | Edar | 1930–2016 | 43.40 | 4.02 | [27] | — | 5.0 | 5.0 | 2.5 | 2.5 | 4.2 |
| 32 | San Martín–Suances | Miengo 1 | 1880–2016 | 43.41 | 4.02 | [27] | 3.1 | 2.9 | 2.9 | 2.9 | 2.9 | 3.0 |
| 32 | San Martín–Suances | Miengo 2 | 1930–2016 | 43.41 | 4.02 | [27] | — | 2.6 | 2.6 | 3.2 | 1.0 | 3.7 |
| 32 | San Martín–Suances | Suances | 1974–2003 | 43.42 | 4.02 | [38] | — | — | 17.0 | 17.0 | — | 17.0 |
| 35 | La Maruca | Sa | 1900–2014 | 43.47 | 3.84 | [91] | 1.6 | 6.1 | 3.3 | 7.5 | 7.3 | 5.1 |
| 35 | La Maruca | Sb | 1900–2014 | 43.47 | 3.84 | [91] | 1.6 | 3.0 | 4.7 | 6.9 | 6.6 | 6.0 |
| 36 | Santander | BS1B1 | 1959–2019 | 43.43 | 3.75 | [43] | — | — | 1.8 | 1.8 | 1.8 | 1.5 |
| 36 | Santander | BS2A1 | 1959–2019 | 43.45 | 3.74 | [43] | — | — | 0.9 | 0.9 | 0.9 | 1.5 |
| 36 | Santander | C1-Raos | 1954–1997 | 43.42 | 3.81 | [53] | — | 10.0 | 10.0 | 10.0 | — | 10.0 |
| 36 | Santander | C2-Maliaño | 1900–1997 | 43.41 | 3.82 | [53] | 2.0 | 2.0 | 2.0 | 2.0 | — | 2.0 |
| 36 | Santander | C3-Astillero | 1964–1997 | 43.39 | 3.81 | [53] | — | 11.0 | 11.0 | 11.0 | — | 11.0 |
| 36 | Santander | C6-Elechas | 1954–1997 | 43.42 | 3.78 | [53] | — | 11.0 | 11.0 | 11.0 | — | 11.0 |
| 36 | Santander | C9-Pedreña | 1900–1997 | 43.44 | 3.75 | [53] | 2.6 | 2.6 | 2.6 | 2.6 | — | 2.6 |
| 36 | Santander | P4 | 1900–1997 | 43.40 | 3.81 | [16,17] | 0.6 | 1.6 | 1.5 | 3.3 | — | 4.0 |
| 36 | Santander | P9 | 1900–1997 | 43.44 | 3.75 | [16,17] | 1.0 | 2.2 | 2.0 | 3.6 | — | 5.0 |
| 41 | Asón–Santoña | C | 1900–2000 | 43.40 | 3.46 | [85] | 0.9 | 1.8 | 3.8 | 6.5 | — | 4.0 |
| 41 | Asón–Santoña | Carasa | 1950–2011 | 43.38 | 3.46 | [36,92] | — | 18.0 | 13.0 | 4.8 | 4.8 | 7.0 |
| 41 | Asón–Santoña | Escalante | 1900–2011 | 43.43 | 3.50 | [11,36] | 0.1 | 0.1 | 0.4 | 1.2 | 1.2 | 1.0 |
| 41 | Asón–Santoña | Lastra | 1911–2011 | 43.45 | 3.47 | [36] | 0.2 | 1.6 | 1.9 | 2.5 | 2.5 | 2.2 |
| 41 | Asón–Santoña | MS1A2 | 1960–2019 | 43.36 | 3.42 | [43] | — | — | 2.8 | 2.8 | 2.8 | 2.8 |
| 41 | Asón–Santoña | MS2A3 | 1960–2019 | 43.41 | 3.48 | [43] | — | — | 2.4 | 2.4 | 2.4 | 2.4 |
| 41 | Asón–Santoña | MS2B2 | 1960–2019 | 43.41 | 3.48 | [43] | — | — | 1.5 | 1.5 | 1.5 | 1.5 |
| 41 | Asón–Santoña | S | 1900–2000 | 43.45 | 3.46 | [85] | 0.5 | 2.1 | 2.8 | 8.3 | — | 4.6 |
| 43 | Barbadun | B | 1900–2001 | 43.33 | 3.11 | [23] | 0.8 | 2.8 | 4.3 | 7.8 | — | 4.5 |
| 43 | Barbadun | M | 1900–2003 | 43.34 | 3.11 | [23] | 0.8 | 1.8 | 1.8 | 1.8 | — | 1.8 |
| 44 | Nervión–Bilbao | Abra 1 | 1959–2015 | 43.33 | 3.01 | [27,93,94] | — | 3.0 | 6.5 | 8.1 | 7.0 | 11.3 |
| 44 | Nervión–Bilbao | Abra 2 | 1978–2015 | 43.33 | 3.01 | [27,94] | — | — | — | 5.6 | 5.7 | 9.7 |
| 44 | Nervión–Bilbao | Abra 3 | 1971–2015 | 43.33 | 3.01 | [27,94] | — | — | — | 10.2 | 8.6 | 12.3 |
| 44 | Nervión–Bilbao | Abra 4 | 1959–2015 | 43.33 | 3.01 | [27,93,94] | — | — | — | 8.9 | 10.8 | 12.5 |
| 44 | Nervión–Bilbao | Abra 5 | 1999–2015 | 43.33 | 3.01 | [27,94] | — | — | — | 30.0 | 30.0 | 29.4 |
| 44 | Nervión–Bilbao | Abra 6 | 1994–2015 | 43.33 | 3.01 | [27,94] | — | — | — | 29.5 | 29.5 | 29.5 |
| 45 | Butrón–Plentzia | ISKZ | 1980–2006 | 43.39 | 2.91 | [24,33,34] | — | — | 15.0 | 15.0 | — | 15.0 |
| 45 | Butrón–Plentzia | O | 1880–1997 | 43.39 | 2.93 | [2] | 0.6 | 0.6 | 3.2 | 3.2 | — | 4.2 |
| 45 | Butrón–Plentzia | T | 1880–1997 | 43.40 | 2.95 | [2] | 1.0 | 1.0 | 0.5 | 0.5 | — | 2.5 |
| 47 | Oka–Urdaibai | AX | 1900–2008 | 43.37 | 2.68 | [11] | 2.8 | 21.0 | 21.0 | 1.0 | 1.0 | 3.7 |
| 47 | Oka–Urdaibai | BA | 1900–2008 | 43.35 | 2.66 | [10] | 3.0 | 4.0 | 1.1 | 1.1 | 1.1 | 2.2 |
| 47 | Oka–Urdaibai | BU | 1900–2003 | 43.37 | 2.68 | [10] | 1.8 | 1.8 | 13.3 | 4.4 | 4.4 | 3.6 |
| 47 | Oka–Urdaibai | IS | 1900–2008 | 43.35 | 2.67 | [10] | 2.4 | 19.0 | 2.7 | 2.7 | 2.7 | 4.1 |
| 47 | Oka–Urdaibai | Ka | 1900–2004 | 43.36 | 2.67 | [33,34] | 1.0 | 1.0 | 1.0 | 1.0 | 1.0 | 1.0 |
| 47 | Oka–Urdaibai | Ma | 1958–2007 | 43.36 | 2.68 | [33,34] | — | 10.0 | 10.0 | 10.0 | 10.0 | 10.0 |
| 47 | Oka–Urdaibai | Muc | 1900–2010 | 43.35 | 2.67 | [7] | 0.7 | 0.7 | 4.0 | 3.4 | 3.4 | 1.8 |
| 53 | Deba | DB-3; D1 | 1911–2016 | 43.29 | 2.36 | [26,29] | 1.1 | 2.0 | 3.0 | 5.1 | 28.7 | 5.5 |
| 53 | Deba | Deba 2 | 1950–2016 | 43.28 | 2.36 | [95] | — | 2.3 | 2.3 | 4.8 | 23.0 | 7.9 |
| 54 | Urola | Z1 | 1900–2018 | 43.28 | 2.24 | [29] | 6.0 | 6.0 | 2.2 | 2.2 | 2.2 | 4.0 |
| 54 | Urola | ZM, Z2 | 1900–2015 | 43.29 | 2.25 | [29,96] | 0.7 | 2.1 | 4.7 | 6.5 | 5.9 | 2.9 |
| 58 | Oiartzun | PAS2 | 1968–2015 | 43.32 | 1.90 | [8] | — | — | 9.3 | 9.3 | 9.3 | 9.3 |
3.1. Sedimentation Rates (SRs)
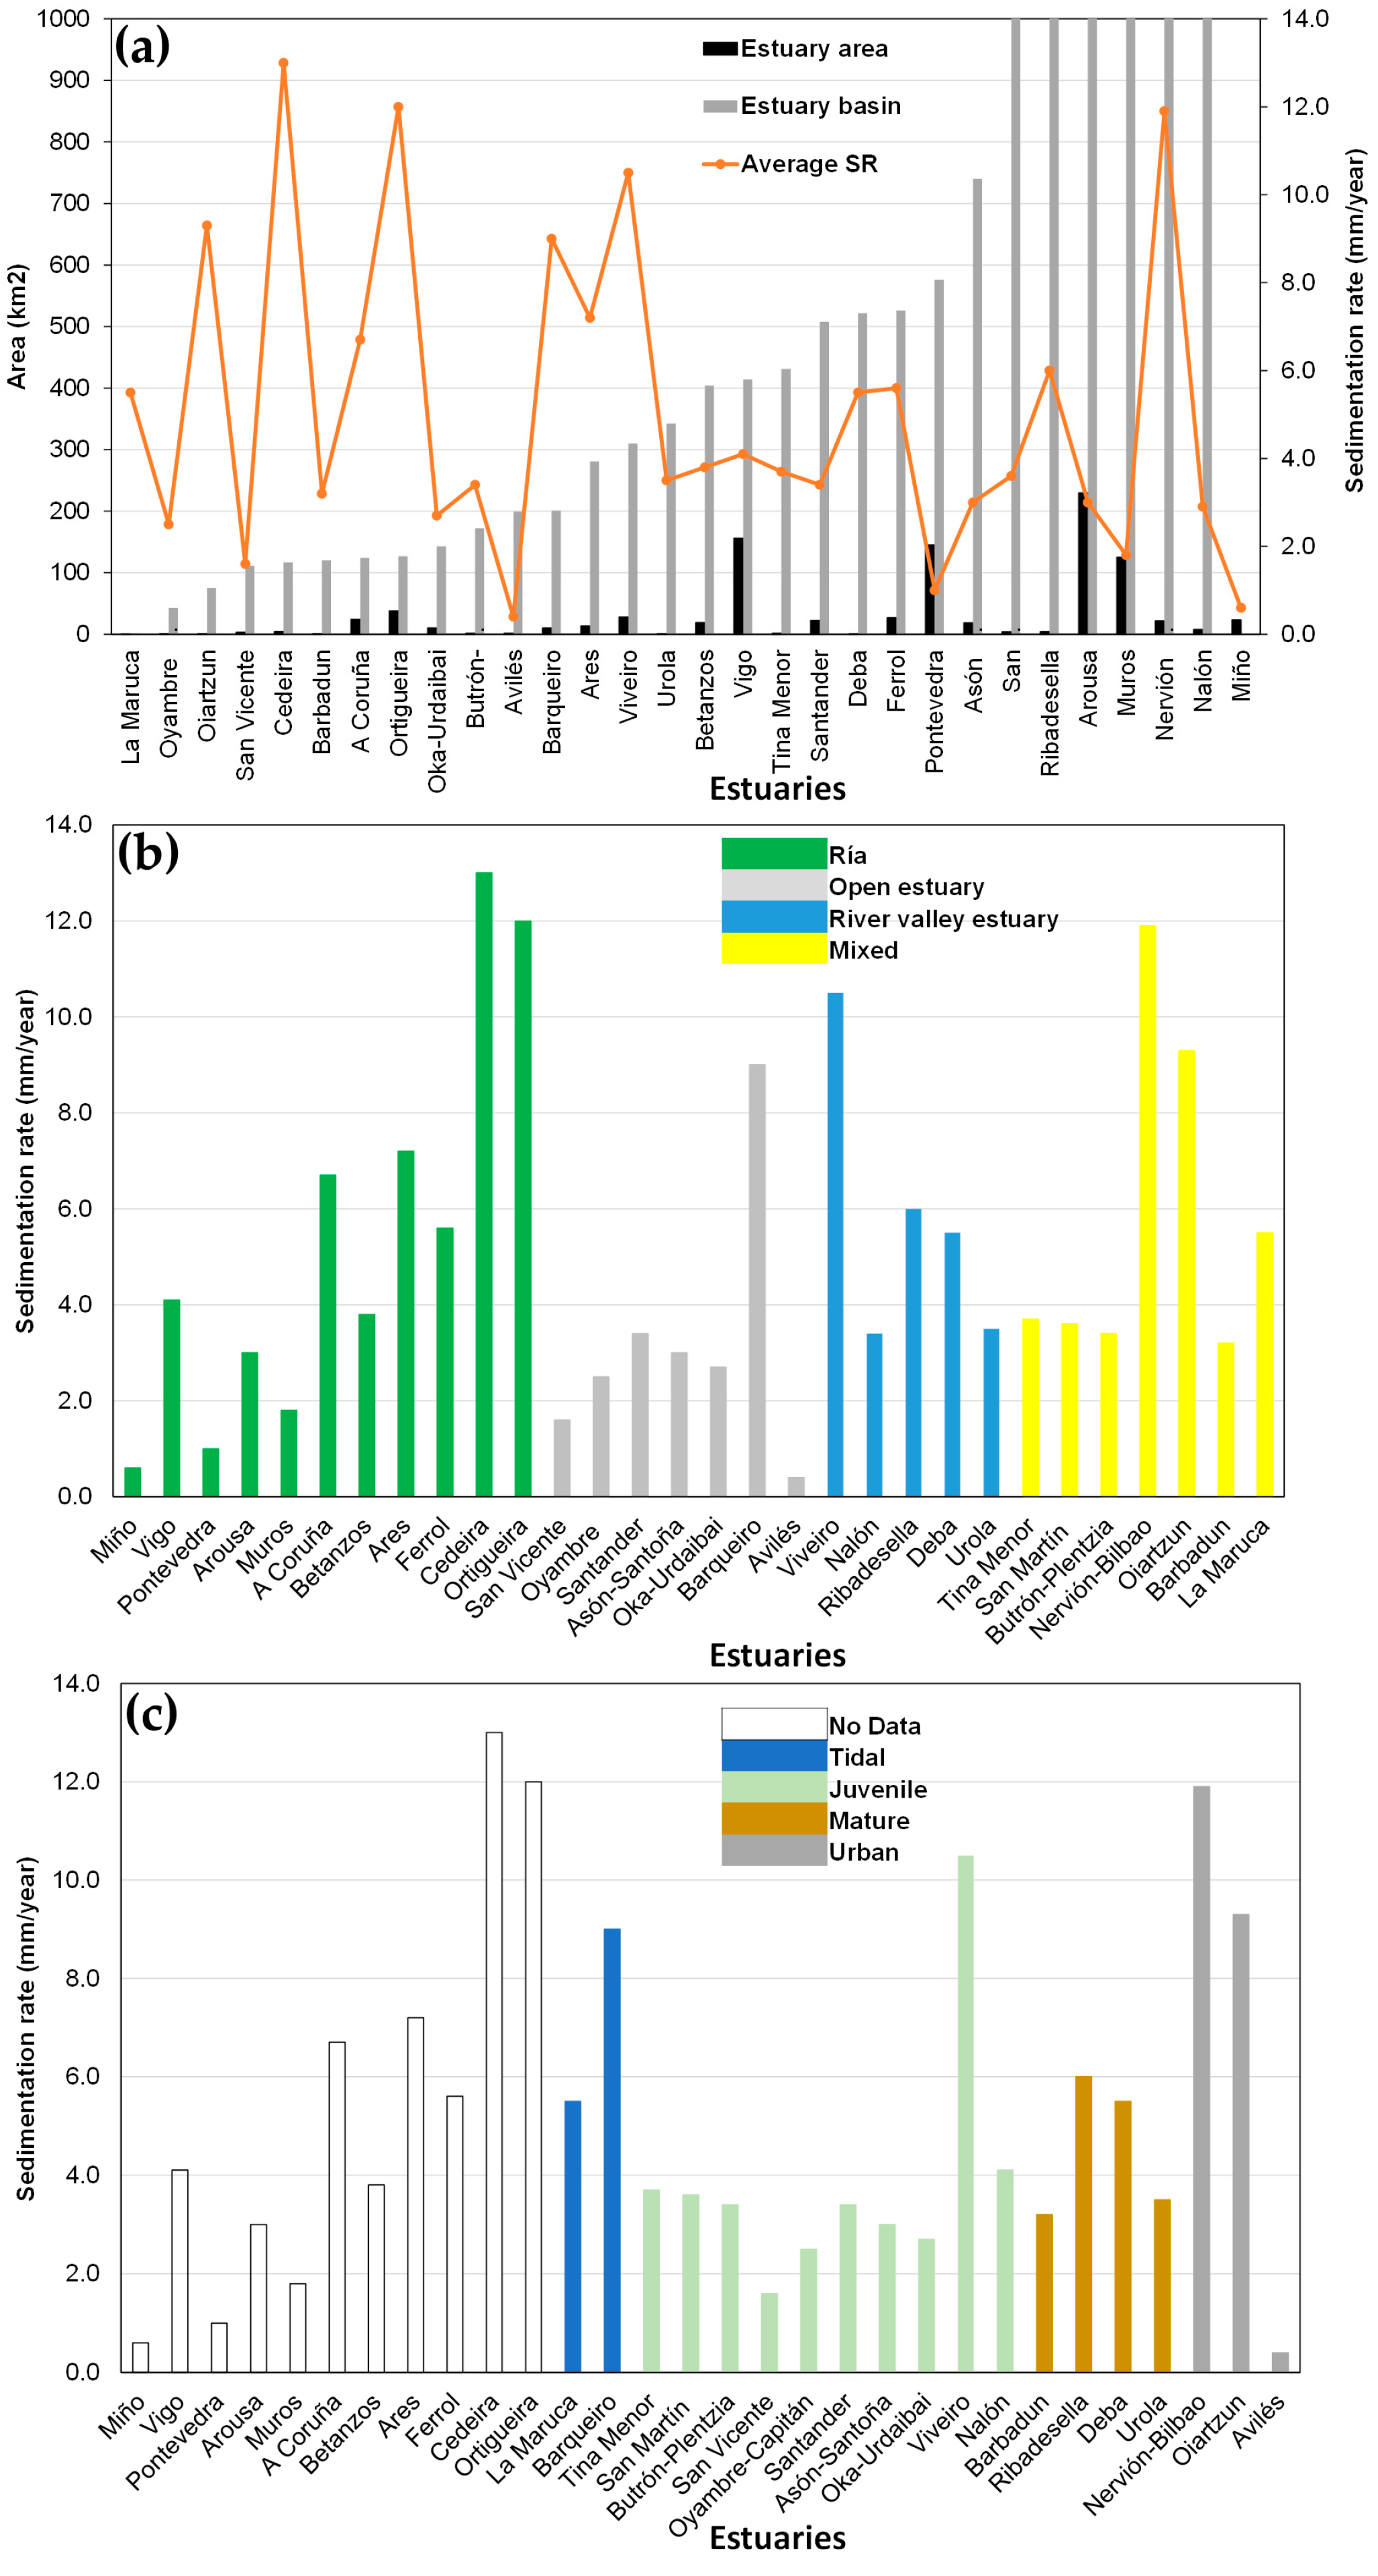
3.2. Spatial Pattern
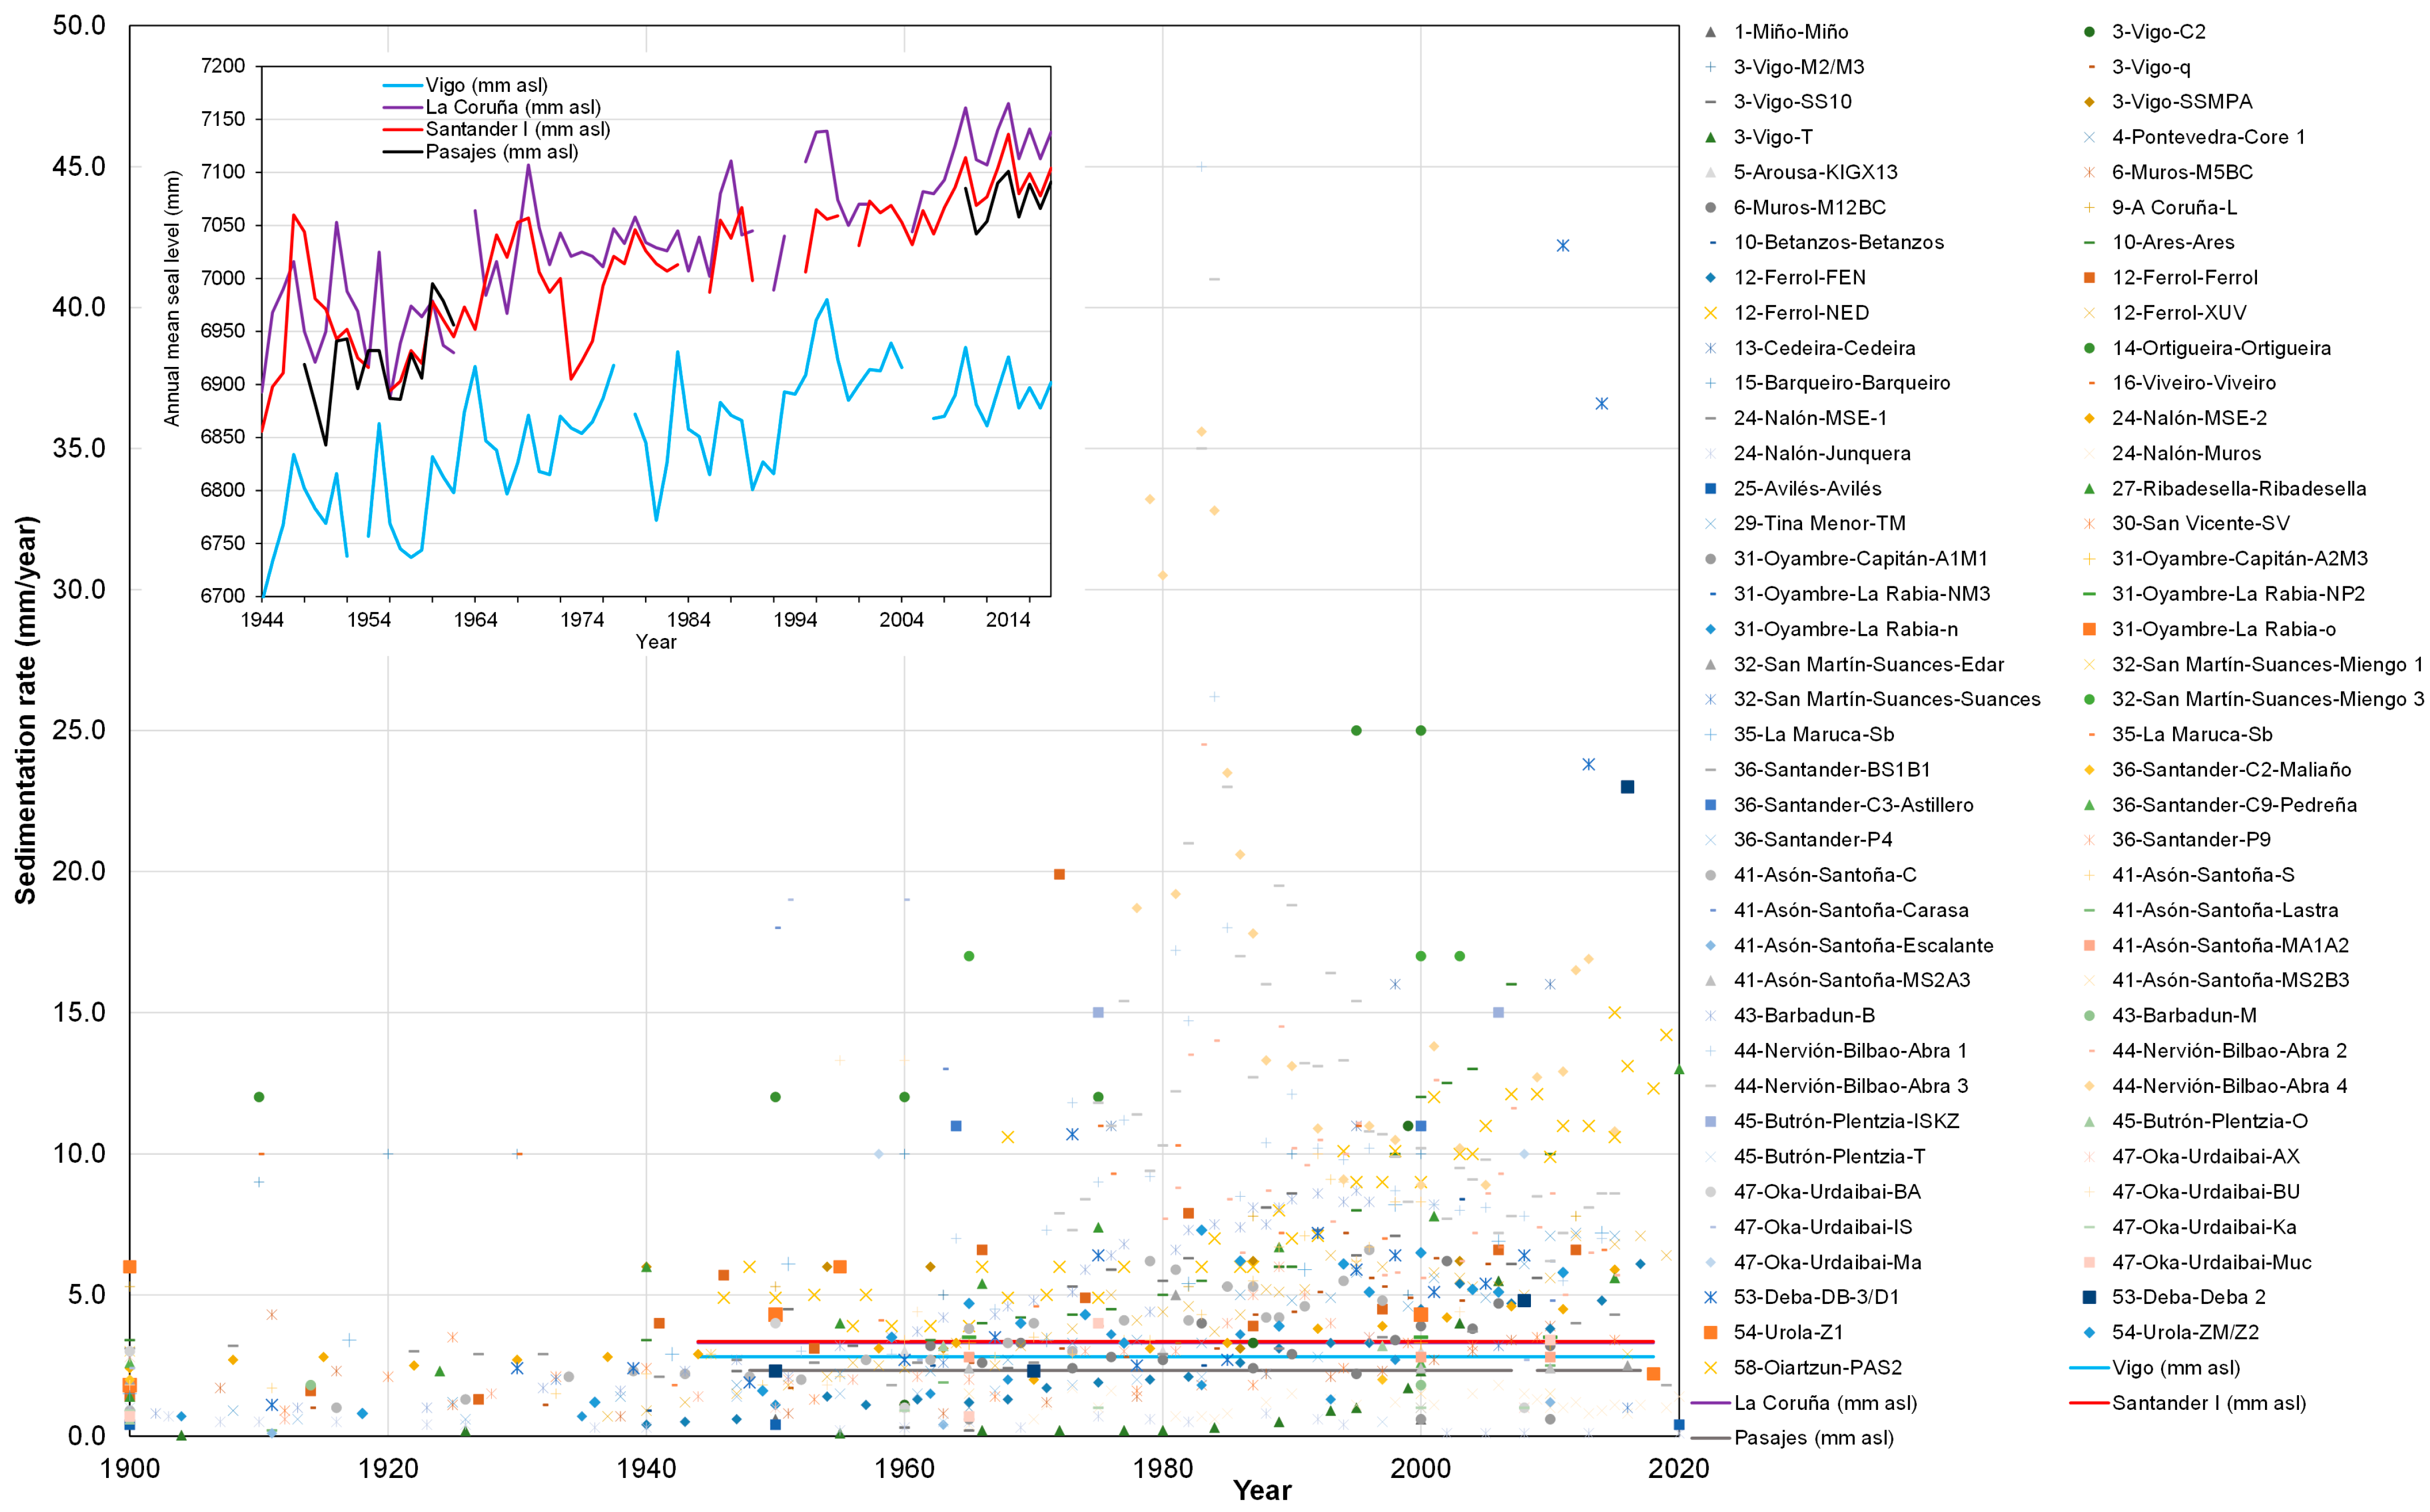
3.3. Temporal Evolution
4. Discussion
5. Conclusions
Author Contributions
Funding
Data Availability Statement
Acknowledgments
Conflicts of Interest
References
- Serrano, M.A.; Cobos, M.; Magaña, P.J.; Díez-Minguito, M. Sensitivity of Iberian estuaries to changes in sea water temperature, salinity, river flow, mean sea level, and tidal amplitudes. Estuar. Coast. Shelf Sci. 2020, 236, 106624. [Google Scholar] [CrossRef]
- Cearreta, A.; Irabien, M.J.; Ulibarri, I.; Yusta, I.; Croudace, I.W.; Cundy, A.B. Recent salt marsh development and natural regeneration of reclaimed areas in the Plentzia estuary, N. Spain. Estuar. Coast. Shelf Sci. 2002, 54, 863–886. [Google Scholar] [CrossRef]
- Lario, J.; Zazo, C.; Goy, J.L.; Dabrio, C.J.; Borja, F.; Silva, P.G.; Sierro, F.; González, A.; Soler, V.; Yll, E. Changes in sedimentation trends in SW Iberia Holocene estuaries (Spain). Quat. Int. 2002, 93–94, 171–176. [Google Scholar] [CrossRef]
- Lebreiro, S.M.; Francés, G.; Abrantes, F.F.G.; Diz, P.; Bartels-Jónsdóttir, H.B.; Stroynowski, Z.N.; Gil, I.M.; Pena, L.D.; Rodrigues, T.; Jones, P.D.; et al. Climate change and coastal hydrographic response along the Atlantic Iberian margin (Tagus Prodelta and Muros Ría) during the last two millennia. Holocene 2006, 16, 1003–1015. [Google Scholar] [CrossRef]
- Méndez-Martínez, G.; Pérez-Arlucea, M.; González-Villanueva, R.; Campos, A.O. Anthropogenic influence on the Holocene sedimentation process along the Atlantic coast of Galicia (NW Iberian Peninsula). J. Coast. Res. 2011, 64, 1788–1792. [Google Scholar]
- Martins, V.; Figueira, R.C.L.; França, E.J.; Ferreira, P.A.d.L.; Martins, P.; Santos, J.F.; Dias, J.A.; Laut, L.L.M.; Soares, A.M.M.; Silva, E.F.d; et al. Sedimentary processes on the NW Iberian continental shelf since the Little Ice Age. Estuar. Coast. Shelf Sci. 2012, 102–103, 48–59. [Google Scholar] [CrossRef]
- García-Artola, A.; Cearreta, A.; Leorri, E. Relative sea-level changes in the Basque coast (northern Spain, Bay of Biscay) during the Holocene and Anthropocene: The Urdaibai estuary case. Quat. Int. 2015, 364, 172–180. [Google Scholar] [CrossRef]
- Irabien, M.J.; Cearreta, A.; Gómez-Arozamena, J.; García-Artola, A. Holocene vs Anthropocene sedimentary records in a human-altered estuary: The Pasaia case (Northern Spain). Mar. Geol. 2020, 429, 106292. [Google Scholar] [CrossRef]
- Howarth, R.J.; Evans, G.; Croudace, I.W.; Cundy, A.B. Sources and timing of anthropogenic pollution in the Ensenada de San Simón (inner Ría de Vigo), Galicia, NW Spain: An application of mixture-modelling and nonlinear optimization to recent sedimentation. Sci. Total Environ. 2005, 340, 149–176. [Google Scholar] [CrossRef] [PubMed]
- Cearreta, A.; García-Artola, A.; Leorri, E.; Irabien, M.J.; Masque, P. Recent environmental evolution of regenerated salt marshes in the southern bay of Biscay: Anthropogenic evidences in their sedimentary record. J. Mar. Syst. 2013, 109–110, S203–S212. [Google Scholar] [CrossRef]
- Leorri, E.; Cearreta, A.; Irabien, M.J.; García-Artola, A.; Corbett, D.R.; Horsman, E.; Blake, W.H.; Sanchez-Cabeza, J.A. Anthropogenic disruptions of the sedimentary record in coastal marshes: Examples from the southern bay of Biscay (N. Spain). Cont. Shelf Res. 2014, 86, 132–140. [Google Scholar] [CrossRef]
- Sierra, C.; Boado, C.; Saavedra, A.; Ordóñez, C.; Gallego, J.R. Origin, patterns and anthropogenic accumulation of potentially toxic elements (PTEs) in surface sediments of the Avilés estuary (Asturias, Northern Spain). Mar. Pollut. Bull. 2014, 86, 530–538. [Google Scholar] [CrossRef] [PubMed]
- Prego, R.; Álvarez-Iglesias, P.; Quintana, B.; Caetano, M.; Vale, C.; Álvarez-Vázquez, M.A. Chemical contamination in “O Burgo” estuary (Galicia). Lithogenic and anthropogenic inputs to the sedimentary reservoir. In Proceedings of the XXVI Encontro Galego Portugués de Quimica, Santiago de Compostela, Spain, 16–18 November 2022. [Google Scholar]
- Narbarte, J.; Iriarte, E.; Oronoz, A.D.; Castillo, J.A.Q. Tracing the legacies of anthropogenic landscape transformation in the Iberian Atlantic margin: Historical and geoarchaeological investigations in the Bidasoa estuary (Basque Country). Cont. Shelf Res. 2023, 257, 104970. [Google Scholar] [CrossRef]
- Gardoki, J.; Cearreta, A.; Irabien, M.J.; Gómez-Arozamena, J.; Villasante-Marcos, V.; García-Artola, A.; Bessa, F. Recent environmental and morphosedimentary evolution of the mining-impacted Nalón estuary (Asturias, N Spain): Disentangling natural and anthropogenic processes. Sci. Total Environ. 2024, 943, 173792. [Google Scholar] [CrossRef] [PubMed]
- Soto, J.; Gómez, J.; Díaz, O.H.R.; Gelen, A. Estudio de tasa de sedimentación y datación de sedimentos en la bahía de Santander (España). Rev. Cuba. Fís. 2000, 17, 30–35. [Google Scholar]
- Gelen, A.; Soto, J.; Gómez, J.; Díaz, O. Sediment dating of Santander bay, Spain. J. Radioanal. Nucl. Chem. 2004, 261, 437–441. [Google Scholar] [CrossRef]
- Perez-Arlucea, M.; Mendez, G.; Clemente, F.; Nombela, M.; Rubio, B.; Filgueira, M. Hydrology, sediment yield, erosion and sedimentation rates in the estuarine environment of the Ria de Vigo, Galicia, Spain. J. Mar. Syst. 2005, 54, 209–226. [Google Scholar] [CrossRef]
- Álvarez-Iglesias, P.; Quintana, B.; Rubio, B.; Pérez-Arlucea, M. Sedimentation rates and trace metal input history in intertidal sediments from San Simón bay (Ría de Vigo, NW Spain) derived from 210Pb and 137Cs chronology. J. Environ. Radioact. 2007, 98, 229–250. [Google Scholar] [CrossRef]
- Klaminder, J.; Appleby, P.; Crook, P.; Renberg, I. Post-deposition diffusion of 137Cs in lake sediment: Implications for radiocaesium dating. Sedimentology 2012, 59, 2259–2267. [Google Scholar] [CrossRef]
- Foucher, A.; Chaboche, P.A.; Sabatier, P.; Evrard, O. A worldwide meta-analysis (1977–2020) of sediment core dating using fallout radionuclides including 137Cs and 210Pbxs. Earth Syst. Sci. Data 2021, 13, 4951–4966. [Google Scholar] [CrossRef]
- Foucher, A.; Chaboche, P.A.; Sabatier, P.; Evrard, O. Global review of 137Cs and 210Pbxs fallout used for dating sediment cores [dataset]. Pangaea 2021. [Google Scholar] [CrossRef]
- Cearreta, A.; Alday, M.; Irabien, M.J.; Etxebarria, N.; Soto, J. Modern conditions and recent environmental development of the Muskiz estuary: Historical disturbance by the largest oil refinery of Spain. J. Iber. Geol. 2008, 34, 191–213. [Google Scholar]
- García-Artola, A.; Cearreta, A.; Leorri, E.; Irabien, M.J. Regeneración ambiental de marismas a partir de ocupaciones antrópicas de zonas costeras: Interés de su estudio en el escenario actual de ascenso marino. Geogaceta 2011, 50–52, 161–164. [Google Scholar]
- Agudo Toyos, P. Estudio de la Evolución Morfológica de los Canales Mareales de la ría de La Rabia tras las Obras de Recuperación y Restauración Medioambiental. Ph.D. Thesis, Universidad de Cantabria, Santander, Spain, 30 July 2013. Available online: http://hdl.handle.net/10902/16449 (accessed on 6 June 2024).
- El bani Altuna, N.; Cearreta, A.; Irabien, M.J.; Arozamena, J.G.; Hernández, S.; Soualili, K.; Hilario, A. Environmental evolution of the Deba estuary (Basque Coast Geopark) during the Holocene and Anthropocene. Geogaceta 2019, 66, 63–66. [Google Scholar]
- Serrano-García, H. El Registro Sedimentario Antropoceno de los Ecosistemas Costeros Cantábricos: Procesos de Regeneración Ambiental en los Estuarios del Saja-Besaya (Cantabria) y del Nervión (Bizkaia). Ph.D. Thesis, Universidad del País Vasco, Bilbao, Spain, 7 July 2020. Available online: http://hdl.handle.net/10810/50143 (accessed on 5 May 2024).
- Gardoki, J.; Cearreta, A.; García-Artola, A.; Irabien, M.J.; Gómez-Arozamena, J.; Villasante-Marcos, V. El registro sedimentario antropoceno en la ría del Nalón (Asturias): Impacto histórico de la minería de carbón y mercurio. Geotemas 2021, 18, 1007. [Google Scholar]
- Cearreta, A.; Irabien, M.J.; Gómez-Arozamena, J.; Altuna, N.E.B.; Goffard, A.; García-Artola, A. Environmental evolution of the Basque Coast Geopark estuaries (southern bay of Biscay) during the last 10,000 years. J. Mar. Syst. 2021, 219, 103557. [Google Scholar] [CrossRef]
- Gardoki, J.; Cearreta, A.; Irabien, M.J.; Gómez-Arozamena, J.; Villasante-Marcos, V.; García-Artola, A.; Galaz-Samaniego, C.A.; Peñalba, M.C.; Bessa, F. Modern conditions and recent environmental evolution of the industrialized inner ria of Ferrol (Galicia, NW Spain). Cont. Shelf Res. 2023, 267, 105098. [Google Scholar] [CrossRef]
- Pérez-Arlucea, M.; Álvarez-Iglesias, P.; Rubio, B. Holocene evolution of estuarine and tidal-flat sediments in San Simón Bay, Galicia, NW Spain. J. Coast. Res. 2007, 50, 163–167. [Google Scholar] [CrossRef]
- Leorri, E.; Cearreta, A. Recent sea-level changes in the southern bay of Biscay: Transfer function reconstructions from salt-marshes compared with instrumental data. Sci. Mar. 2009, 73, 287–296. [Google Scholar] [CrossRef]
- Leorri, E.; Cearreta, A.; Corbett, R.; Blake, W.; Fatela, F.; Gehrels, R.; Irabien, M.J. Identification of suitable areas for high-resolution sea-level studies in SW Europe using commonly applied 210Pb models. Geogaceta 2010, 48, 35–38. [Google Scholar]
- Leorri, E.; Cearreta, A.; García-Artola, A.; Irabien, M.J.; Blake, W.H. Relative sea-level rise in the Basque coast (N Spain): Different environmental consequences on the coastal area. Ocean Coast. Manag. 2013, 77, 3–13. [Google Scholar] [CrossRef]
- Leorri, E.; Fatela, F.; Drago, T.; Bradley, S.L.; Moreno, J.; Cearreta, A. Lateglacial and Holocene coastal evolution in the Minho estuary (N Portugal): Implications for understanding sea-level changes in Atlantic Iberia. Holocene 2013, 23, 353–363. [Google Scholar] [CrossRef]
- García-Artola, A.; Cearreta, A.; Irabien, M.J.; Leorri, E.; Sanchez-Cabeza, J.A.; Corbett, D.R. Agricultural fingerprints in salt-marsh sediments and adaptation to sea-level rise in the eastern Cantabrian coast (N. Spain). Estuar. Coast. Shelf Sci. 2016, 171, 66–76. [Google Scholar] [CrossRef]
- Vargas-Yáñez, M.; Tel, E.; Marcos, M.; Moya, F.; Ballesteros, E.; Alonso, C.; García-Martínez, M.C. Factors contributing to the long-term sea level trends in the Iberian Peninsula and the Balearic and Canary Islands. Geosciences 2023, 13, 160. [Google Scholar] [CrossRef]
- Irabien, M.J.; Cearreta, A.; Leorri, E.; Gómez, J.; Viguri, J. A 130 year record of pollution in the Suances estuary (southern bay of Biscay): Implications for environmental management. Mar. Pollut. Bull. 2008, 56, 1719–1727. [Google Scholar] [CrossRef] [PubMed]
- Álvarez-Iglesias, P.; Andrade, A.; Rey, D.; Quintana, B.; Bernabeu, A.M.; López-Pérez, A.E.; Rubio, B. Assessment and timing of the anthropogenic imprint and fisheries richness in marine sediments from Ría de Muros (NW Iberian peninsula). Quat. Int. 2020, 566–567, 337–356. [Google Scholar] [CrossRef]
- Pszonka, J.; Godlewski, P.; Fheed, A.; Dwornik, M.; Schulz, B.; Wendorff, M. Identification and quantification of intergranular volume using SEM automated mineralogy. Mar. Pet. Geol. 2024, 162, 106708. [Google Scholar] [CrossRef]
- Yamada, K.; Omori, T.; Kitaba, I.; Hori, T.; Nakagawa, T. Extraction method for fossil pollen grains using a cell sorter suitable for routine 14C dating. Quat. Sci. Rev. 2021, 272, 107236. [Google Scholar] [CrossRef]
- Rosa, J.M.D.l.; Araújo, M.F.; González-Pérez, J.A.; González-Vila, F.J.; Soares, A.M.; Martins, J.M.; Leorri, E.; Corbett, R.; Fatela, F. Organic matter sources for tidal marsh sediment over the past two millennia in the Minho river estuary (NW Iberian Peninsula). Org. Geochem. 2012, 53, 16–24. [Google Scholar] [CrossRef]
- Mazarrasa, I.; Neto, J.M.; Bouma, T.J.; Grandjean, T.; Garcia-Orellana, J.; Masqué, P.; Recio, M.; Serrano, Ó.; Puente, A.; Juanes, J.A. Drivers of variability in blue carbon stocks and burial rates across European estuarine habitats. Sci. Total Environ. 2023, 886, 163957. [Google Scholar] [CrossRef]
- Hong, Y.; Wu, J.; Guan, F.; Yue, W.; Long, A. Nitrogen removal in the sediments of the Pearl river estuary, China: Evidence from the distribution and forms of nitrogen in the sediment cores. Mar. Pollut. Bull. 2019, 138, 115–124. [Google Scholar] [CrossRef] [PubMed]
- Mangas-Suarez, M.; Garcia-Ordiales, E.; Pérez, J.A.; Álvarez, R.; Villa, A.; Ordoñez, A.; Roqueñí, N. Enrichment of metals in the sediments of an industrially impacted estuary: Geochemistry, dispersion and environmental considerations. Appl. Sci. 2022, 12, 10998. [Google Scholar] [CrossRef]
- Rubio, B.; Pye, K.; Rae, J.E.; Rey, D. Sedimentological characteristics, heavy metal distribution and magnetic properties in subtidal sediments, Ria de Pontevedra, NW Spain. Sedimentology 2001, 48, 1277–1296. [Google Scholar] [CrossRef]
- Lorenzo, F.; Alonso, A.; Pellicer, M.J.; Pagés, J.L.; Pérez-Arlucea, M. Historical analysis of heavy metal pollution in three estuaries on the north coast of Galicia (NW Spain). Environ. Geol. 2007, 52, 789–802. [Google Scholar] [CrossRef]
- Martin, J.; Lusher, A.L.; Nixon, F.C. A review of the use of microplastics in reconstructing dated sedimentary archives. Sci. Total Environ. 2022, 806, 150818. [Google Scholar] [CrossRef]
- Brenner, M.; Whitmore, T.J.; Curtis, J.H.; Hodell, D.A.; Schelske, C.L. Stable Isotope (δ13C and δ15N) Signatures of sedimented organic matter as indicators of historic lake trophic state. J. Paleolimnol. 1999, 22, 205–221. [Google Scholar] [CrossRef]
- Dumoulin, J.-P.; Pozzato, L.; Rassman, J.; Toussaint, F.; Fontugne, M.; Tisnérat-Laborde, N.; Beck, L.; Caffy, I.; Delqué-Količ, E.; Moreau, C.; et al. Isotopic signature (δ13C, ∆14C) of DIC in sediment pore waters: An example from the Rhone river delta. Radiocarbon 2018, 60, 1465–1481. [Google Scholar] [CrossRef]
- Hatfield, R.G. Particle size-specific magnetic measurements as a tool for enhancing our understanding of the bulk magnetic properties of sediments. Minerals 2014, 4, 758–787. [Google Scholar] [CrossRef]
- Ahn, H.-S.; Lim, J.; Kim, S.W. Magnetic properties of a Holocene sediment core from the Yeongsan estuary, southwest Korea: Implications for diagenetic effects and availability as paleoenvironmental proxies. Front. Earth Sci. 2021, 9, 593332. [Google Scholar] [CrossRef]
- Viguri, J.R.; Irabien, M.J.; Yusta, I.; Soto, J.; Gómez-Arozamena, J.; Rodriguez, P.; Martinez-Madrid, M.; Irabien, J.A.; Coz, A. Physico-chemical and toxicological characterization of the historic estuarine sediments: A multidisciplinary approach. Environ. Int. 2007, 33, 436–444. [Google Scholar] [CrossRef]
- Álvarez-Iglesias, P.; Rubio, B. Geochemistry of marine sediments from inner Ría de Vigo (NW Spain). J. Radioanal. Nucl. Chem. 2009, 281, 247–251. [Google Scholar] [CrossRef]
- García-Ordiales, E.; Cienfuegos, P.; Roqueñí, N.; Covelli, S.; Flor-Blanco, G.; Fontolan, G.; Loredo, J. Historical accumulation of potentially toxic trace elements resulting from mining activities in estuarine salt marshes sediments of the Asturias coastline (Northern Spain). Environ. Sci. Pollut. Res. 2019, 26, 3115–3128. [Google Scholar] [CrossRef]
- Bruschi, V.M.; Bonachea, J.; Remondo, J.; Gómez-Arozamena, J.; Rivas, V.; Méndez, G.; Naredo, J.M.; Cendrero, A. Analysis of geomorphic systems’ response to natural and human drivers in northern Spain: Implications for global geomorphic change. Geomorphology 2013, 196, 267–279. [Google Scholar] [CrossRef]
- Borja, A.; Amouroux, D.; Anschutz, P.; Gómez-Gesteira, M.; Uyarra, M.C.; Valdés, L. The Bay of Biscay. In World Seas: An Environmental Evaluation, 2nd ed.; Sheppard, C., Ed.; Academic Press: Cambridge, MA, USA, 2019; pp. 113–152. [Google Scholar]
- Instituto Geográfico Nacional. Available online: https://www.ign.es/web/ign/portal/ane-datos-geograficos/-/datos-geograficos/ (accessed on 9 May 2024).
- Morales, J.A.; Pérez-Alberti, A. Introducing the Spanish coast. In The Spanish Coastal Systems: Dynamic Processes, Sediments and Management; Morales, J.A., Ed.; Springer International Publishing: Cham, Switzerland, 2019; pp. 1–23. [Google Scholar]
- Galván-Arbeiza, C. Clasificación de Estuarios a Diferentes Escalas Espaciales Mediante la Integración de Modelos Físicos y Biológicos. Ph.D. Thesis, Universidad de Cantabria, Santander, Spain, 21 November 2014. Available online: http://hdl.handle.net/10902/5888 (accessed on 6 May 2024).
- Cameron, W.M.; Pritchard, D.W. Estuaries. In The Sea; Hill, M.N., Ed.; John Wiley and Sons: New York, NY, USA, 1963; Volume 2, pp. 306–324. [Google Scholar]
- Evans, G.; Prego, R. Rias, estuaries and incised valleys: Is a Ría an estuary? Mar. Geol. 2003, 196, 171–175. [Google Scholar] [CrossRef]
- Castaing, P.; Guilcher, A. Geomorphology and Sedimentology of Rias. In Geomorphology and Sedimentology of Estuaries; Perillo, G.M.E., Ed.; Developments in Sedimentology; Elsevier: Amsterdam, The Netherlands, 1995; Volume 53, pp. 69–111. [Google Scholar]
- EMODnet Map Viewer. Available online: https://emodnet.ec.europa.eu/geoviewer/ (accessed on 1 February 2024).
- Instituto Nacional de Estadística. Available online: https://www.ine.es/ (accessed on 15 May 2024).
- Appleby, P.G.; Oldfieldz, F. The assessment of 210Pb data from sites with varying sediment accumulation rates. Hydrobiologia 1983, 103, 29–35. [Google Scholar] [CrossRef]
- Miller, K.M.; Heit, M. A time resolution methodology for assessing the quality of lake sediment cores that are dated by 137Cs. Limnol. Oceanogr. 1986, 31, 1292–1300. [Google Scholar] [CrossRef]
- Oldfield, F.; Richardson, N.; Appleby, P.G. Radiometric dating (210Pb, 137Cs, 241Am) of recent ombrotrophic peat accumulation and evidence for changes in mass balance. Holocene 1995, 5, 141–148. [Google Scholar] [CrossRef]
- Drexler, J.Z.; Fuller, C.C.; Archfield, S. The approaching obsolescence of 137Cs dating of wetland soils in North America. Quat. Sci. Rev. 2018, 199, 83–96. [Google Scholar] [CrossRef]
- Pedrosa-García, M.C.; Fontela, M.; Quintana, B.; Pérez, F.; Francés, G.; Marcos, T. Precise 210Pb determination with high-efficiency gamma spectrometry for dating of marine sedimentary cores. Appl. Radiat. Isot. 2020, 156, 108962. [Google Scholar] [CrossRef]
- Li, W.; Li, X.; Mei, X.; Zhang, F.; Xu, J.; Liu, C.; Wei, C.; Liu, Q. A review of current and emerging approaches for quaternary marine sediment dating. Sci. Total Environ. 2021, 780, 146522. [Google Scholar] [CrossRef]
- Wang, Y.; Amundson, R.; Trumbore, S. Radiocarbon dating of soil organic matter. Quat. Res. 1996, 45, 282–288. [Google Scholar] [CrossRef]
- WebPlotDigitizer-4.6. Available online: https://automeris.io/ (accessed on 10 January 2024).
- Tadjiki, S.; Erten, H.N. Radiochronology of sediments from the Mediterranean sea using natural 210Pb and fallout 137Cs. J. Radioanal. Nucl. Chem. 1994, 181, 447–459. [Google Scholar] [CrossRef]
- Rubio, L.; Linares-Rueda, A.; Dueñas, C.; Fernández, M.C.; Clavero, V.; Niell, F.X.; Fernández, J.A. Sediment accumulation rate and radiological characterisation of the sediment of Palmones river estuary (Southern of Spain). J. Environ. Radioact. 2003, 65, 267–280. [Google Scholar] [CrossRef]
- Liquete, C.; Lucchi, R.G.; García-Orellana, J.; Canals-Artigas, M.; Masqué-Barri, P.; Pasqual, P.; Lavoie, C. Modern sedimentation patterns and human impacts on the Barcelona continental shelf (NE Spain). Geol. Acta 2010, 8, 169–187. [Google Scholar]
- Mahu, E.; Nyarko, E.; Hulme, S.; Swarzenski, P.; Asiedu, D.K.; Coale, K.H. Geochronology and historical deposition of trace metals in three tropical estuaries in the Gulf of Guinea. Estuar. Coast. Shelf Sci. 2016, 177, 31–40. [Google Scholar] [CrossRef]
- Nyarko, E.; Klubi, E.; Laissaoui, A.; Benmansour, M. Estimating recent sedimentation rates using Lead-210 in tropical estuarine systems: Case study of Volta and Pra estuaries in Ghana, West Africa. J. Oceanogr. Mar. Res. 2016, 4, 1000141. [Google Scholar] [CrossRef]
- Dirección General de Costas. Los Estuarios Cantábricos: Perspectiva General; Unpublished report by INDUROT; Universidad de Oviedo: Oviedo, Spain, 2003; Volume I, 174p. [Google Scholar]
- Fernández, E.; Marquínez, J.; Rivas, V.; Bruschi, V.; Sánchez, J. Clasificación geomorfológica de los estuarios cantábricos. In Contribuciones Recientes Sobre Geomorfología; Benito, G., Díez-Herrero, A., Eds.; Sociedad Española de Geomorfología: Madrid, Spain, 2004; Volume 1, pp. 319–328. [Google Scholar]
- Méndez, G.; Vilas, F. Geological antecedents of the Rias Baixas (Galicia, northwest Iberian Peninsula). J. Mar. Syst. 2005, 54, 195–207. [Google Scholar] [CrossRef]
- Fernández Iglesias, E.; Marquínez, J. Zonación morfodinámica e incidencia antrópica en los estuarios de Tina Mayor y Tina Menor (Costa Cantábrica). Rev. Soc. Geol. Esp. 2002, 15, 141–157. [Google Scholar]
- Jouanneau, J.M.; Weber, O.; Drago, T.; Rodrigues, A.; Oliveira, A.; Dias, J.M.A.; Garcia, C.; Schmidt, S.; Reyss, J.L. Recent sedimentation and sedimentary budgets on the western Iberian shelf. Prog. Oceanogr. 2002, 52, 261–275. [Google Scholar] [CrossRef]
- Álvarez-Iglesias, P.; Rodriguez-Germade, I.; Rubio-Armesto, M.B.; Rey-García, D.; Quintana, B.; Millos-Alfeiran, J. Monitoring and evolution of highly lead polluted coastal environments: A case study in San Simón bay (NW Spain). Int. J. Earth Environ. Sci. 2016, 1, 112. [Google Scholar] [CrossRef]
- Irabien, M.J.; Rada, M.; Gómez-Arozamena, J.E.; Soto, J.; Mañanes, A.; Viguri, J.R. An assessment of anthropogenic impact in a nature reserve: The Santoña marshes (Northern Spain). J. Iber. Geol. 2008, 34, 235–242. [Google Scholar]
- Fernández-García, A. Datación de Sedimentos y Evaluación de Tasas de Sedimentación Mediante el Análisis de Isótopos Radiactivos de Origen Natural y Artificial Usados Como Trazadores. Master’s Thesis, Universidad de Cantabria, Santander, Spain, 25 October 2012. Available online: http://hdl.handle.net/10902/942 (accessed on 5 May 2024).
- Álvarez-Vázquez, M.Á.; Caetano, M.; Álvarez-Iglesias, P.; Pedrosa-García, M.d.C.; Calvo, S.; Uña-Álvarez, E.D.; Quintana, B.; Vale, C.; Prego, R. Natural and Anthropocene fluxes of trace elements in estuarine sediments of galician rias. Estuar. Coast. Shelf Sci. 2017, 198, 329–342. [Google Scholar] [CrossRef]
- Álvarez-Vázquez, M.Á.; Álvarez-Iglesias, P.; Uña-Álvarez, E.D.; Quintana, B.; Caetano, M.; Prego, R. Industrial supply of trace elements during the “Anthropocene”: A record in estuarine sediments from the ria of Ferrol (NW Iberian Peninsula). Mar. Chem. 2020, 223, 103825. [Google Scholar] [CrossRef]
- Hernández-Hernández, S.Y. Reconstrucción de Cambios Ambientales Mediante Análisis Microfaunístico en Sedimentos Estuarinos Holocenos de Ribadesella (Región Cantábrica). Master’s Thesis, Universidad Complutense de Madrid, Madrid, Spain, 31 July 2023. Available online: https://hdl.handle.net/20.500.14352/87638 (accessed on 5 May 2024).
- Alonso-González, M. Cantabrian Estuary Sediment Analysis by Gamma Spectroscopy of 210Pb and 137Cs: Sedimentation Rate, Dating and Biodiffusion Effects. Master’s Thesis, Universidad de Cantabria, Santander, Spain, 1 July 2015. Available online: http://hdl.handle.net/10902/7116 (accessed on 5 May 2024).
- Pérez-Avelleira, S. Datación de Sedimentos y Evaluación de la tasa de Acumulación Sedimentaria Mediante el Análisis de la Radiactividad de 210Pb y 137Cs. Master’s Thesis, Universidad de Cantabria, Santander, Spain, June 2014. Available online: http://hdl.handle.net/10902/5568 (accessed on 5 May 2024).
- Irabien, M.J.; García-Artola, A.; Cearreta, A.; Leorri, E. Chemostratigraphic and lithostratigraphic signatures of the anthropocene in estuarine areas from the eastern Cantabrian coast (N. Spain). Quat. Int. 2015, 364, 196–205. [Google Scholar] [CrossRef]
- Cearreta, A.; Irabien, M.J.; Gómez-Arozamena, J.; Kortabitarte, I.; González-Lanchas, A. The Anthropocene geological record in the Abra of Bilbao: Evidences of its natural and human history. Geogaceta 2017, 61, 11–14. [Google Scholar]
- Irabien, M.J.; Cearreta, A.; Gómez-Arozamena, J.; Serrano, H.; Sánchez-Cabeza, J.A.; Ruiz-Fernández, A.C. Geological record of extreme floods and anthropogenic impacts on an industrialised bay: The inner Abra of Bilbao (Northern Spain). Sci. Total Environ. 2019, 696, 133946. [Google Scholar] [CrossRef]
- Soualili, K. El registro sedimentario Antropoceno en el estuario del Deba (Geoparque de la Costa Vasca). CKQ Estudios de Cuaternario 2018, 8, 147–165. [Google Scholar]
- Goffard, A. Registro geológico del impacto humano en el estuario del Urola (Geoparque de La Costa Vasca) durante el Antropoceno. CKQ Estudios de Cuaternario 2016, 6, 43–60. [Google Scholar]
- Cendrero, A.; Remondo, J.; Beylich, A.A.; Cienciala, P.; Forte, L.M.; Golosov, V.N.; Gusarov, A.V.; Kijowska-Strugała, M.; Laute, K.; Li, D.; et al. Denudation and geomorphic change in the Anthropocene; a global overview. Earth-Sci. Rev. 2022, 233, 104186. [Google Scholar] [CrossRef]
- Puertos del Estado. Available online: https://www.puertos.es/es-es/oceanografia/Paginas/portus.aspx (accessed on 10 June 2024).
- National Oceanography Centre. Available online: https://psmsl.org/ (accessed on 10 June 2024).
- Ruiz-Romero, E.M. Historia de la Navegación Comercial Española. Tráfico de los Puertos de Titularidad Estatal Desde la Antigüedad a la Conclusión del Siglo XX; Ente Público Puertos del Estado: Madrid, Spain, 2004; 1376p. [Google Scholar]
- Fernández-Naranjo, F.J.; Rodríguez-Gómez, V.; Rodríguez-Pacheco, R.; Alberruche del Campo, M.E.; Arranz-González, J.C.; Vadillo-Fernández, L. Liquefaction susceptibility assessment and study of “La Luciana” tailings dam fault (Spain, 1960) based on historical documents. DYNA Rev. Fac. Minas. Univ. Nac. Colombia. Sede Medellín 2015, 82, 189–198. [Google Scholar] [CrossRef]
- The Copernicus Programme. Available online: https://climate.copernicus.eu/climate-indicators/sea-level (accessed on 10 June 2024).
- Center for Operational Oceanographic Products and Services. Available online: https://tidesandcurrents.noaa.gov/sltrends/sltrends.shtml (accessed on 10 June 2024).
- Marcos, M.; Tsimplis, M.N. Coastal sea level trends in southern Europe. Geophys. J. Int. 2008, 175, 70–82. [Google Scholar] [CrossRef]


| No. | Estuary with Cores | Area (km2) | Basin Area (km2) | Geographical Region | No. | Estuary without Cores | Area (km2) | Basin Area (km2) | Geographical Region |
|---|---|---|---|---|---|---|---|---|---|
| 1 | Miño | 23 | 17,081 | Galicia | 2 | Baiona | 0.92 | 128 | Galicia |
| 3 | Vigo | 156 | 414 | Galicia | 7 | Camariñas | 17 | 323 | Galicia |
| 4 | Pontevedra | 145 | 576 | Galicia | 8 | Corme | 27 | 487 | Galicia |
| 5 | Arousa | 230 | 1542 | Galicia | 17 | Foz | 2.8 | 295 | Galicia |
| 6 | Muros | 125 | 1611 | Galicia | 18 | Eo | 8.5 | 1023 | Galicia |
| 9 | A Coruña | 24 | 124 | Galicia | 19 | Porcía | 0.05 | 143 | Asturias |
| 10 | Betanzos | 19 | 404 | Galicia | 20 | Navia | 3.6 | 2578 | Asturias |
| 11 | Ares | 13.1 | 281 | Galicia | 21 | Barayo | 0.04 | 20.2 | Asturias |
| 12 | Ferrol | 27 | 526 | Galicia | 22 | Río Negro | 0.015 | 62 | Asturias |
| 13 | Cedeira | 4.7 | 117 | Galicia | 23 | Esva | 0.41 | 461 | Asturias |
| 14 | Ortigueira | 38 | 127 | Galicia | 26 | Villaviciosa | 6.7 | 170 | Asturias |
| 15 | Barqueiro | 10 | 201 | Galicia | 28 | Tina Mayor | 0.7 | 1194 | Cantabria |
| 16 | Viveiro | 28 | 310 | Galicia | 33 | Mogro | 2.2 | 656 | Cantabria |
| 24 | Nalón | 7.62 | 4903 | Asturias | 34 | San Juan de la Canal | 0.03 | 9.4 | Cantabria |
| 25 | Avilés | 1.45 | 199 | Asturias | 37 | Galizano | 0.07 | 9.2 | Cantabria |
| 27 | Ribadesella | 4.2 | 1287 | Asturias | 38 | Ajo | 1.02 | 95 | Cantabria |
| 29 | Tina Menor | 1.5 | 431 | Cantabria | 39 | Joyel | 0.9 | 8 | Cantabria |
| 30 | San Vicente | 3.09 | 111 | Cantabria | 40 | Victoria | 0.5 | 11.8 | Cantabria |
| 31 | Oyambre–La Rabia | 1 | 43 | Cantabria | 42 | Aguera–Oriñón | 0.6 | 157 | Cantabria |
| 32 | San Martín–Suances | 3.89 | 1043 | Cantabria | 46 | Bakio | 0.006 | 24.1 | Basque country |
| 35 | La Maruca | 0.12 | 2.02 | Cantabria | 48 | Laga | 0.00161 | 16.3 | Basque country |
| 36 | Santander | 22.4 | 508 | Cantabria | 49 | Ea | 0.012 | 10.7 | Basque country |
| 41 | Asón–Santoña | 18.7 | 740 | Cantabria | 50 | Lea | 0.5 | 89 | Basque country |
| 43 | Barbadun | 0.8 | 120 | Basque country | 51 | Saturraran | 0.0016 | 11.2 | Basque country |
| 44 | Nervión–Bilbao | 21.7 | 1783 | Basque country | 52 | Artibai | 0.5 | 172 | Basque country |
| 45 | Butrón–Plentzia | 1.6 | 172 | Basque country | 55 | Inurritza | 0.015 | 22.1 | Basque country |
| 47 | Oka–Urdaibai | 10.3 | 143 | Basque country | 56 | Oria | 2 | 863 | Basque country |
| 53 | Deba | 0.7 | 522 | Basque country | 57 | Urumea | 1.4 | 275 | Basque country |
| 54 | Urola | 1 | 342 | Basque country | 59 | Bidasoa | 7.6 | 713 | Basque country |
| 58 | Oiartzun | 1 | 75 | Basque country |
| No. | Estuary | Maximum SR | Minimum SR | Morphology | State of Infilling |
|---|---|---|---|---|---|
| 1 | Miño | 0.6 | 0.60 | Ria | N/D |
| 3 | Vigo | 11.0 | 0.04 | Ria | N/D |
| 4 | Pontevedra | 1.0 | 1.00 | Ria | N/D |
| 5 | Arousa | 3.0 | 3.00 | Ria | N/D |
| 6 | Muros | 6.2 | 0.70 | Ria | N/D |
| 9 | A Coruña | 7.8 | 5.30 | Ria | N/D |
| 10 | Betanzos | 16.0 | 3.40 | Ria | N/D |
| 11 | Ares | 8.4 | 0.90 | Ria | N/D |
| 12 | Ferrol | 19.9 | 0.40 | Ria | N/D |
| 13 | Cedeira | 16.0 | 11.00 | Ria | N/D |
| 14 | Ortigueira | 25.0 | 12.00 | Ria | N/D |
| 15 | Barqueiro | 10.0 | 9.00 | Open estuary | Tidal |
| 16 | Viveiro | 11.0 | 10.00 | River valley estuary | Juvenile |
| 24 | Nalón | 10.8 | 0.80 | River valley estuary | Juvenile |
| 25 | Avilés | 0.4 | 0.40 | Open estuary | Urban |
| 27 | Ribadesella | 13.0 | 1.40 | River valley estuary | Mature |
| 29 | Tina Menor | 7.2 | 0.90 | Mixed | Juvenile |
| 30 | San Vicente | 3.5 | 0.90 | Open estuary | Juvenile |
| 31 | Oyambre–La Rabia | 4.3 | 0.60 | Open estuary | Juvenile |
| 32 | San Martín–Suances | 17.0 | 1.00 | Mixed | Juvenile |
| 35 | La Maruca | 10.3 | 1.50 | Mixed | Tidal |
| 36 | Santander | 11.0 | 0.60 | Open estuary | Juvenile |
| 41 | Asón–Santoña | 18.0 | 0.10 | Open estuary | Juvenile |
| 43 | Barbadun | 8.7 | 0.80 | Mixed | Mature |
| 44 | Nervión–Bilbao | 45.0 | 2.90 | Mixed | Urban |
| 45 | Butrón–Plentzia | 15.0 | 0.50 | Mixed | Juvenile |
| 47 | Oka–Urdaibai | 19.0 | 0.70 | Open estuary | Juvenile |
| 53 | Deba | 55.1 | 1.10 | River valley estuary | Mature |
| 54 | Urola | 7.3 | 0.80 | River valley estuary | Mature |
| 58 | Oiartzun | 10.6 | 10.60 | Mixed | Urban |
Disclaimer/Publisher’s Note: The statements, opinions and data contained in all publications are solely those of the individual author(s) and contributor(s) and not of MDPI and/or the editor(s). MDPI and/or the editor(s) disclaim responsibility for any injury to people or property resulting from any ideas, methods, instructions or products referred to in the content. |
© 2024 by the authors. Licensee MDPI, Basel, Switzerland. This article is an open access article distributed under the terms and conditions of the Creative Commons Attribution (CC BY) license (https://creativecommons.org/licenses/by/4.0/).
Share and Cite
Bonachea, J.; Remondo, J.; Rivas, V. Estuaries in Northern Spain: An Analysis of Their Sedimentation Rates. Sustainability 2024, 16, 6856. https://doi.org/10.3390/su16166856
Bonachea J, Remondo J, Rivas V. Estuaries in Northern Spain: An Analysis of Their Sedimentation Rates. Sustainability. 2024; 16(16):6856. https://doi.org/10.3390/su16166856
Chicago/Turabian StyleBonachea, Jaime, Juan Remondo, and Victoria Rivas. 2024. "Estuaries in Northern Spain: An Analysis of Their Sedimentation Rates" Sustainability 16, no. 16: 6856. https://doi.org/10.3390/su16166856
APA StyleBonachea, J., Remondo, J., & Rivas, V. (2024). Estuaries in Northern Spain: An Analysis of Their Sedimentation Rates. Sustainability, 16(16), 6856. https://doi.org/10.3390/su16166856