
New Quality Productivity and Industrial Structure in China: The Moderating Effect of Environmental Regulation


Abstract
1. Introduction
2. Literature Review
2.1. Literature on New Quality Productivity and Industrial Structure
2.2. Literature on Environmental Regulation and Industrial Structure
3. Theoretical Analysis and Hypothesis Development
3.1. The Connotation of New Quality Productivity
3.2. Analysis of the Mechanism between New Quality Productivity and Industrial Structure
3.3. Analysis of the Mechanism of New Quality Productivity, Environmental Regulation and Industrial Structure
4. Methods and Data
4.1. Construction and Measurement of New Quality Productivity Index System
4.1.1. Construction of New Quality Productivity Index System
- (1)
- Construction of the index system
- (2)
- Sample Selection and Data Description
4.1.2. Measurement of New Quality Productivity Index System
4.2. Variable Selection Specification
4.3. Econometric Modeling
5. Results and Discussion
5.1. Analysis of the Results of the Neoplasm Productivity Measurements
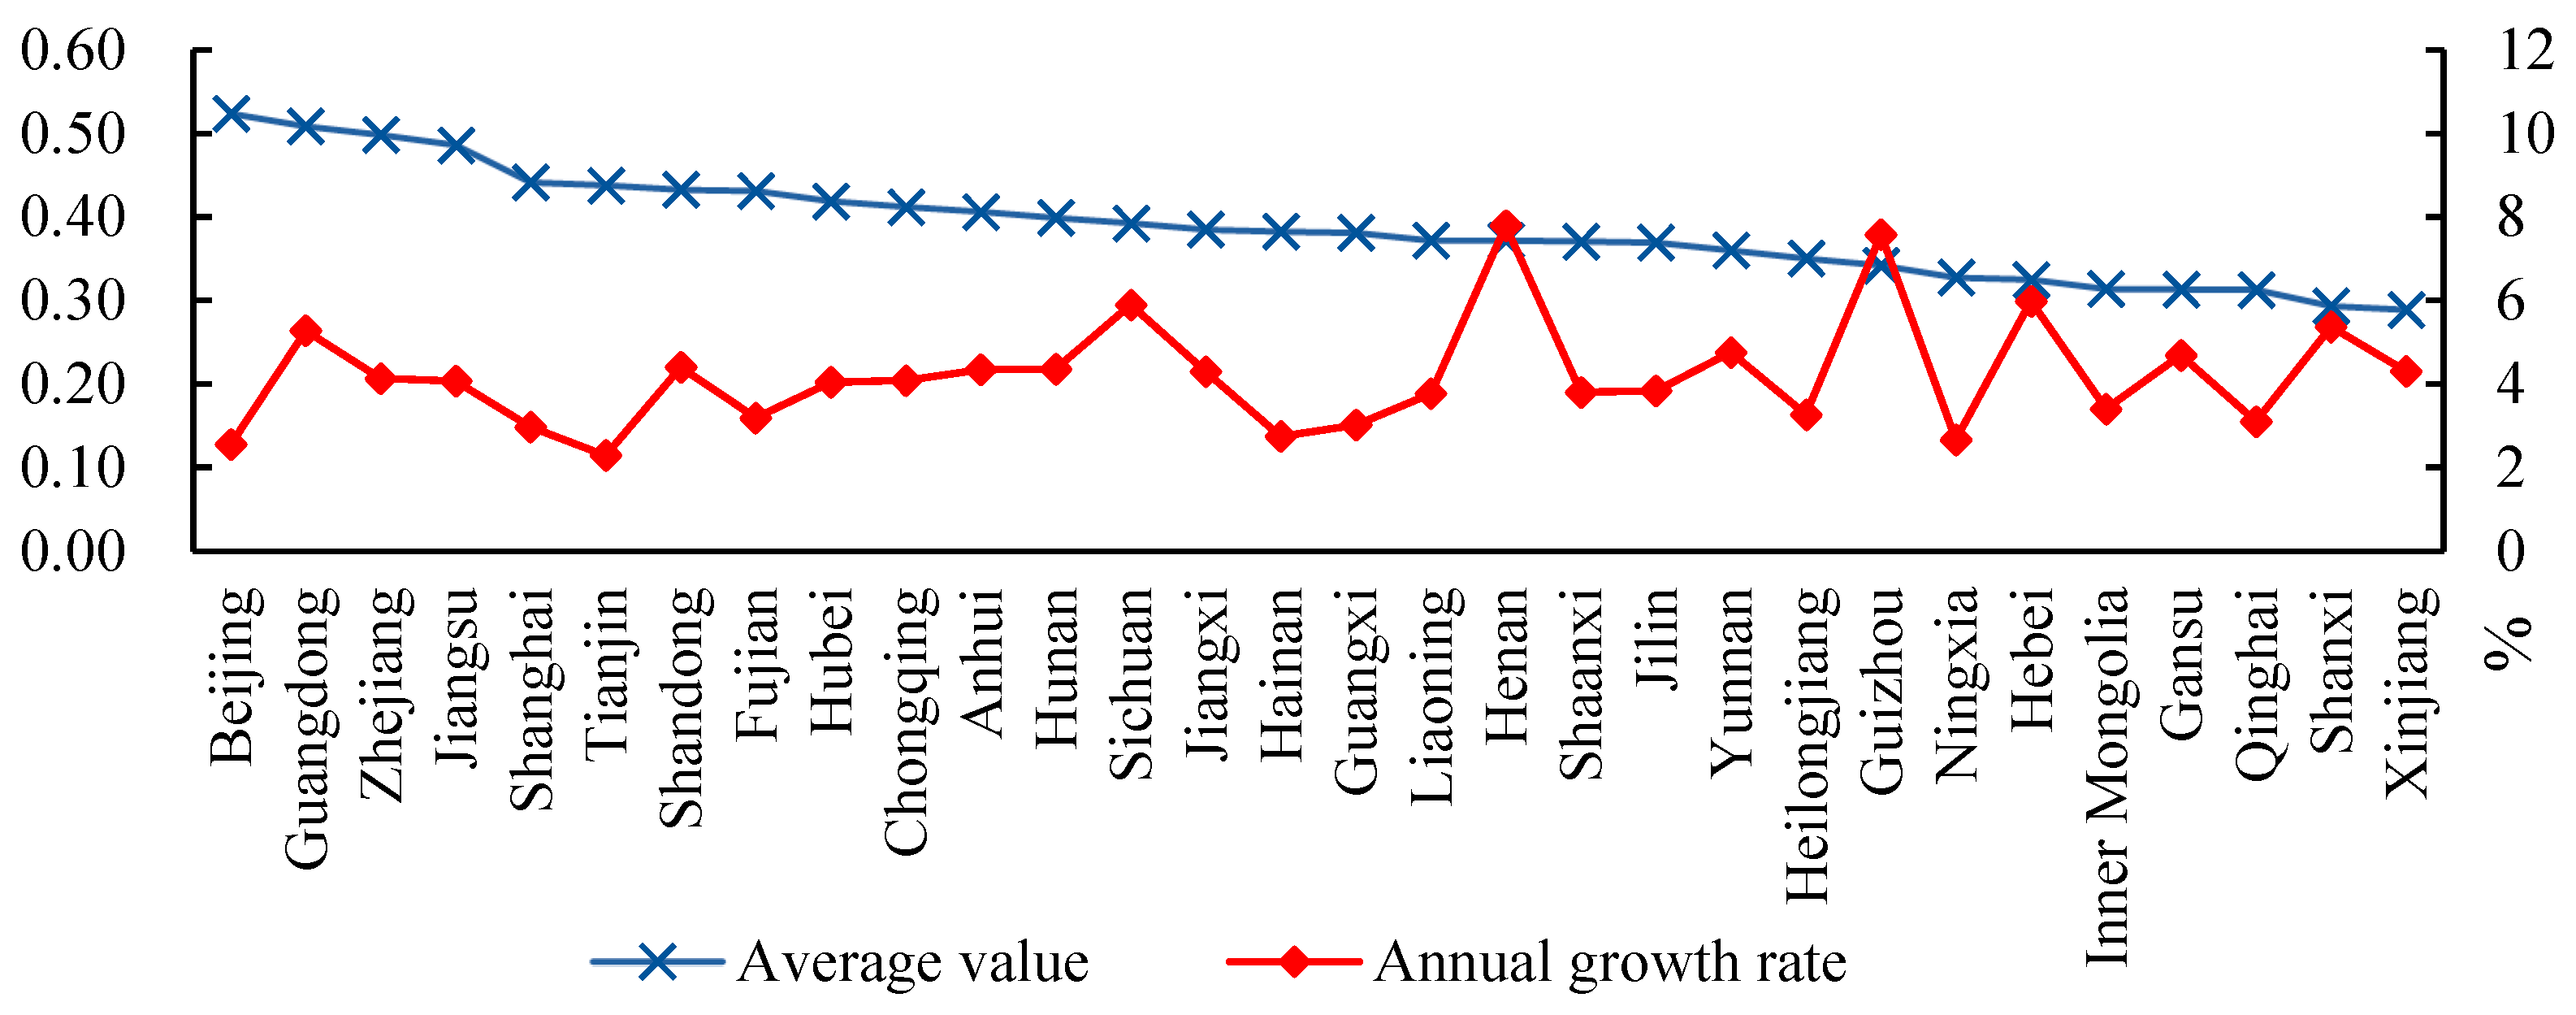
5.1.1. Overall Analysis of New Quality Productivity Measurement Results
- (1)
- Analysis of new quality productivity at the national and sub-regional levels
- (2)
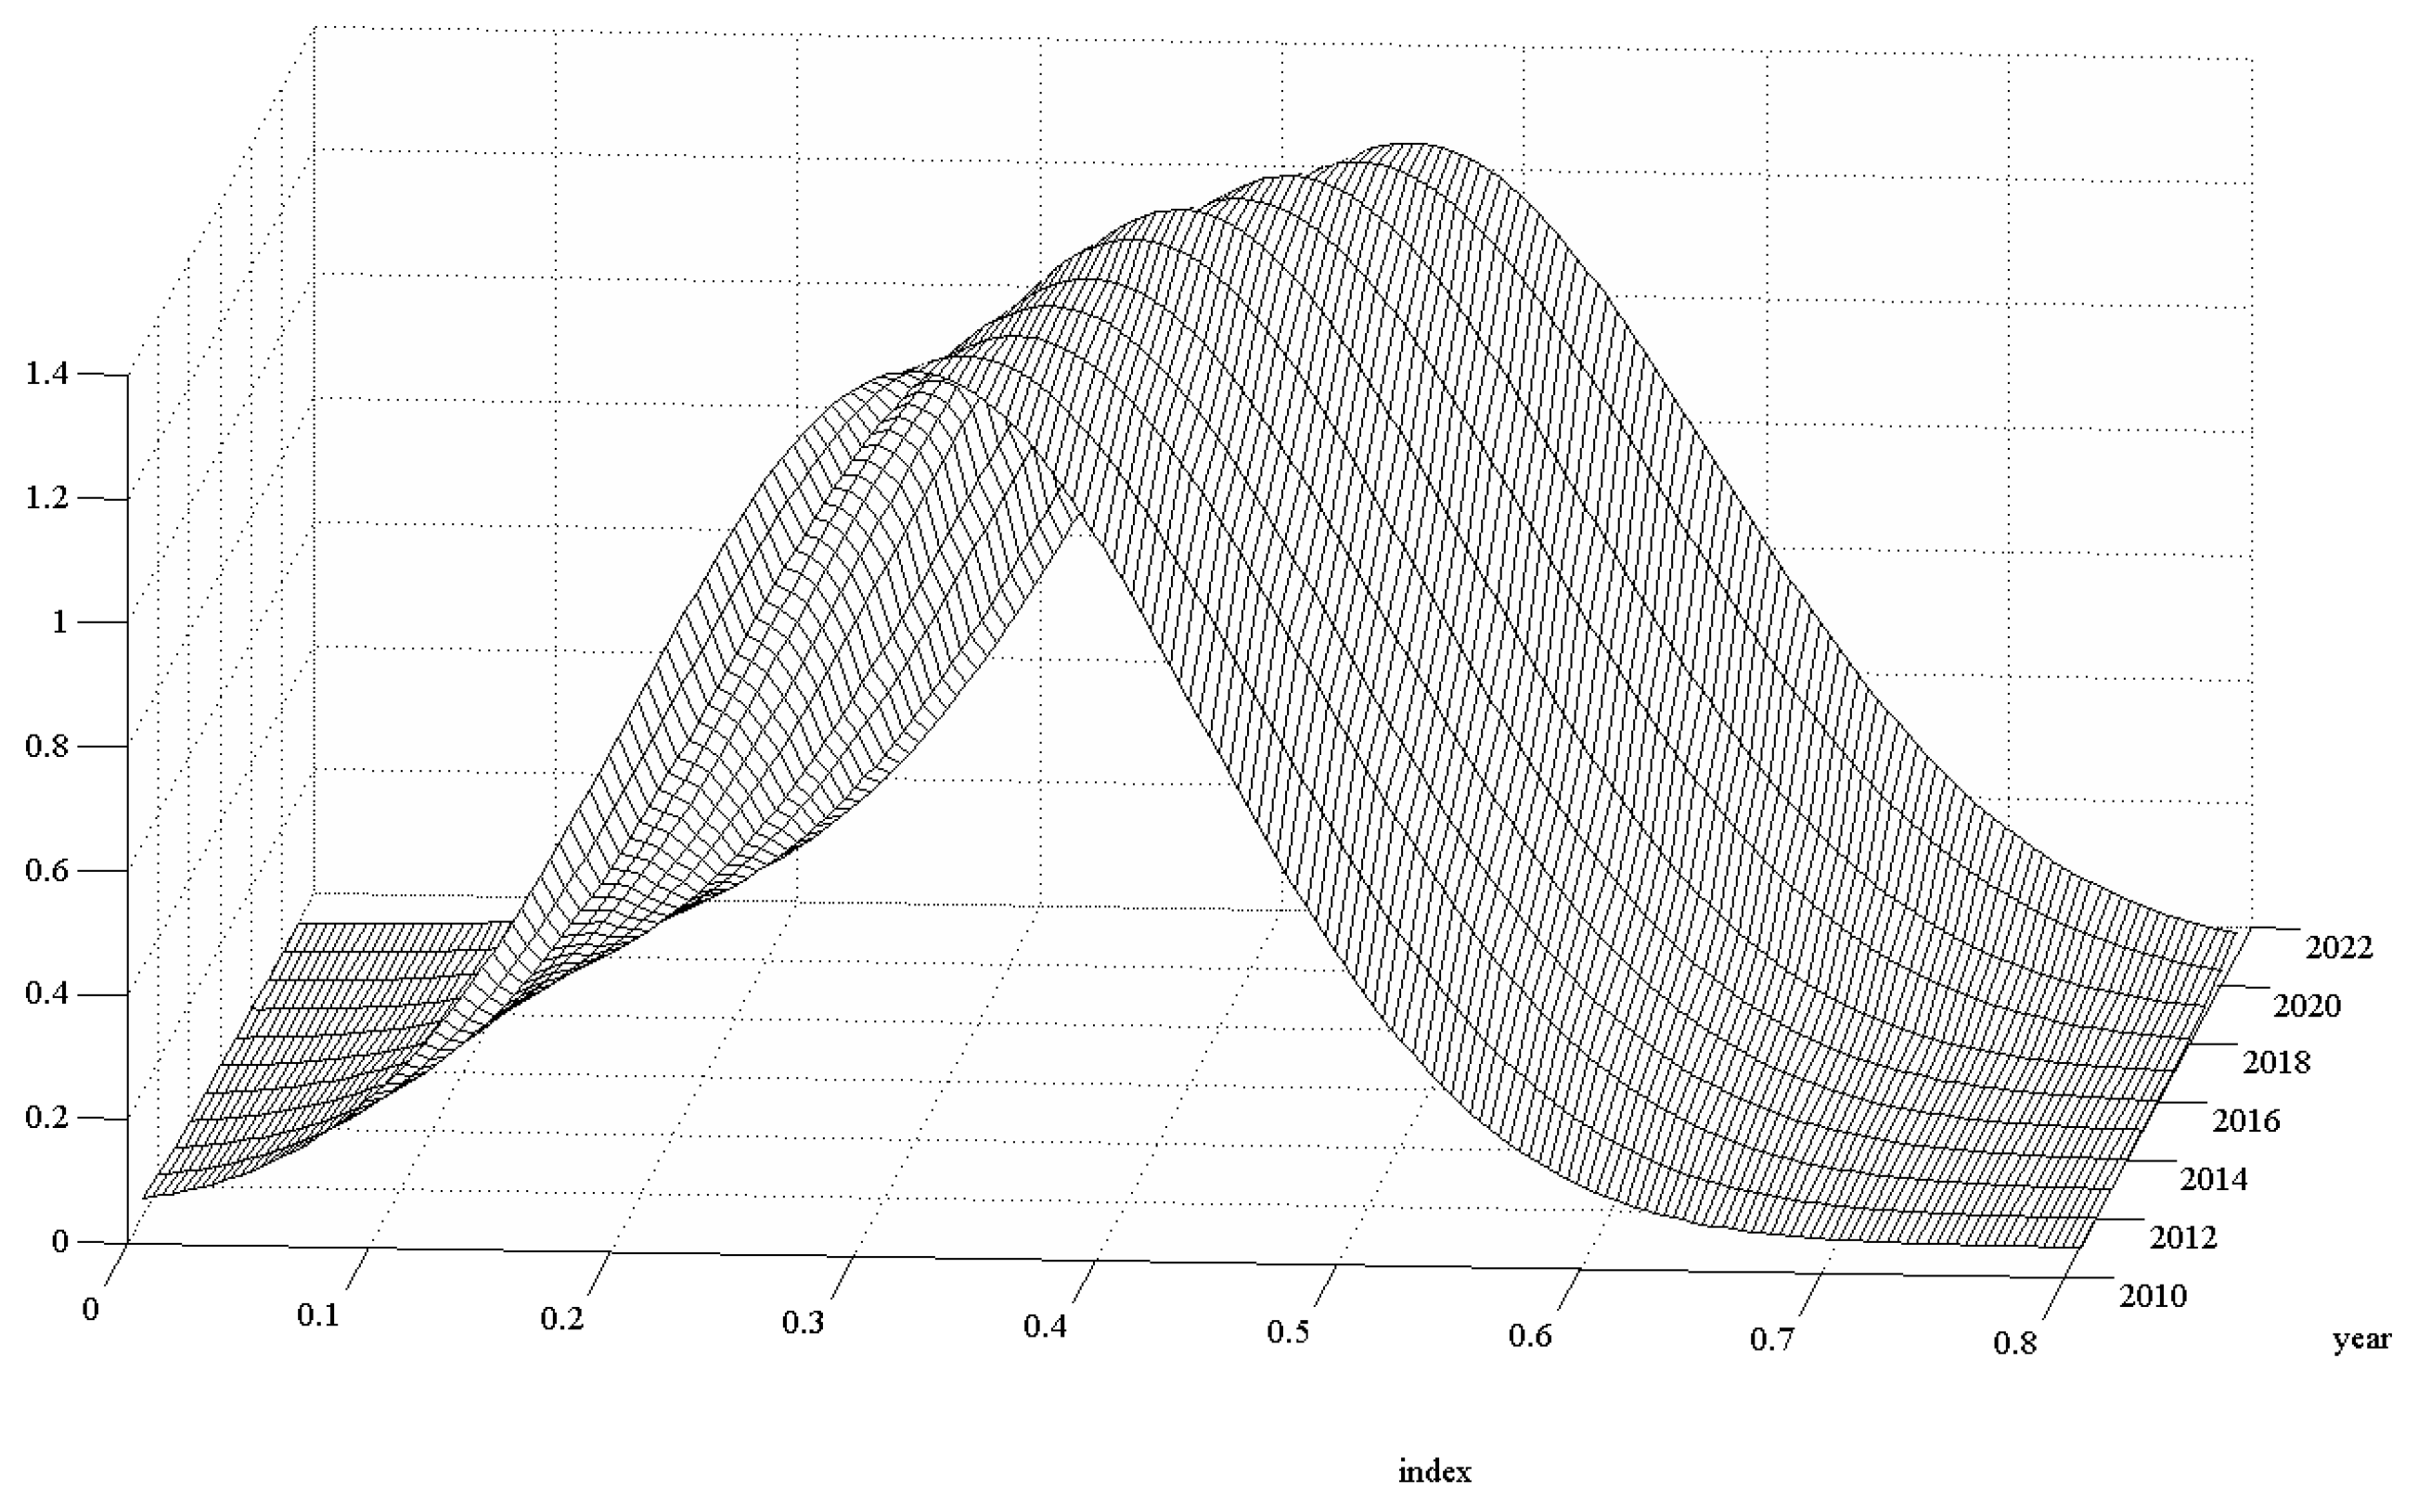
- Analysis based on kernel density curve
5.1.2. Analysis of New Quality Productivity Measurement Results in Different Dimensions
5.2. Benchmark Regression and Robustness Test Results
5.3. Endogeneity Issues and Robustness Tests
5.4. Moderating Effects Test of Environmental Regulation
6. Conclusions and Prospect
6.1. Conclusions
6.2. Prospect
Author Contributions
Funding
Institutional Review Board Statement
Informed Consent Statement
Data Availability Statement
Acknowledgments
Conflicts of Interest
References
- Hu, W.; Wang, D. How does environmental regulation influence China’s carbon productivity? An empirical analysis based on the spatial spillover effect. J. Clean. Prod. 2020, 257, 120484. [Google Scholar] [CrossRef]
- Bai, B.L.; Wang, S.L. Analysis on Socialist Productivity Theory with Chinese Characteristics: The Enrichment and Development of Marxist Political Economy. Shanghai J. Econ. 2017, 3–9+33. (In Chinese) [Google Scholar] [CrossRef]
- Zhou, M.; Guo, J.H.; Wang, W.H. Research on Digital Industry Empowering the Modern Industrial System under the Guidance of New Quality Productivity: Based on the Perspective of Supplementing Nodes, Establishing Links and Fixing Networks. Manag. World 2024, 40, 1–26. (In Chinese) [Google Scholar] [CrossRef]
- Qi, C.S. How to Understand that “New Quality Productivity Itself is Green Productivity”. Economist 2024, 7, 15–23. (In Chinese) [Google Scholar] [CrossRef]
- Gu, H.L. From “Overall Jump in the Level of Social Productivity” to New Quality Productivity--Research on the Theoretical Innovation of Xi Jin-ping's Economic Thought on Social Productivity in the New Era. Economist 2024, 6, 5–15. (In Chinese) [Google Scholar] [CrossRef]
- Zhou, W.; Xu, L.Y. On New Quality Productivity: Connotative Characteristics and Important Focus. Reform 2023, 10, 1–13. (In Chinese) [Google Scholar]
- Ling, X.X.; Xie, H.; Tuo, L.; Jin, Z. The Three Dimensions of New Quality Productivity: Temporal-Spatial, Structural and Technological Dimensions. J. Xinjiang Norm. Univ. (Philos. Soc. Sci.) 2024, 45, 67–76. (In Chinese) [Google Scholar] [CrossRef]
- Shen, K.; Jin, T.; Zhao, Q. To Energize High-quality Development by New-quality Productivity. Nanjing J. Soc. Sci. 2024, 1, 37–42. (In Chinese) [Google Scholar] [CrossRef]
- Xu, Z.; Zhang, J. New Quality Productive Forces to Promote the Transformation and Upgrading of Manufacturing Industry: Value Orientation, Logic Mechanism and Key Measures. J. Soc. Sci. Hunan Norm. Univ. 2024, 53, 104–113. (In Chinese) [Google Scholar] [CrossRef]
- Pan, J.; Tao, H. To understand the three dimensions of the new quality productivity. J. Xi’an Jiaotong Univ. (Soc. Sci.) 2024, 44, 12–19. (In Chinese) [Google Scholar] [CrossRef]
- Ma, L.; Li, X.; Pan, Y. Global Industrial Chain Resilience Research: Theory and Measurement. Systems 2023, 11, 466. [Google Scholar] [CrossRef]
- Guo, C.; Chen, X.; Peng, L. Research on new quality productivity promoting modern industrial system construction. J. Xi’an Jiaotong Univ. (Soc. Sci.) 2024, 44, 1–11. (In Chinese) [Google Scholar] [CrossRef]
- Li, J.A.H. Effects of time-dependent environmental regulations on air pollution: Evidence from the Changsha-Zhuzhou-Xiangtan region, China. World Dev. 2021, 138, 105267. [Google Scholar] [CrossRef]
- Antweiler, W.; Copeland, B.R.; Taylor, M.S. Is Free Trade Good for the Environment? Am. Econ. Rev. 2001, 91, 877–908. [Google Scholar] [CrossRef]
- Lanoie, P.; Patry, M.; Lajeunesse, R. Environmental regulation and productivity: Testing the porter hypothesis. J. Prod. Anal. 2008, 30, 121–128. [Google Scholar] [CrossRef]
- Chakraborty, D.; Mukherjee, S. How do trade and investment flows affect environmental sustainability? Evidence from panel data. Environ. Dev. 2013, 6, 34–47. [Google Scholar] [CrossRef]
- Wu, T.; Wen, L.; Yi, M. Balancing growth targets and environmental regulations: An empirical analysis of dual policy impact on corporate environmental responsibility-insights from China. J. Environ. Manag. 2024, 355, 120500. [Google Scholar] [CrossRef] [PubMed]
- Huiping, W.; Runjie, Z. Effects of environmental regulation on CO2 emissions: An empirical analysis of 282 cities in China. Sustain. Prod. Consum. 2022, 29, 259–272. [Google Scholar] [CrossRef]
- Rubayyat, H.; Khorshed, A. Dynamic relationship among environmental regulation, innovation, CO2 emissions, population, and economic growth in OECD countries: A panel investigation. J. Clean. Prod. 2019, 231, 1100–1109. [Google Scholar] [CrossRef]
- Cai, X.; Zhu, B.; Zhang, H. Can direct environmental regulation promote green technology innovation in heavily polluting industries? Evidence from Chinese listed companies. Sci. Total Environ. 2020, 746, 140810. [Google Scholar] [CrossRef]
- Chen, X.; Qian, W. Effect of marine environmental regulation on the industrial structure adjustment of manufacturing industry: An empirical analysis of China’s eleven coastal provinces. Mar. Policy 2020, 113, 103797. [Google Scholar] [CrossRef]
- Zhang, G.; Zhang, P.; Zhang, Z.G. Impact of Environmental Regulations on Industrial Structure Upgrading: An Empirical Study on Beijing-Tianjin-Hebei Region in China. J. Clean. Prod. 2019, 238, 117848. [Google Scholar] [CrossRef]
- Porter, M.E.; Linde, C.V.D. Toward a New Conception of the Environment-Competitiveness Relationship. J. Econ. Perspect. 1995, 9, 97–118. [Google Scholar] [CrossRef]
- Du, K.; Cheng, Y.; Yao, X. Environmental regulation, green technology innovation, and industrial structure upgrading: The road to the green transformation of Chinese cities. Energ. Econ. 2021, 98, 105247. [Google Scholar] [CrossRef]
- Qiu, S.; Wang, Z.; Geng, S. How do environmental regulation and foreign investment behavior affect green productivity growth in the industrial sector? An empirical test based on Chinese provincial panel data. J. Environ. Manag. 2021, 287, 112282. [Google Scholar] [CrossRef]
- Wang, J. New Productive Forces: A Theoretical Frame and Index System. J. Northwest. Univ. (Philos. Soc. Sci. Ed.) 2024, 54, 35–44. (In Chinese) [Google Scholar] [CrossRef]
- Song, J.; Zhang, J.; Pan, Y. Research on the Impact of ESG Development on New Quality Productive Forces of Enterprises Empirical Evidence from Chinese A-share Listed Companies. Cont. Econ. Manag. 2024, 46, 1–11. (In Chinese) [Google Scholar] [CrossRef]
- Wang, J.; Wang, R. New Quality Productivity: Index Construction and Spatiotemporal Evolution. J. Xi’an Univ. Financ. Econ. 2024, 37, 31–47. (In Chinese) [Google Scholar] [CrossRef]
- Gong, X.; Yan, Y. The Basic Meaning, Realization Mechanism and Practice Path of New Quality Productivity. He Soc. Sci. 2024, 32, 15–22. (In Chinese) [Google Scholar]
- Wenjie, Z.; Ning, X.; Chengyu, L. Impact of digital input on enterprise green productivity: Micro evidence from the Chinese manufacturing industry. J. Clean. Prod. 2023, 414, 137272. [Google Scholar] [CrossRef]
- Huaping, S.; Kofi, B.E.; Kwaku, A.K. Energy efficiency: The role of technological innovation and knowledge spillover. Technol. Forecast. Soc. 2021, 167, 120659. [Google Scholar] [CrossRef]
- Lei, W.; Yangyang, C.; Stephen, T.R. Will researching digital technology really empower green development? Technol. Soc. 2021, 66, 101638. [Google Scholar] [CrossRef]
- Zhang, W.; Xuan, Y. How to improve the regional energy efficiency via intelligence? Empirical analysis based on provincial panel data in China. Bus. Manag. J. 2022, 44, 27–46. (In Chinese) [Google Scholar] [CrossRef]
- Peng, J.S.; Li, J.H.; Zheng, Z.H. The Interactions between Producer Services and Manufacturing: An Empirical Analysis Based on Input-Output Subsystem Model. Appl. Mech. Mater. 2013, 2279, 3041–3045. [Google Scholar] [CrossRef]
- Zhu, X.; Zuo, X.; Li, H. The dual effects of heterogeneous environmental regulation on the technological innovation of Chinese steel enterprises—Based on a high-dimensional fixed effects model. Ecol. Econ. 2021, 188, 107113. [Google Scholar] [CrossRef]
- Chen, Y.P.; Zhuo, Z.; Huang, Z.; Li, W. Environmental regulation and ESG of SMEs in China: Porter hypothesis re-tested. Sci. Total Environ. 2022, 850, 157967. [Google Scholar] [CrossRef] [PubMed]
- Maoliang, B.; Zhenzi, Q.; Beibei, L. Voluntary environmental regulation and firm innovation in China. Econ. Model. 2020, 89, 10–18. [Google Scholar] [CrossRef]
- Lin, B.; Tan, R. Economic Agglomeration and Green Economy Efficiency in China. Econ. Res. J. 2019, 54, 119–132. (In Chinese) [Google Scholar]
- Zhao, T.; Zhang, Z.; Liang, S. Digital Economy, Entrepreneurship, and High-Quality Economic Development: Empirical Evidence from Urban China. Manag. World 2020, 36, 65–76. (In Chinese) [Google Scholar] [CrossRef]
- Guo, F.; Wang, J.; Wang, F.; Kong, T.; Zhang, X.; Cheng, Z. Measuring China’s Digital Financial Inclusion: Index Compilation and Spatial Characteristics. China Econ. Q. 2020, 19, 1401–1418. (In Chinese) [Google Scholar] [CrossRef]
- Hwang, C.L.; Yoon, K.P. Multiple Attribute Decision Making. Methods and Applications. A State-of-the-Art Survey; Springer: Berlin/Heidelberg, Germany, 1981. [Google Scholar] [CrossRef]
- Gan, C.; Zheng, R.; Yu, D. An Empirical Study on the Effects of Industrial Structure on Economic Growth and Fluctuations in China. Econ. Res. J. 2011, 46, 4–16+31. (In Chinese) [Google Scholar]
- Wang, Y.; Wu, M. Has China Entered the Era of Servitization? Judgment Standards and Present Stage of China. Econ. Probl. 2016, 2, 62–68. (In Chinese) [Google Scholar] [CrossRef]
- Jaffe, A.B.; Newell, R.G.; Stavins, R.N. Environmental Policy and Technological Change. Environ. Resour. Econ. 2002, 22, 41–70. [Google Scholar] [CrossRef]
- Liu, Y.; Yang, Y.; Li, H. Digital Economy Development, Industrial Structure Upgrading and Green Total Factor Productivity: Empirical Evidence from China’s Cities. Int. J. Environ. Res. Public Health 2022, 19, 2414. [Google Scholar] [CrossRef] [PubMed]
- Arellano, M.; Bond, S. Some Tests of Specification for Panel Data: Monte Carlo Evidence and an Application to Employment Equations. Rev. Econ. Stud. 1991, 58, 277–297. [Google Scholar] [CrossRef]
- Blundell, R.; Bond, S. Initial conditions and moment restrictions in dynamic panel data model. J. Econom. 1998, 87, 115–143. [Google Scholar] [CrossRef]
- Bond, S.R. Dynamic panel data models: A guide to micro data methods and practice. Port. Econ. J. 2002, 1, 141–162. [Google Scholar] [CrossRef]
- Shuke, F.; Zhuo, M.; Bing, N. Research on the spatial differences of pollution-intensive industry transfer under the environmental regulation in China. Ecol. Indic. 2021, 129, 107921. [Google Scholar] [CrossRef]


| Indicator Dimension | Primary Indicator | Secondary Indicator | Measurement Method | Direction of Effect |
|---|---|---|---|---|
| Innovation driving force | Innovation input | Scientific research fund | Internal expenditure on R&D/GDP | + |
| Scientific manpower | R&D full-time personnel | + | ||
| The optimization of the labor market | Number of students in colleges and universities/total employment population | + | ||
| Innovation output | Patent output | Number of domestic patent applications granted | + | |
| High-tech industry output | High-tech industry new product sales revenue/GDP | + | ||
| Labor productivity | GDP/total employment population | + | ||
| Green driving force | Resource consumption | Energy intensity | Energy consumption/GDP | − |
| Land resources | Population density | − | ||
| Atmospheric resources | SO2 emissions | − | ||
| Green and environmental protection | Greening rate | Forest coverage rate | + | |
| Urban environmental protection | Investment in the urban environment | + | ||
| Greenhouse effect | CO2 emissions | − | ||
| Terminal pollution control | Domestic garbage disposal capacity | Domestic garbage harmless treatment rate | + | |
| Solid waste treatment capacity | Common industrial solid wastes utilized/common industrial solid wastes generated | + | ||
| Wastewater Treatment capacity | Daily treatment capacity of Wastewater | + | ||
| productivity driving force | Traditional infrastructure | Transportation resources | (Highway Miles + Railroad Miles)/Jurisdictional Area | + |
| Educational resources | Number of colleges and universities per 10,000 people | + | ||
| Medical resources | Number of beds in medical and health institutions | + | ||
| Digital economy development | Internet-related output | Total telecommunications business per capita | + | |
| Digital economy employment level | Number of employees in the information transmission, software, and information technology services industry/employed population in urban organizations | + | ||
| Internet Penetration Rate | The number of Internet users per 100 people | + | ||
| Digital Inclusive Finance | Digital Inclusive Finance index | + |
| (1) | (2) | (3) | (4) | (5) | (6) | (7) | (8) |
|---|---|---|---|---|---|---|---|
| Types | Variables | Indicators | Obs | Mean | SD | Min | Max |
| Explained variables | rat | Rationalization of industries | 330 | 0.1524 | 0.0937 | 0.0082 | 0.4515 |
| upg | Ppgrading of industries | 330 | 1.3415 | 0.7320 | 0.5271 | 5.2440 | |
| Core explanatory variables | nqp | New quality productivity | 330 | 0.3883 | 0.0775 | 0.2288 | 0.6418 |
| ino | Innovation driving force | 330 | 0.2406 | 0.1254 | 0.0275 | 0.6757 | |
| gre | Green Driving Force | 330 | 0.4776 | 0.0814 | 0.2977 | 0.7161 | |
| pro | Production Driving Force | 330 | 0.3359 | 0.0993 | 0.1133 | 0.6121 | |
| Moderating variable | evi | Environmental Regulation | 330 | 11.3379 | 12.0869 | 0.0860 | 110.3389 |
| Control variables | cos | Consumption level | 330 | 0.3801 | 0.0683 | 0.2220 | 0.5384 |
| fdi | Foreign investment | 330 | 0.8381 | 0.8092 | 0.0003 | 3.5760 | |
| tra | Foreign trade | 330 | 0.2653 | 0.2908 | 0.0076 | 1.5482 | |
| gov | Government intervention | 330 | 0.2487 | 0.1025 | 0.1066 | 0.6430 | |
| tax | Tax burden level | 330 | 0.0819 | 0.0293 | 0.0443 | 0.1997 |
| Province | District | 2011 | 2012 | 2013 | 2014 | 2015 | 2016 | 2017 | 2018 | 2019 | 2020 | 2021 |
|---|---|---|---|---|---|---|---|---|---|---|---|---|
| Beijing | 1 | 0.4444 | 0.4734 | 0.4946 | 0.5188 | 0.5202 | 0.5322 | 0.5375 | 0.5503 | 0.5648 | 0.5556 | 0.5691 |
| Tianjin | 1 | 0.3986 | 0.4093 | 0.4180 | 0.4232 | 0.4308 | 0.4326 | 0.4336 | 0.4416 | 0.4498 | 0.4801 | 0.4988 |
| Hebei | 1 | 0.2549 | 0.2585 | 0.2683 | 0.2781 | 0.2951 | 0.3209 | 0.3427 | 0.3515 | 0.3732 | 0.4070 | 0.4226 |
| Shanxi | 2 | 0.2288 | 0.2566 | 0.2579 | 0.2629 | 0.2650 | 0.2830 | 0.3032 | 0.3210 | 0.3352 | 0.3520 | 0.3640 |
| Inner Mongolia | 3 | 0.2671 | 0.2722 | 0.2926 | 0.2989 | 0.3021 | 0.3140 | 0.3257 | 0.3272 | 0.3360 | 0.3507 | 0.3671 |
| Liaoning | 4 | 0.3145 | 0.3329 | 0.3422 | 0.3408 | 0.3422 | 0.3694 | 0.3813 | 0.3967 | 0.4033 | 0.4235 | 0.4448 |
| Jilin | 4 | 0.3079 | 0.3199 | 0.3416 | 0.3452 | 0.3477 | 0.3651 | 0.3735 | 0.3930 | 0.4089 | 0.4234 | 0.4378 |
| Heilongjiang | 4 | 0.2977 | 0.3159 | 0.3334 | 0.3347 | 0.3369 | 0.3499 | 0.3476 | 0.3648 | 0.3770 | 0.3924 | 0.4047 |
| Shanghai | 1 | 0.3857 | 0.3986 | 0.4140 | 0.4167 | 0.4249 | 0.4248 | 0.4400 | 0.4640 | 0.4789 | 0.4984 | 0.5115 |
| Jiangsu | 1 | 0.4024 | 0.4282 | 0.4501 | 0.4583 | 0.4657 | 0.4690 | 0.4806 | 0.5137 | 0.5268 | 0.5684 | 0.5825 |
| Zhejiang | 1 | 0.4079 | 0.4358 | 0.4549 | 0.4640 | 0.4798 | 0.4867 | 0.4986 | 0.5310 | 0.5498 | 0.5809 | 0.5933 |
| Anhui | 2 | 0.3357 | 0.3524 | 0.3697 | 0.3755 | 0.3898 | 0.3938 | 0.4130 | 0.4275 | 0.4405 | 0.4755 | 0.4960 |
| Fujian | 1 | 0.3695 | 0.3960 | 0.4092 | 0.4125 | 0.4161 | 0.4201 | 0.4298 | 0.4524 | 0.4600 | 0.4802 | 0.4991 |
| Jiangxi | 2 | 0.3225 | 0.3372 | 0.3421 | 0.3508 | 0.3599 | 0.3629 | 0.3826 | 0.4101 | 0.4397 | 0.4517 | 0.4748 |
| Shandong | 1 | 0.3516 | 0.3715 | 0.3969 | 0.4028 | 0.4101 | 0.4257 | 0.4480 | 0.4649 | 0.4671 | 0.4991 | 0.5218 |
| Henan | 2 | 0.2672 | 0.2878 | 0.3101 | 0.3201 | 0.3357 | 0.3564 | 0.3965 | 0.4151 | 0.4343 | 0.4706 | 0.4960 |
| Hubei | 2 | 0.3468 | 0.3598 | 0.3745 | 0.3890 | 0.3938 | 0.4189 | 0.4255 | 0.4471 | 0.4679 | 0.4819 | 0.5010 |
| Hunan | 2 | 0.3271 | 0.3415 | 0.3545 | 0.3651 | 0.3785 | 0.3874 | 0.4052 | 0.4293 | 0.4455 | 0.4715 | 0.4839 |
| Guangdong | 1 | 0.4061 | 0.4235 | 0.4427 | 0.4566 | 0.4736 | 0.4833 | 0.5078 | 0.5572 | 0.5811 | 0.6211 | 0.6418 |
| Guangxi | 3 | 0.3288 | 0.3427 | 0.3559 | 0.3600 | 0.3678 | 0.3731 | 0.3828 | 0.3970 | 0.4104 | 0.4350 | 0.4380 |
| Hainan | 1 | 0.3342 | 0.3537 | 0.3647 | 0.3641 | 0.3744 | 0.3779 | 0.3794 | 0.3930 | 0.4093 | 0.4227 | 0.4352 |
| Chongqing | 3 | 0.3407 | 0.3529 | 0.3730 | 0.3826 | 0.3974 | 0.4049 | 0.4173 | 0.4380 | 0.4534 | 0.4785 | 0.4937 |
| Sichuan | 3 | 0.3007 | 0.3180 | 0.3357 | 0.3493 | 0.3768 | 0.3868 | 0.4010 | 0.4339 | 0.4480 | 0.4732 | 0.4956 |
| Guizhou | 3 | 0.2420 | 0.2617 | 0.2746 | 0.3087 | 0.3243 | 0.3419 | 0.3545 | 0.3802 | 0.4015 | 0.4279 | 0.4437 |
| Yunnan | 3 | 0.2879 | 0.2962 | 0.3254 | 0.3338 | 0.3460 | 0.3524 | 0.3673 | 0.3862 | 0.4057 | 0.4233 | 0.4386 |
| Shaanxi | 3 | 0.2992 | 0.3165 | 0.3341 | 0.3460 | 0.3648 | 0.3852 | 0.3814 | 0.3945 | 0.4016 | 0.4305 | 0.4244 |
| Gansu | 3 | 0.2516 | 0.2611 | 0.2774 | 0.2828 | 0.2903 | 0.3074 | 0.3171 | 0.3379 | 0.3667 | 0.3719 | 0.3814 |
| Qinghai | 3 | 0.2742 | 0.2779 | 0.2810 | 0.2927 | 0.2933 | 0.3047 | 0.3165 | 0.3338 | 0.3461 | 0.3524 | 0.3677 |
| Ningxia | 3 | 0.2873 | 0.2996 | 0.3114 | 0.3257 | 0.3194 | 0.3209 | 0.3294 | 0.3457 | 0.3371 | 0.3555 | 0.3713 |
| Xinjiang | 3 | 0.2372 | 0.2455 | 0.2507 | 0.2524 | 0.2779 | 0.2867 | 0.3037 | 0.3165 | 0.3178 | 0.3406 | 0.3494 |
| Province | New Quality Productivity Index | Ranking | Innovation Driving Force Index | Ranking | Green Driving Force Index | Ranking | Production Driving Force Score | Ranking |
|---|---|---|---|---|---|---|---|---|
| Beijign | 0.5237 | 1 | 0.3726 | 5 | 0.6062 | 2 | 0.5203 | 1 |
| Tianjin | 0.4379 | 6 | 0.4242 | 4 | 0.4840 | 15 | 0.3752 | 8 |
| Hebei | 0.3248 | 25 | 0.1864 | 19 | 0.3838 | 27 | 0.3281 | 15 |
| Shanxi | 0.2936 | 29 | 0.1853 | 20 | 0.3384 | 30 | 0.3029 | 20 |
| Inner Mongolia | 0.3140 | 26 | 0.1642 | 23 | 0.3650 | 28 | 0.3307 | 14 |
| Liaoning | 0.3719 | 17 | 0.2491 | 12 | 0.4429 | 20 | 0.3544 | 12 |
| Jilin | 0.3694 | 20 | 0.1994 | 17 | 0.4792 | 16 | 0.2935 | 24 |
| Heilongjiang | 0.3505 | 22 | 0.1950 | 18 | 0.4332 | 22 | 0.3213 | 17 |
| Shanghai | 0.4416 | 5 | 0.3687 | 6 | 0.5082 | 11 | 0.3847 | 5 |
| Jiangsu | 0.4860 | 4 | 0.4965 | 1 | 0.5473 | 5 | 0.3767 | 7 |
| Zhejiang | 0.4984 | 3 | 0.4508 | 3 | 0.6169 | 1 | 0.3580 | 11 |
| Anhui | 0.4063 | 11 | 0.2400 | 13 | 0.5314 | 8 | 0.3189 | 18 |
| Fujian | 0.4314 | 8 | 0.2777 | 8 | 0.5570 | 4 | 0.3148 | 19 |
| Jiangxi | 0.3849 | 14 | 0.2247 | 14 | 0.4951 | 13 | 0.2943 | 23 |
| Shandong | 0.4327 | 7 | 0.3463 | 7 | 0.4935 | 14 | 0.4016 | 4 |
| Henan | 0.3718 | 18 | 0.2191 | 15 | 0.4332 | 23 | 0.3815 | 6 |
| Hubei | 0.4188 | 9 | 0.2530 | 10 | 0.5261 | 9 | 0.3750 | 9 |
| Hunan | 0.3990 | 12 | 0.2141 | 16 | 0.5063 | 12 | 0.3595 | 10 |
| Guangdong | 0.5086 | 2 | 0.4767 | 2 | 0.6012 | 3 | 0.4063 | 3 |
| Guangxi | 0.3810 | 16 | 0.1316 | 26 | 0.5352 | 6 | 0.2580 | 28 |
| Hainan | 0.3826 | 15 | 0.1379 | 25 | 0.5247 | 10 | 0.2497 | 29 |
| Chongqing | 0.4120 | 10 | 0.2634 | 9 | 0.5336 | 7 | 0.2977 | 21 |
| Sichuan | 0.3926 | 13 | 0.1765 | 21 | 0.4679 | 18 | 0.4177 | 2 |
| Guizhou | 0.3419 | 23 | 0.1274 | 27 | 0.4496 | 19 | 0.2921 | 25 |
| Yunnan | 0.3603 | 21 | 0.0877 | 29 | 0.4727 | 17 | 0.3270 | 16 |
| Shaanxi | 0.3707 | 19 | 0.2519 | 11 | 0.4384 | 21 | 0.3474 | 13 |
| Gansu | 0.3132 | 27 | 0.1484 | 24 | 0.3980 | 26 | 0.2623 | 27 |
| Qinghai | 0.3128 | 28 | 0.0816 | 30 | 0.4046 | 24 | 0.2485 | 30 |
| Ningxia | 0.3276 | 24 | 0.1696 | 22 | 0.4012 | 25 | 0.2814 | 26 |
| Xinjiang | 0.2889 | 30 | 0.1010 | 28 | 0.3523 | 29 | 0.2961 | 22 |
| (1) | (2) | (3) | (4) | |
|---|---|---|---|---|
| Rat | Ino | Gre | Pro | |
| nqp | −0.6228 *** | |||
| (0.0884) | ||||
| ino | −0.4507 *** | |||
| (0.0706) | ||||
| gre | −0.7016 *** | |||
| (0.0929) | ||||
| pro | −0.4172 *** | |||
| (0.0518) | ||||
| cos | −0.2001 ** | −0.2640 ** | −0.1745 ** | −0.1560 * |
| (0.0868) | (0.0979) | (0.0803) | (0.0936) | |
| fdi | −0.0031 | −0.0012 | −0.0096 | −0.0073 |
| (0.0079) | (0.0085) | (0.0077) | (0.0071) | |
| tra | −0.0830 *** | −0.0724 *** | −0.0888 *** | −0.0882 *** |
| (0.0272) | (0.0241) | (0.0268) | (0.0331) | |
| gov | −0.3002 | −0.4197 * | −0.2931 * | −0.1048 |
| (0.2139) | (0.2130) | (0.1730) | (0.1527) | |
| tax | 0.7976 ** | 1.0145 ** | 0.9029 ** | 0.2676 |
| (0.3363) | (0.3760) | (0.3740) | (0.2652) | |
| evi | 0.0003 | 0.0004 | 0.0008** | 0.0002 |
| (0.0003) | (0.0004) | (0.0003) | (0.0003) | |
| _cons | 0.5009 *** | 0.3984 *** | 0.5756 *** | 0.3836 *** |
| (0.0530) | (0.0452) | (0.0614) | (0.0389) | |
| Hausman | 14.35 | 14.70 | −148.48 | 6.23 |
| p-Value | 0.0259 | 0.0401 | - | 0.5126 |
| R2 | 0.650 | 0.580 | 0.586 | 0.665 |
| N | 330 | 330 | 330 | 330 |
| (1) | (2) | (3) | (4) | |
|---|---|---|---|---|
| Upg | Ino | Gre | Pro | |
| nqp | 2.5179 *** | |||
| (0.4119) | ||||
| ino | 1.4677 *** | |||
| (0.4265) | ||||
| gre | 2.5862 *** | |||
| (0.4729) | ||||
| pro | 1.7481 *** | |||
| (0.2264) | ||||
| cos | 0.4155 | 0.7269 ** | 0.4388 | 0.2349 |
| (0.3237) | (0.3295) | (0.3400) | (0.3142) | |
| fdi | −0.0066 | −0.0027 | 0.0080 | −0.0029 |
| (0.0493) | (0.0674) | (0.0546) | (0.0464) | |
| tra | −0.8545 *** | −0.9306 *** | −0.8993 *** | −0.8746 *** |
| (0.2848) | (0.3059) | (0.2951) | (0.2339) | |
| gov | 3.7884 *** | 4.4497 *** | 4.3143 *** | 3.1945 *** |
| (0.8260) | (0.786) | (0.8920) | (0.7256) | |
| tax | −5.8453 ** | −7.5855 *** | −7.8955 *** | −4.0714 ** |
| (2.1639) | (2.3196) | (2.1473) | (1.8121) | |
| evi | 0.0007 | −0.0001 | −0.0008 | 0.0018 ** |
| (0.0009) | (0.0014) | (0.0011) | (0.0008) | |
| _cons | −0.0336 | 0.4769 *** | −0.2454 | 0.4177 *** |
| (0.1572) | (0.1430) | (0.2065) | (0.1196) | |
| Hausman | 294.44 | 178.05 | 459.34 | 3428.56 |
| p-Value | 0.0000 | 0.0000 | 0.0000 | 0.0000 |
| R2 | 0.740 | 0.669 | 0.705 | 0.776 |
| N | 330 | 330 | 330 | 330 |
| (1) | (2) | (3) | (4) | |
|---|---|---|---|---|
| Sys-GMM | Diff-GMM | |||
| Rat | Upg | Rat | Upg | |
| L.rat | 0.7200 *** | 0.7552 *** | ||
| (0.0204) | (0.0187) | |||
| L.upg | 0.9922 *** | 0.6629 *** | ||
| (0.0399) | (0.0390) | |||
| nqp | −0.1121 *** | 0.7525 *** | −0.0439 *** | 0.3572 ** |
| (0.0187) | (0.1096) | (0.0161) | (0.1772) | |
| cos | −0.0121 | 0.4463 *** | −0.0130 * | 0.2589 *** |
| (0.0087) | (0.0779) | (0.0067) | (0.0392) | |
| fdi | −0.0120 *** | −0.0889 *** | −0.0051 *** | −0.0206 ** |
| (0.0036) | (0.0212) | (0.0014) | (0.0084) | |
| tra | −0.0740 *** | −0.1777 *** | −0.0001 | −0.6128 *** |
| (0.0194) | (0.0393) | (0.0077) | (0.1028) | |
| gov | −0.3254 *** | 1.3933 *** | −0.3838 *** | 2.2454 *** |
| (0.0288) | (0.3295) | (0.0234) | (0.1483) | |
| tax | 0.3911 *** | −0.3031 | 0.7349 *** | −2.6063 *** |
| (0.1013) | (0.5166) | (0.0933) | (0.4328) | |
| evi | −0.0001 *** | −0.0001 | −0.0001 *** | 0.0005 |
| (0.0000) | (0.0004) | (0.0000) | (0.0003) | |
| _cons | 0.1501 *** | −0.2537 *** | 0.0862 *** | 0.0341 |
| (0.0102) | (0.0974) | (0.0100) | (0.0636) | |
| AR(1)-P | 0.0135 | 0.0431 | 0.0176 | 0.1144 |
| AR(2)-P | 0.0564 | 0.1158 | 0.1069 | 0.2759 |
| Sargan | 28.0614 | 26.0649 | 26.9213 | 23.6456 |
| p-Value | 0.7911 | 0.9807 | 0.3598 | 0.8570 |
| N | 263 | 263 | 223 | 223 |
| (1) | (2) | (3) | (4) | (5) | (6) | |
|---|---|---|---|---|---|---|
| Benchmark Regression | Sys-GMM | Diff-GMM | ||||
| Rat | Upg | Rat | Upg | Rat | Upg | |
| L.rat | 0.7125 *** | 0.7287 *** | ||||
| (0.0205) | (0.0211) | |||||
| L.upg | 0.9823 *** | 0.6250 *** | ||||
| (0.0379) | (0.0360) | |||||
| nqp | −0.5742 *** | 2.6335 *** | −0.1051 *** | 0.7579 *** | −0.0550 *** | 0.4162 ** |
| (0.0767) | (0.4859) | (0.0300) | (0.1588) | (0.0186) | (0.1982) | |
| evi | 0.0065 *** | 0.0090 | 0.0015 *** | −0.0131 *** | 0.0013 *** | −0.0049 ** |
| (0.0020) | (0.0095) | (0.0003) | (0.0026) | (0.0003) | (0.0025) | |
| evnqp | −0.0194 *** | −0.0260 | −0.0051 *** | 0.0380 *** | −0.0045 *** | 0.0167 ** |
| (0.0062) | (0.0301) | (0.0009) | (0.0084) | (0.0009) | (0.0074) | |
| cos | −0.1557 ** | 0.4530 | 0.0187 ** | 0.3827 *** | −0.0108 | 0.3762 *** |
| (0.0776) | (0.3144) | (0.0087) | (0.0917) | (0.0097) | (0.0643) | |
| fdi | −0.0026 | −0.0047 | −0.0111** | −0.0546** | −0.0030 | −0.0231 |
| (0.0083) | (0.0468) | (0.0053) | (0.0265) | (0.0018) | (0.0150) | |
| tra | −0.0943 *** | −0.8557 *** | −0.0806 *** | −0.1629 *** | −0.0001 | −0.5476 *** |
| (0.0276) | (0.2899) | (0.0203) | (0.0560) | (0.0084) | (0.1183) | |
| gov | −0.1855 | 3.8440 *** | −0.3345 *** | 1.4725 *** | −0.3579 *** | 2.3434 *** |
| (0.1589) | (0.8234) | (0.0402) | (0.3534) | (0.0327) | (0.1488) | |
| tax | 0.7018 ** | −5.6357 ** | 0.5115 *** | 0.1629 | 0.7793 *** | −3.3264 *** |
| (0.2858) | (2.2077) | (0.0860) | (0.7969) | (0.0980) | (0.4858) | |
| _cons | 0.4536 *** | −0.11657 | 0.1423 *** | −0.2424 * | 0.0849 *** | 0.0267 |
| (0.0444) | (0.1971) | (0.0167) | (0.1279) | (0.0155) | (0.1119) | |
| Hausman | 12.34 | 316.71 | ||||
| p-Value | 0.0900 | 0.0000 | ||||
| R2 | 0.683 | 0.742 | ||||
| AR(1)-P | 0.0115 | 0.0461 | 0.0157 | 0.1737 | ||
| AR(2)-P | 0.0760 | 0.1498 | 0.1446 | 0.2314 | ||
| Sargan | 28.0984 | 23.4695 | 27.5126 | 22.5209 | ||
| p-Value | 0.9615 | 0.9933 | 0.3308 | 0.6055 | ||
| N | 330 | 330 | 263 | 263 | 223 | 223 |
Disclaimer/Publisher’s Note: The statements, opinions and data contained in all publications are solely those of the individual author(s) and contributor(s) and not of MDPI and/or the editor(s). MDPI and/or the editor(s) disclaim responsibility for any injury to people or property resulting from any ideas, methods, instructions or products referred to in the content. |
© 2024 by the authors. Licensee MDPI, Basel, Switzerland. This article is an open access article distributed under the terms and conditions of the Creative Commons Attribution (CC BY) license (https://creativecommons.org/licenses/by/4.0/).
Share and Cite
Shao, C.; Dong, H.; Gao, Y. New Quality Productivity and Industrial Structure in China: The Moderating Effect of Environmental Regulation. Sustainability 2024, 16, 6796. https://doi.org/10.3390/su16166796
Shao C, Dong H, Gao Y. New Quality Productivity and Industrial Structure in China: The Moderating Effect of Environmental Regulation. Sustainability. 2024; 16(16):6796. https://doi.org/10.3390/su16166796
Chicago/Turabian StyleShao, Changhua, Han Dong, and Yuan Gao. 2024. "New Quality Productivity and Industrial Structure in China: The Moderating Effect of Environmental Regulation" Sustainability 16, no. 16: 6796. https://doi.org/10.3390/su16166796
APA StyleShao, C., Dong, H., & Gao, Y. (2024). New Quality Productivity and Industrial Structure in China: The Moderating Effect of Environmental Regulation. Sustainability, 16(16), 6796. https://doi.org/10.3390/su16166796