Article

The Geochemical Characteristics and Genesis Mechanisms of the Zaozigou Geothermal Field

Faculty of Land Resources Engineering, Kunming University of Science and Technology, Kunming 650093, China
*
Authors to whom correspondence should be addressed.
Sustainability 2024, 16(16), 6790; https://doi.org/10.3390/su16166790
Submission received: 28 June 2024 / Revised: 26 July 2024 / Accepted: 6 August 2024 / Published: 8 August 2024

Abstract

:
Geothermal resources have become one of the crucial clean energy sources worldwide. The Gansu Province is renowned in China for its abundant geothermal resources. The Zaozigou area features prominent geothermal outcrops, indicating untapped geothermal potential. However, the level of geothermal resource development in this region remains low, coupled with a lack of comprehensive research on its hydrochemical characteristics and formation mechanisms. This study conducted an in-depth hydrochemical analysis of six geothermal water groups and two surface water groups within the collection area, along with collecting hydrogen and oxygen isotope data from nine geothermal water sources. Piper trigram and Na-K-Mg diagram were utilized to investigate the origin of the subsurface hot water. Various analyses, including characteristic coefficients, correlation analysis, hydrochemical types, recharge elevation, reservoir temperature, and circulation depth, were conducted on the geothermal water. The study proposes a preliminary conceptual model of the Zaozigou geothermal system, providing a theoretical basis for the rational utilization of geothermal resources and promoting sustainable resources.

1. Introduction

Geothermal energy is a new type of renewable energy that is relatively clean, has large reserves, and is widely distributed. China is rich in geothermal resources and has broad utilization prospects. The development and utilization potential of medium–low-temperature geothermal resources are significant [1]. The rational use of these clean energy sources can promote sustainable resource utilization. The origin and hydrochemical characteristics of geothermal water have elicited extensive discussion. Zhao et al. conducted an analysis of the hydrochemical characteristics, recharge sources, and circulation depth of geothermal water in the Xiaoyangkou geothermal field using hydrogeochemistry and isotopic methods, ultimately elucidating the formation mechanism of the geothermal system [2]; Xing et al. conducted an analysis of the origin of subsurface geothermal water in the Gaoyang geothermal field using the Piper trilinear diagram and Na-K-Mg software. They determined the predominant hydrochemical type in the Gaoyang geothermal field to be Na-HCO3·Cl and proposed that the upward movement of geothermal water involves leaching and cation exchange adsorption processes, resulting in the formation of high total dissolved solids (TDS) geothermal water [3]. Procesi et al. evaluated the geothermal potential of the Tete region in Mozambique using geochemical analysis of hot springs, confirming an atmospheric origin, ruling out magmatic association, and proposing a viable circulation model. With reservoir temperatures of 90–120 °C, low salinity, and the absence of corrosive elements, the study emphasized the applicability for both direct and indirect utilization, offering valuable insights for sustainable energy development [4]. Apollaro et al. utilized petrology, geochemistry, and reaction path modeling to analyze the alteration of volcanic rocks at an active hydrothermal site on Lipari Island. They identified two types of altered rocks enriched in either silicate or sulfate, validating a model attributing the alteration to acid solutions resulting from steam condensation. These findings underscore the role of hydrothermal steam condensation in rock alteration rather than magmatic fluids [5]. These research findings provide a solid foundation for the present study.
Gansu has conducted extensive geothermal surveys and comprehensive research on geothermal resources. The outcrop conditions and research foundation of geothermal springs are favorable in the region. Previous studies in the West Qinling area have focused on geothermal field control, resource types, distribution characteristics, development status, and prospects of geothermal resources [6,7]. Furthermore, an in-depth analysis of the geothermal geological conditions in the Lanzhou–Minhe fault basin was carried out, along with the proposal of a geothermal reservoir conceptual model [8,9,10]. Detailed analysis and demonstration were conducted on the isotope content characteristics of various water bodies environments, identifying the supply source of deep groundwater in the Hexi Corridor and Qilian Mountains and explaining the sudden changes in deep ground temperature [11,12,13]. Existing geothermal survey data indicates that the heat source in the region is generated by the decay of radioactive elements in crustal rocks [14]. However, there is a lack of systematic research on the hydrochemical characteristics and formation mechanisms in the study area, which hinders the development and utilization of geothermal resources.
Currently, researchers have achieved fruitful results in the geothermal fields of Gansu Province. However, there has been limited research on the Zaozigou geothermal field both domestically and internationally, with some studies confined to small-scale research. There is still not a comprehensive understanding of the geothermal resources in this geothermal field. Particularly, there is no scientific explanation yet for the circulation mechanisms and chemical origins of geothermal fluids. The development of the Zaozigou geothermal field lacks comprehensive guidance. This study aims to conduct a thorough analysis and exploration of the chemical origins of geothermal fluids in the Zaozigou geothermal field using hydrogeochemistry to provide an initial assessment of the overall situation of the Zaozigou geothermal field. The research findings will offer theoretical support for the effective utilization and development of deep geothermal resources in collaborative areas and establish a scientific foundation for pertinent urban construction policies.

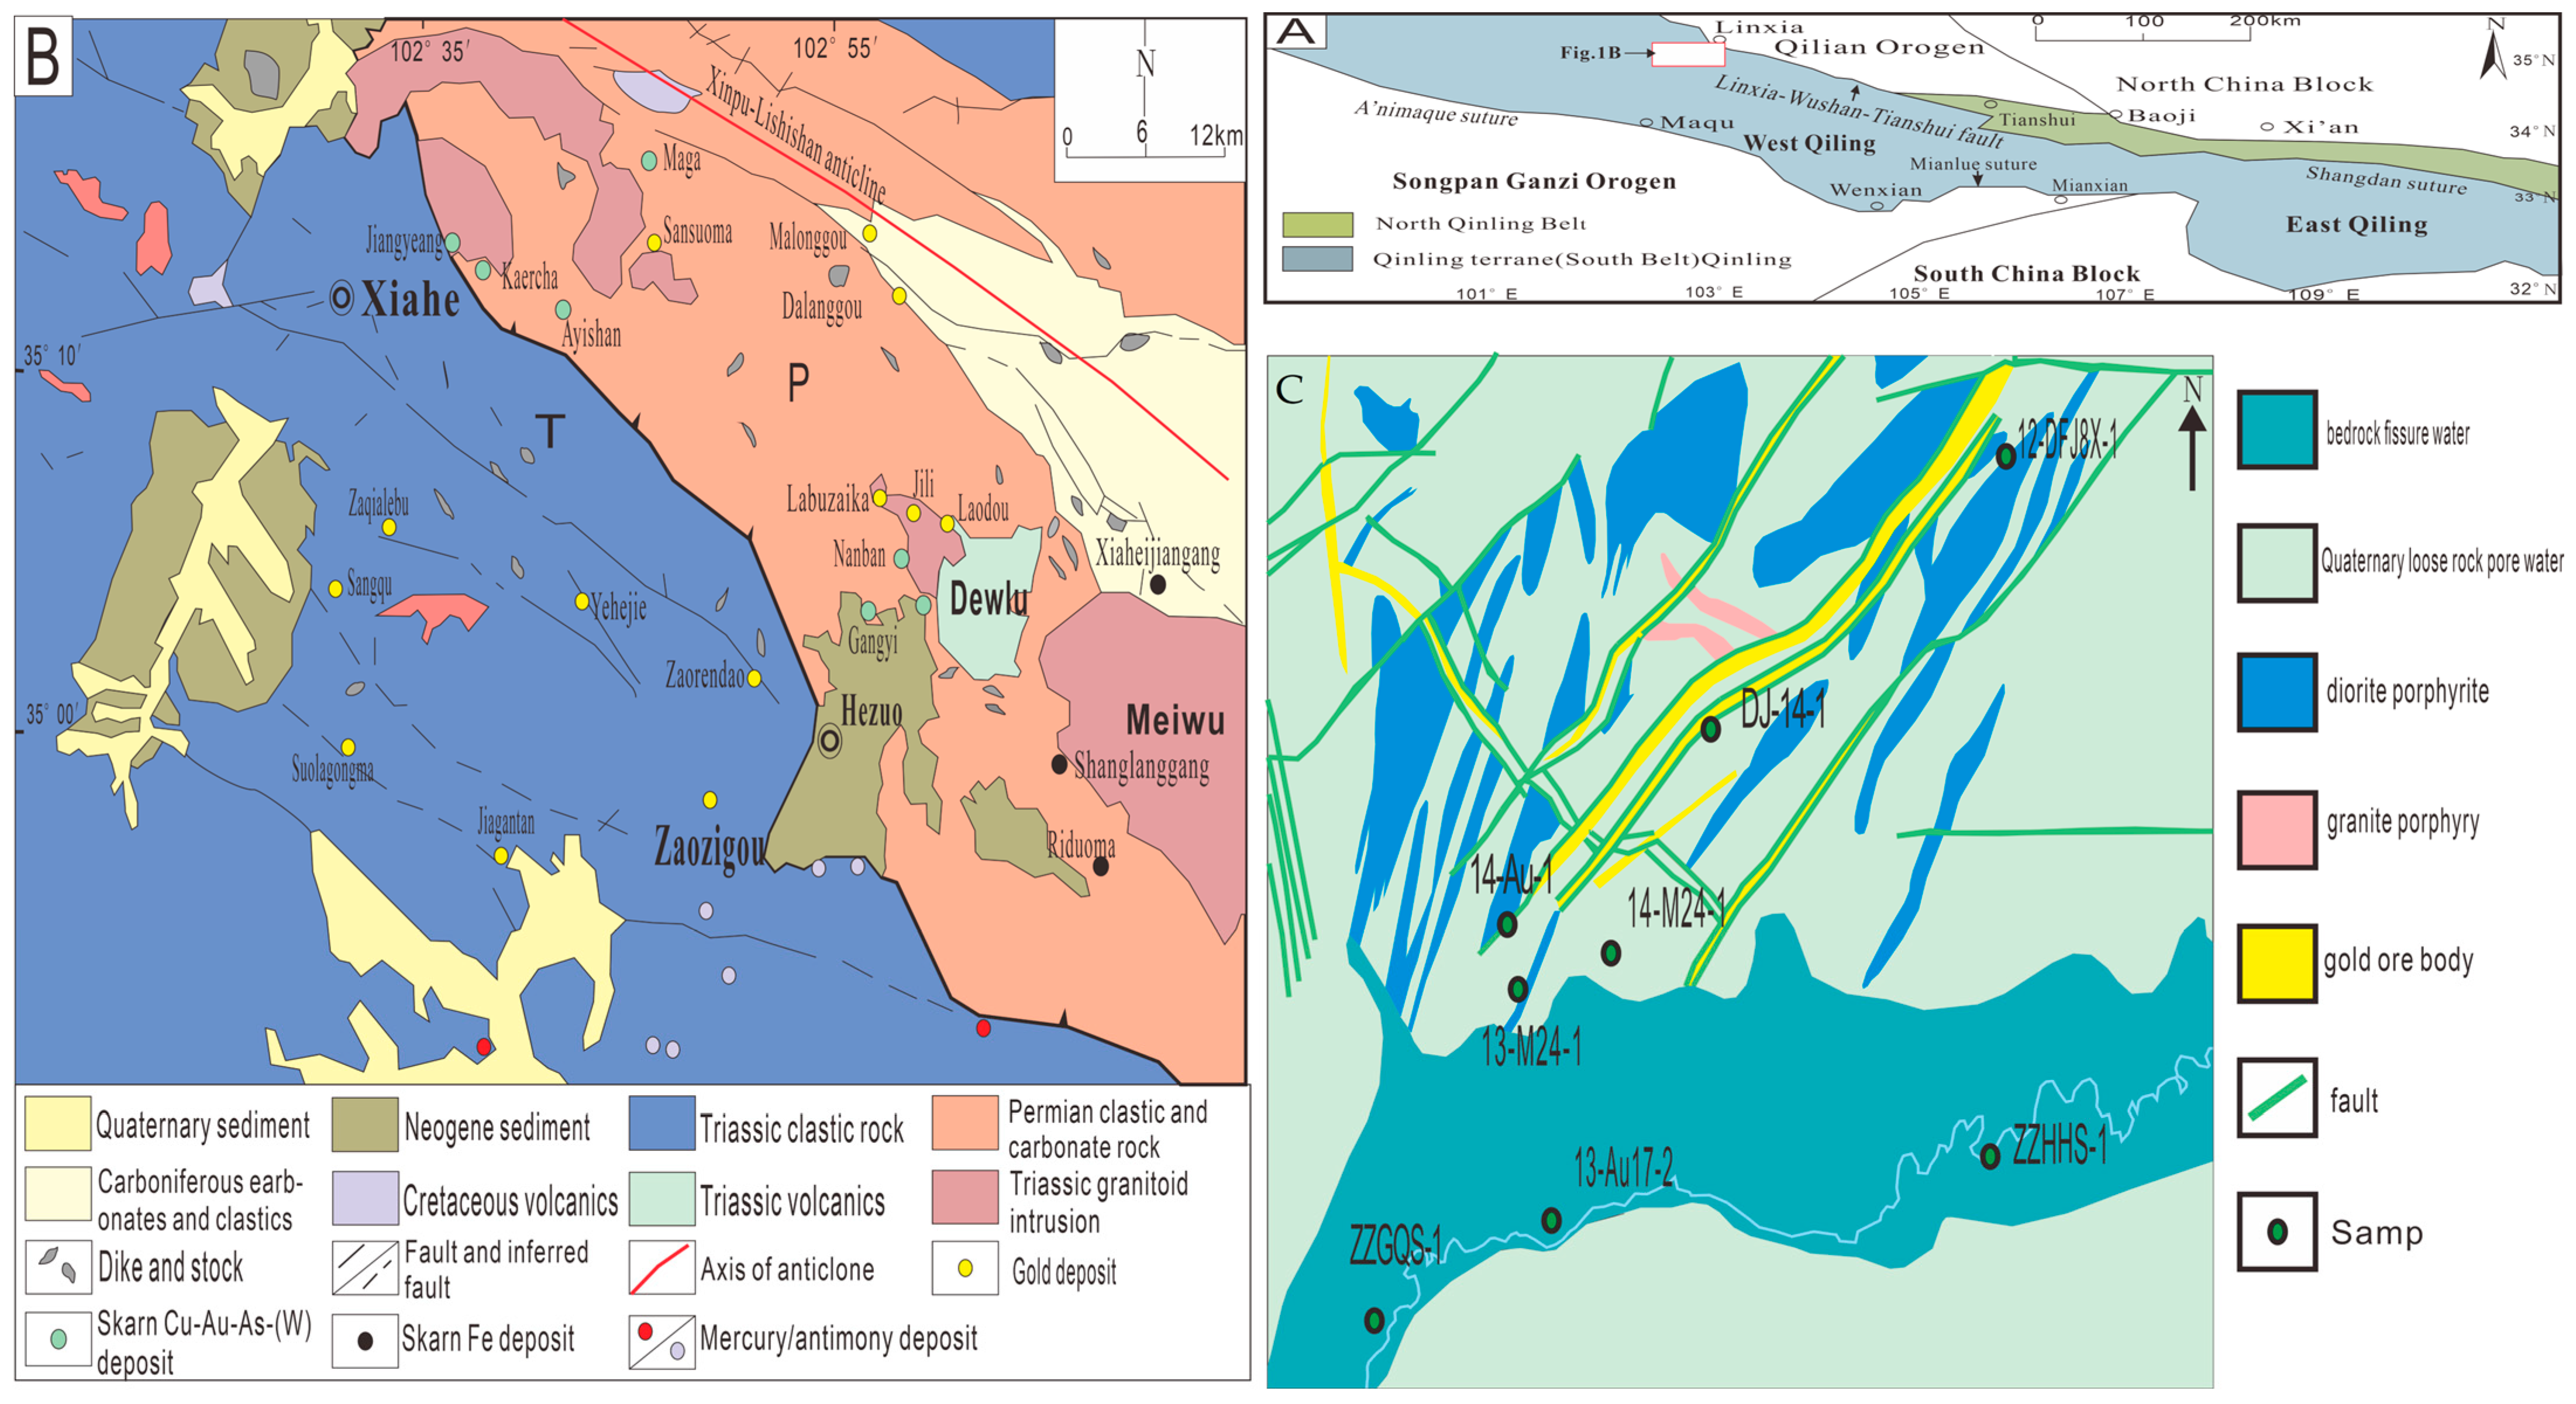
2. Geological Background

The Zaozigou Geothermal Field is situated on the eastern edge of the Qinghai–Tibet Plateau. The area features a typical small undulating mid-mountain landform with pronounced topographic relief, characterized by higher elevations in the north, gradually sloping down towards the southwest to northeast [15] (Figure 1A). The altitude ranges between 3100 and 3442 m, with a relative height difference of 360 m. The landscape comprises shallowly incised mountains and valleys, with most of the Zaozigou gold mine surface covered by Quaternary residual and slope deposits [16]. The exposed bedrock primarily consists of Triassic strata, interspersed with magmatic rock bodies (Figure 1B).
The mountain landform type in the geothermal field is predominantly located on both sides of Zaozigou, characterized by erosion and denudation processes occurring in parallel. The height variation typically ranges from 15 to 50 m, with altitudes exceeding 3000 m in most areas. The slopes of the mountainside range from 20 to 40°, with a vegetation coverage rate of approximately 90%. Within Zaozigou, the ravine landform exhibits a “U” shape, being relatively open and flat. The ravine width varies between 80 and 250 m, with a longitudinal slope drop of around 25‰.
The geothermal field is situated in the transitional zone between the northern fault fold belt and the central rift trough of the West Qinling Mountains fold belt within the Hezuo city–Min city regional fault belt. The northern segment of the fault-fold belt predominantly exhibits an anticline structure composed of Devonian–Carboniferous Dacaotan Group sea-continental sediments along its axis [19]. Conversely, the central rift trough is filled with extensive Triassic flysch-like sediments. The Hezuo city–Min city fault zone comprises a series of roughly parallel oblique thrust faults that intermittently extend, primarily following interlayers in a sinuous, wavy manner with notable reverse “S”-shaped deflections in certain sections, showcasing repeated movements across multiple phases. The fault zone hosts Triassic–Cretaceous volcanic rocks.
Fault structures are prominently manifested within the geothermal area, influencing the regional distribution of the Zaozigou gold deposit, dictated by the NWW trending fault zone that governs the gold mineralization points and discovered gold deposits alongside its secondary faults. Notably, three main regional fault zones impact ore deposition, including the Xiahe city–Hezuo city fault zone in the central region, the Sangkonan–Grina fault zone, and the Lishi Mountain–Weidang Mountain fault zone in the southern and northern sectors [20]. Predominantly trending NE, these fault systems collectively shape the distribution of medium-acidic rock masses, dikes, and gold mineralization throughout the region.
Based on factors such as water-bearing substrates and hydraulic characteristics, groundwater in the mining domain is categorized into Quaternary gully phreatic water and bedrock fissure water. Quaternary pore water is predominantly concentrated in the Zaozigou floodplain and valley riverbed, featuring a Quaternary sand and gravel aquifer with variable thicknesses, typically ranging from 8 to 12 m, yet thinner in slope accumulation layers (<3 m). Variations in mud content and permeability coefficient contribute to distinct characteristics between upper and lower ravine reaches. Alternatively, bedrock fissure water primarily exists within weathering fissures and structural cracks of Triassic slate adjacent to Zaozi Valley.

3. Sampling and Methods

The author collected geothermal water samples in the research area from June to July 2023 and obtained a total of 8 geothermal water samples, including 1 surface water sample, 1 hot spring sample, and 6 drilling geothermal water samples (Figure 1C). Water samples were collected and processed in strict accordance with the “Geological Exploration Code for Geothermal Resources” (GB/T11615-2010) [21]. The analysis items of water samples include temperature, pH, TDS, K+, Na+, Ca2+, Mg2+, HCO, SO42−, Cl ions, etc. The test and analysis of the samples is entrusted to The Third Geological and Mineral Exploration Institute of the Gansu Provincial Bureau of Geology and Mineral Resources. The anions and cations were measured using Inductively Coupled Plasma Mass Spectrometry (X2ICP-MS Thermo Fisher Scientific, Waltham, MA, USA) and Inductively Coupled Plasma Optical Emission Spectrometry (ICAP6300 Thermo Fisher Scientific, Waltham, MA, USA). The quality of the analysis was evaluated using the ion charge balance equation (Equation (1)), as shown below. The results, presented in Table 1, indicate an error of less than ±5% (1.09% to 4.48%), demonstrating that the sample measurement accuracy meets the requirements.
C B = x = N C N a N C + N a × 100
where CB (%) represents ion charge balance error percentage; NC and Na represent milligram equivalent concentrations of cations and anions (meq/L), respectively.

4. Results and Analysis

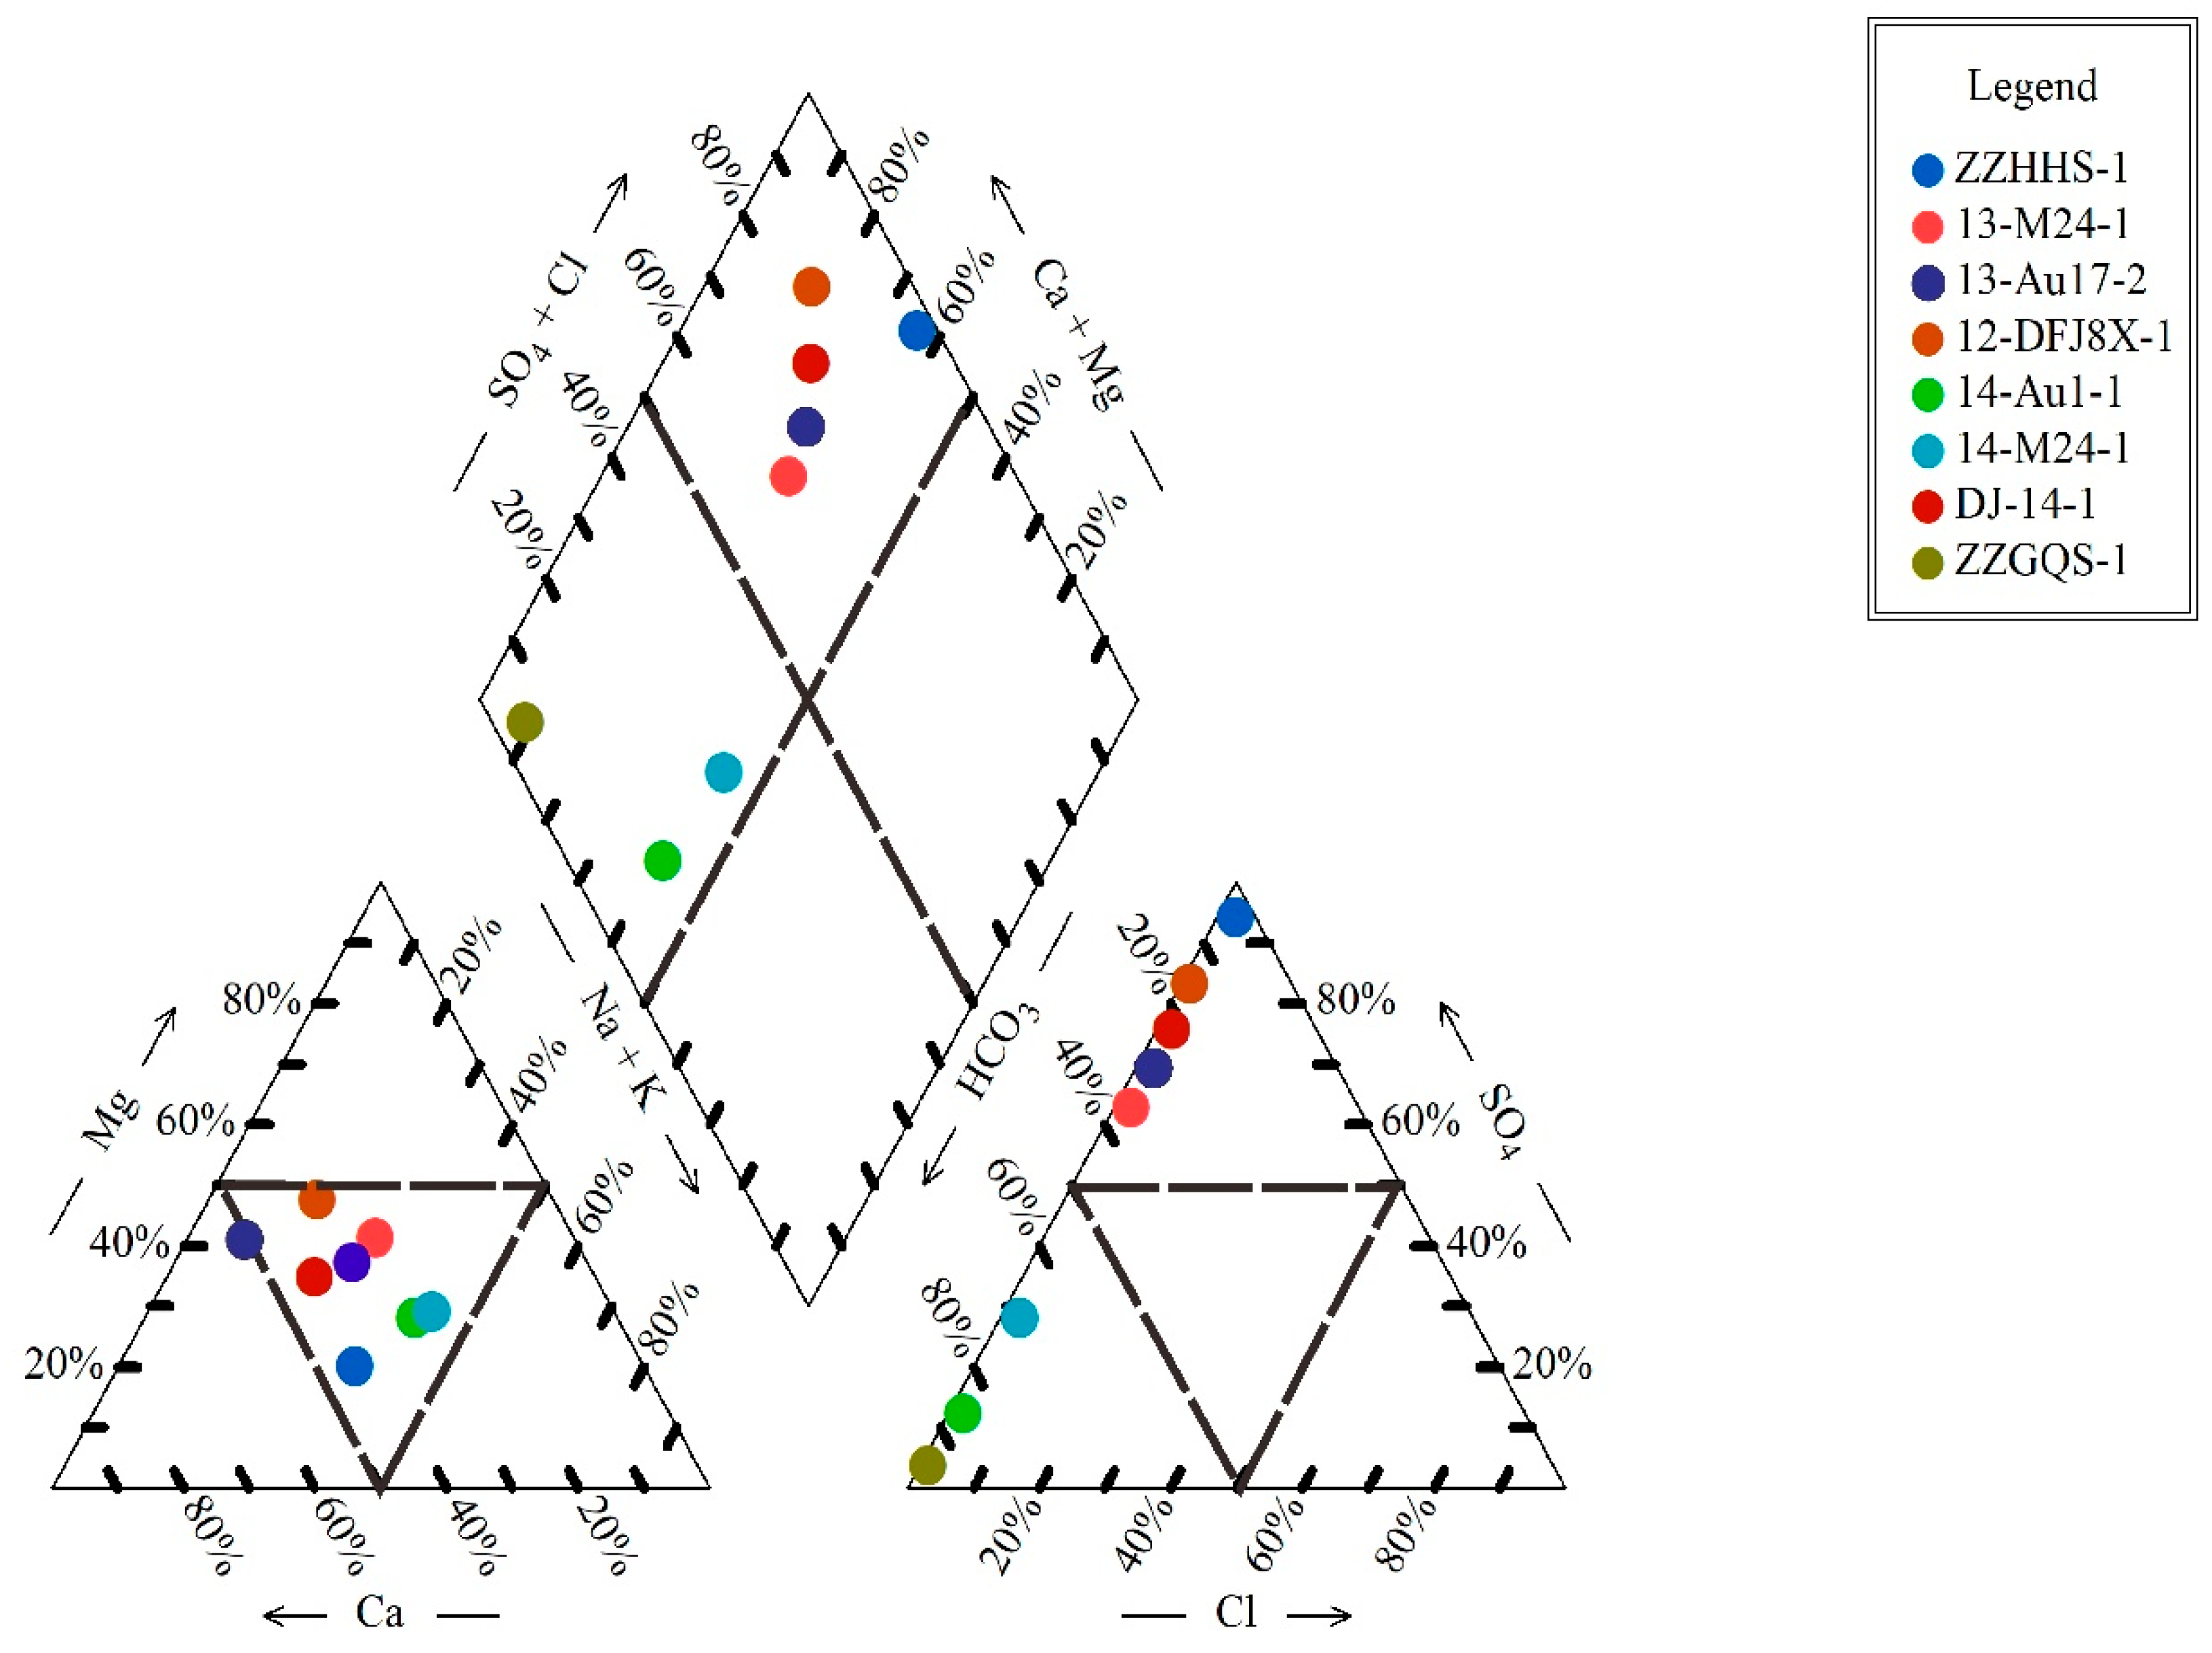
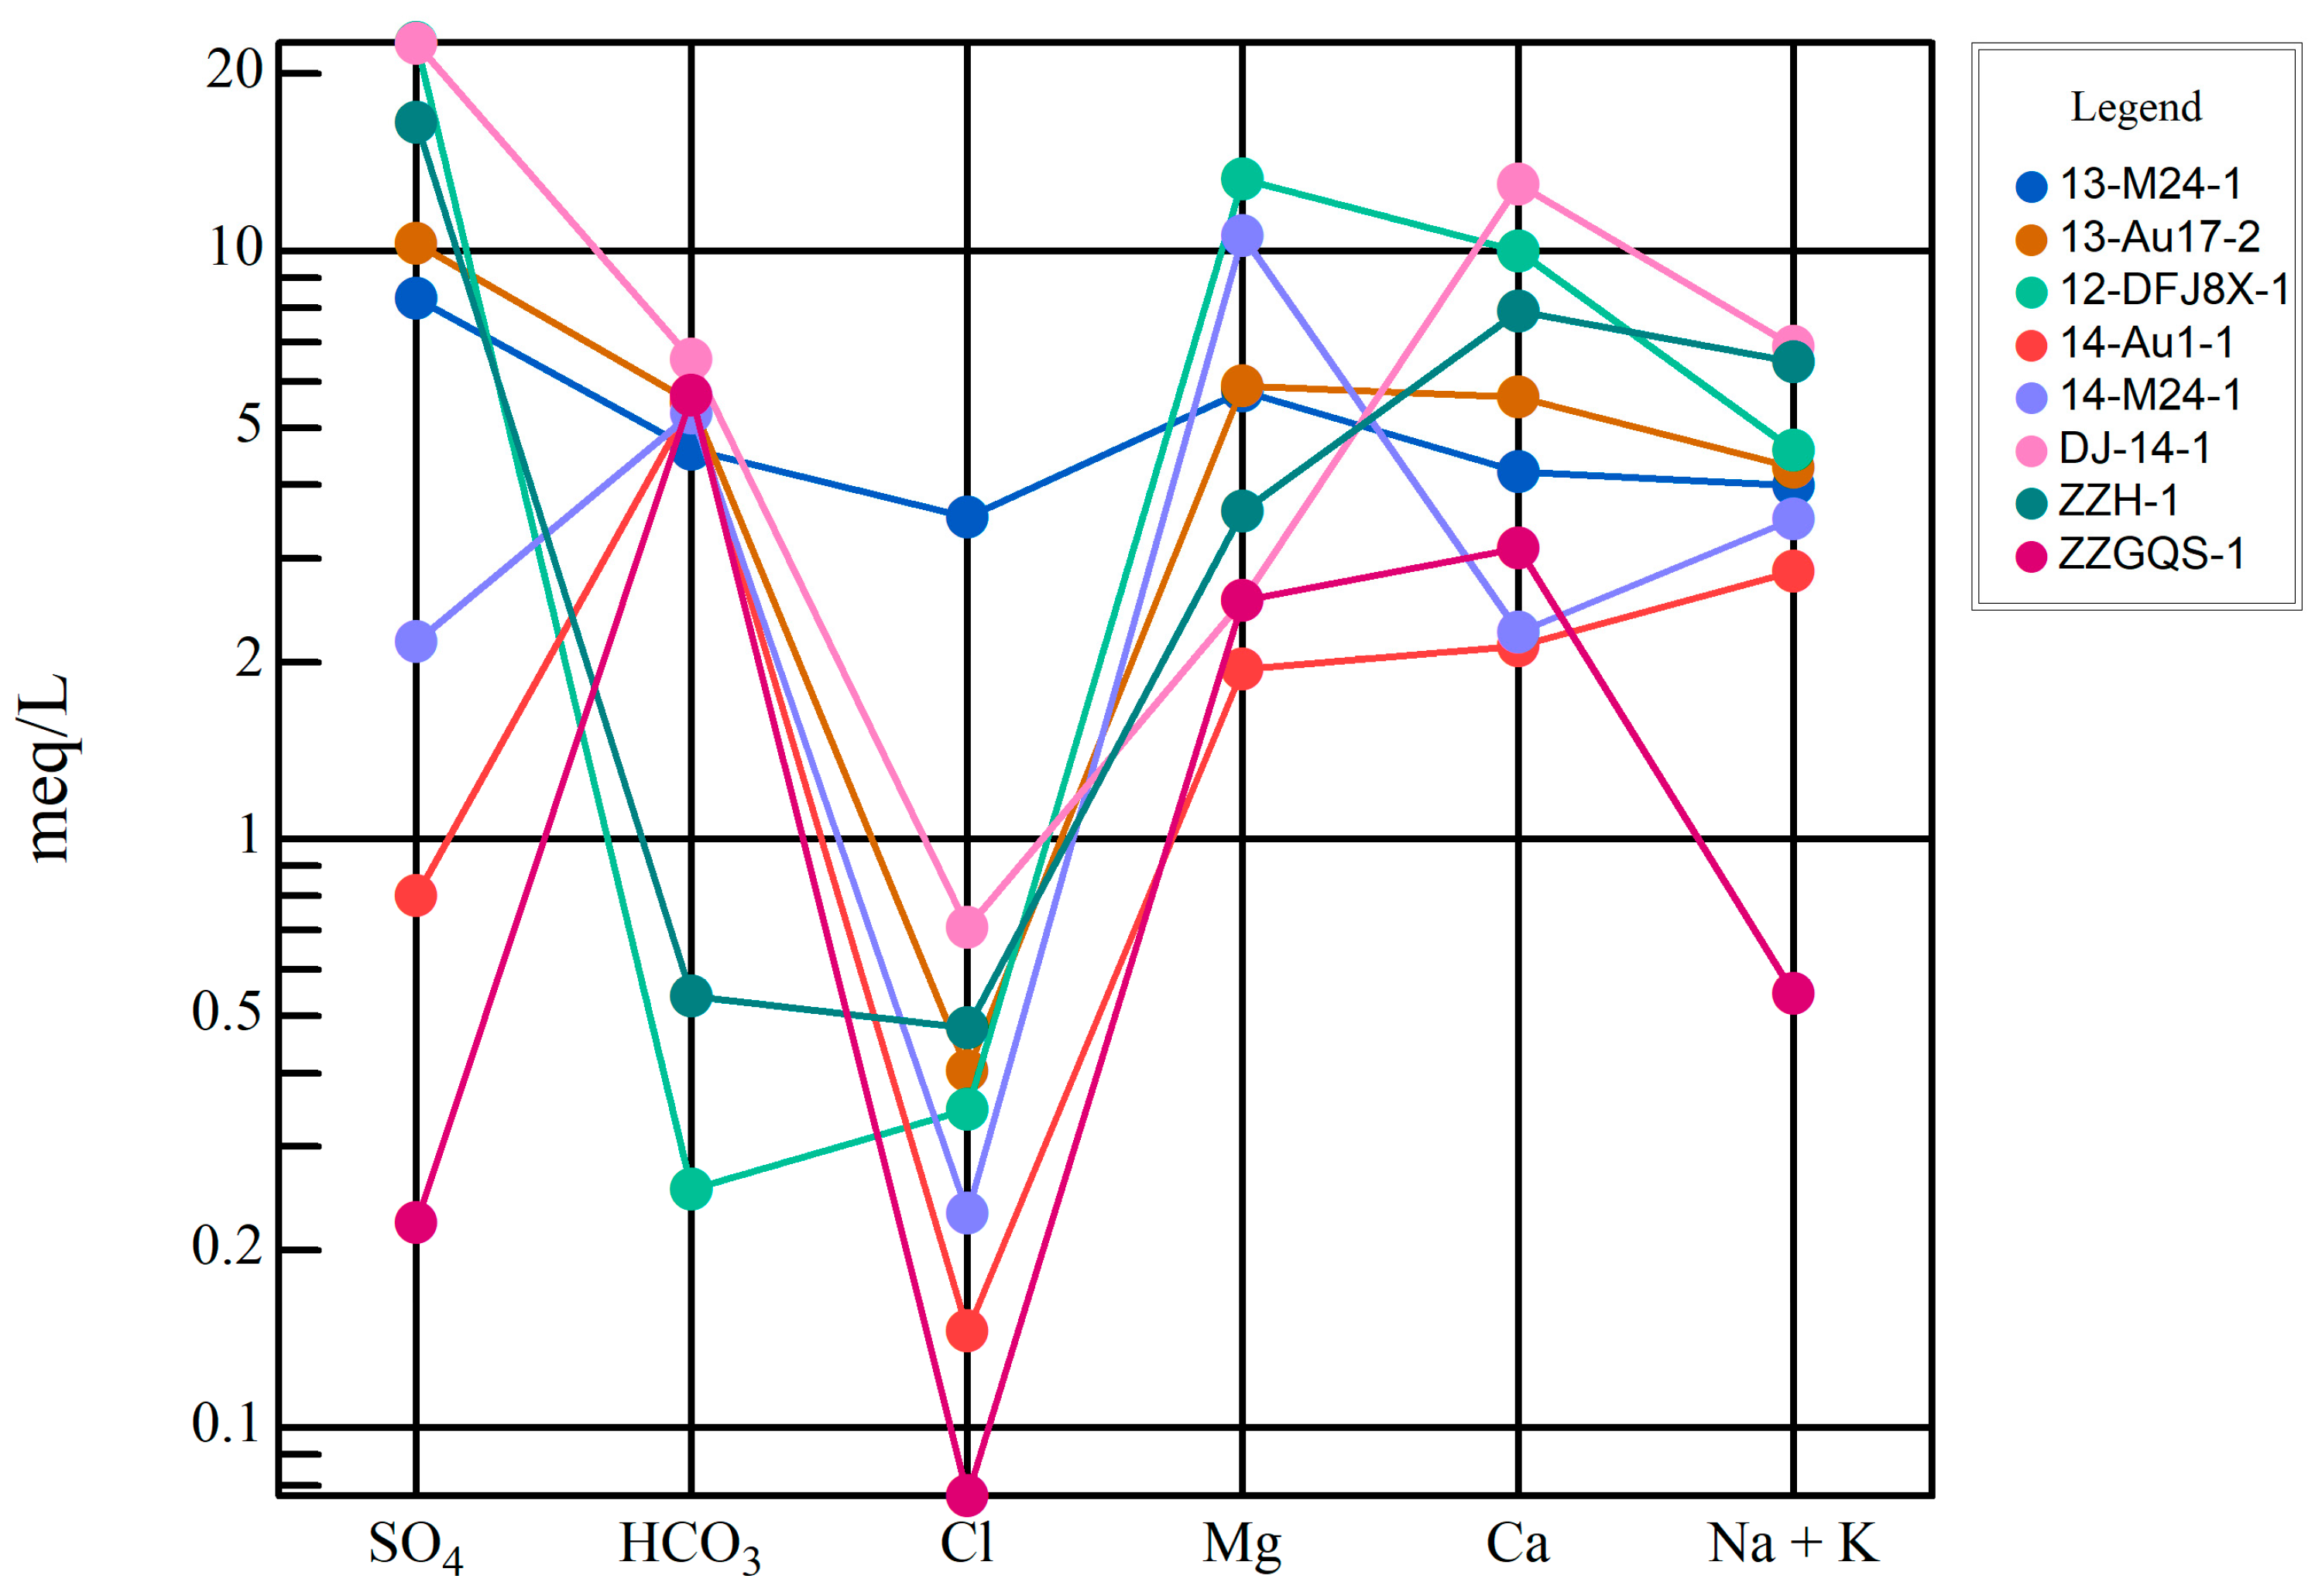
4.1. Types of Water Chemistry

This article uses the Shukarev classification method to classify the sampled products. The pH value of surface water and hot spring water in the study area is 7.34–7.68, which is weakly alkaline water. Surface water has a high SO42− content, and the chemical type of surface water is Ca·Na-SO4 type. Hot spring water has a high HCO3 content, and its chemical type is Ca·Na-HCO3. The pH value of geothermal water is 6.41–7.93, which is weakly acidic water. The water chemistry type is mainly Na·Ca·Mg-SO4·HCO3 type (Figure 2). The Schoeller diagram provides a visual representation of the correlation between the chemical compositions and distributions of different water bodies in the research area, as well as the variations over time within the same water body [22]. The Schoeller diagram clearly distinguishes the differences in ions among surface water, hot spring water, and geothermal water, consistent with the results of the Piper diagram (Figure 3).
The Piper diagram reveals prominent regional characteristics in the hydrochemical types of groundwater. Based on this, the eight samples collected are categorized into different regional features.
Firstly, the eastern geothermal water category includes samples 12-DFJ8X-1 and DF-14-1. These samples belong to underground hot water and exhibit distinct hydrochemical characteristics on the Piper diagram. Secondly, the central geothermal water category consists of samples 14-Au1-1 and 14-M24-1. These samples also belong to underground hot water, but their hydrochemical types show features different from those in the eastern geothermal water category. Thirdly, the southern geothermal water category comprises samples 13-M24-1 and 13-Au17-2. Similarly, these samples belong to underground hot water, but their hydrochemical types exhibit distinct features compared to the eastern and central geothermal water categories. Lastly, the shallow cold water category includes samples ZZGQS-1 and ZZHHS-1. These samples belong to shallow groundwater, and their hydrochemical types significantly differ from those of geothermal water.
By classifying the samples, we can gain a better understanding of the regional characteristics of groundwater and further investigate the characteristics and potential applications of groundwater within each category.
Shallow cold water: Mainly the bedrock fissure water and spring water in the Triassic slate on both sides of Zaozigou. The water chemical type is mainly Ca·Mg-HCO3 type. The cations are mainly Ca+ and Mg2+, and their content is 62–158 mg/L and 30–43 mg/L. The anions are mainly HCO3 and SO42−, and their contents are 33–346 mg/L and 10–794 mg/L. The overall chemical characteristics are unstable, and its anion content changes greatly. Due to the various chemicals added to it after passing through a wastewater treatment plant, its chemical composition changes greatly.
Eastern geothermal water: Primarily represented by two geothermal wells, 12-DFJ8X-1 and DFJ-14-1. The water quality of these two points does not differ significantly, and their distribution on the Piper diagram is also relatively close. Both have a hydrochemical type of Ca·Mg-SO4, but there is a significant difference in the HCO3 content. This is mainly because DF-14-1 has a greater depth compared to 12-DFJ8X-1, and it passes through more rock formations, resulting in an increased ion content.
Central geothermal water: Located near the No. 3 ditch, it mainly includes the two geothermal waters of No. 14 Zhong-Au1-1 and No. 14 Zhong-M24-1. Its water chemical types are Na·Ca·Mg-HCO3·SO4 type and Na·Ca·Mg-HCO3 type. The TDS content is 348–414 mg/L. The cations are mainly Na+, Ca2+, and Mg2+, and the contents are 40–45 mg/L, 66–85 mg/, and 23–28 mg/L respectively. The anions are mainly HCO3 and SO42−, and the contents are 323–337 mg/L and 38–104mg/L, respectively. The overall hydrochemical characteristics of the geothermal water in the central region are not very different, but the SO42− content is significantly different. The main sources of increased SO42− content are the dissolution of gypsum and other sulfate-containing deposits, the oxidation and decomposition of sulfide minerals, and the addition of copper sulfate, sulfur dioxide, lime, and coagulants to the water in mining operations.
Southern geothermal water: Located in the sewage treatment plant area, it mainly includes the two geothermal waters of No. 13 Middle-M24-1 and No. 13 Middle-Au17-2. Its water chemistry type is mainly Na·Ca·Mg-HCO3·SO4 type. There is not much difference on the Piper three-line chart. The main reason is that the water sample continuously dissolves sulfate minerals in the water through metamorphic rocks, resulting in the continuous increase in SO42− ions, and the various ion components through the runoff path also increase slightly. The water chemistry in this area is stable, and the overall variability is not obvious.
The Stiff diagram provides a visual reflection of groundwater characteristics, facilitating the comparison of groundwater types and offering evidence for distinguishing between aquifer hydraulic connections. The Stiff diagrams of DJ-14-1 and ZZH-1 are similar in shape, as are ZZGQS-1 and 14-Au-1, and 13-M24-1 and 13-Au17-2. These indicate that DJ-14-1 and 14-Au-1 have strong hydraulic connections with shallow cold water, suggesting poor spatial closure, while 13-M24-1 and 13-Au17-2 exhibit strong hydraulic connections and good spatial closure, with noticeable differences compared to the Stiff diagrams of shallow cold water. There are significant differences between the geothermal waters in the south and west, which may be related to the geothermal water circulating heating in the central geothermal reservoirs (Figure 4).
The various chemical components in geothermal water mainly come from the dissolution and filtration of the geothermal water flowing through the rock and soil during the flow process. The longer the runoff path of the geothermal water and the more rock formations it contacts, the more complex the components will be and the higher the salinity. Therefore, among the collected groundwater samples, the TDS content of central geothermal water < shallow cold water < southern geothermal water < western geothermal water, and the SO42− content is also consistent with the changes in TDS content. Combined with the regional topography and groundwater dynamic conditions, it can be inferred that the groundwater flow direction is from west to east.

4.2. Groundwater Characteristic Coefficient

In the chemical characteristics of geothermal water, the metamorphic coefficient (rNa+/rCl) and salinization coefficient (rCl/rHCO3+rCO32−), to some extent, reflect the degree of metamorphism and concentration of geothermal water [23]. The smaller the metamorphic coefficient, the better the confinement of the formation water, the higher the concentration, and the deeper the metamorphism, indicating a relatively reduced water environment. From Table 1, it can be seen that the metamorphic coefficient gradually decreases from north to south, indicating that the reducing conditions become stronger and the environment becomes more confined from north to south. The salinization coefficient shows a trend of increasing from west to east, consistent with the direction of groundwater flow. This indicates that the concentration of geothermal water increases from west to east, which is consistent with the trend of mineralization, Na+, SO42−, and other ions in geothermal water (Table 2).

4.3. Isotopic Chemical Characteristics

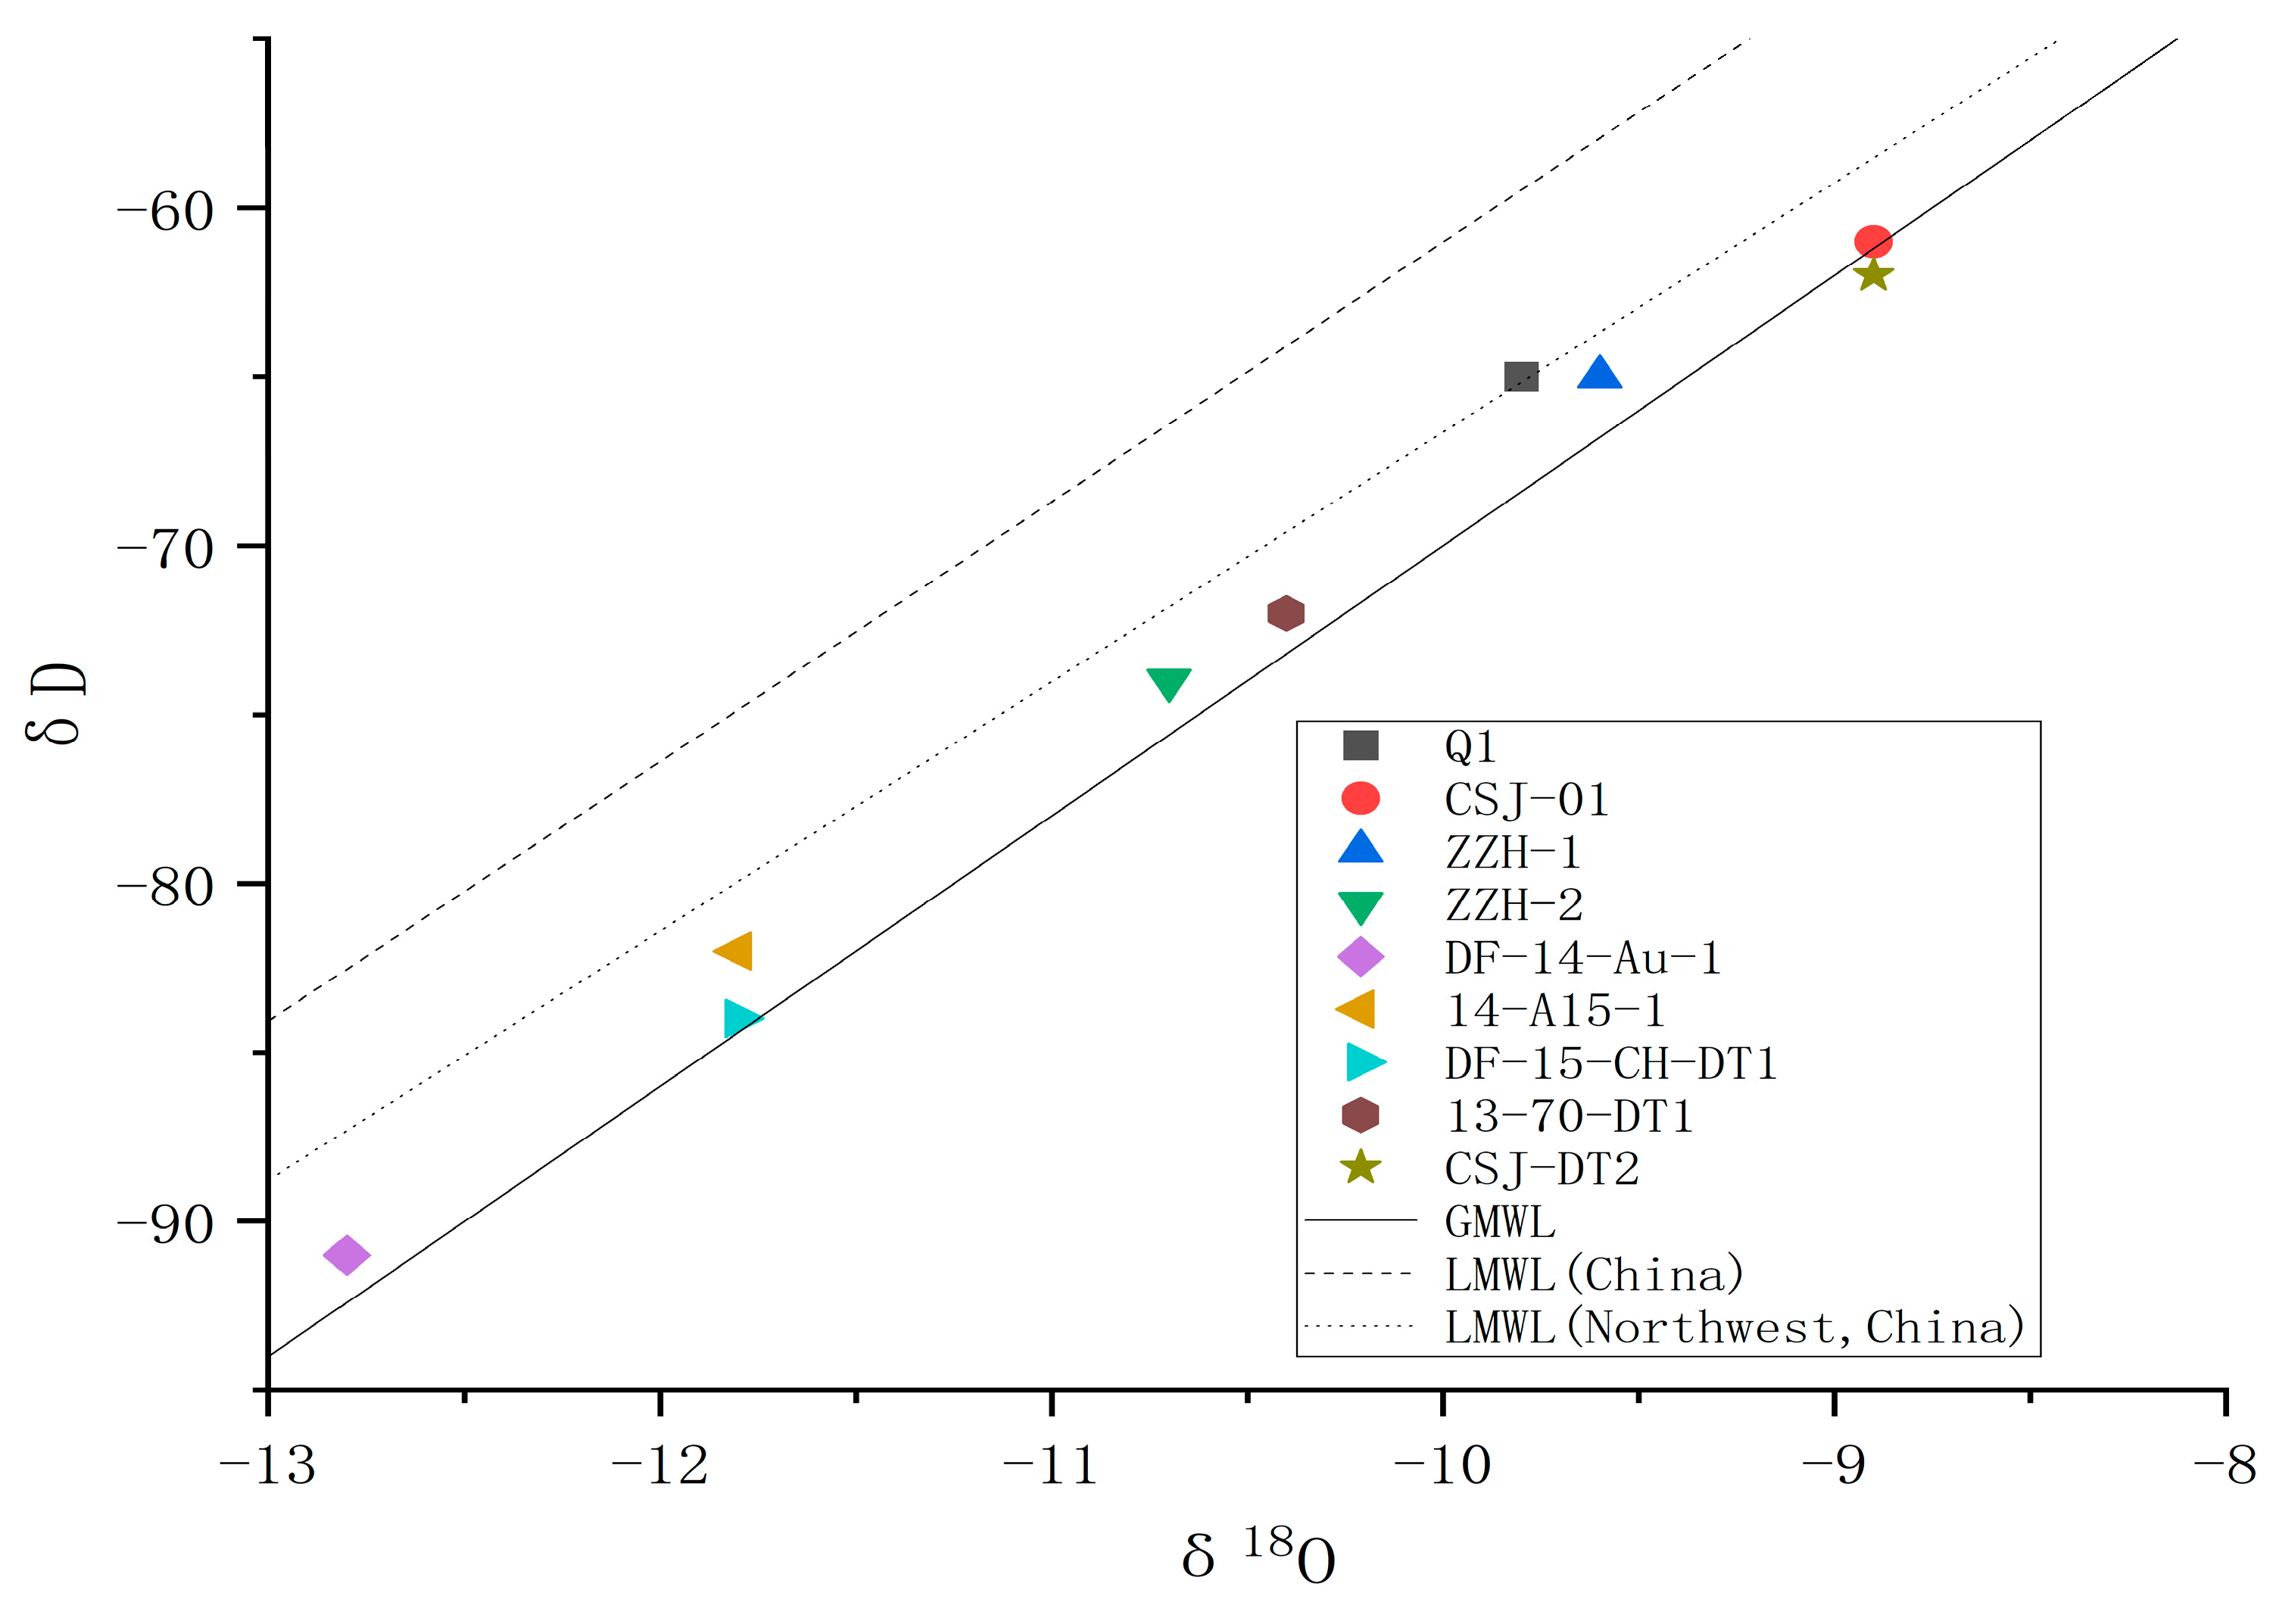
4.3.1. Geothermal Water Source

The source of geothermal water can usually be determined through the relationship between hydrogen and oxygen isotopes and atmospheric precipitation lines. Craig first proposed the global precipitation line equation [24] (Equation (2)) in 1961; Hongping Zhang proposed the Chinese atmospheric precipitation line equation [25] (Equation (3)) in 1991; Gao et al. proposed the mainline equation for northwest China in 1993 [14] (Equation (4)).
δ D = 8 δ 18 O + 10
δ D = 7.69 δ 18 O + 8.2
δ D = 7.38 δ 18 O + 7.16
From Figure 5, it can be seen that the hydrogen and oxygen isotope values of the geothermal water in the Zaozigou area exhibit relatively small overall fluctuations. The δ18O values range from −8.9‰ to −12.8‰, and the δD values range from −61‰ to −91‰. These values are distributed around the global, national, and Northwest China atmospheric precipitation lines without showing significant 18O drift. This indicates that the replenishment of geothermal water in this area is mainly derived from local atmospheric precipitation. The δD and δ18O values of the geothermal water in the study area are lower than those of shallow groundwater, suggesting that the geothermal water in the study area is characterized by good flow conditions and long residence time. Some samples in the Zaozigou area have δD and δ18O values closer to the Global Meteoric Water Line, indicating that the Zaozigou region is located in the southern part of Gansu, and the fit of the precipitation line of the northwest region to this area may not be particularly high. This could also be related to exceptional sample values (Figure 5).

4.3.2. Elevation of Geothermal Water Supply Area

The δ18O and δD isotopes in atmospheric precipitation have elevation effects. δD and δ18O decrease with the increase in groundwater recharge elevation, so the recharge elevation of geothermal water can be determined (Equation (5)).
H = δ G δ P K + h
In the formula, H is the height of the geothermal water recharge area (m), h is the elevation of the sampling point (m), δG is the value of geothermal δ18O (or δD) (‰), δP is the δ18O in atmospheric precipitation near the sampling point (or δD) value (‰), K is the height gradient value (−δ/100 m) of the atmospheric precipitation δ18O (or δD) value, taking the atmospheric precipitation isotope in the Lanzhou area in the northeast of the study area as the reference calculation value, the δ18O value is −8.79‰ [14]. The K value can be calculated based on the δ18O value of shallow groundwater Q1 and surface water in the upper reaches of the Zaozi River. The height gradient value of δ18O of atmospheric precipitation in the study area is calculated to be −0.5‰.
From this, it is estimated that the geothermal water recharge area in the study area is between 3117 m and 3334 m above sea level (Table 3). This range is roughly close to the mountainous altitude in the north of Zaozigou. This recharge area is relatively close to the Zaozigou geothermal field.

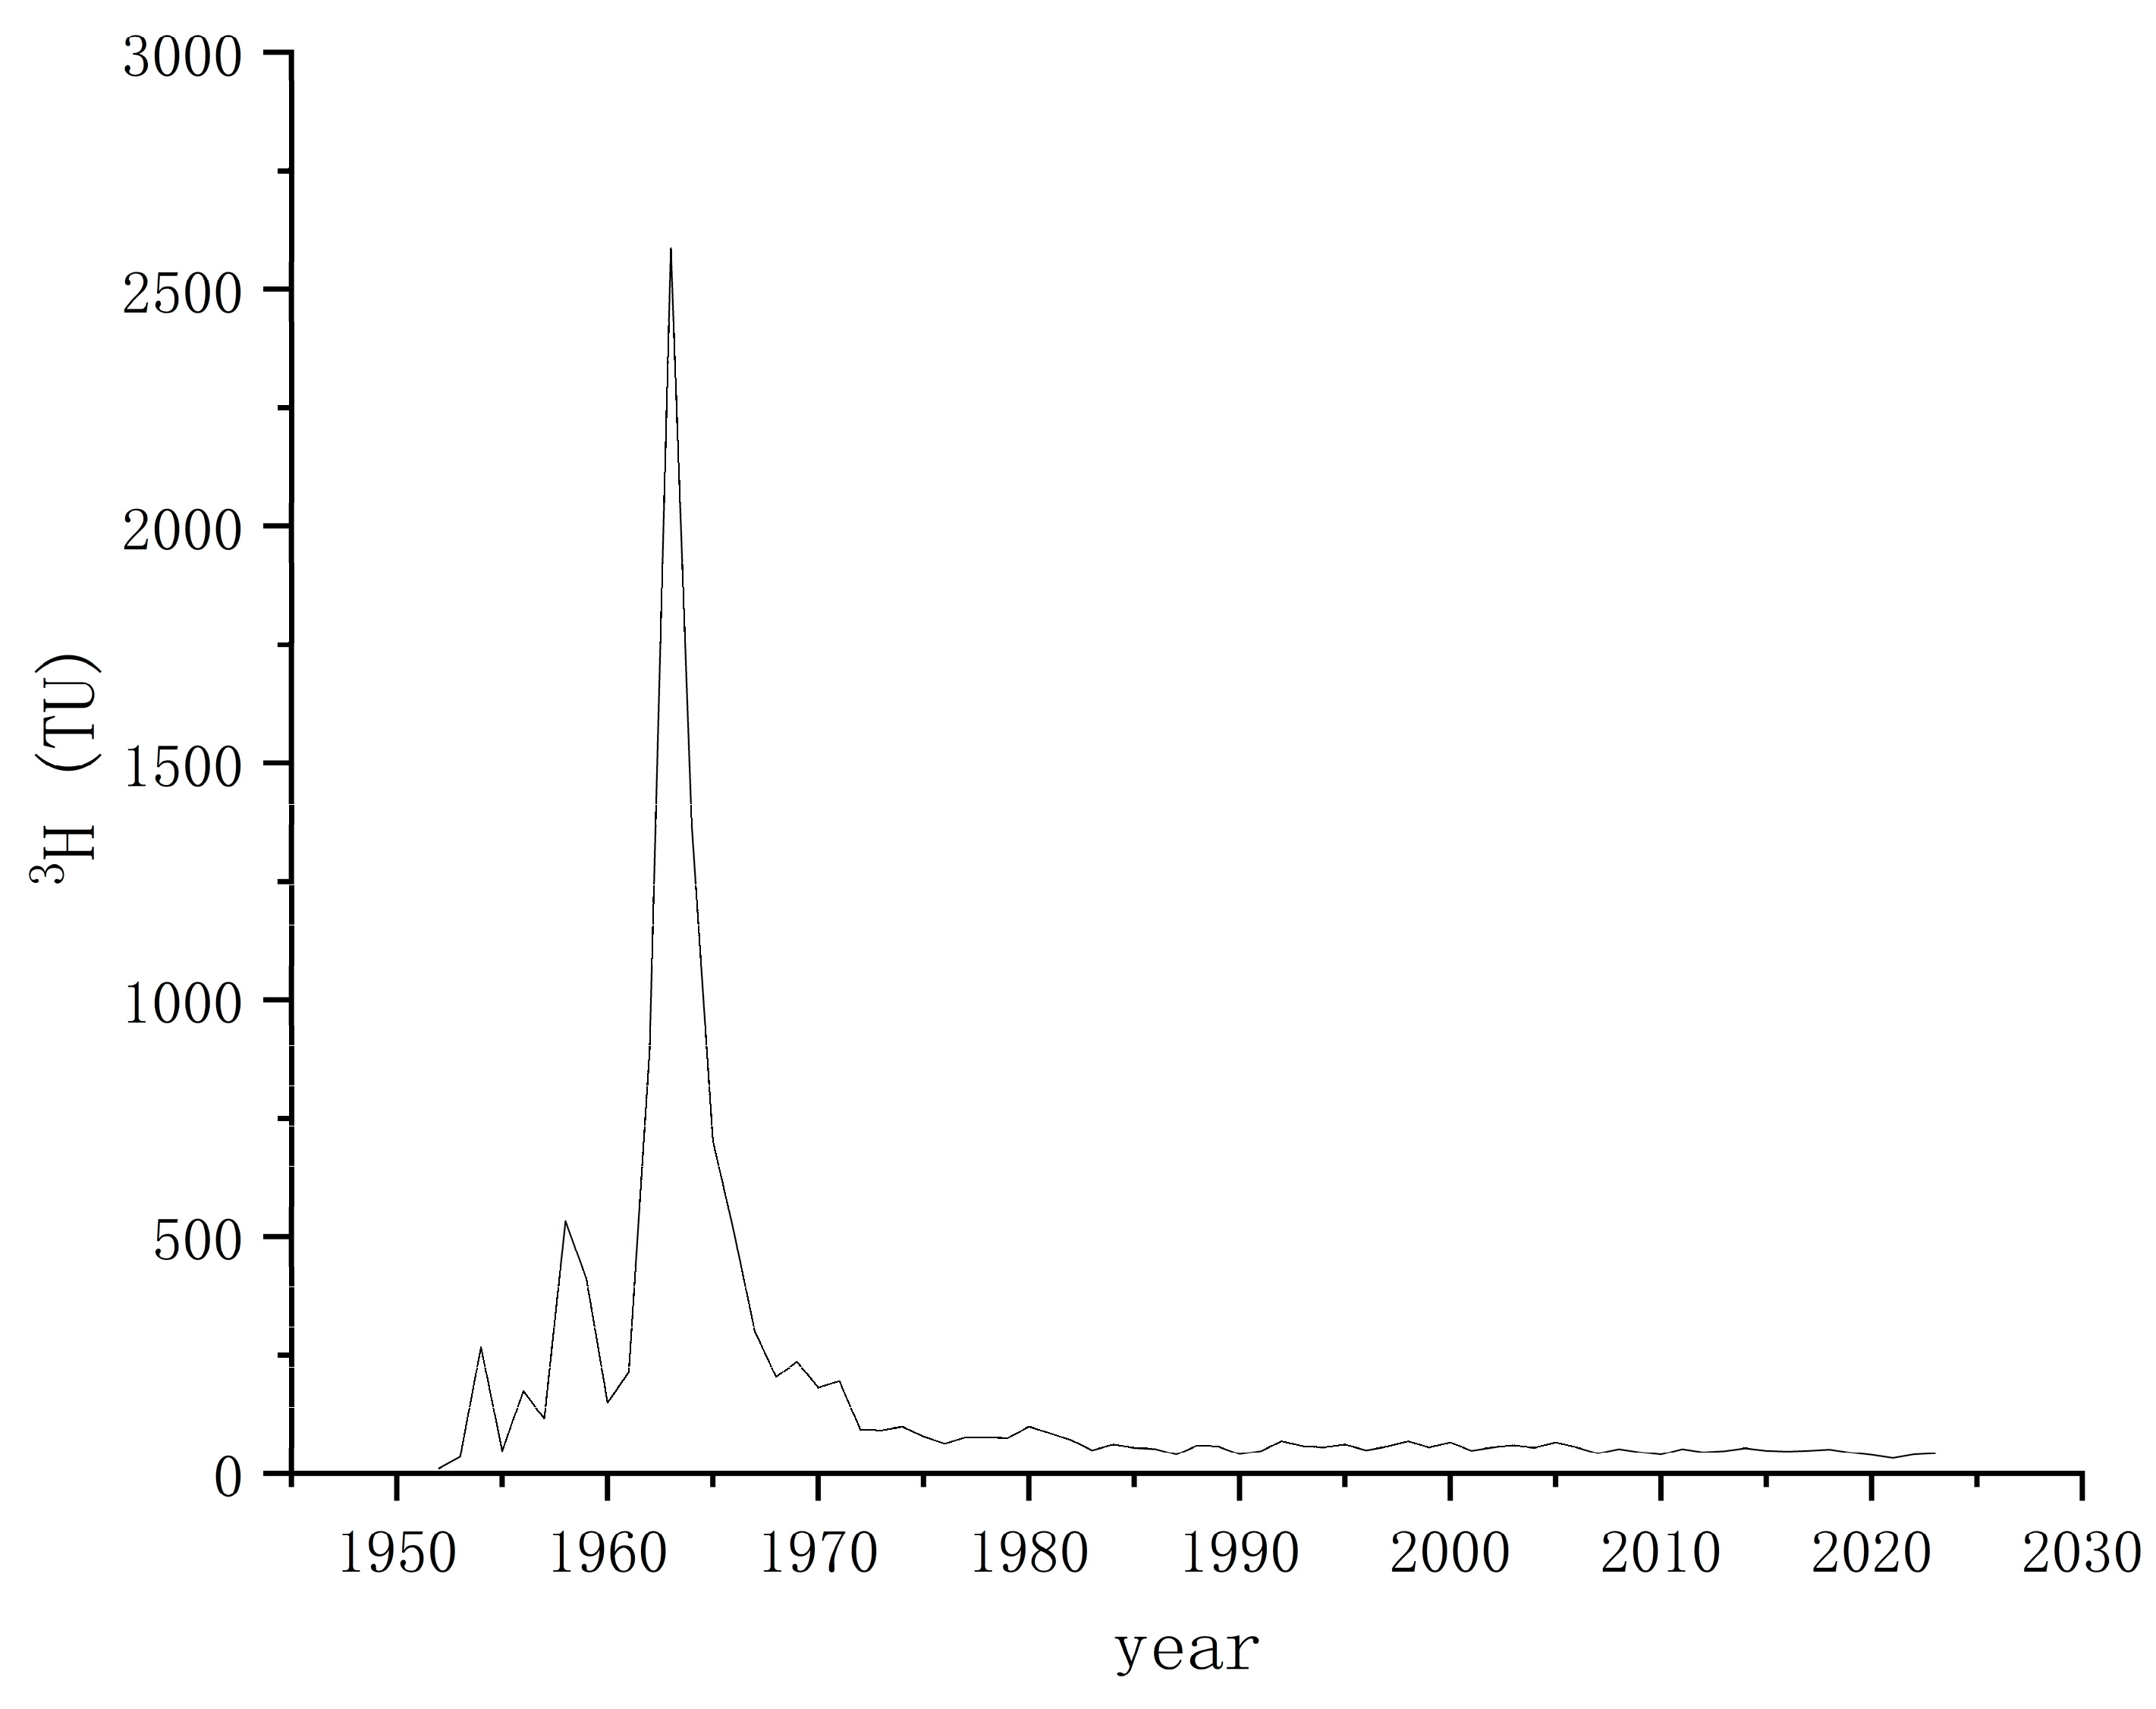
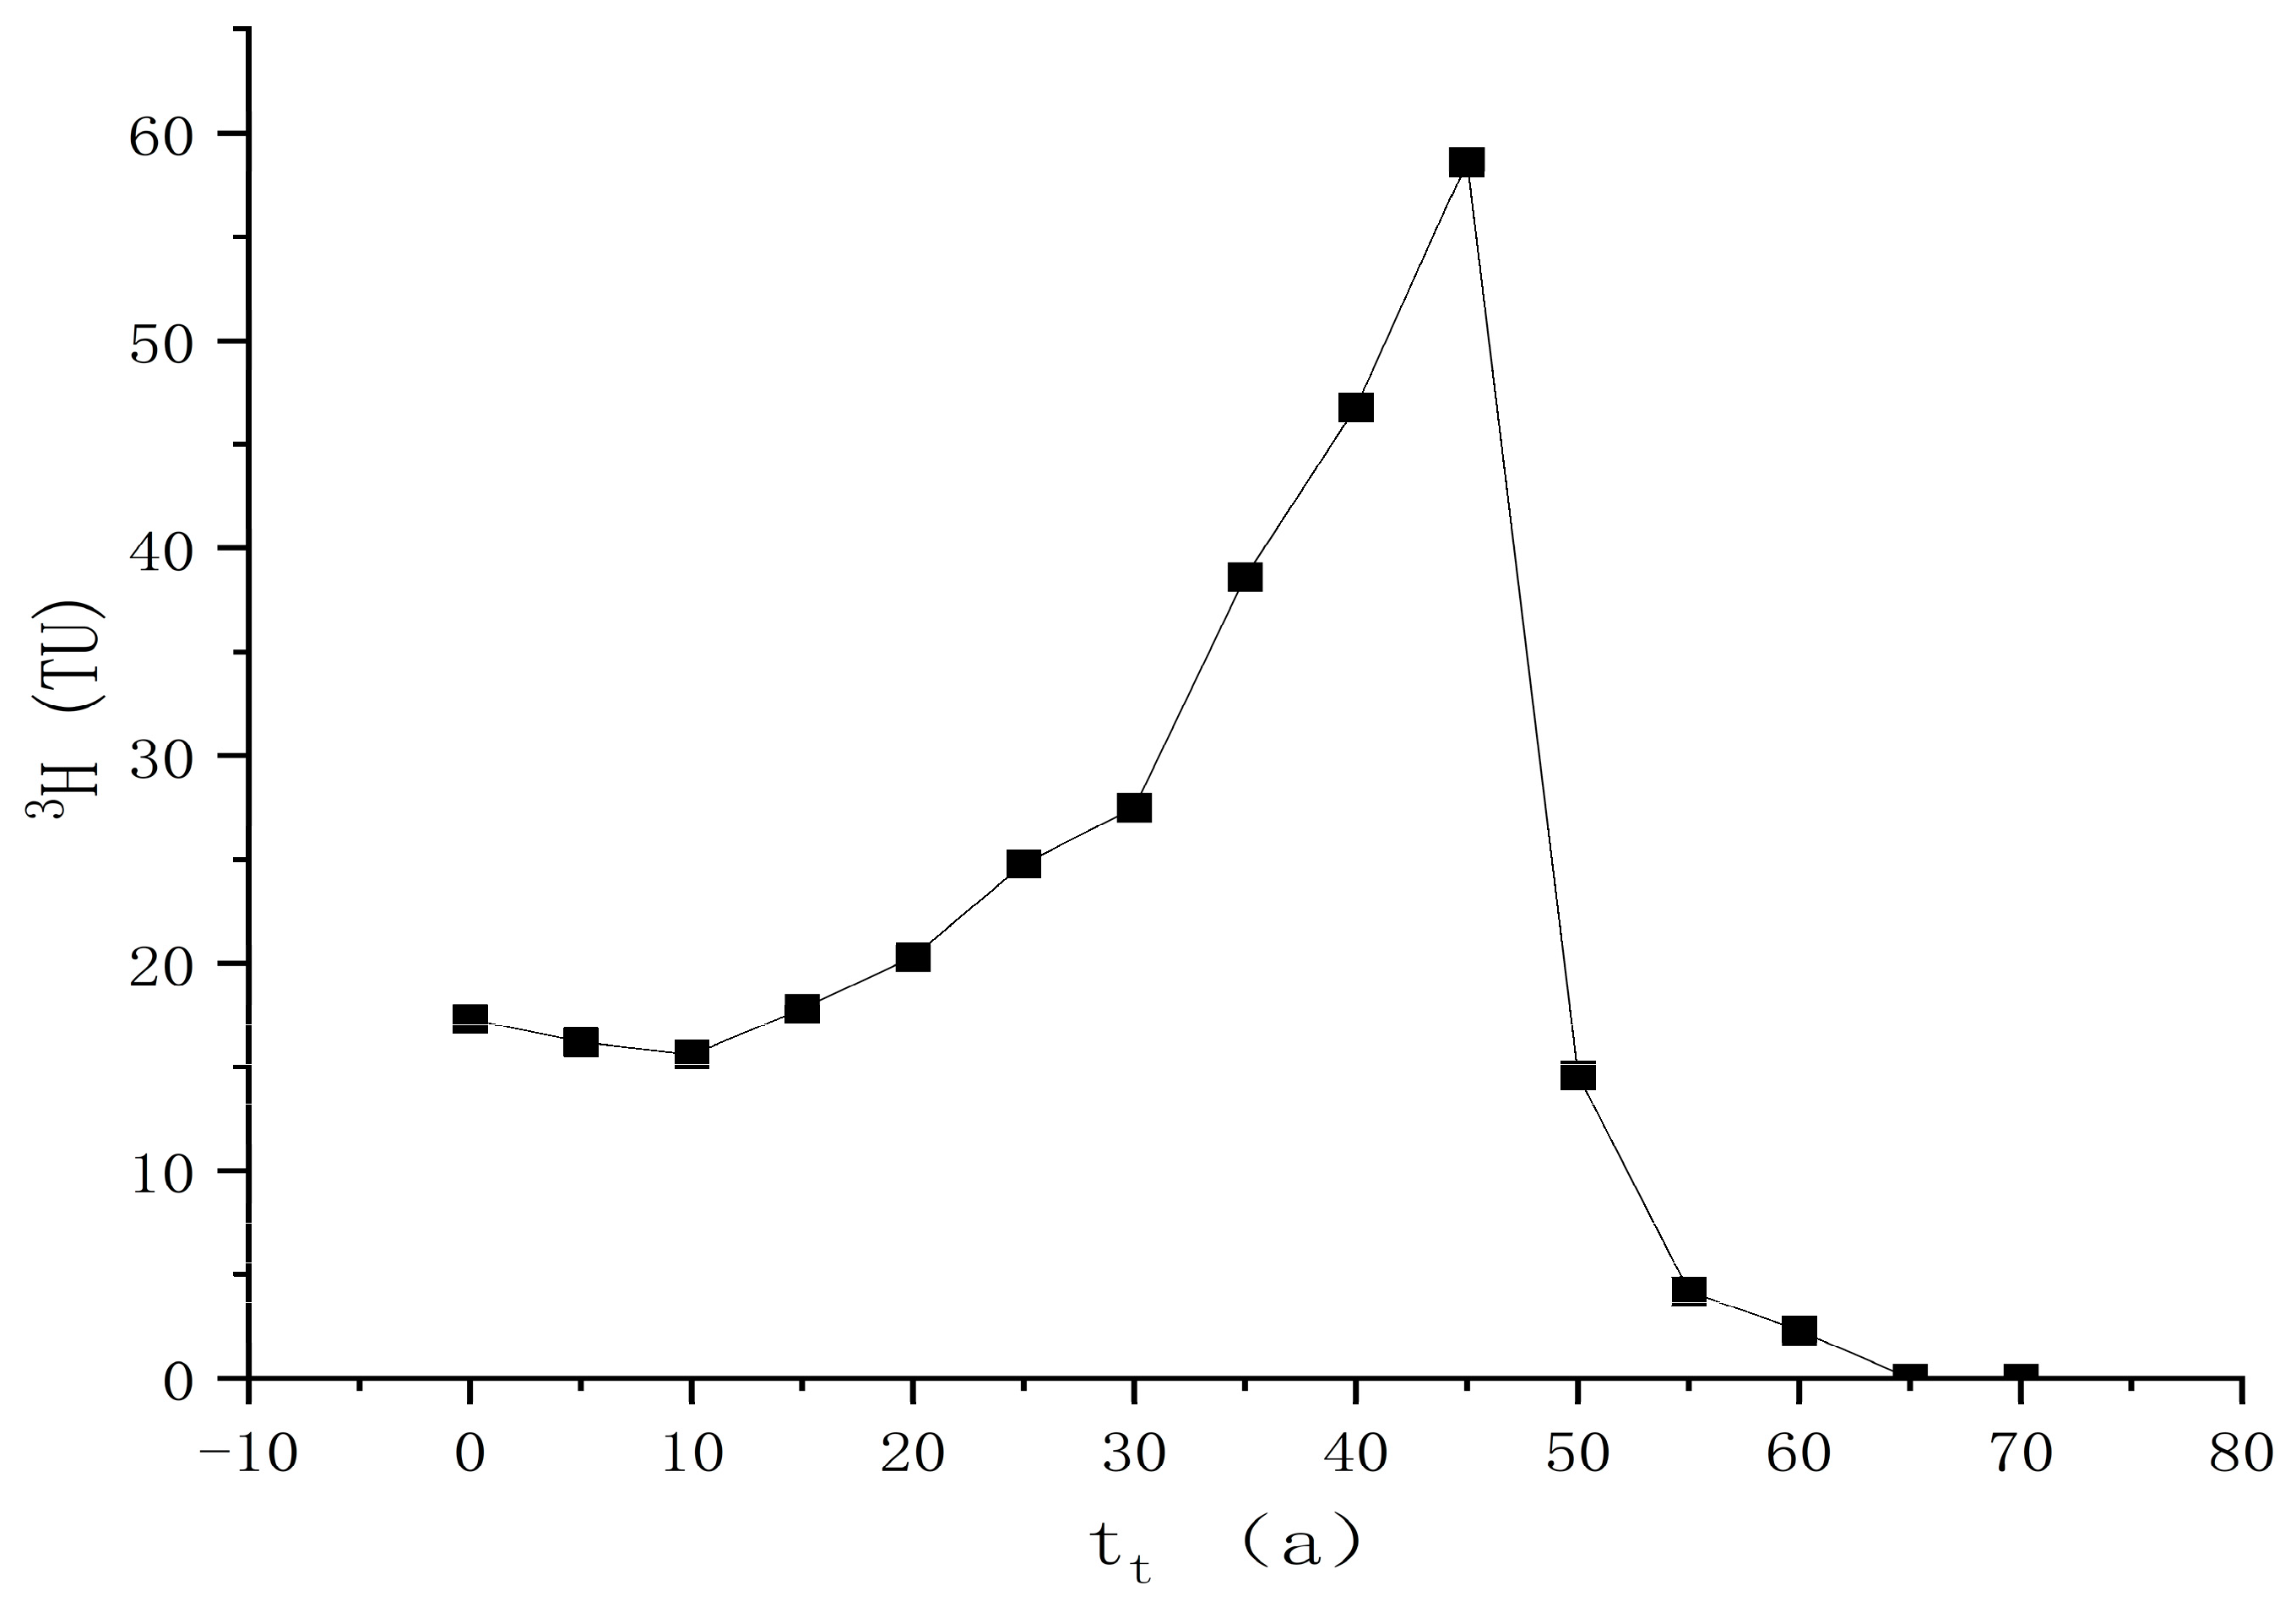
4.3.3. Age Calculation of Geothermal Water

The Tritium (3H) Physical Mathematical Model is used to estimate the age of the phreatic water in the research area. It is assumed that under the condition of steady flow (the variation of groundwater flow velocity can be ignored), 3H transfer in the groundwater system obeys the linear rule. Thus, the groundwater system can be conceptualized as a linear lumped-parameter system; 3H transfers between the input and output are subject to the following model [26] (Equation (6)):
C o u t t = C i n t t g t e λ t d t
where t is sampling time, t′ is 3H migration time; λ is the decay coefficient of 3H (0.055764); Cout(t) and Cin(tt′) 3H are the output and input concentration in groundwater system, respectively; g(t′) is the distribution function of groundwater age.
Hydrogeological conditions of the research area indicate that the exponential model (EM) can be used to represent the distribution function of groundwater age. The model assumes that the groundwater with different ages is mixed uniformly at any time in the groundwater system, and the output content is equal to the average content of the groundwater [27], which is expressed as (where tt is the average residence time of the tracer).
g t = t t 1 e x p ( t t t )
Groundwater samples were collected in September 2023, so t = 2023, t′ = 1953, tt′ = 70 years. Thus, Equation (7) can be written as (Equation (8)):
C o u t t = 1 t t t = 0 70 C i n ( t t ) e t ( 1 t t + 0.055764 )
Jiao et al. studied the isotope characteristics of Lop Nur brine and restored the precipitation tritium values since 1952 [28]. This work will use some of its data to supplement the tritium recovery value of precipitation in the study area since 1952 (Figure 6).
According to the input concentration of atmospheric precipitation Cin(tt′) and a set of average residence time (tt), the 3H output concentration Cout(t) under different tt conditions can be obtained, which is plotted in Figure 7. Then, the fitting point (average duration of stay in phreatic water) corresponding to the measured 3H value of the sample is found (Table 3). According to Figure 7, the best fitting points of each water sample can be drawn, which receive recharge within 47–54 years, respectively, while DF14-Au1-1 is in a relatively closed environment and does not receive recharge (Figure 7).

4.4. Estimation of Geothermal Reservoir Temperature

The geothermal geothermometer is a simple and effective method for estimating deep heat exchange. In the geothermal system, the migration of hot water from deep to shallow layers is always accompanied by the dissolution and precipitation reactions of various mineral phases. If multiple minerals converge and approach equilibrium within a small temperature range, it can be considered that these minerals have simultaneously reached dissolution equilibrium at that temperature. The temperature at this point is then referred to as the dissolution equilibrium temperature for these minerals [29]. Geothermal geothermometers mainly include the silica geothermometer, cation geothermometer, isotope geothermometer, multi-mineral equilibrium geothermometer, and gas geothermometer. Before using the geothermal geothermometer method for calculation, it is necessary to study the equilibrium state of geothermal water and minerals and select an appropriate and reliable geothermal geothermometer.

4.4.1. Cation Geothermometer

Before using the cation geothermometer, it is necessary to determine the degree of water–rock interaction of geothermal water during the flow process. Use the Na-K-Mg triangle diagram to determine the water–rock equilibrium state and whether there is mixing of shallow water. Putting the geothermal water in the study area into the Na-K-Mg triangle diagram (Figure 8), the water samples obtained in the Zaozigou area are all immature water, and the samples are all near the Mg angle. This shows that the geothermal water may be due to the mixing of shallow groundwater, which makes the element content in the geothermal water low, so the cation geothermometer cannot be used to estimate the heat storage temperature.

4.4.2. Silica Geothermometer

Silica is generally not easily affected by other ions and volatile components, and its content can remain relatively stable during the thermal fluid cooling process and is suitable for non-acidic, non-diluted geothermal fluid conditions at 20–250 °C [30,31]. The geothermal water samples in the study area are all immature waters, with a high degree of mixing with surface cold water, hence suitable for the silica geothermometer scale. The silica geothermometer scale method is divided into the quartz geothermal geothermometer and the chalcedony geothermal geothermometer. Generally speaking, the quartz geothermal geothermometer is suitable for geothermal conditions with higher heat exchange temperatures (120–180 °C), and chalcedony is used for low-temperature conditions (<110 °C). Craig et al., 2013; Fournier et al., 1977 established a geothermal geothermometer for the conductive cooling of hot water [32,33] (Equation (9)). The quartz geothermometer is
T = 1309 / ( 5.19 l g S i O 2 ) 273 .
S. Arnorsson proposed the calculation formula for the chalcedony geothermometer in 1975 [34] (Equation (10)). The chalcedony formula at 0–250 °C is as follows:
T = 1032 4.69 l g S i O 2 273.15
The results of calculating the heat geothermal reservoir temperature in the study area based on the quartz geothermometer and chalcedony geothermometer are as follows.
Based on the calculation results (Table 4), it is evident that the measured geothermal water temperatures are all higher than those measured by the chalcedony thermometer, indicating that the chalcedony thermometer is not applicable to the geothermal water samples in this study area. This discrepancy may be attributed to the dissolution degree of chalcedony.

4.4.3. Geothermal Reservoir Temperature Estimation

The lg(Q/K)-T method, also known as the mineral saturation index method, is commonly utilized to assess the equilibrium temperature of immature water by determining the saturation coefficient SI. When SI is greater than 0, it signifies mineral saturation in the water; when SI equals 0, it indicates minerals are either at saturation or in equilibrium post-dissolution; and when SI is less than 0, it suggests minerals have not yet fully dissolved [35]. This study focuses on six immature water samples, indicating the application of the lg(Q/K)-T method for estimating the heat exchange equilibrium temperature of these samples. Phreeqc (Version 3) software was employed to calculate the saturation index SI for various minerals such as chalcedony, chrysotile asbestos, quartz, talc, fluorite, gypsum, calcite, and amorphous SiO2 across a temperature range of 0–300 °C, with graphical representations produced for observation.
Among the minerals studied, most show tendencies toward thermal equilibrium within a narrow temperature range in geothermal waters, with chalcedony, chrysotile asbestos, and quartz demonstrating equilibrium temperatures ranging from 10 °C to 55 °C. Gypsum exhibits thermal equilibrium temperatures between 100 °C and 198 °C, while calcite reaches thermal equilibrium at 269 °C and above. The estimated thermal equilibrium temperatures align with those derived from the silica geothermometer, albeit generally lower. This discrepancy suggests a potential influence of hot and cold water mixing on mineral equilibria, leading to a downward trend in the saturation index. Consequently, the heat geothermal reservoir temperature ranges from 42.3 °C to 70.13 °C in the study area, displaying an east-west gradient at equivalent depths. The completion of the deep circulation of geothermal water in the eastern region indicates westward flow, transferring heat to rocks through the No. 21 ditch fault zone and contributing to a reduction in the heat geothermal reservoir temperature (Figure 9).

4.4.4. Silicon–Enthalpy Model

The use of the geothermal geothermometer depends on the equilibrium state of dissolved minerals. The Na-K-Mg triangle diagram (Figure 8) can determine the equilibrium state of water samples. As can be seen from the previous article, the Zaozigou geothermal water samples are all immature, and there is shallow groundwater mixing. Therefore, using the geochemical geothermometer method to calculate the heat geothermal reservoir temperatureof geothermal water will produce a certain deviation [36]. Therefore, this paper introduces the silicon–enthalpy model [37] (Equations (11) and (12)) to obtain accurate heat storage temperature.
H c · X + H h 1 X = H s
S i c · X + S i h 1 X = S i s
In the formula: Hc represents the enthalpy of the front cold water end member (cal/g), Hh represents the enthalpy of the hot water end member before mixing (cal/g), Hs represents the final enthalpy of spring water (cal/g), Sic and Sih respectively Indicate the SiO2 content of the cold water unit before mixing (mg/L) and the SiO2 content of the hot water unit before mixing (mg/L). Sis is the measured SiO2 value of spring water (mg/L), and X is the mixing ratio of underground cold water.
Put the SiO2 content at different temperatures into the formula to get the corresponding X value. The silicon–enthalpy model of the study area estimates the heat geothermal reservoir temperature to be 106–246 °C and the cold water mixing ratio to be 83.2–94.5% (Table 3). Upon comparison, both the cation geothermometer and lg(Q/K)-T method estimate temperatures lower than those estimated by the silicon–enthalpy mixing model. This is because the former two methods estimate the temperature of thermal reservoirs with the addition of shallow cold waters, while the silicon–enthalpy mixing model eliminates the effect of cold water mixing, reflecting the temperature of thermal reservoirs before deep geothermal water mixing, which represents the maximum value of geothermal reservoir temperatures [38].

4.5. Geothermal Water Circulation Depth
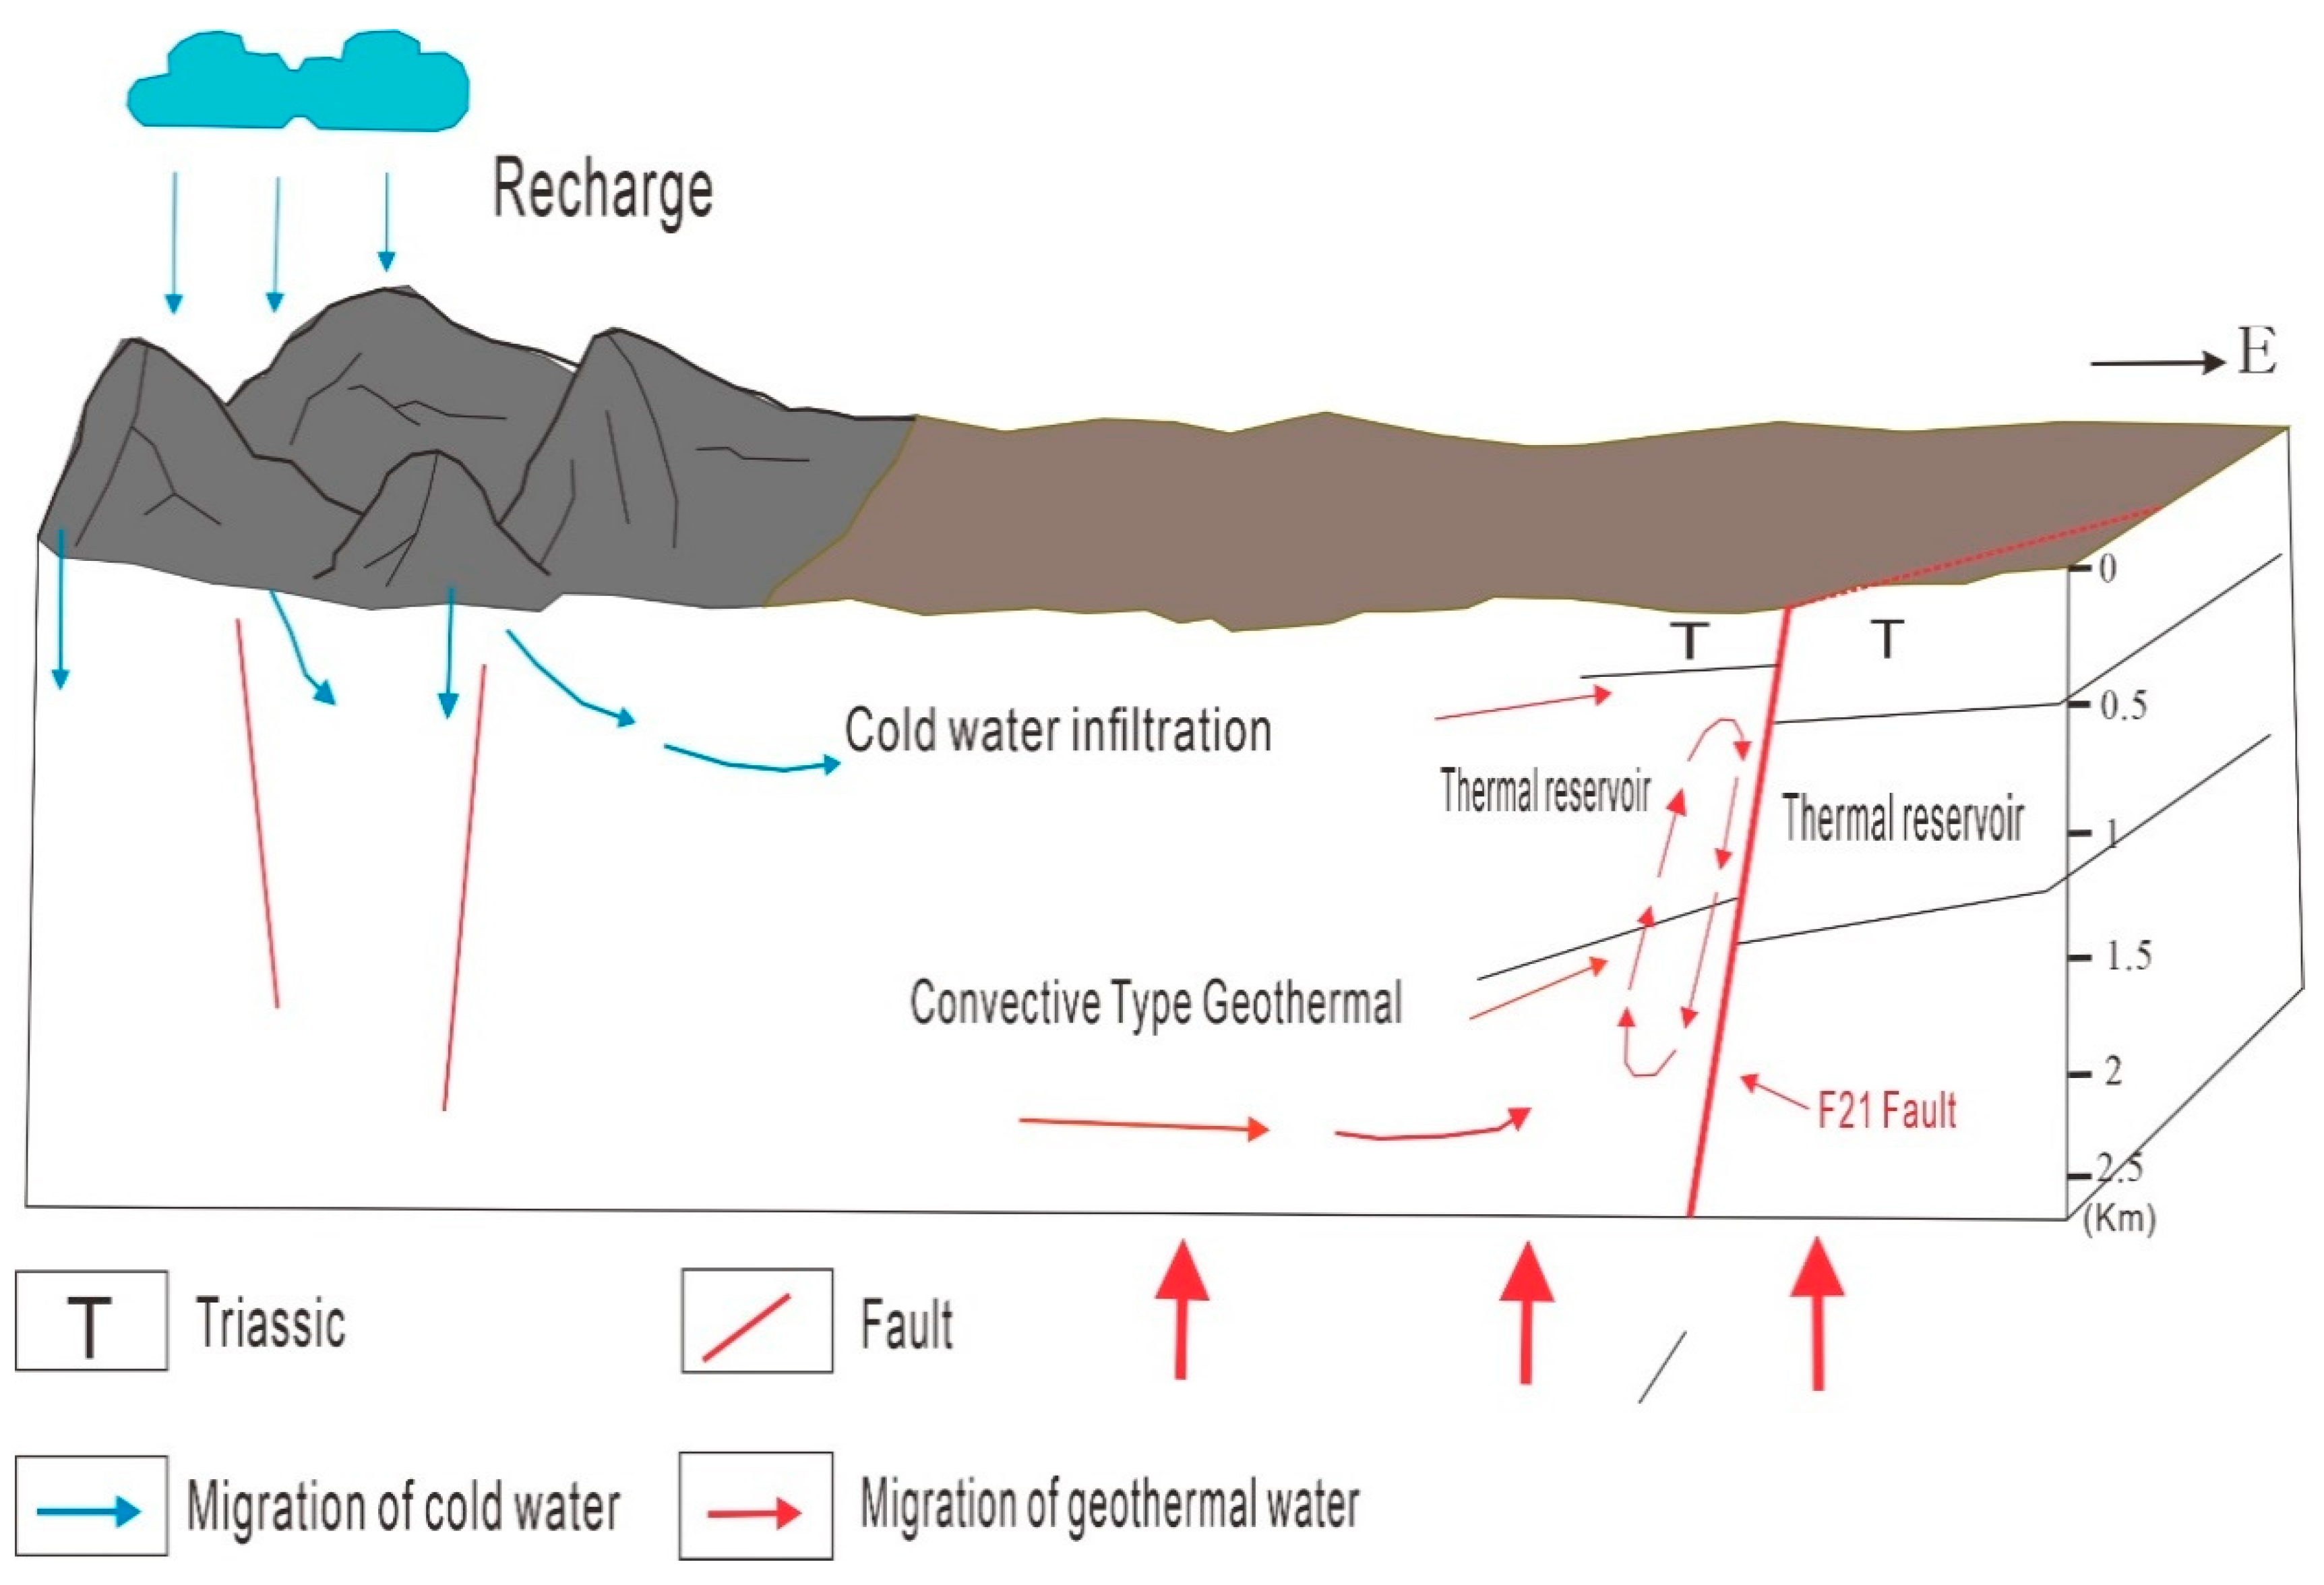
Groundwater temperature often has a linear relationship with underground circulation depth. Generally, the deeper the underground circulation depth, the higher the groundwater temperature (Equation (13)). The formula for calculating the depth of groundwater circulation is as follows:
H = T 1 T 0 t + h 0
In the formula, H is the circulation depth (m); T1 is the calculated heat geothermal reservoir temperature (°C); T0 is the constant temperature point temperature, the research area is 14 °C; h0 is the constant temperature point depth, the research area is 70 m; t is the geothermal gradient, the value in the study area is 3.0 °C/100 m [39].
Calculated from the above formula, we know that the groundwater circulation depth in the study area is 900–2000 m, of which the geothermal water circulation depth in the east is 900–1500 m, the geothermal water circulation depth in the middle is 1400–2000 m, and the geothermal water circulation depth in the south is 1100–1200 m. The geothermal water gradually deepens from the east to the middle and gradually becomes shallower from the middle to the south.

5. Discussion

Ion ratio analysis and hydration characteristics indicate that the main sources of ions in geothermal water are the dissolution of carbonate minerals and rock salt. Hydrogen and oxygen stable isotope characteristics suggest that geothermal water is primarily replenished by atmospheric precipitation. Furthermore, tritium isotope data indicate that geothermal water is a mixture of modern and ancient water. Over the past decade, rainwater from the nearby mountainous areas has been infiltrating the geothermal reservoir through cracks or fissures, initiating deep circulation. During this process, rocks are continuously heated by the deep-seated thermal flow emanating from the underlying faults, causing minerals such as rock salt, calcite, and gypsum to dissolve and filter into the surrounding rocks, resulting in geothermal waters with a chemical composition of SO4-Na. The circulation depth ranges from 900 to 2000 m, with reservoir temperatures ranging from 55 to 246 °C.
Specific analysis indicates that the geothermal system in the Zaozigou area functions as a low-temperature conduction–convection composite hydrothermal system. The regional flow of geothermal water typically progresses from east to west, aligning closely with the direction of surface water runoff. Atmospheric precipitation serves as the primary source of geothermal water, originating from the mountainous terrain in northern Zaozigou. This process is initiated by precipitation seeping into the Yanshan intrusive rock thermal reservoir via structural cracks and northeast–southwest regional faults, resulting in the formation of deep geothermal water. Groundwater flow from east to west gradually assimilates thermal energy from the adjacent rocks within the context of geothermal activity. Initially deeper from west to east, the circulation depth of geothermal water peaks in the central region at 2000 m, with heat geothermal reservoir temperature exceeding 70 °C and the highest geothermal reservoir temperature prior to mixing may reach 200 °C. Influenced by a northeast-trending fault, deep geothermal water migrates towards the surface through fracture zones, blending with cold surface water and gradually cooling before emergence. The ratio of cold water mixing ranges from 83.2% to 94.5%. Despite cooling during mixing, the temperature of geothermal water within the thermal reservoir remains notably elevated, further heating through runoff within the reservoir (Figure 10).

6. Conclusions

This study primarily examines the chemical characteristics of Zaozigou geothermal water, encompassing water chemistry properties, isotopic composition, heat storage temperature, and circulation depth, and introduces a conceptual model for Zaozigou geothermal water. By analyzing water samples, we conducted a comprehensive evaluation of the chemical features, principal components, and correlations in Zaozigou geothermal water. Isotope analysis enabled a preliminary assessment of the water source elevation, atmospheric precipitation contribution, and water age. Preliminary evaluation of geothermal reservoir temperature employed a water–rock equilibrium state analysis using the multi-mineral balance method, SiO2 geothermometer method, and silicon–enthalpy mixing model for comparison. The multi-mineral equilibrium method was deemed suitable for qualitative assessment, while the latter two methods closely resembled actual measurements. Circulation depth determination predominantly reflected the characteristics of the main aquifers in Zaozigou; however, further data is required for robust research outcomes.
Based on water chemical properties, two distinct types were identified: shallow circulation low Total Dissolved Solids (TDS) bicarbonate water and deep circulation high TDS sulfuric water, underpinning the preliminary discussion on deep and shallow geothermal circulation mechanisms in the area. A conceptual model elucidating the origin and chemical composition of geothermal water in Zaozigou was proposed, shedding light on its distribution and characteristics. The gradient of geothermal water geothermal reservoir temperature in Zaozigou progressively deepens from east to west, peaking in the central section and decreasing towards the west, signifying significant heating in the central region due to potential heat storage mechanisms. The westward flow experiences conductive and mixing cooling processes, with mixing cooling predominating.
The Zaozigou spring originates from an ancient hydrothermal system characterized by geothermal brine that undergoes mixing-induced re-equilibration as it ascends through fractures, leading to precipitation of carbonates, iron oxyhydroxides, and quartz upon reaching the surface. Given the limited and dispersed sampling points in this study, future research will be aimed at supplementing relevant data to enhance the understanding of the chemical characteristics and genesis of Zaozigou water, offering valuable insights for geothermal studies in similar regions, and contributing to the sustainable development of energy.

Author Contributions

Conceptualization, Y.W.; Methodology, Y.W. and A.C.; Software, Y.W.; Validation, Y.W. and A.C.; Formal analysis, Y.W. and A.C.; Investigation, Y.W., B.L. and A.C.; Resources, B.L. and A.C.; Data curation, Y.W.; Writing—original draft, Y.W.; Writing—review & editing, B.L. and A.C.; Visualization, B.L.; Supervision, A.C.; Funding acquisition, B.L. All authors have read and agreed to the published version of the manuscript.

Funding

This research received no external funding.

Institutional Review Board Statement

Not applicable.

Informed Consent Statement

Not applicable.

Data Availability Statement

The original contributions presented in the study are included in the article, further inquiries can be directed to the corresponding authors.

Conflicts of Interest

The authors declare no conflict of interest.

References

  1. Li, W.; Kong, X.J.; Yuan, L.J.; Gao, J.; Shen, P.F.; Feng, H.; Hao, W.J.; He, Y.C. General situation and suggestions of development and utilization of geothermal resources in China. China Min. Mag. 2020, 29, 22–26. [Google Scholar]
  2. Zhao, Q.; Luo, Z.; Du, J.; Wang, L.; Li, Z.; Wang, X. Hydrogeochemical characteristics and genesis of geothermal water in Xiaoyangkou, Nantong, China. Environ. Earth Sci. 2023, 82, 456. [Google Scholar] [CrossRef]
  3. Xing, Y.; Yu, H.; Liu, Z.; Li, J.; Liu, S.; Han, S.; Wang, G. Study on Chemical Genesis of Deep Geothermal Fluid in Gaoyang Geothermal Field. Front. Earth Sci. 2022, 9, 787222. [Google Scholar] [CrossRef]
  4. Procesi, M.; Marini, L.; Cinti, D.; Sciarra, A.; Basile, P.; Mazzoni, T.; Zarlenga, F. Preliminary fluid geochemical survey in Tete Province and prospective development of geothermics in Mozambique. Geotherm. Energy 2022, 10, 2. [Google Scholar] [CrossRef]
  5. Apollaro, C.; Fuoco, I.; Gennaro, E.; Giuliani, L.; Iezzi, G.; Marini, L.; Vespasiano, G. Advanced argillic alteration at Cave di Caolino, Lipari, Aeolian Islands (Italy): Implications for the mitigation of volcanic risks and the exploitation of geothermal resources. Sci. Total Environ. 2023, 889, 164333. [Google Scholar] [CrossRef] [PubMed]
  6. Li, B.X.; Shi, X. The control of basin mountain structure pattern on the distribution of geothermal field and the types of geothermal resources in Gansu Province. In Proceedings of the International Geothermal Society Western Pacific Papers, Chengdu, China, 1 September 2009. [Google Scholar]
  7. An, Y.; Sun, Z.X.; Li, B.X. Distribution characteristics, development status and prospect of geothermal resources in Gansu Province. Acta Geol. Gansu 2005, 14, 70–75. [Google Scholar]
  8. Zhen, X.M.; Wang, D.Y.; Li, F.J. Analysis of geological conditions on geothermal and the conceptual model of geothermal reservoir in Lanzhou-Minhe Basin. Northwestern Seismol. J. 2003, 3, 215–220. [Google Scholar]
  9. Bai, F.; Ma, G. Analysis on the occurrence characteristics of geothermal resources in Lanzhou. Hydrogeol. Eng. Geol. 2005, 32, 3–5. [Google Scholar]
  10. Zhang, Z.X.; Li, W.X. Genetic model and geological model of geothermal water in Yongdeng County, Lanzhou City. Geol. Sci. Technol. Inf. 2015, 34, 194–220. [Google Scholar]
  11. Ding, H.W.; Yao, J.L.; He, J.H. Environmental isotope characteristics and groundwater recharge in groundwater level rise area in Zhangye City. Arid Land Geogr. 2009, 32, 1–8. [Google Scholar]
  12. Wang, C.; Zhang, J.; Dong, Z.; Qin, X.; Wang, Y. Glacier meltwater runoff process analysis based on δD and δ18O isotope and chemistry in the Laohugou glacier basin of the Qilian Mountains. Arid Land Geogr. 2015, 38, 927–935. [Google Scholar]
  13. Gao, Z.R.; Li, H.Y.; Cao, S.C.; Liu, K.F.; Wang, K. Deep ground temperature variation and mutation of the Hexi Corridor region in recent 31 years. Arid Land Geogr. 2013, 36, 1006–1012. [Google Scholar]
  14. Gao, Z. Discussion on feature of isotope component from atmospheric water, groundwater and underground water in Northwest area, China. Acta Geol. Gausu 1993, 2, 94–101. [Google Scholar]
  15. Jiang, Y.; Jin, G.; Liao, S.; Zhou, Q.; Zhao, P. Geochemical and Sr-Nd-Hf isotopic constraints on the origin of Late Triassic granitoids from the Qinling orogen, central China: Implications for a continental arc to continent-continent collision. Lithos 2010, 117, 183–197. [Google Scholar] [CrossRef]
  16. Qiu, K.F.; Yu, H.C.; Deng, J.; McIntire, D.; Gou, Z.Y.; Geng, J.Z.; Chang, Z.S.; Zhu, R.; Li, K.N.; Goldfarb, R. The giant Zaozigou Au-Sb deposit in West Qinling, China: Magmatic- or metamorphic-hydrothermal origin? Miner. Depos. 2020, 55, 345–362. [Google Scholar] [CrossRef]
  17. Dong, Y.P.; Zhang, G.W.; Neubauer, F.; Liu, X.M.; Genser, J.; Hauzenberger, C. Tectonic evolution of the Qinling orogen, China: Review and synthesis. J. Asian Earth Sci. 2011, 41, 213–237. [Google Scholar] [CrossRef]
  18. Qiu, K.F.; Deng, J. Petrogenesis of granitoids in the Dewulu skarn copper deposit:implications for the evolution of the Paleotethys ocean and mineralization in western Qinling, China. Ore Geol. Rev. 2017, 90, 1078–1098. [Google Scholar] [CrossRef]
  19. Sui, J.X.; Li, J.W.; Jin, X.Y.; Vasconcelos, P.; Zhu, R. 40Ar/39Ar and U-Pb constraints on the age of the Zaozigou gold deposit, Xiahe-Hezuo district, West Qinling orogen, China: Relation to Early Triassic reduced intrusions emplaced during slab rollback. Ore Geol. Rev. 2018, 101, 885–899. [Google Scholar] [CrossRef]
  20. Li, K.; Li, H.; Jia, R.; Yan, K.; Li, P.; Wang, T.; Wei, L. Construction of the geological model of “Trinity” prospecting prediction in Zaozigou gold deposit, Gansu Province. Miner. Explor. 2019, 10, 1397–1408. [Google Scholar]
  21. GB/T11615-2010; Geologic Exploration Standard of Geothermal Resources. Chinese Standard Press: Beijing, China, 2011.
  22. Güler, C.; Thyne, G.D.; McCray, J.E.; Turner, K.A. Evaluation of graphical and multivariate statistical methods for classification of water chemistry data. Hydrogeol. J. 2002, 10, 455–474. [Google Scholar] [CrossRef]
  23. Zhu, J.; Hu, K.; Lu, X.; Huang, X.; Liu, K.; Wu, X. A review of geothermal energy resources, development, and applications in China: Current status and prospects. Energy 2015, 93, 466–483. [Google Scholar] [CrossRef]
  24. Craig, J.; Absar, A.; Bhat, G.; Cadel, G.; Hafiz, M.; Hakhoo, N.; Kashkari, R.; Moore, J.; Ricchiuto, T.E.; Thurow, J.; et al. Hot springs and the geothermal energy potential of Jammu & Kashmir State, N.W. Himalaya, India. Earth-Sci. Rev. 2013, 126, 156–177. [Google Scholar] [CrossRef]
  25. Zhang, H.P.; Liu, E.K.; Wang, D.S.; Jia, Y.K.; Sun, J.C. Composition of stable isotopes of precipitation and controlling factors in China. Bull. Inst. Hydrogeol. Eng. Geol. CAGS 1991, 7, 101–109. [Google Scholar]
  26. Maloszewski, P.; Zuber, A. Comment on “Convergent radial dispersion in a double-porosity aquifer with fracture skin: Analytical solution and application to a field experiment in fractured chalk” by Allen F. Moench. Water Resour. Res. 1997, 33, 497–500. [Google Scholar] [CrossRef]
  27. Maloszewski, P.; Zuber, A. On the calibration and validation of mathematical models for the interpretation of tracer experiments in groundwater. Adv. Water Resour. 1994, 15, 173–190. [Google Scholar] [CrossRef]
  28. Jiao, P.C.; Wang, E.L.; Liu, C.L. Characteristics and origin oftritium in the potassium-rich brine in Lop Nur, Xinjiang. Nucl. Tech. 2004, 27, 710–715. [Google Scholar]
  29. Guo, J.; Mao, X.; Tong, S.; Feng, L. Using hydrochemical geothermometers calculate exchange temperature of deep geothermal system in west coastal area of Guangdong Province. Earth Sci.-J. China Univ. Geosci. 2016, 41, 2075–2087. [Google Scholar]
  30. Xu, S.; Guo, Y. Fundamentals of Geothermics; Science Press: Beijing, China, 2009. [Google Scholar]
  31. Yu, H.; Liu, Z.; Rong, F.; Chen, K.; Nan, D.; Liu, S.J.; Liu, S. Characteristics and Source Mechanism of Geothermal Field in Cuona, Tibet. Bull. Geol. Sci. Technol. 2021, 40, 34–44. [Google Scholar] [CrossRef]
  32. Giggenbach, W.F. Geothermal solute equilibria. Derivation of Na-K-Mg-Ca geoindicators. Geochim. Cosmochim. Acta 1988, 52, 2749–2765. [Google Scholar] [CrossRef]
  33. Wang, X.; Wang, G.; Lu, C.; Gan, H.; Zhao, L. Evolution of Deep Parent Fluids of Geothermal fields in the Nimu–Nagchu Geothermal belt, Tibet, China. Geothermics 2018, 71, 118–131. [Google Scholar] [CrossRef]
  34. Arnorsson, S. Application of the silica geothermometer in low temperature hydrothermal areas in Iceland. Am. J. Sci. 1975, 275, 763–784. [Google Scholar] [CrossRef]
  35. Song, X.Q.; Peng, Q.; Duan, Q.S.; Xia, Y.L. Hydrochemistry characteristics and origin of geothermal water in northeastern Guizhou. Earth Sci. 2019, 44, 2874–2886. [Google Scholar]
  36. Wang, Y. A Research on Geochemical Characteristics of Geothermal Fluids in Southeast Yunnan Province, China; Institute of Geophysics, China Earthquake Administration: Beijing, China, 2021. [Google Scholar]
  37. Fournier, R.O.; Truesdell, A.H. Geochemical indicators of subsurface temperature. Part II. Estimation of temperature and fraction of hot water mixed with cold water. J. Res. US Geol. Surv. 1974, 2, 263–270. [Google Scholar]
  38. Lang, X.J.; Lin, W.J.; Liu, Z.M.; Xing, L.; Wang, G. Hydrochemical characteristics of geothermal water in Guide Basin. Earth Sci. 2016, 41, 1723–1734. [Google Scholar]
  39. Xie, N.; Yu, S.; Ding, H.; Zhang, M. Occurrence features of geothermal resources and geothermal potential assessment in Gansu Province. Geol. China 2020, 47, 1804–1812, (In Chinese with English abstract). [Google Scholar]
Figure 1. (A) Simplified map showing geotectonic terranes in the Qinling orogen with the location of the study area (simplified from Dong et al., 2011 [17]). (B) Geologic map of the Xiahe–Hezuo district showing major Au, Au-Cu, and Sb-Hg deposits and associated granitoid intrusions (after Qiu and Deng, 2017 [18]). (C) Sampling distribution in the Zaozigou area.
Sustainability 16 06790 g001
Figure 2. Piper diagram of water sample chemistry in the Zaozigou area.
Sustainability 16 06790 g002
Figure 3. Schoeller diagram of geothermal water chemistry in the Zaozigou area.
Sustainability 16 06790 g003
Figure 4. Stiff diagram of geothermal water chemistry in the Zaozigou area: (a) 12-DFJ8X-1; (b) DJ-14-1; (c) 14-Au1-1; (d) 14-M24-1: (e) 13-M24-1; (f) 13-Au17-2; (g) ZZGQS-1; (h) ZZH-1.
Sustainability 16 06790 g004
Figure 5. Distribution map of deuterium oxygen isotopes in surface and underground hot water.
Sustainability 16 06790 g005
Figure 6. 3H recovery curve of atmospheric precipitation in the Gansu Province.
Sustainability 16 06790 g006
Figure 7. 3H output concentration curve of Gansu area.
Sustainability 16 06790 g007
Figure 8. Na-K-Mg triangle diagram of geothermal water in the Zaozigou area.
Sustainability 16 06790 g008
Figure 9. Geothermal water lg(Q/K)-T diagram in Zaozigou area: (a) 12-DFJ8X-1; (b) DJ-14-1; (c) 14-Au1-1; (d) 14-M24-1: (e) 13-M24-1; (f) 13-Au17-2.
Sustainability 16 06790 g009
Figure 10. Schematic diagram of the genesis model in the Zaozigou area.
Sustainability 16 06790 g010
Table 1. Chemical and isotope composition of water samples.
Sample IDDepthTempPhTDSNa+K+Ca2+Mg2+ClSO42−HCO3CO32−Charge Balance
(m)(°C) (mg/L)(%)
13-M24-1538228.2178888.75.4284.370.112539928002.94
13-Au17-2582248.15924955.6511371.514.349433702.93
12-DFJ8X-1602268.095180599.410.320016112.3108615.501.09
14-Au1-1635328.1334863.83.0442.723.65.1738.533704.48
14-M24-1653408.2141473.511.8451298.210432302.66
DJ-14-1687208.01188615111.826030.925.1108139901.16
ZZH-1-117.942761448.3815843.816.97943301.41
ZZGQS-1-98.331111.61.5962.630.92.7210.734601.97
Table 2. Chemical characteristics of geothermal water in the Zaozigou area.
Serial NumberTyperNa+/rClrCl/rHCO3 + rCO32−
ZZHHS-1surface water13.1380.881
13-M24-1geothermal well10.9420.076
13-Au17-2geothermal well10.2440.096
12-DFJ8X-1geothermal well12.4610.082
14-Au1-1geothermal well19.0290.026
14-M24-1geothermal well13.8210.043
DJ-14-1geothermal well9.2760.108
ZZGQS-1hot spring6.5760.013
Table 3. Isotope data and recharge elevation in the Zaozigou area.
Sample IDδ18OδD3HRecharge
Elevation
Tum
Q1−65−9.814.0 ± 1.03117
CSJ-01−61−8.916.6 ± 1.13153
ZZH-1−65−9.613.1 ± 1.03152
ZZH-2−74−10.78.4 ± 0.93327
DF-14-Au-1−91−12.81.2 ± 0.63309
14-A15-1−82−11.85.3 ± 0.83334
Table 4. Calculation results of the water chemical geothermometer in the Zaozigou area.
Estimation Method13-M24-113-Au17-212-DFJ8X-114-Au1-114-M24-1DF-14-1
Quartz geothermometer (°C)42.347.4654.8159.9370.2739
Chalcedony geothermometer (°C)9.6914.8922.4327.7338.486.26
lg(Q/K)-T geothermometer (°C)424852557038
Silicon–enthalpy geothermometer (°C)152143161170246106
Cold water mixing ratio (%)91.389.190.491.494.583.2
Disclaimer/Publisher’s Note: The statements, opinions and data contained in all publications are solely those of the individual author(s) and contributor(s) and not of MDPI and/or the editor(s). MDPI and/or the editor(s) disclaim responsibility for any injury to people or property resulting from any ideas, methods, instructions or products referred to in the content.

