
Trade Liberalization and Pollutant Emissions: Micro Evidence from Chinese Manufacturing Firms

Abstract
1. Introduction
2. Literature Review
3. Data, Econometric Model, and Variables’ Measurement
3.1. Data
3.2. Econometric Model
3.3. Variables’ Measurement
4. Results and Analysis
4.1. Baseline Results
4.2. Robustness Checks
4.2.1. Other Policy Shocks and Omission of Important Variables
4.2.2. Experimental Group Identification
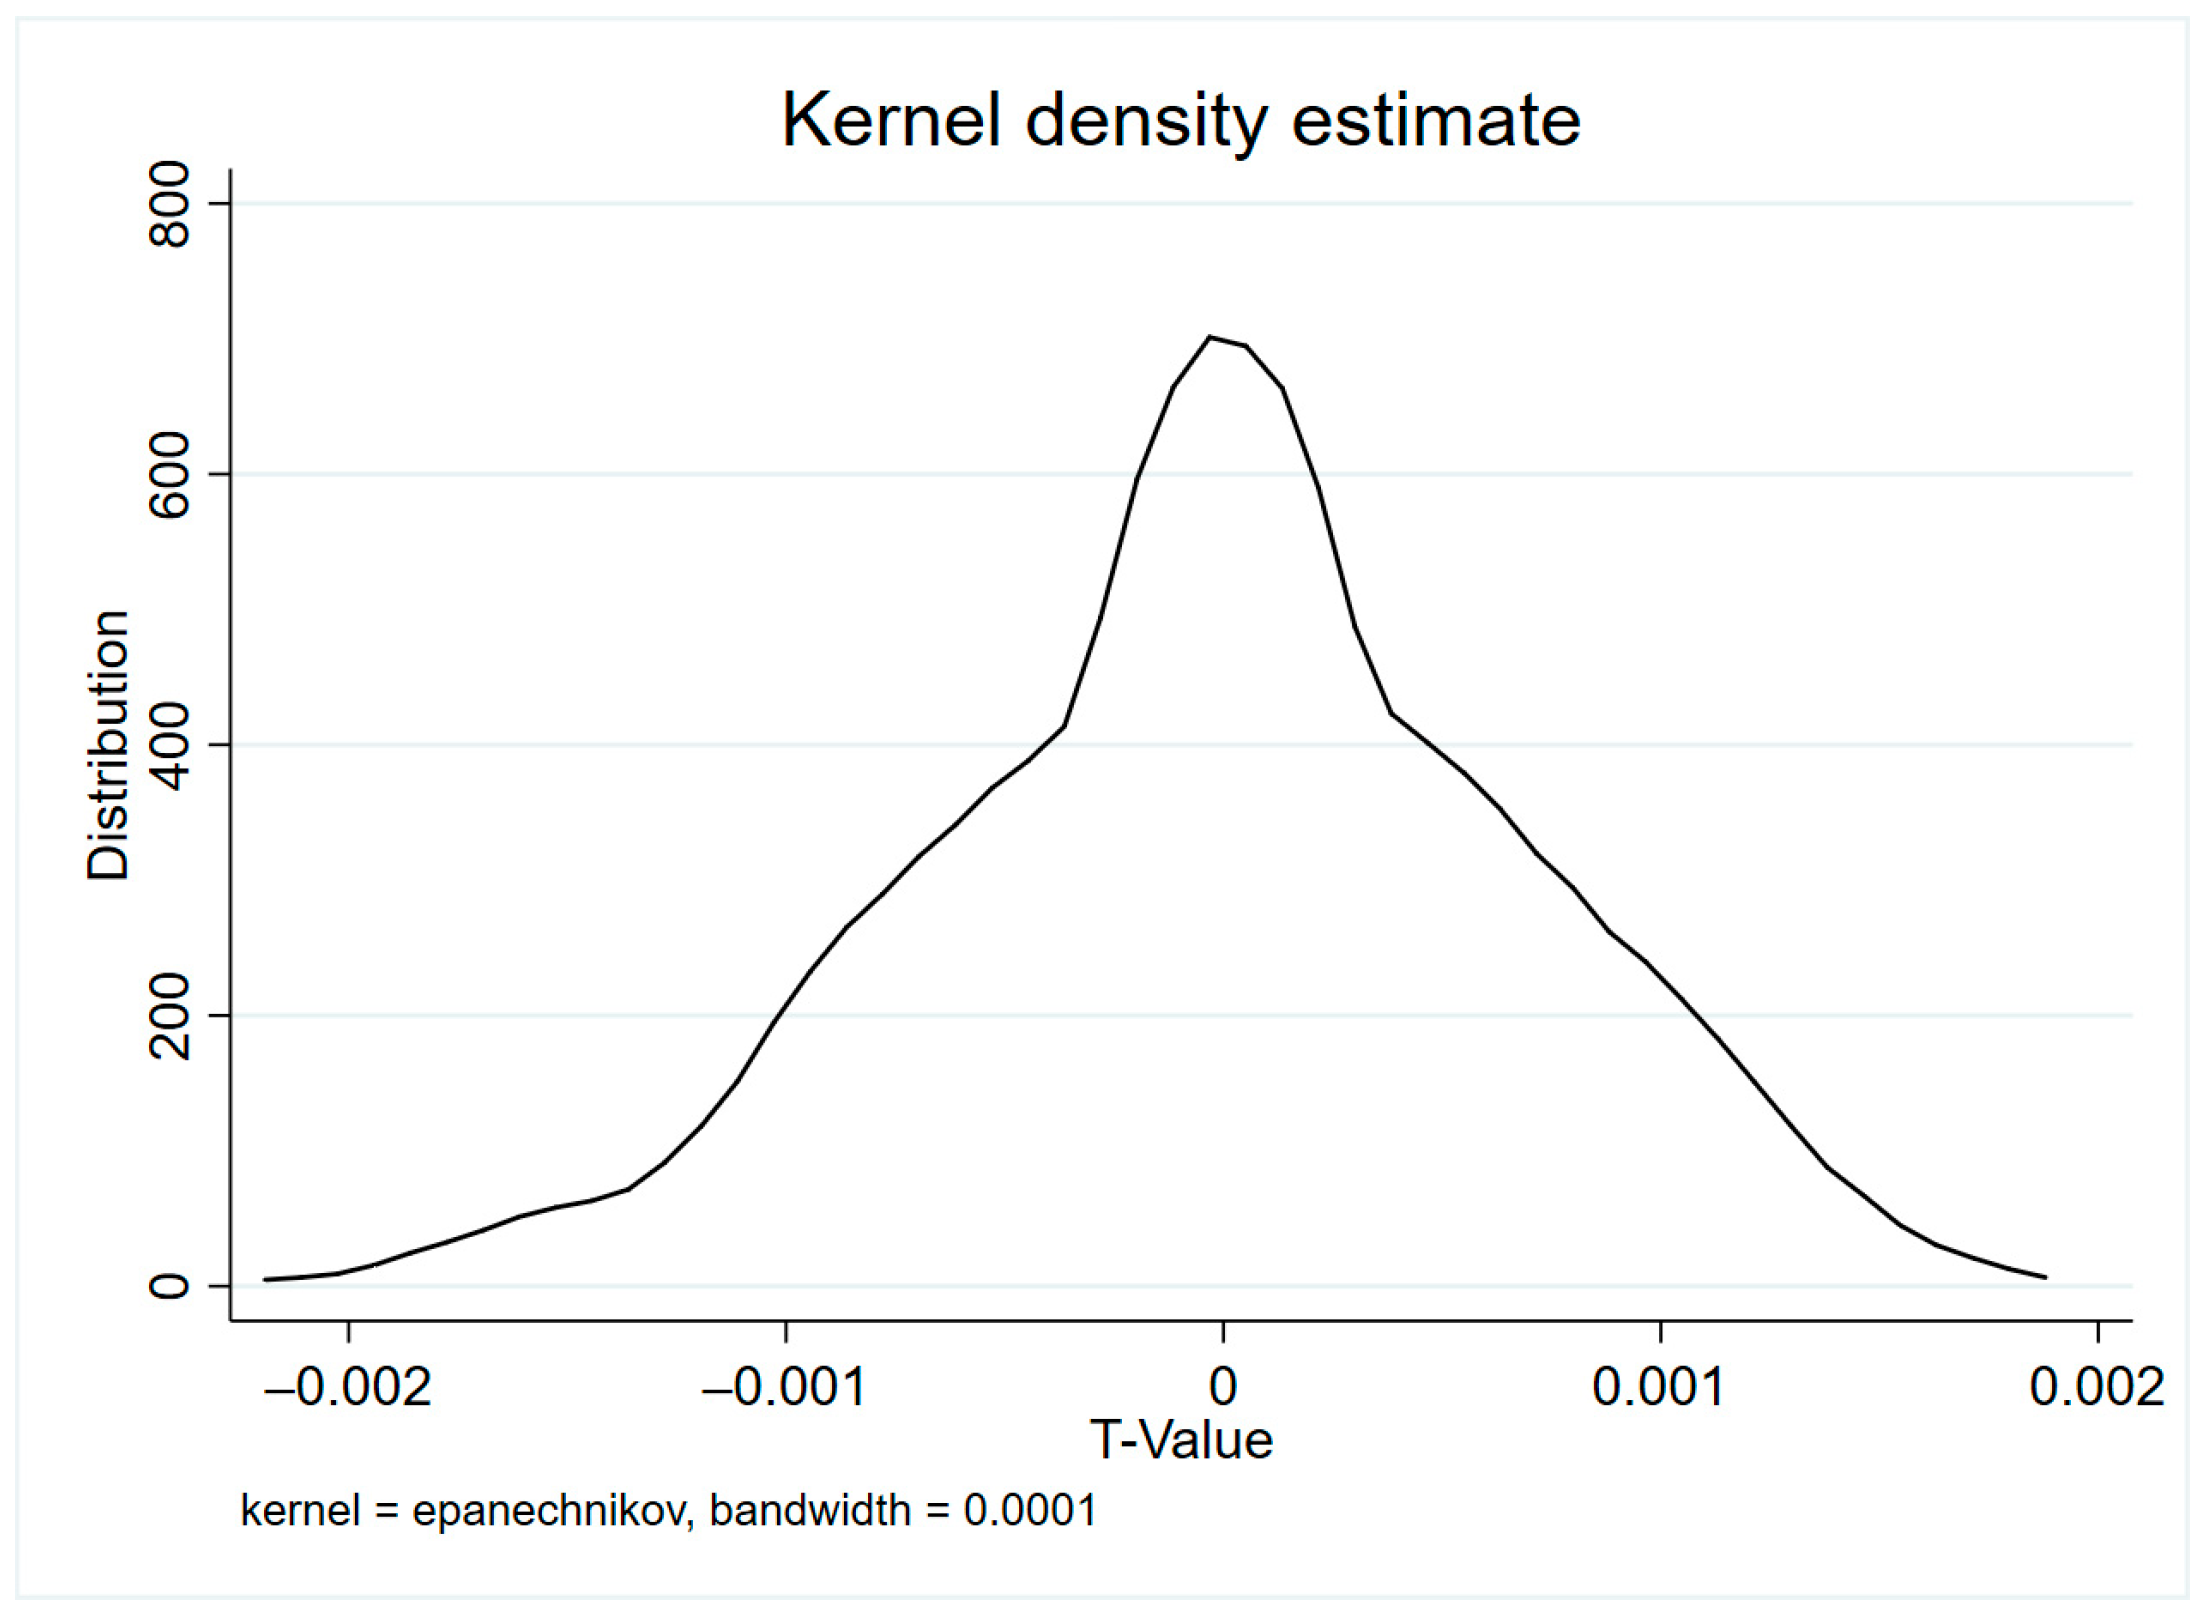
4.2.3. Placebo Testing
4.2.4. Parallel Trend Test
4.2.5. Metrics for Sub-Indicators of Enterprise Pollutant Release
4.2.6. Other Robustness Tests
5. Further Analysis
6. Conclusions and Implications
Author Contributions
Funding
Institutional Review Board Statement
Informed Consent Statement
Data Availability Statement
Conflicts of Interest
References
- Xu, Y.; Fan, X.; Zhang, Z.; Zhang, R. Trade liberalization and haze pollution: Evidence from China. Ecol. Indic. 2020, 109, 105825. [Google Scholar] [CrossRef]
- Gan, J. Effects of China’s WTO accession on global forest product trade. For. Policy Econ. 2004, 6, 509–519. [Google Scholar] [CrossRef]
- Levitt, C.J.; Saaby, M.; Sørensen, A. The impact of China’s trade liberalisation on the greenhouse gas emissions of WTO countries. China Econ. Rev. 2019, 54, 113–134. [Google Scholar] [CrossRef]
- Du, Y.; Lu, Y. The Great Opening up and the Roadmap for the Future: The Story of China’s International Trade. China World Econ. 2018, 26, 68–93. [Google Scholar] [CrossRef]
- Zheng, D.; Shi, M. Multiple environmental policies and pollution haven hypothesis: Evidence from China’s polluting industries. J. Clean. Prod. 2017, 141, 295–304. [Google Scholar] [CrossRef]
- Gumilang, H.; Mukhopadhyay, K.; Thomassin, P.J. Economic and environmental impacts of trade liberalization: The case of Indonesia. Econ. Model. 2011, 28, 1030–1041. [Google Scholar] [CrossRef]
- Wang, Z.; Li, C.; Liu, Q.; Niu, B.; Peng, S.; Deng, L.; Kang, P.; Zhang, X. Pollution haven hypothesis of domestic trade in China: A perspective of SO2 emissions. Sci. Total Environ. 2019, 663, 198–205. [Google Scholar] [CrossRef] [PubMed]
- Sun, C.; Zhang, F.; Xu, M. Investigation of pollution haven hypothesis for China: An ARDL approach with breakpoint unit root tests. J. Clean. Prod. 2017, 161, 153–164. [Google Scholar] [CrossRef]
- Liu, Z.; Song, P.; Mao, X. Accounting the effects of WTO accession on trade-embodied emissions: Evidence from China. J. Clean. Prod. 2016, 139, 1383–1390. [Google Scholar] [CrossRef]
- Copeland, B.R.; Taylor, M.S. North-South Trade and the Environment. In International Trade and the Environment; Routledge: London, UK, 2001; ISBN 978-1-315-20198-6. [Google Scholar]
- Dean, J.M. Does trade liberalization harm the environment? A new test. Can. J. Econ. Can. Déconomique 2002, 35, 819–842. [Google Scholar] [CrossRef]
- Duan, Y.; Ji, T.; Lu, Y.; Wang, S. Environmental regulations and international trade: A quantitative economic analysis of world pollution emissions. J. Public Econ. 2021, 203, 104521. [Google Scholar] [CrossRef]
- Edwards, S. Openness, Trade Liberalization, and Growth in Developing Countries. J. Econ. Lit. 1993, 31, 1358–1393. [Google Scholar]
- Antweiler, W.; Copeland, B.R.; Taylor, M.S. Is Free Trade Good for the Environment? Am. Econ. Rev. 2001, 91, 877–908. [Google Scholar] [CrossRef]
- Song, M.; Zhang, L.; An, Q.; Wang, Z.; Li, Z. Statistical analysis and combination forecasting of environmental efficiency and its influential factors since China entered the WTO: 2002–2010–2012. J. Clean. Prod. 2013, 42, 42–51. [Google Scholar] [CrossRef]
- Chen, S.; Lin, F.; Yao, X.; Zhang, P. WTO accession, trade expansion, and air pollution: Evidence from China’s county-level panel data. Rev. Int. Econ. 2020, 28, 1020–1045. [Google Scholar] [CrossRef]
- Ponce, P.; Oliveira, C.; Álvarez, V.; del Río-Rama, M.d.l.C. The Liberalization of the Internal Energy Market in the European Union: Evidence of Its Influence on Reducing Environmental Pollution. Energies 2020, 13, 6116. [Google Scholar] [CrossRef]
- Onwachukwu, C.I.; Yan, K.-M.I.; Tu, K. The causal effect of trade liberalization on the environment. J. Clean. Prod. 2021, 318, 128615. [Google Scholar] [CrossRef]
- Ma, T.; Wang, Y. Globalization and environment: Effects of international trade on emission intensity reduction of pollutants causing global and local concerns. J. Environ. Manag. 2021, 297, 113249. [Google Scholar] [CrossRef] [PubMed]
- Tan, H.; Sun, A.; Lau, H. CO2 embodiment in China–Australia trade: The drivers and implications. Energy Policy 2013, 61, 1212–1220. [Google Scholar] [CrossRef]
- Liu, J.; Qu, J.; Zhao, K. Is China’s development conforms to the Environmental Kuznets Curve hypothesis and the pollution haven hypothesis? J. Clean. Prod. 2019, 234, 787–796. [Google Scholar] [CrossRef]
- Liu, M.; Zhang, B.; Liao, X. Can trade liberalization promote green production? Evidence from China’s manufacturing enterprises. J. Asian Econ. 2022, 79, 101369. [Google Scholar] [CrossRef]
- Cui, J.; Tam, O.K.; Wang, B.; Zhang, Y. The environmental effect of trade liberalization: Evidence from China’s manufacturing firms. World Econ. 2020, 43, 3357–3383. [Google Scholar] [CrossRef]
- Zhang, K.; Wang, X. Pollution Haven Hypothesis of Global CO2, SO2, NOx—Evidence from 43 Economies and 56 Sectors. Int. J. Environ. Res. Public. Health 2021, 18, 6552. [Google Scholar] [CrossRef] [PubMed]
- Hu, X.; Pollitt, H.; Pirie, J.; Mercure, J.-F.; Liu, J.; Meng, J.; Tao, S. The impacts of the trade liberalization of environmental goods on power system and CO2 emissions. Energy Policy 2020, 140, 111173. [Google Scholar] [CrossRef]
- Bombardini, M.; Li, B. Trade, pollution and mortality in China. J. Int. Econ. 2020, 125, 103321. [Google Scholar] [CrossRef]
- He, L.-Y.; Lin, X.; Liu, Q. How Did Free Trade Reshape the Transitional China? Evidence from Heterogeneous Exporters and Firm-Level Pollution Emissions. Emerg. Mark. Financ. Trade 2020, 56, 1651–1676. [Google Scholar] [CrossRef]
- He, J. Pollution haven hypothesis and environmental impacts of foreign direct investment: The case of industrial emission of sulfur dioxide (SO2) in Chinese provinces. Ecol. Econ. 2006, 60, 228–245. [Google Scholar] [CrossRef]
- López, L.A.; Arce, G.; Kronenberg, T.; Rodrigues, J.F.D. Trade from resource-rich countries avoids the existence of a global pollution haven hypothesis. J. Clean. Prod. 2018, 175, 599–611. [Google Scholar] [CrossRef]
- Yi, Y.; Yu, X.; Sun, X. Will the liberalization of intermediate trade restrain corporate pollution emissions?—Empirical evidence from Chinese micro-enterprises. Appl. Econ. 2022, 54, 3521–3536. [Google Scholar] [CrossRef]
- Chen, X.; Shao, Y.; Zhao, X. Does export liberalization cause the agglomeration of pollution? Evidence from China. China Econ. Rev. 2023, 79, 101951. [Google Scholar] [CrossRef]
- Melitz, M.J. The Impact of Trade on Intra-Industry Reallocations and Aggregate Industry Productivity. Econometrica 2003, 71, 1695–1725. [Google Scholar] [CrossRef]
- Brandt, L.; Van Biesebroeck, J.; Zhang, Y. Creative accounting or creative destruction? Firm-level productivity growth in Chinese manufacturing. J. Dev. Econ. 2012, 97, 339–351. [Google Scholar] [CrossRef]
- Sun, C.; Li, B.; Chen, L.; Gao, Y.; Jin, J.; Gu, X.; Yang, Y.; Lou, Y.; Zhao, Y.; Liao, H. An improved hourly-resolved atmospheric NOx emission inventory of industrial sources based on Continuous Emission Monitoring System data: Case of Jiangsu Province, China. J. Clean. Prod. 2023, 419, 138192. [Google Scholar] [CrossRef]
- Le, D.; Ren, F.; Tang, Y.; Zhu, Y. The Effect of Environmental Policy Uncertainty on Enterprises’ Pollution Emissions: Evidence from Chinese Industrial Enterprise. Int. J. Environ. Res. Public. Health 2022, 19, 9849. [Google Scholar] [CrossRef] [PubMed]
- Liu, Q.; Ma, H. Trade policy uncertainty and innovation: Firm level evidence from China’s WTO accession. J. Int. Econ. 2020, 127, 103387. [Google Scholar] [CrossRef]
- Lu, Y.; Yu, L. Trade Liberalization and Markup Dispersion: Evidence from China’s WTO Accession. Am. Econ. J. Appl. Econ. 2015, 7, 221–253. [Google Scholar] [CrossRef]
- Feng, L.; Liao, W. Legislation, plans, and policies for prevention and control of air pollution in China: Achievements, challenges, and improvements. J. Clean. Prod. 2016, 112, 1549–1558. [Google Scholar] [CrossRef]
- Mao, Q.; Xu, J. Input trade liberalisation, institution and markup: Evidence from China’s accession to the WTO. World Econ. 2019, 42, 3537–3568. [Google Scholar] [CrossRef]
- Xue, B.; Mitchell, B.; Geng, Y.; Ren, W.; Müller, K.; Ma, Z.; Puppim De Oliveira, J.A.; Fujita, T.; Tobias, M. A review on China’s pollutant emissions reduction assessment. Ecol. Indic. 2014, 38, 272–278. [Google Scholar] [CrossRef]
- Olley, G.S.; Pakes, A. The Dynamics of Productivity in the Telecommunications Equipment Industry. Econometrica 1992, 64, 1263–1297. [Google Scholar] [CrossRef]
- Sivadasan, J. Barriers to Competition and Productivity: Evidence from India. BE J. Econ. Anal. Policy 2009, 9, 1–66. [Google Scholar] [CrossRef]


| Variables | Descriptions | Metrics | Data Sources |
|---|---|---|---|
| Final product tariff data | Simple arithmetic means of tariff levels in 2001 taken in logarithms | China Tariff Database | |
| Years after tariff reductions | 1 for 2002 and onward; 0 otherwise | ||
| Pollution | Pollutant emissions from enterprises | Use of PCA to construct a composite indicator of pollutant emissions | AESIF |
| TFP | Total factor productivity of enterprises | Total factor productivity of enterprises based on the OP method of calculation | ASIF |
| Size | Enterprise size | Logarithmic value of the number of employees in the enterprise | ASIF |
| Age | Number of years in business | Years of business establishment | ASIF |
| KL | Enterprise capital–labor ratio | Logarithm of the ratio of the firm’s capital stock to the number of employees | ASIF |
| Export | Export intensity of enterprises | Logarithm of the ratio of firms’ exports to sales | ASIF |
| SOE | State-owned enterprises | 1 for state-owned enterprises; 0 otherwise | ASIF |
| FIE | Foreign invested enterprises | 1 for foreign invested enterprises; 0 otherwise | ASIF |
| Subsidy | Intensity of corporate government subsidies | Logarithm of business subsidies as a share of value added | ASIF |
| State | Degree of nationalization of the industry | Percentage of the number of state-owned enterprises in the industry | ASIF |
| Competition | Degree of competition in the industry | Herfindahl index based on sales | ASIF |
| Explaining Variables | ||||
|---|---|---|---|---|
| (1) | (2) | (3) | (4) | |
| −0.040 *** (0.005) | −0.047 *** (0.004) | −0.045 *** (0.004) | −0.045 *** (0.004) | |
| TFP | −0.388 *** (0.004) | −0.388 *** (0.004) | −0.388 *** (0.004) | |
| Size | −0.090 *** (0.004) | −0.091 *** (0.004) | −0.091 *** (0.004) | |
| Age | 0.007 *** (0.002) | 0.006 *** (0.002) | 0.006 *** (0.002) | |
| KL | −0.013 *** (0.002) | −0.013 *** (0.002) | −0.013 *** (0.002) | |
| Export | 0.009 (0.013) | 0.009 (0.013) | 0.009 (0.013) | |
| SOE | 0.003 (0.003) | 0.003 (0.003) | ||
| FIE | −0.006 * (0.003) | −0.006 * (0.003) | ||
| State | 0.172 *** (0.033) | 0.170 *** (0.033) | ||
| Subsidy | 0.021 (0.049) | 0.022 (0.049) | ||
| Competition | −0.218 *** (0.084) | |||
| Year fixed effect | Yes | Yes | Yes | Yes |
| Firm fixed effect | Yes | Yes | Yes | Yes |
| Regional fixed effect | Yes | Yes | Yes | Yes |
| Industry fixed effect | Yes | Yes | Yes | Yes |
| 0.818 | 0.873 | 0.873 | 0.873 | |
| Observations | 174,634 | 174,634 | 174,634 | 174,634 |
| Explaining Variables | ||||
|---|---|---|---|---|
| (1) | (2) | (3) | (4) | |
| SEZ | Environmental Legislation | Industrial Policy | FDI | |
| −0.047 *** (0.005) | −0.045 *** (0.004) | −0.047 *** (0.004) | −0.045 *** (0.004) | |
| Legislation | −0.017 *** (0.004) | |||
| Policy | 0.022 *** (0.005) | |||
| FDI | 0.006 (0.013) | |||
| TFP | −0.386 *** (0.004) | −0.388 *** (0.004) | −0.388 *** (0.004) | −0.389 *** (0.004) |
| Size | −0.087 *** (0.005) | −0.091 *** (0.004) | −0.092 *** (0.004) | −0.091 *** (0.004) |
| Age | 0.006 ** (0.003) | 0.006 *** (0.002) | 0.006 *** (0.002) | 0.007 *** (0.002) |
| KL | −0.012 *** (0.002) | −0.013 *** (0.002) | −0.013 *** (0.002) | −0.015 *** (0.002) |
| Export | 0.018 (0.015) | 0.008 (0.013) | 0.008 (0.013) | 0.009 (0.013) |
| SOE | 0.006 (0.004) | 0.003 (0.003) | 0.004 (0.003) | 0.003 (0.003) |
| FIE | −0.005 (0.004) | −0.006 * (0.003) | −0.006 * (0.003) | −0.006 * (0.003) |
| State | 0.193 *** (0.037) | 0.175 *** (0.033) | 0.170 *** (0.033) | 0.162 *** (0.033) |
| Subsidy | 0.078 (0.048) | 0.021 (0.049) | 0.022 (0.049) | 0.016 (0.049) |
| Competition | −0.246 ** (0.101) | −0.221 *** (0.084) | −0.215 ** (0.084) | −0.214 ** (0.084) |
| Year fixed effect | Yes | Yes | Yes | Yes |
| Firm fixed effect | Yes | Yes | Yes | Yes |
| Regional fixed effect | Yes | Yes | Yes | Yes |
| Industry fixed effect | Yes | Yes | Yes | Yes |
| 0.873 | 0.873 | 0.873 | 0.873 | |
| Observations | 128,918 | 174,634 | 174,634 | 174,634 |
| Explaining Variables | ||||||
|---|---|---|---|---|---|---|
| (1) | (2) | (3) | (4) | (5) | (6) | |
| 50% | 33% | |||||
| −0.004 *** (0.000) | −0.004 *** (0.000) | −0.004 *** (0.000) | −0.004 *** (0.000) | |||
| −0.036 *** (0.005) | −0.043 *** (0.005) | |||||
| TFP | −0.387 *** (0.004) | −0.387 *** (0.004) | −0.387 *** (0.004) | −0.387 *** (0.004) | −0.387 *** (0.004) | |
| Size | −0.093 *** (0.004) | −0.093 *** (0.004) | −0.094 *** (0.004) | −0.094 *** (0.004) | −0.094 *** (0.004) | |
| Age | 0.007 *** (0.002) | 0.006 ** (0.002) | 0.006 ** (0.002) | 0.006 ** (0.002) | 0.006 ** (0.002) | |
| KL | −0.013 *** (0.002) | −0.013 *** (0.002) | −0.013 *** (0.002) | −0.013 *** (0.002) | −0.013 *** (0.002) | |
| Export | 0.008 (0.013) | 0.007 (0.013) | 0.007 (0.013) | 0.007 (0.013) | 0.008 (0.013) | |
| SOE | 0.004 (0.003) | 0.004 (0.003) | 0.004 (0.003) | 0.003 (0.003) | ||
| FIE | −0.007 ** (0.003) | −0.007 ** (0.003) | −0.006 * (0.003) | −0.006 ** (0.003) | ||
| State | 0.136 *** (0.033) | 0.134 *** (0.033) | 0.172 *** (0.032) | 0.173 *** (0.032) | ||
| Subsidy | 0.015 (0.050) | 0.016 (0.049) | 0.017 (0.049) | 0.013 (0.049) | ||
| Competition | −0.215 ** (0.085) | −0.244 *** (0.085) | −0.260 *** (0.085) | |||
| Year fixed effect | Yes | Yes | Yes | Yes | Yes | Yes |
| Firm fixed effect | Yes | Yes | Yes | Yes | Yes | Yes |
| Regional fixed effect | Yes | Yes | Yes | Yes | Yes | Yes |
| Industry fixed effect | Yes | Yes | Yes | Yes | Yes | Yes |
| 0.819 | 0.873 | 0.873 | 0.873 | 0.873 | 0.873 | |
| Observations | 173,305 | 173,305 | 173,305 | 173,305 | 173,305 | 173,305 |
| Variables | Obs. | Mean | S. D. | Min. | Max. |
|---|---|---|---|---|---|
| Regression coefficient | 1000 | 6.09 × 10⁻⁶ | 0.0006703 | −0.0020433 | 0.0017311 |
| Explaining Variables | ||||||
|---|---|---|---|---|---|---|
| (1) | (2) | (3) | (4) | (5) | (6) | |
| Wastewater | COD | Exhaust | Soot | Dust | ||
| −0.008 (0.007) | −0.116 *** (0.006) | −0.005 (0.004) | −0.022 *** (0.007) | −0.049 *** (0.007) | 0.086 *** (0.007) | |
| TFP | −0.551 *** (0.005) | −0.296 *** (0.005) | −0.265 *** (0.004) | −0.450 *** (0.005) | −0.352 *** (0.005) | −0.122 *** (0.004) |
| Size | −0.117 *** (0.007) | −0.092 *** (0.006) | −0.049 *** (0.004) | −0.095 *** (0.007) | −0.089 *** (0.007) | −0.006 (0.006) |
| Age | 0.017 *** (0.004) | −0.000 (0.003) | 0.000 (0.002) | 0.007 * (0.004) | 0.011 *** (0.004) | 0.000 (0.004) |
| KL | −0.014 *** (0.004) | −0.015 *** (0.003) | −0.005 ** (0.002) | −0.021 *** (0.003) | −0.015 *** (0.004) | 0.006 * (0.004) |
| Export | −0.007 (0.023) | 0.020 (0.019) | 0.006 (0.010) | 0.032 * (0.019) | −0.006 (0.018) | −0.021 (0.013) |
| SOE | 0.002 (0.005) | −0.004 (0.005) | 0.010 *** (0.003) | 0.005 (0.005) | 0.013 ** (0.005) | −0.010 ** (0.005) |
| FIE | −0.018 *** (0.005) | −0.005 (0.005) | 0.003 (0.002) | −0.001 (0.005) | −0.005 (0.005) | 0.005 * (0.003) |
| State | 0.267 *** (0.052) | 0.317 *** (0.051) | −0.127 *** (0.026) | 0.069 (0.049) | 0.200 *** (0.047) | −0.170 *** (0.032) |
| Subsidy | 0.096 (0.095) | 0.087 (0.084) | −0.014 (0.051) | −0.094 (0.079) | −0.055 (0.067) | −0.102 ** (0.050) |
| Competition | −0.289 ** (0.146) | −0.138 (0.133) | −0.149 ** (0.065) | −0.275 ** (0.126) | −0.193 (0.118) | −0.259 *** (0.072) |
| Year fixed effect | Yes | Yes | Yes | Yes | Yes | Yes |
| Firm fixed effect | Yes | Yes | Yes | Yes | Yes | Yes |
| Regional fixed effect | Yes | Yes | Yes | Yes | Yes | Yes |
| Industry fixed effect | Yes | Yes | Yes | Yes | Yes | Yes |
| 0.863 | 0.816 | 0.832 | 0.834 | 0.760 | 0.877 | |
| Observations | 174,634 | 174,634 | 174,634 | 174,634 | 174,634 | 174,634 |
| (1) | (2) | (3) | (4) | (5) | |
|---|---|---|---|---|---|
| Explaining Variables | Model 1 | Model 2 | Model 3 | Model 4 | Model 5 |
| −0.040 *** (0.006) | −0.159 *** (0.055) | −0.159 *** (0.057) | −0.159 *** (0.057) | ||
| −0.000 (0.000) | |||||
| 0.040 *** (0.006) | |||||
| TFP | −0.388 *** (0.004) | −0.388 *** (0.007) | −0.392 *** (0.009) | −0.349 *** (0.009) | −0.390 *** (0.004) |
| Size | −0.091 *** (0.004) | −0.135 *** (0.010) | −0.138 *** (0.013) | −0.063 *** (0.009) | −0.092 *** (0.004) |
| Age | 0.006 *** (0.002) | 0.006 (0.007) | 0.003 (0.009) | 0.014 ** (0.005) | 0.006 ** (0.002) |
| KL | −0.013 *** (0.002) | −0.013 *** (0.004) | −0.014 *** (0.005) | −0.016 *** (0.005) | −0.013 *** (0.002) |
| Export | 0.009 (0.013) | −0.039 (0.032) | −0.009 (0.033) | 0.010 (0.013) | |
| SOE | 0.003 (0.003) | 0.001 (0.011) | 0.000 (0.015) | −0.014 (0.009) | 0.004 (0.003) |
| FIE | −0.006 * (0.003) | −0.007 (0.006) | −0.004 (0.007) | −0.004 (0.010) | −0.003 (0.003) |
| State | 0.170 *** (0.033) | 0.129 (0.169) | 0.097 (0.210) | 0.050 (0.049) | 0.210 *** (0.033) |
| Subsidy | 0.021 (0.049) | 0.302 ** (0.147) | 0.421 *** (0.153) | 0.133 (0.205) | 0.022 (0.050) |
| Competition | −0.221 *** (0.084) | 0.253 (0.236) | 0.022 (0.244) | −0.229 (0.187) | −0.238 *** (0.089) |
| Year fixed effect | Yes | Yes | Yes | Yes | Yes |
| Firm fixed effect | Yes | Yes | Yes | Yes | Yes |
| Regional fixed effect | Yes | Yes | Yes | Yes | Yes |
| Industry fixed effect | Yes | Yes | Yes | Yes | Yes |
| 0.873 | 0.922 | 0.921 | 0.922 | 0.302 | |
| Observations | 174,634 | 47,180 | 32,364 | 43,618 | 171,726 |
| Explaining Variables | ||||
|---|---|---|---|---|
| (1) | (2) | (3) | (4) | |
| −0.059 *** (0.007) | −0.057 *** (0.006) | −0.059 *** (0.006) | −0.059 *** (0.006) | |
| 0.008 *** (0.001) | 0.004 *** (0.001) | 0.005 *** (0.001) | 0.005 *** (0.001) | |
| TFP | −0.387 *** (0.004) | −0.386 *** (0.004) | −0.387 *** (0.004) | |
| Size | −0.089 *** (0.004) | −0.089 *** (0.004) | −0.090 *** (0.004) | |
| Age | 0.007 *** (0.002) | 0.006 *** (0.002) | 0.006 *** (0.002) | |
| KL | −0.013 *** (0.002) | −0.013 *** (0.002) | −0.013 *** (0.002) | |
| Export | 0.009 (0.013) | 0.009 (0.013) | 0.009 (0.013) | |
| SOE | 0.003 (0.003) | 0.003 (0.003) | ||
| FIE | −0.006 ** (0.003) | −0.006 ** (0.003) | ||
| State | 0.092 *** (0.033) | 0.090 *** (0.033) | ||
| Subsidy | 0.017 (0.049) | 0.017 (0.049) | ||
| Competition | −0.222 *** (0.086) | |||
| Year fixed effect | Yes | Yes | Yes | Yes |
| Firm fixed effect | Yes | Yes | Yes | Yes |
| Regional fixed effect | Yes | Yes | Yes | Yes |
| Industry fixed effect | Yes | Yes | Yes | Yes |
| 0.816 | 0.871 | 0.871 | 0.871 | |
| Observations | 172,234 | 172,234 | 172,234 | 172,234 |
| Explaining Variables | ||||||
|---|---|---|---|---|---|---|
| (1) | (2) | |||||
| Model 1 | Model 2 | |||||
| −0.040 *** (0.005) | −0.047 *** (0.004) | −0.047 *** (0.004) | −0.042 *** (0.005) | −0.052 *** (0.004) | −0.050 *** (0.004) | |
| 0.009 *** (0.002) | 0.005 *** (0.002) | 0.007 *** (0.002) | ||||
| −0.003 * (0.002) | −0.000 (0.001) | 0.002 (0.002) | ||||
| 0.005 *** (0.002) | 0.011 *** (0.002) | 0.010 *** (0.002) | ||||
| TFP | −0.388 *** (0.004) | −0.388 *** (0.004) | −0.388 *** (0.004) | −0.388 *** (0.004) | ||
| Size | −0.090 *** (0.004) | −0.091 *** (0.004) | −0.092 *** (0.004) | −0.093 *** (0.004) | ||
| Age | 0.007 *** (0.002) | 0.006 *** (0.002) | 0.007 *** (0.002) | 0.006 *** (0.002) | ||
| KL | −0.013 *** (0.002) | −0.013 *** (0.002) | −0.014 *** (0.002) | −0.013 *** (0.002) | ||
| Export | 0.009 (0.013) | 0.009 (0.013) | −0.016 (0.013) | −0.013 (0.013) | ||
| SOE | −0.004 (0.004) | 0.003 (0.003) | ||||
| FIE | −0.009 * (0.005) | −0.006 * (0.003) | ||||
| State | 0.173 *** (0.033) | 0.146 *** (0.033) | ||||
| Subsidy | 0.022 (0.049) | 0.024 (0.049) | ||||
| Competition | −0.217 ** (0.084) | −0.201 ** (0.084) | ||||
| Year fixed effect | Yes | Yes | Yes | Yes | Yes | Yes |
| Firm fixed effect | Yes | Yes | Yes | Yes | Yes | Yes |
| Regional fixed effect | Yes | Yes | Yes | Yes | Yes | Yes |
| Industry fixed effect | Yes | Yes | Yes | Yes | Yes | Yes |
| 0.818 | 0.873 | 0.873 | 0.818 | 0.873 | 0.873 | |
| Observations | 174,634 | 174,634 | 174,634 | 174,634 | 174,634 | 174,634 |
Disclaimer/Publisher’s Note: The statements, opinions and data contained in all publications are solely those of the individual author(s) and contributor(s) and not of MDPI and/or the editor(s). MDPI and/or the editor(s) disclaim responsibility for any injury to people or property resulting from any ideas, methods, instructions or products referred to in the content. |
© 2024 by the authors. Licensee MDPI, Basel, Switzerland. This article is an open access article distributed under the terms and conditions of the Creative Commons Attribution (CC BY) license (https://creativecommons.org/licenses/by/4.0/).
Share and Cite
Zhang, Y.; Ye, Z.; Gan, K. Trade Liberalization and Pollutant Emissions: Micro Evidence from Chinese Manufacturing Firms. Sustainability 2024, 16, 6772. https://doi.org/10.3390/su16166772
Zhang Y, Ye Z, Gan K. Trade Liberalization and Pollutant Emissions: Micro Evidence from Chinese Manufacturing Firms. Sustainability. 2024; 16(16):6772. https://doi.org/10.3390/su16166772
Chicago/Turabian StyleZhang, Yiming, Zuoliang Ye, and Kaijun Gan. 2024. "Trade Liberalization and Pollutant Emissions: Micro Evidence from Chinese Manufacturing Firms" Sustainability 16, no. 16: 6772. https://doi.org/10.3390/su16166772
APA StyleZhang, Y., Ye, Z., & Gan, K. (2024). Trade Liberalization and Pollutant Emissions: Micro Evidence from Chinese Manufacturing Firms. Sustainability, 16(16), 6772. https://doi.org/10.3390/su16166772