
Research on Carbon Emissions and Influencing Factors of Residents’ Lives in Hebei Province

Abstract
1. Introduction
2. Methods and Data Sources
2.1. Carbon Dioxide Emissions Accounting
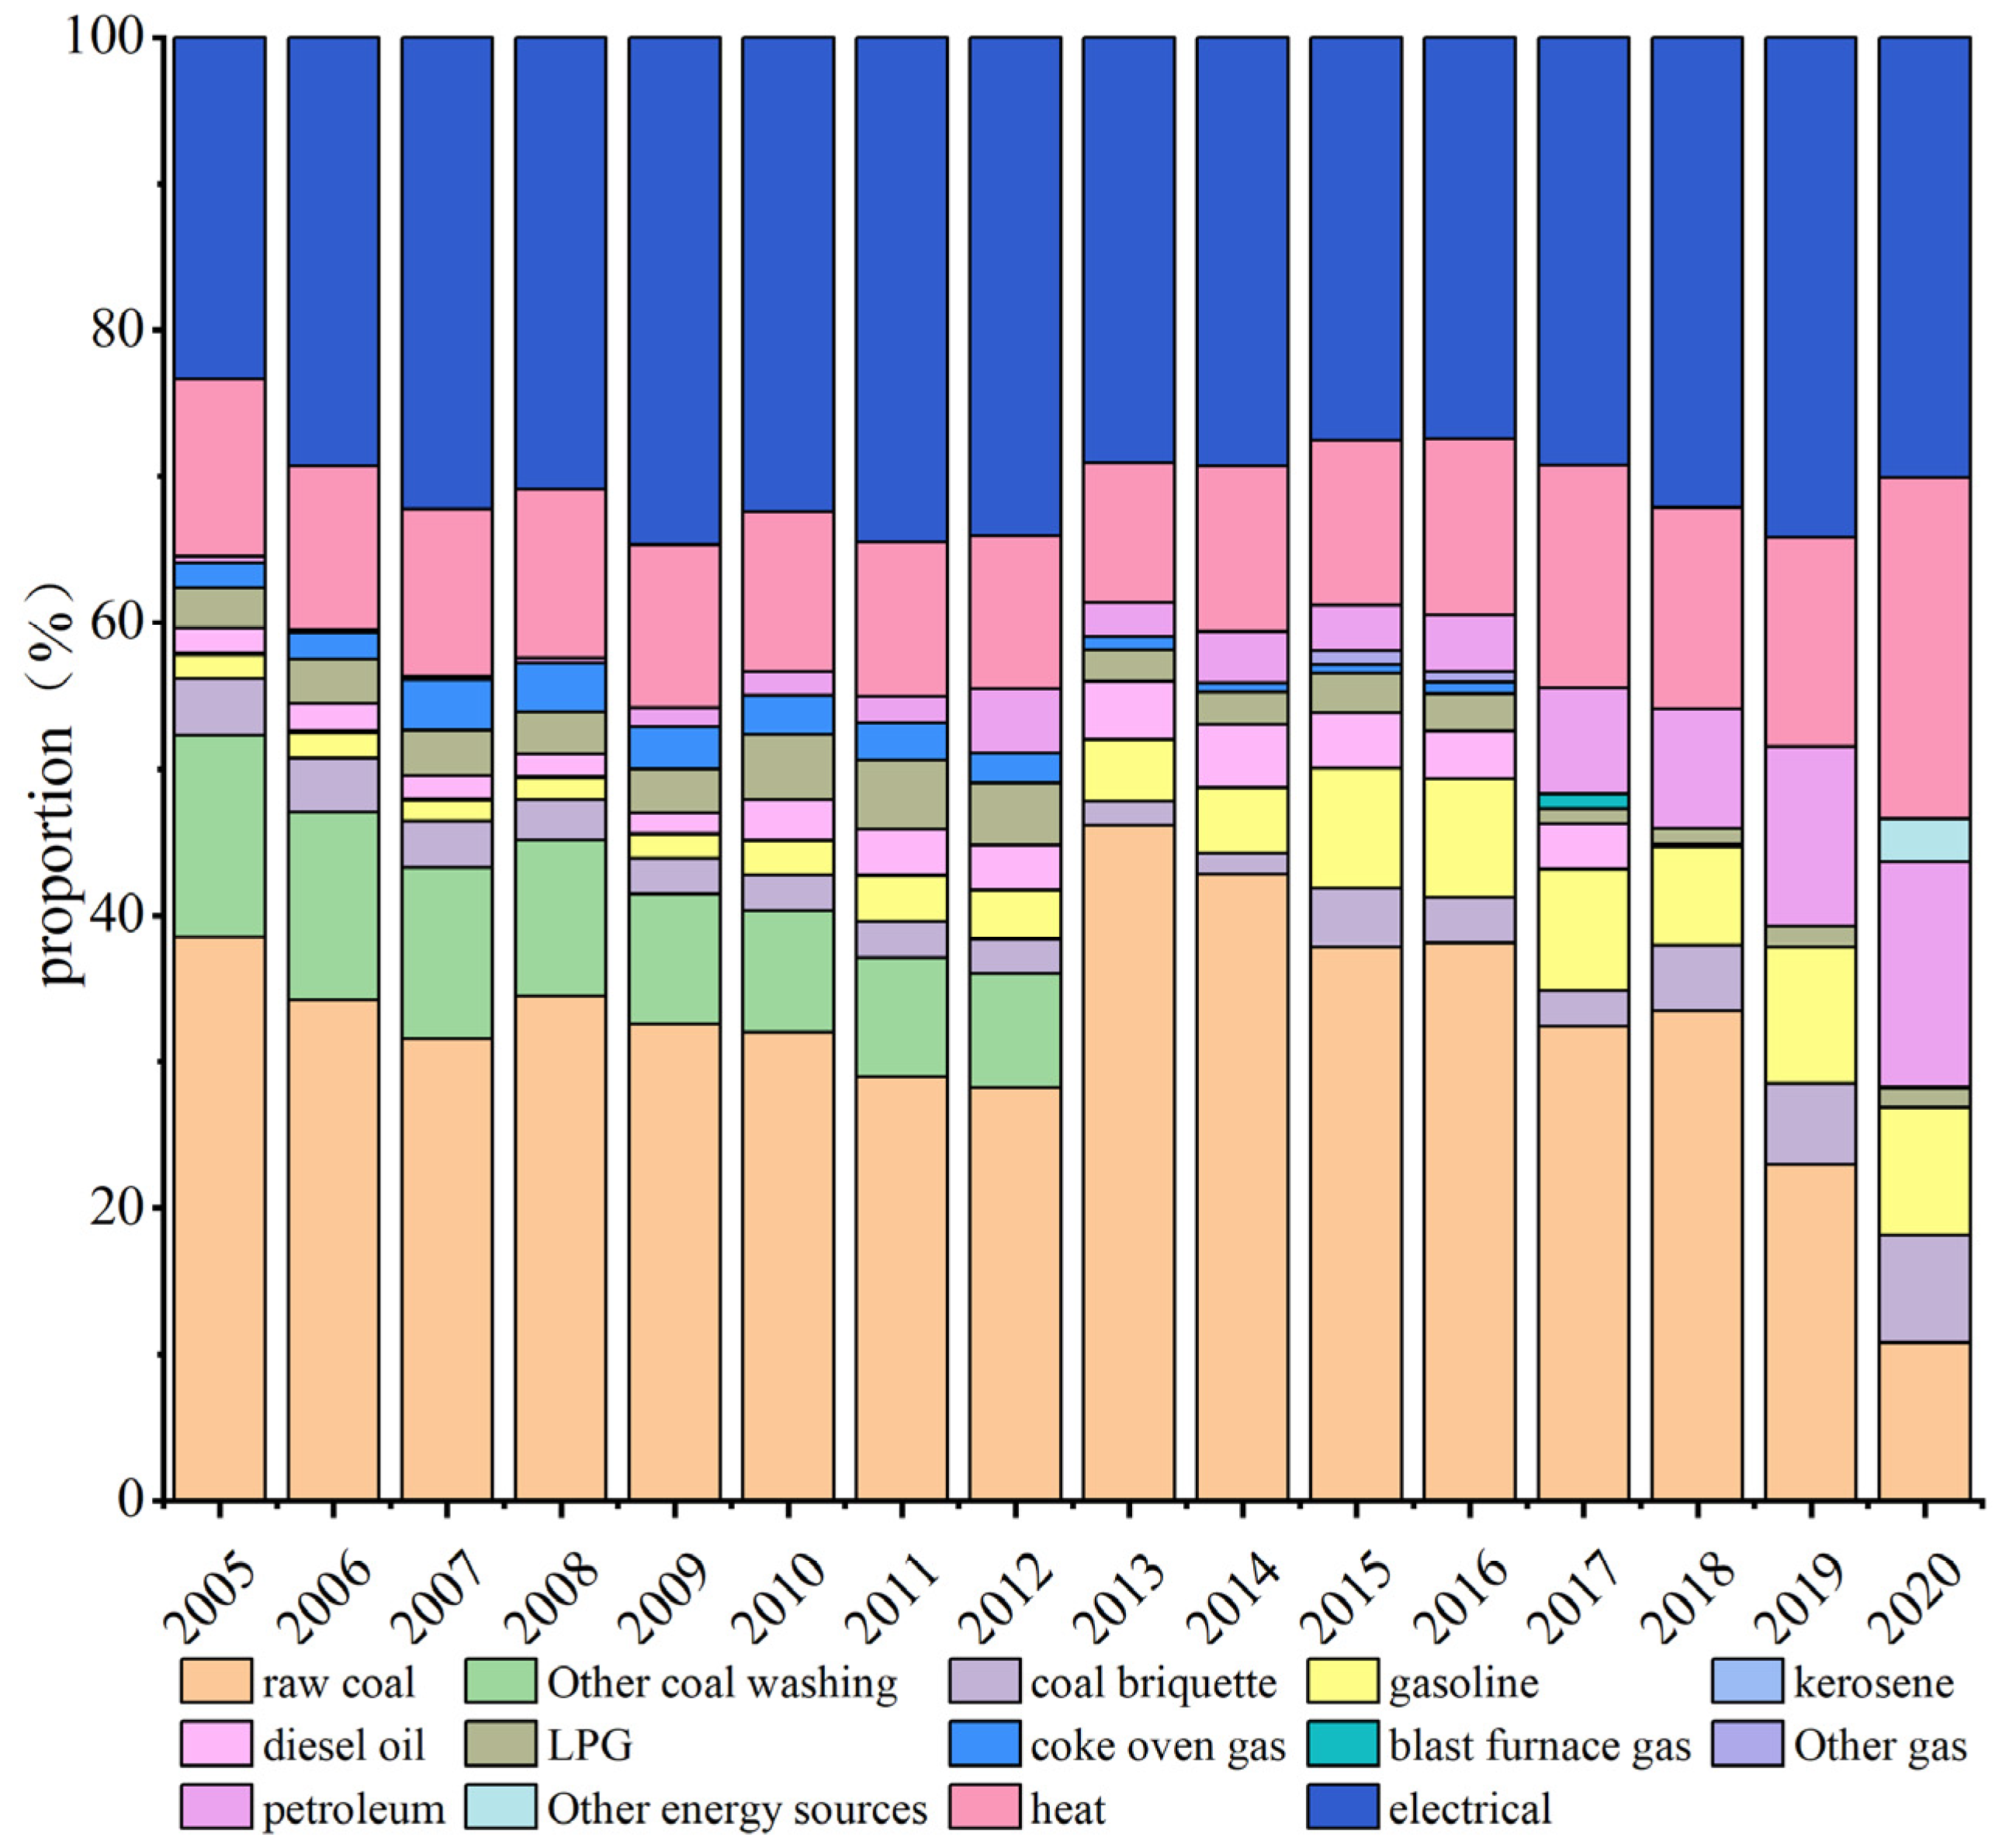
2.1.1. Direct Carbon Emission Accounting
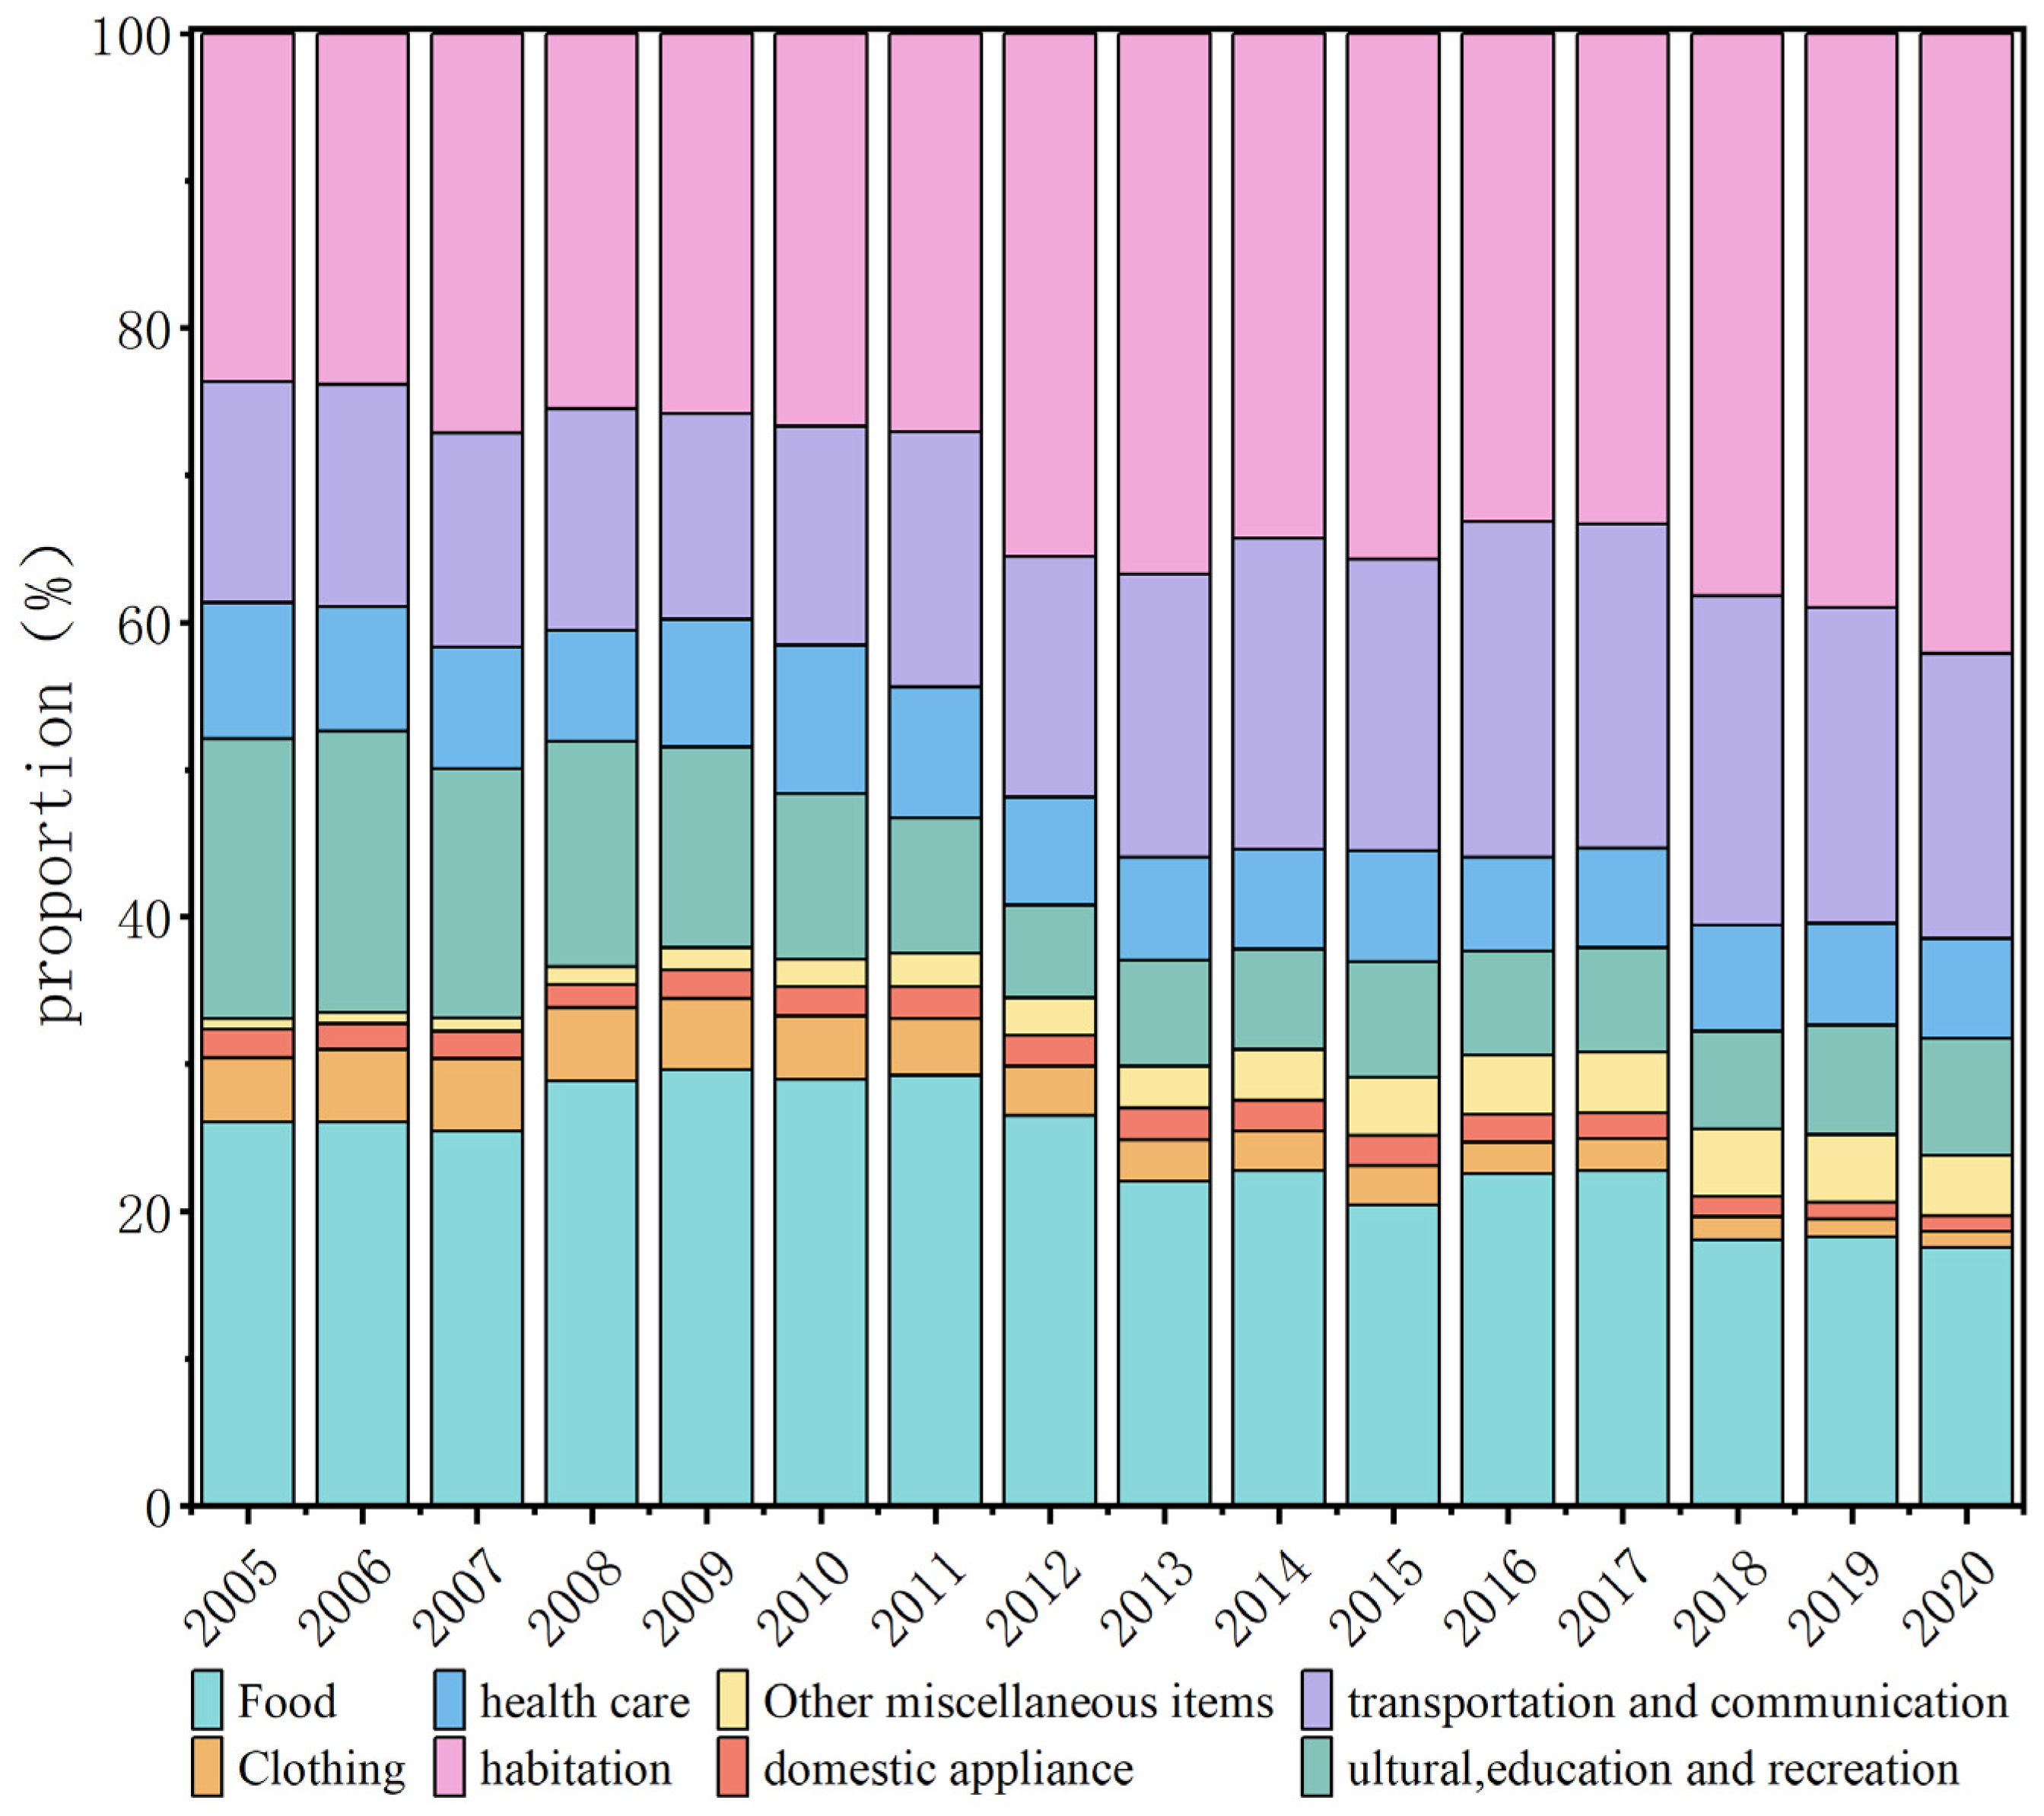
2.1.2. Indirect Carbon Emission Accounting
2.2. LMDI Decomposition
2.2.1. Direct Carbon Emission Decomposition
2.2.2. Indirect Carbon Emission Decomposition
2.3. LEAP Model
2.4. Data Sources
2.5. Scene Setting
3. Results and Analysis
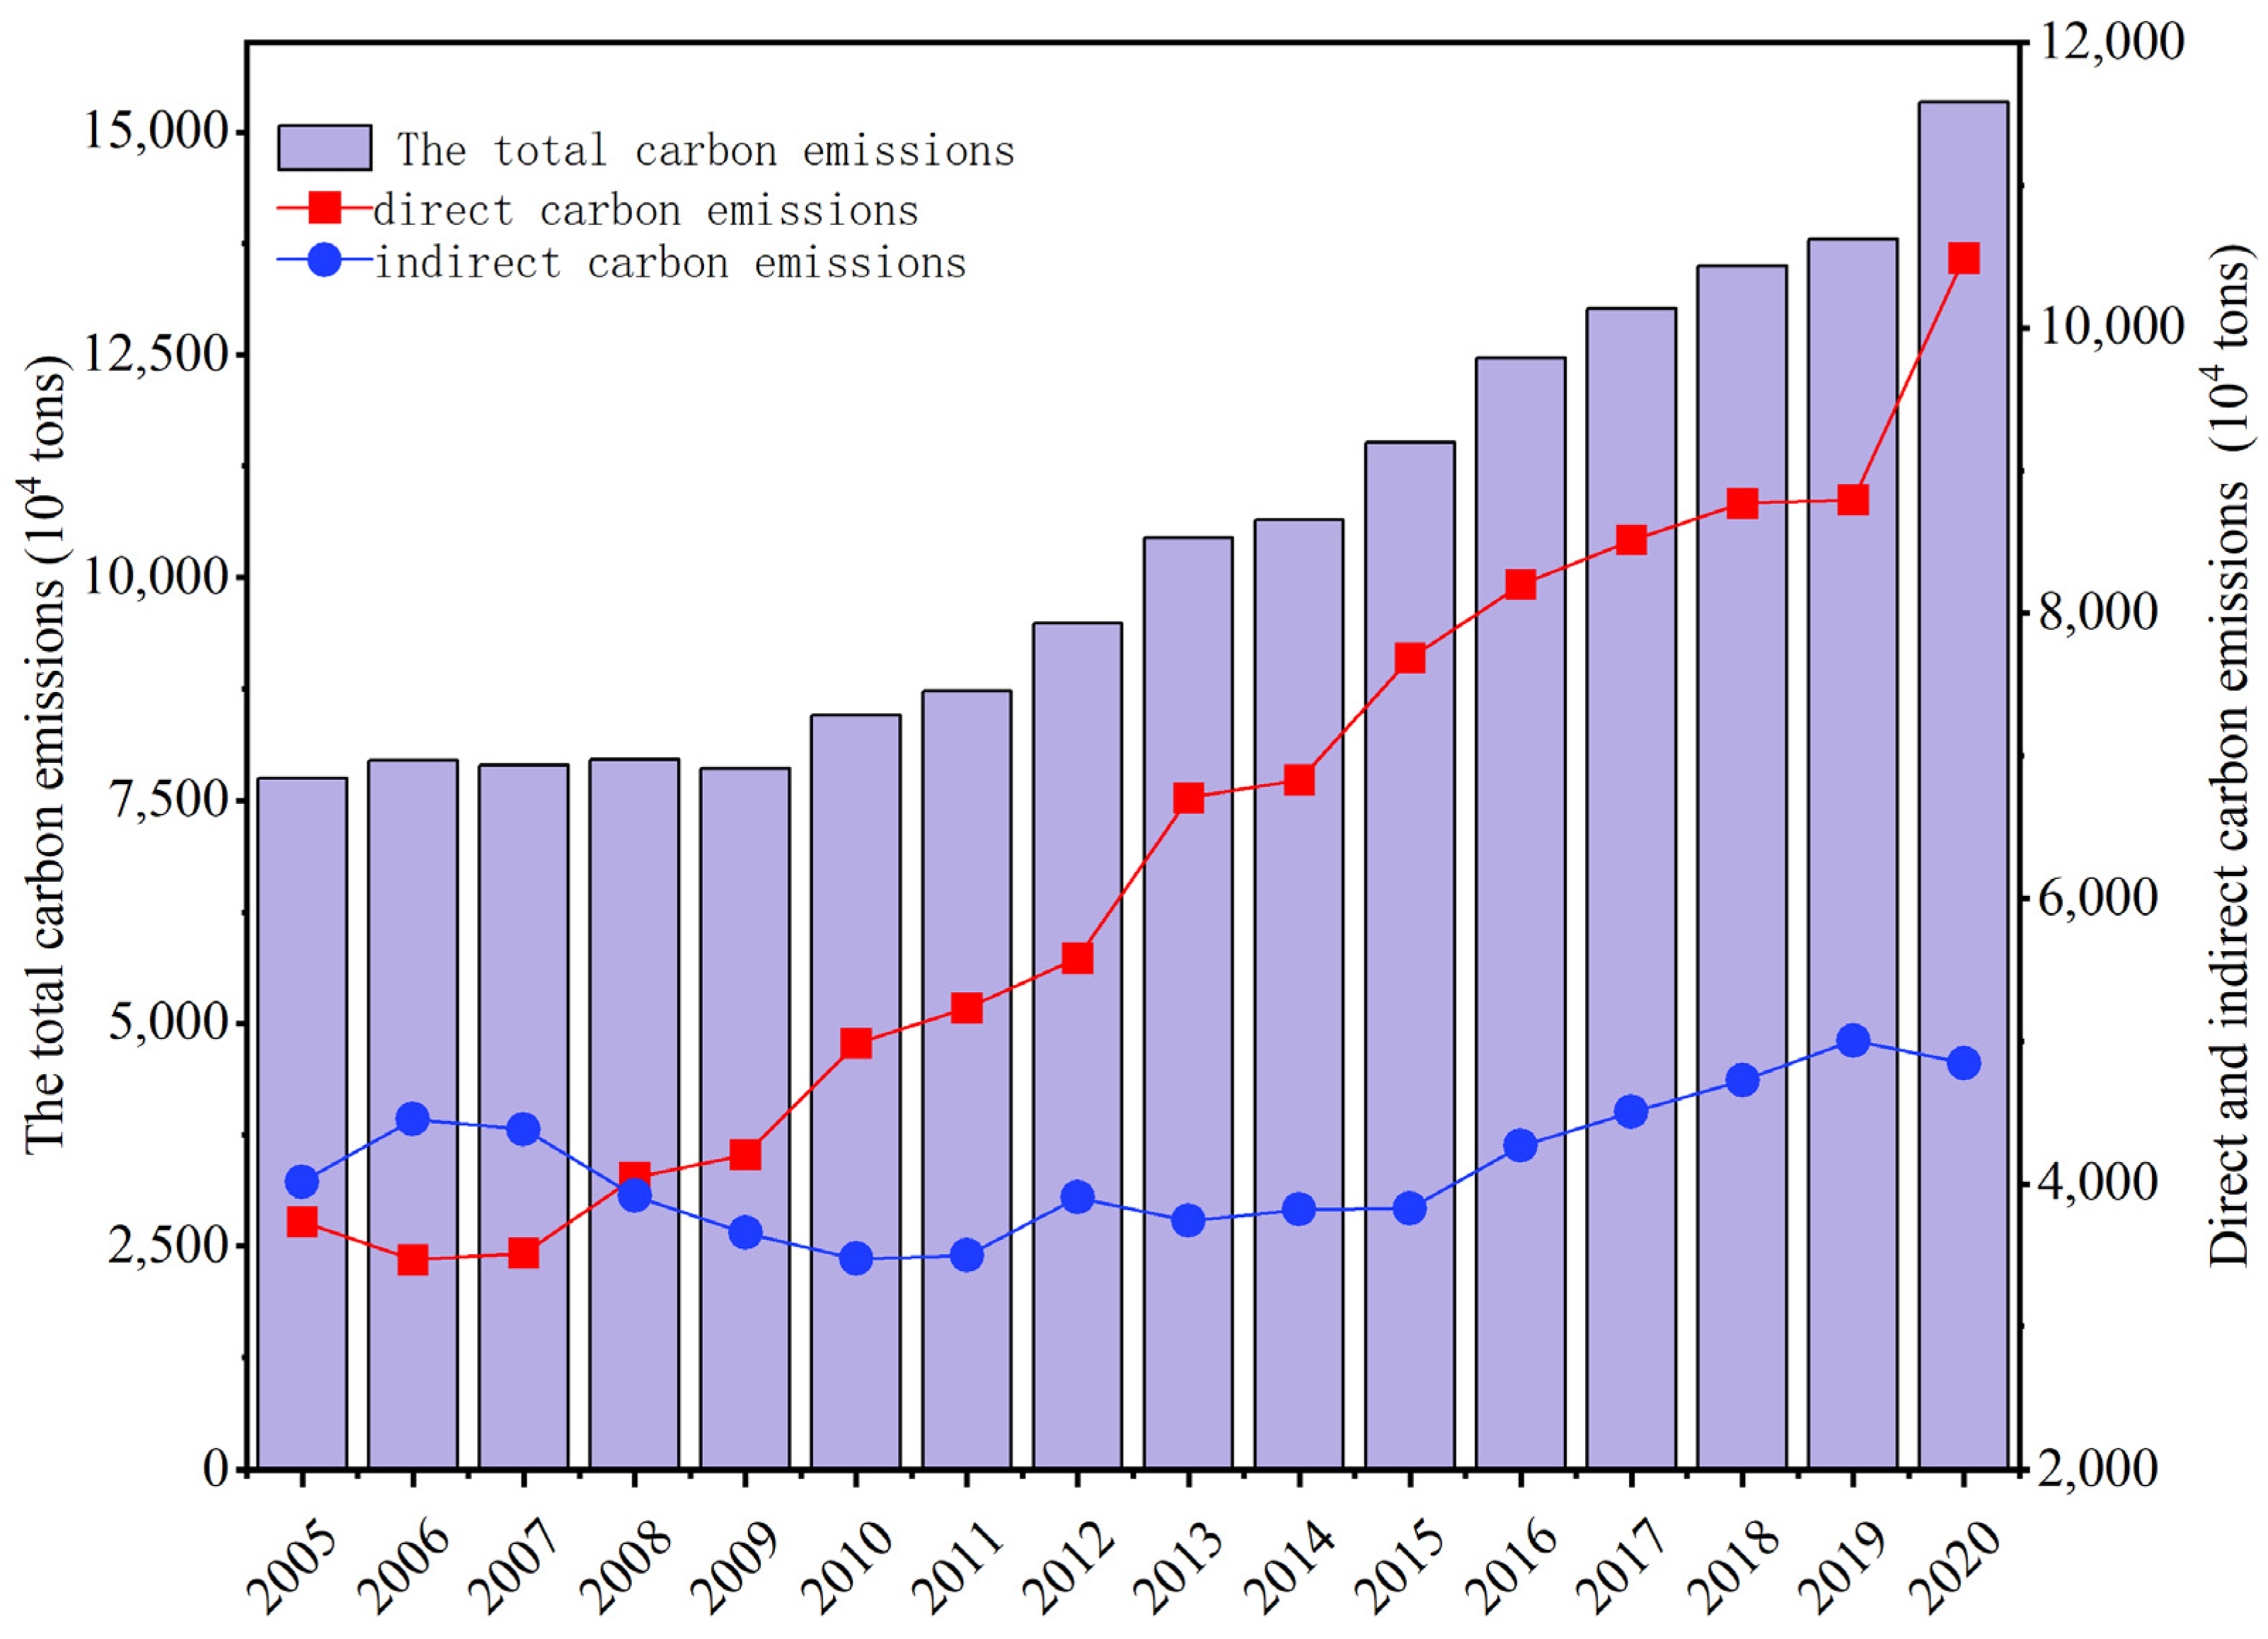
3.1. Analysis of Changes in Carbon Emissions
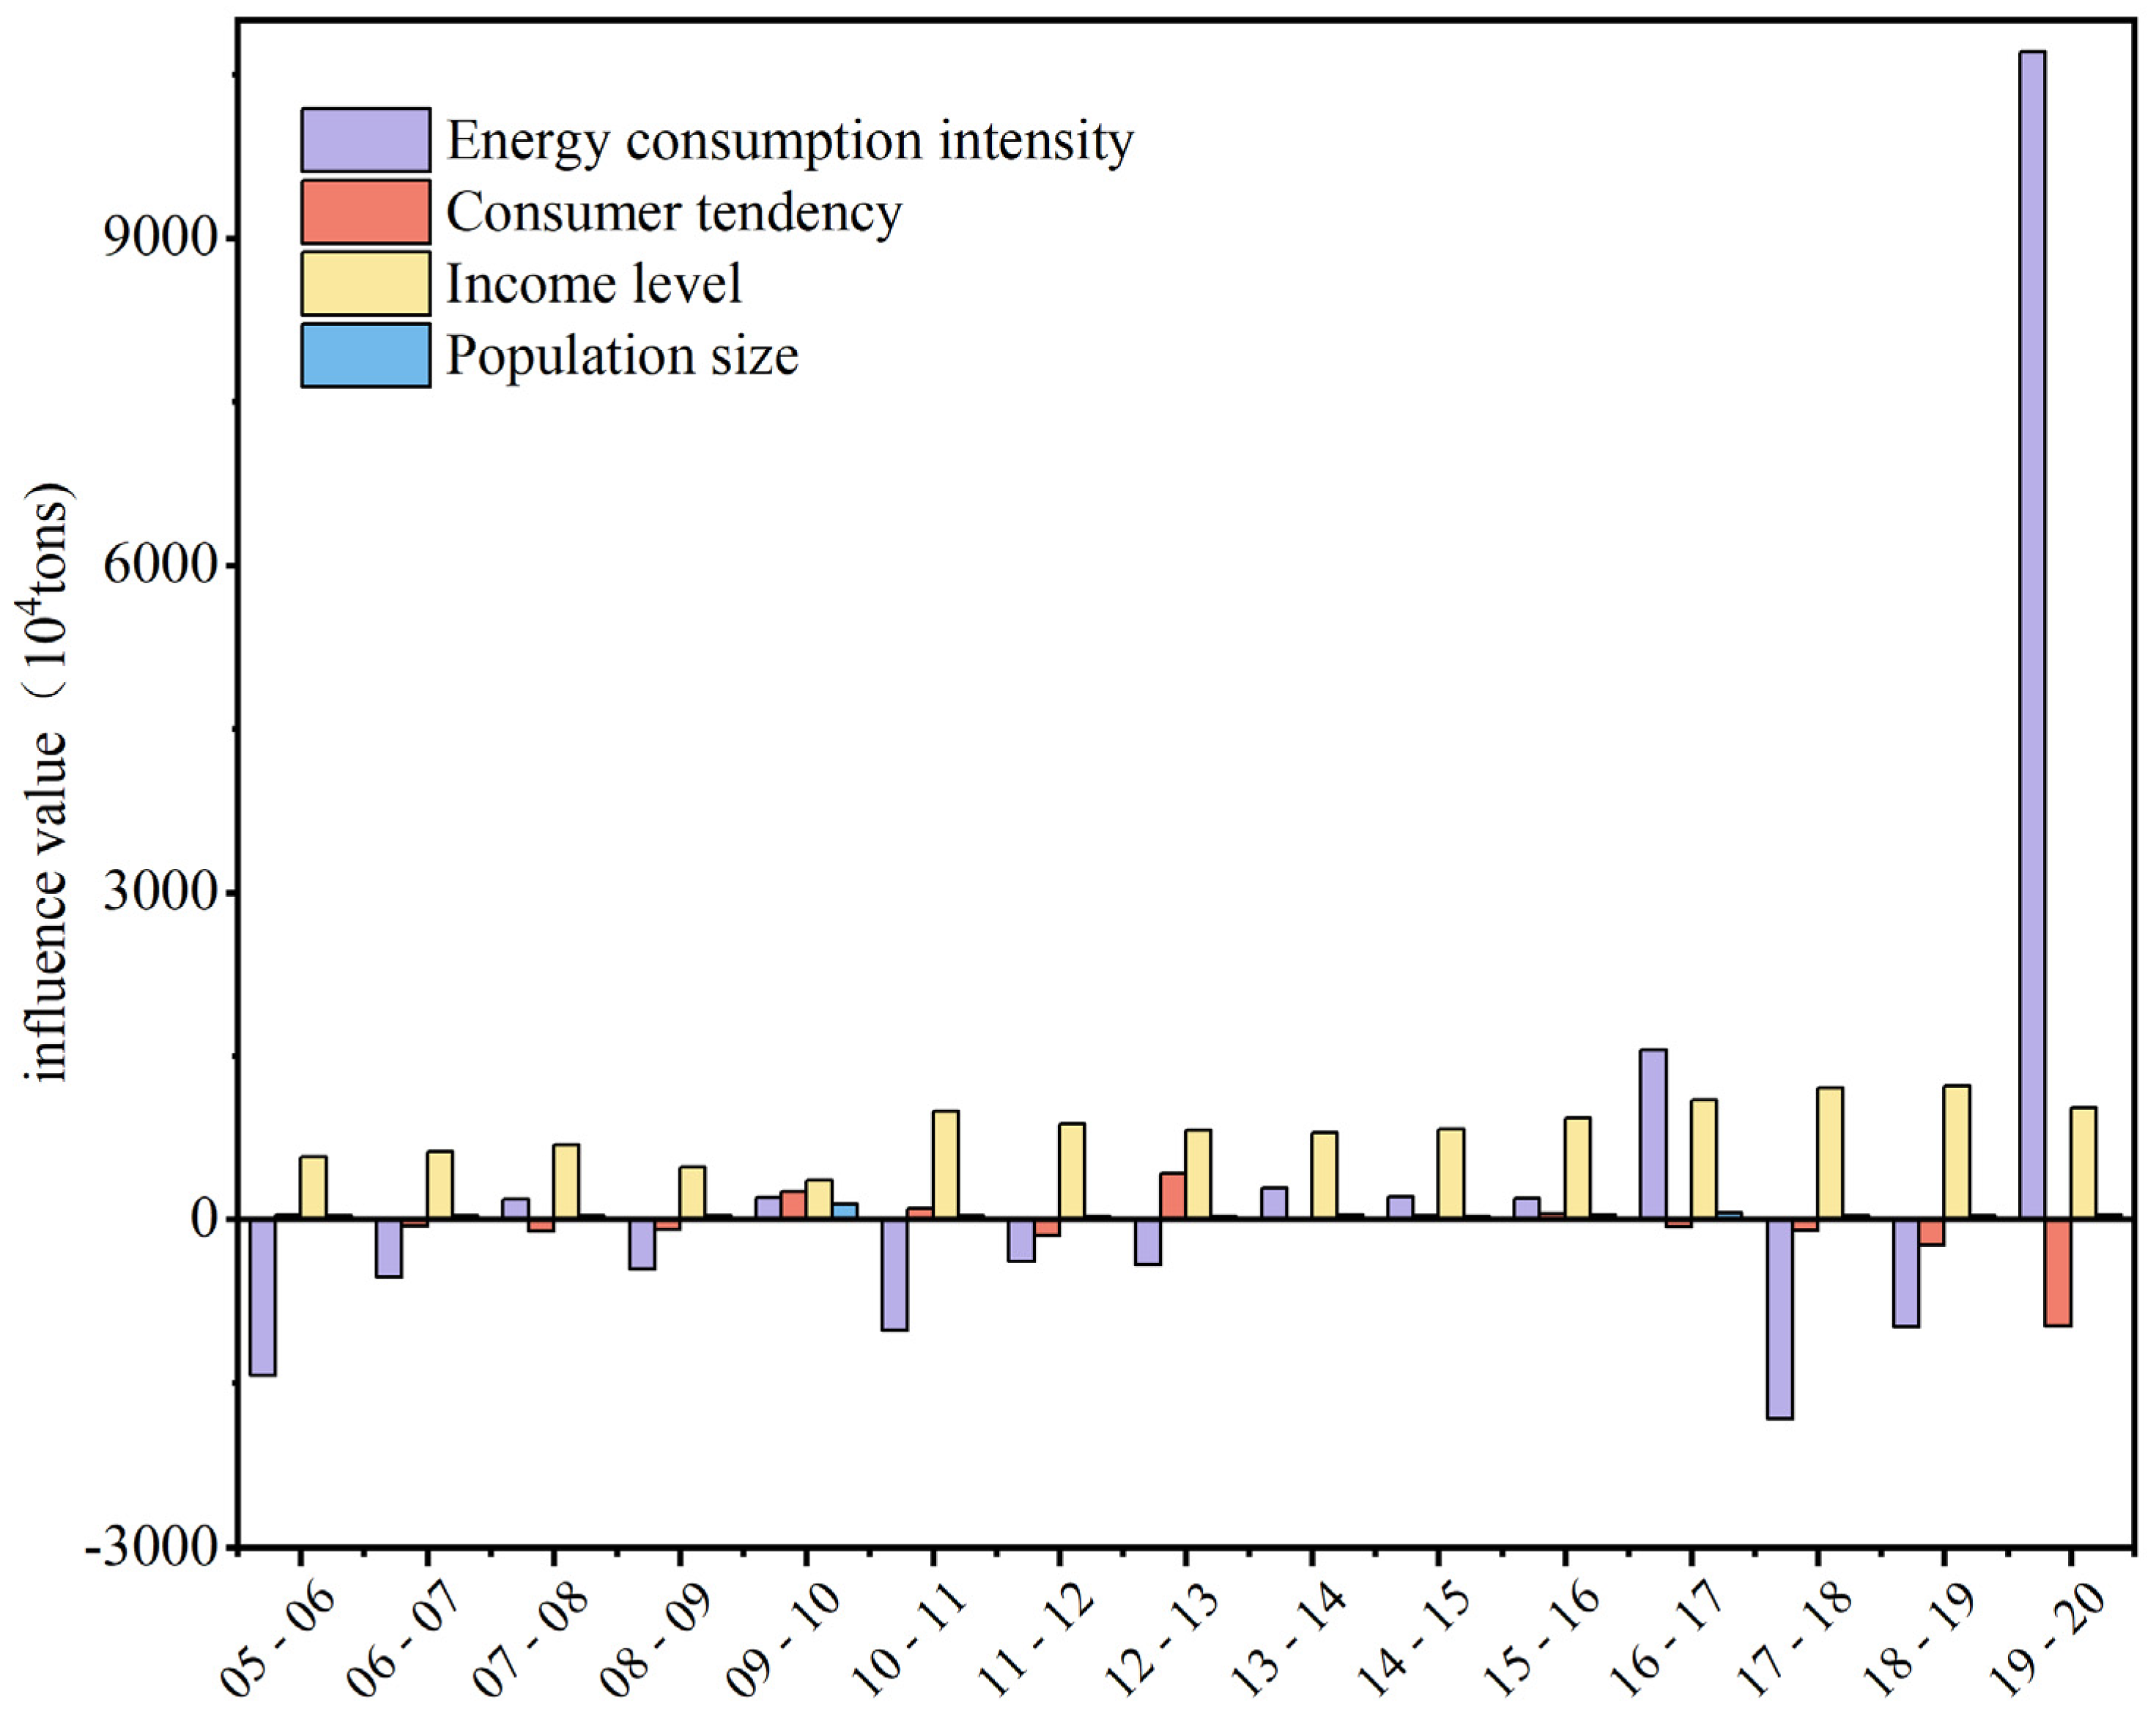
3.2. LMDI Analysis of Decomposition Results
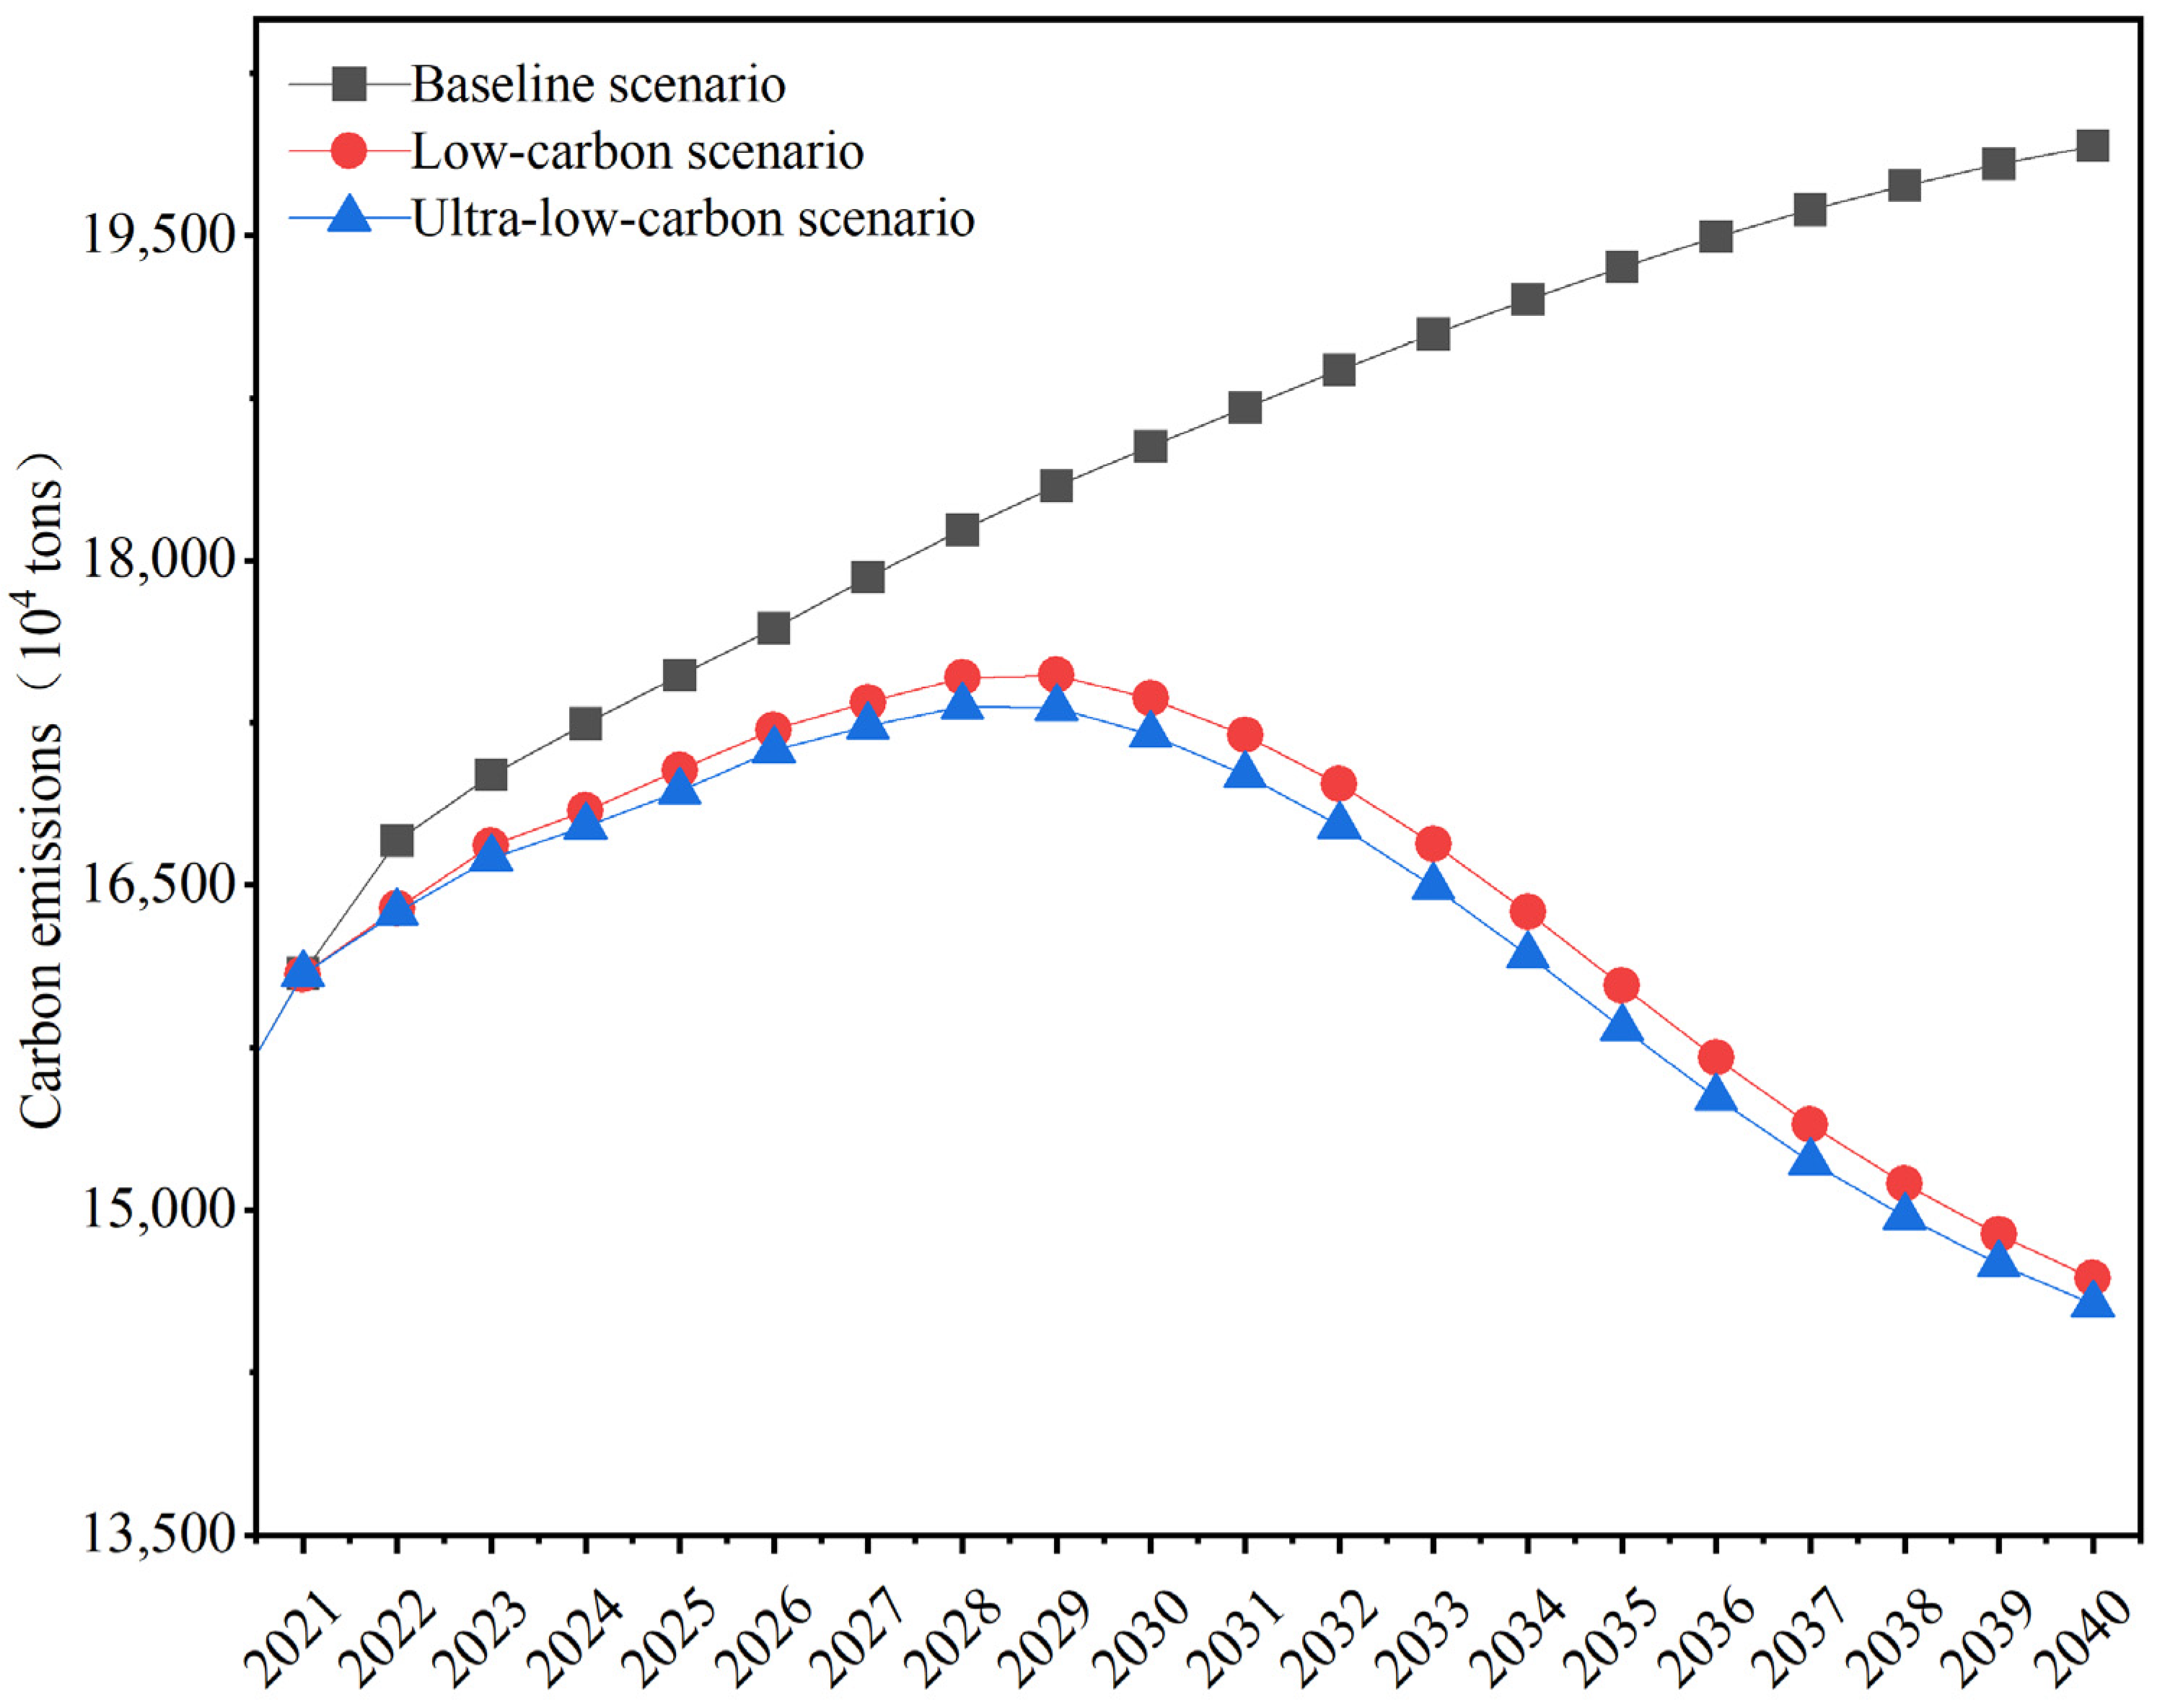
3.3. Carbon Emission Trend Analysis
3.4. Uncertainty Analysis
- (1)
- The uncertainty of statistical data
- (2)
- Uncertainty of carbon emission factors
- (3)
- Uncertainty of parameter setting
3.5. Limitation
4. Conclusions and Suggestion
Author Contributions
Funding
Institutional Review Board Statement
Informed Consent Statement
Data Availability Statement
Conflicts of Interest
References
- Vinn, O.; Hadi, M.; Xi, D.; Allameh, M. Rare bioerosion in large benthic foraminifera in the Eocene of NE Iran: Implications for global warming and trophic regime. Mar. Micropaleontol. 2024, 189, 102369–102387. [Google Scholar] [CrossRef]
- Shu, Z.; Jin, J.; Zhang, J.; Wang, G.; Lian, Y.; Liu, Y.; Bao, Z.; Guan, T.; He, R.; Liu, C.; et al. 1.5 °C and 2.0 °C of global warming intensifies the hydrological extremes in China. J. Hydrol. 2024, 635, 131229–131249. [Google Scholar] [CrossRef]
- Giménez-Romero, À.; Iturbide, M.; Moralejo, E.; Gutiérrez, J.M.; Matías, M.A. Global warming significantly increases the risk of Pierce’s disease epidemics in European vineyards. Sci. Rep. 2024, 14, 9648. [Google Scholar] [CrossRef] [PubMed]
- Song, C.; Liu, Q.; Song, J.; Ma, W. Impact path of digital economy on carbon emission efficiency: Mediating effect based on technological innovation. J. Environ. Manag. 2024, 358, 120940. [Google Scholar] [CrossRef] [PubMed]
- Sheng, Z.; Gu, K.; He, W. Estimation of carbon emissions of domestic energy usage by Chinese residents based on the input-output method. E3S Web Conf. 2018, 72, 03001. [Google Scholar] [CrossRef]
- Zhang, J.; Lu, H.; Peng, W.; Zhang, L. Analyzing carbon emissions and influencing factors in Chengdu-Chongqing urban agglomeration counties. J. Environ. Sci. 2025, 151, 640–651. [Google Scholar] [CrossRef]
- Cai, Y.; Li, K. Spatiotemporal dynamic evolution and influencing factors of land use carbon emissions: Evidence from Jiangsu Province, China. Front. Environ. Sci. 2024, 12, 1368205. [Google Scholar] [CrossRef]
- Xie, P.; Wang, S.; Liao, J.; Sun, F. Study on Spatial-Temporal Disparities and Factors Influencing Electricity Consumption Carbon Emissions in China. Sustainability 2024, 16, 4128. [Google Scholar] [CrossRef]
- Yue, J.; Lu, F.; Weng, Z.; Tong, D.; Xie, Y.; Xu, M.; Chen, S.; Ma, H. Unequal household carbon emissions and potential determinants in China: Evidence from nationwide household surveys. J. Clean. Prod. 2024, 456, 142397. [Google Scholar] [CrossRef]
- Brueckner, J.K.; Kahn, M.E.; Nickelsburg, J. How do airlines cut fuel usage, reducing their carbon emissions? Econ. Transp. 2024, 38, 100358–100376. [Google Scholar] [CrossRef]
- Kong, Z.; Kong, L.; Bai, K. Research on the development path of e-commerce logistics in the context of carbon neutrality. J. Phys. Conf. Ser. 2024, 2735, 012001. [Google Scholar] [CrossRef]
- Ding, H.; Cheng, C. Study on the Carbon Emission Efficiency of the Logistics Industry in the Yangtze River Delta Region. J. Stat. Econ. 2024, 1, 27. [Google Scholar] [CrossRef]
- Ding, Z.Q.; Zhu, H.Q.; Zhou, W.Y.; Bai, Z.G. Prediction analysis of carbon emission in China’s electricity industry based on the dual carbon background. PLoS ONE 2024, 19, e0302068. [Google Scholar] [CrossRef]
- Tan, L.; Feng, Z.; Zheng, G.; Li, C. A study of carbon emission driving factors of a metal chemical enterprise in China based on the LMDI model. Processes 2023, 11, 2230. [Google Scholar] [CrossRef]
- Hou, K.; Sun, J.; Dong, M.; Zhang, H.; Li, Q. Simulation of carbon peaking process of high energy consuming manufacturing industry in Shaanxi Province: A hybrid model based on LMDI and TentSSA-ENN. Math. Biosci. Eng. MBE 2023, 20, 18445–18467. [Google Scholar] [CrossRef] [PubMed]
- Zhang, X.; Chen, H.; Sun, J.; Zhang, X. Predictive models of embodied carbon emissions in building design phases: Machine learning approaches based on residential buildings in China. Build. Environ. 2024, 258, 111595–111612. [Google Scholar] [CrossRef]
- Peng, S.; Tan, J.; Ma, H. Carbon emission prediction of construction industry in Sichuan Province based on the GA-BP model. Environ. Sci. Pollut. Res. Int. 2024, 31, 24567–24583. [Google Scholar] [CrossRef] [PubMed]
- Chen, T.; Wang, M. Deep learning-based carbon emission forecasting and peak carbon pathways in China’s logistics industry. Sustainability 2024, 16, 1826. [Google Scholar] [CrossRef]
- Li, Z.; Åhman, M.; Nilsson, L.J.; Bauer, F. Towards carbon neutrality: Transition pathways for the Chinese ethylene industry. Renew. Sustain. Energy Rev. 2024, 199, 114540. [Google Scholar] [CrossRef]
- Zhao, X.; Guo, L.; Gao, Z.; Hao, Y. Estimation and analysis of carbon emission efficiency in Chinese industry and its influencing factors—Evidence from the micro level. Energies 2024, 17, 917. [Google Scholar] [CrossRef]
- Shen, C.; Zhang, J.; Pang, J.; Xu, H. Study on industrial carbon emissions in China based on GDIM decomposition method and two decoupling effects. Environ. Sci. Pollut. Res. Int. 2024, 31, 15648–15670. [Google Scholar] [CrossRef]
- Liu, J.B.; Yuan, X.Y.; Lee, C.C. Prediction of carbon emissions in China’s construction industry using an improved grey prediction model. Sci. Total Environ. 2024, 938, 173351. [Google Scholar] [CrossRef]
- Zheng, S.; He, X.; Liang, X.; Yu, L. Research on the decoupling relationship and driving factors of carbon emissions in the construction industry of the East China core economic zone. Buildings 2024, 14, 1476. [Google Scholar] [CrossRef]
- Xiang, W.; Gan, L.; Cai, W. Spatiotemporal evolution characteristics and spillover effects of carbon emissions from public building in China: The tertiary industry perspective. Environ. Impact Assess. Rev. 2024, 106, 107545. [Google Scholar] [CrossRef]
- Chen, H.; Lu, C. Research on the spatial effect and threshold characteristics of new-type urbanization on carbon Emissions in China’s Construction Industry. Sustainability 2023, 15, 15825. [Google Scholar] [CrossRef]
- Yan, W.; Yu, H.; Yilin, H.; Quan, Q.; Yuanzhe, L. Optimizing scope 3 emissions in the automotive manufacturing industry: A multidisciplinary approach. Carbon Res. 2024, 3, 49. [Google Scholar]
- Hou, Y.; Liu, S. Predictive modeling and validation of carbon emissions from China’s Coastal construction industry: A BO-XGBoost ensemble approach. Sustainability 2024, 16, 4215. [Google Scholar] [CrossRef]
- Markaki, M.; Belegri-Roboli, A.; Sarafidis, Y.; Mirasgedis, S. The carbon footprint of Greek households (1995–2012). Energy Policy 2017, 100, 206–215. [Google Scholar] [CrossRef]
- Anser, M.K.; Alharthi, M.; Aziz, B.; Wasim, S. Impact of urbanization, economic growth, and population size on residential carbon emissions in the SAARC countries. Clean. Technol. Environ. Policy 2020, 22, 923–936. [Google Scholar] [CrossRef]
- Trotta, G. Factors affecting energy-saving behaviours and energy efficiency investments in British households. Energy Policy 2018, 114, 529–539. [Google Scholar] [CrossRef]
- Nie, H.; Kemp, R. Index decomposition analysis of residential energy consumption in China: 2002–2010. Appl. Energy 2014, 121, 10–19. [Google Scholar] [CrossRef]
- Zhang, D.; Huang, T. Six Pictures Bring You to Understand China’s Carbon Emissions. Available online: https://wri.org.cn/insights/data-viz-6-graphics-ghg-emissions-china (accessed on 16 July 2024).
- Wu, E.; Wang, Q.; Ke, L.; Zhang, G. Study on carbon emission characteristics and emission reduction measures of lime production—A case of enterprise in the Yangtze River Basin. Sustainability 2023, 15, 10185. [Google Scholar] [CrossRef]
- Ming, Z.; Suiting, D.; Jingru, P.; Wenwen, W. The effect of indirect household energy consumption on PM 2.5 emission in China: An analysis based on CLA method. J. Environ. Manag. 2020, 279, 111531. [Google Scholar]
- Nnaji, C.E.; Okafor, I.F.; Akubue, G.U.; Uzoma, C.C.; Onyekaozuru, E.F.; Adagba, C.I. Decomposition effects of energy and co intensities in the Nigerian economy: A logarithmic mean weight divisia index (LMDI) analysis. IOP Conf. Ser. Earth Environ. Sci. 2023, 1178, 012009. [Google Scholar] [CrossRef]
- Wu, Q.; Ma, H.; Ren, H.B.; Guo, M.X.; Chen, P.; Li, Q.F. Medium and long-term carbon emission projections and emission reduction potential analysis of the Lingang Special Area based on the LEAP model. Huan Jing Ke Xue 2024, 45, 721–731. [Google Scholar] [PubMed]
- China Energy Statistics Yearbook. Available online: http://kns-cnki-net-s.svpn.hebeu.edu.cn:8118/knavi/yearbooks/YCXME/detail?uniplatform=NZKPT (accessed on 5 June 2024).
- Guidelines for Provincial Greenhouse Gas Inventories (Trial). Available online: http://www.cbcsd.org.cn/sjk/nengyuan/standard/home/20140113/download/shengjiwenshiqiti.pdf (accessed on 5 June 2024).
- General Principles for Comprehensive Energy Consumption Calculation. Available online: http://www.qbj.gov.cn/qbjq/c147040/2021-07/30/c3ebe155d8924056989ce95e027dab3d/files/c18be430ec034c88b6e04cc2ec5bfee9.pdf (accessed on 6 August 2024).
- Enterprises in Other Industries-Greenhouse Gas Emission Accounting Methods and Reporting Guidelines. Available online: https://www.doc88.com/p-11661341808243.html (accessed on 5 June 2024).
- Notice on Doing a Good Job in Greenhouse Gas Emission Re-port Management of Power Generation Enterprises in 2023–2025. Available online: https://www.mee.gov.cn/xxgk2018/xxgk/xxgk06/202302/t20230207_1015569.html (accessed on 5 June 2024).
- Hebei Statistical Yearbook. Available online: http://tjj.hebei.gov.cn/hetj/tjnj/2022/zk/indexch.htm (accessed on 5 June 2024).
- Li, W.; Qi, X.; Zhao, X. Impact of Population Aging on Carbon Emission in China: A Panel Data Analysis. Sustainability 2018, 10, 2458. [Google Scholar] [CrossRef]
- Lugauer, S.; Jensen, R.; Sadler, C. An estimate of the age distribution’s effect on carbon dioxide emissions. Econ. Inq. 2014, 52, 914–929. [Google Scholar] [CrossRef]
- Lanzhou University. Study on the Synergetic Effect of Pollution and Carbon Reduction of Energy Consumption Departments in the Bth Region Based on the LEAP Model; Lanzhou University: Lanzhou, China, 2023. [Google Scholar]
- Environmental Development Center of Ministry of Ecology and Environment and China Environment United Certification Center, “Shared Cycling Pollution Reduction and Carbon Reduction Report”. Available online: http://www.edcmep.org.cn/ywly_14986/hjbzrz/202109/t20210930_955123.shtml (accessed on 16 July 2024).


| Energy Category | Carbon Emission Factor | Unit |
|---|---|---|
| Raw coal | 1.90 | tCO2/tce |
| Other coal washing | 0.88 | tCO2/tce |
| Coal products | 1.85 | tCO2/tce |
| Coke oven gas | 0.86 | tCO2/tce |
| Blast furnace gas | 0.97 | tCO2/tce |
| Other gas | 0.75 | tCO2/tce |
| Gasoline | 2.93 | tCO2/tce |
| Kerosene | 3.03 | tCO2/tce |
| Diesel fuel | 3.10 | tCO2/tce |
| Liquefied petroleum gas | 3.10 | tCO2/tce |
| Natural gas | 1.98 | tCO2/tce |
| Other energy sources | 2.77 | tCO2/tce |
| Heat | 0.11 | tCO2/GJ |
| Electricity | 0.5703 | tCO2/MWh |
| Parameter Category | Scenes | 2021–2025 | 2026–2030 | 2031–2035 | 2036–2040 |
|---|---|---|---|---|---|
| Size of population | Baseline scenario | 0.26% | 0.25% | 0.25% | 0.24% |
| Low-carbon scenario | 0.16% | 0.15% | 0.11% | 0.06% | |
| Ultra-low-carbon scenario | 0.10% | 0.05% | 0.01% | 0.01% | |
| Consumer spending | Baseline scenario | 6.00% | 5.70% | 5.40% | 5.10% |
| Low-carbon scenario | 5.50% | 5.00% | 4.50% | 4.00% | |
| Ultra-low-carbon scenario | 5.40% | 4.90% | 4.40% | 3.90% | |
| Gross production | Baseline scenario | 6.00% | 5.90% | 5.50% | 5.20% |
| Low-carbon scenario | 6.00% | 5.80% | 5.40% | 5.10% | |
| Ultra-low-carbon scenario | 5.90% | 5.70% | 5.30% | 5.00% | |
| Coal | Baseline scenario | 1.64% | 1.30% | 1.10% | 0.80% |
| Low-carbon scenario | −15.00% | −17.00% | −19.00% | −21.00% | |
| Ultra-low-carbon scenario | −16.00% | −18.00% | −20.00% | −22.00% | |
| Oils | Baseline scenario | 1.64% | 1.30% | 1.10% | 0.80% |
| Low-carbon scenario | −3.00% | −3.20% | −3.40% | −3.60% | |
| Ultra-low-carbon scenario | −3.30% | −3.50% | −3.70% | −3.90% | |
| Natural gas | Baseline scenario | 1.64% | 1.30% | 1.10% | 0.80% |
| Low-carbon scenario | 1.86% | −0.05% | −0.10% | −0.20% | |
| Ultra-low-carbon scenario | 1.84% | −0.07% | −0.12% | −0.22% | |
| Electricity | Baseline scenario | 1.64% | 1.30% | 1.10% | 0.80% |
| Low-carbon scenario | 10.00% | 12.00% | 15.00% | 19.00% | |
| Ultra-low-carbon scenario | 9.90% | 11.90% | 14.90% | 18.90% | |
| Heat | Baseline scenario | 1.64% | 1.30% | 1.10% | 0.80% |
| Low-carbon scenario | 3.04% | 3.24% | 3.30% | 3.32% | |
| Ultra-low-carbon scenario | 2.94% | 3.14% | 3.20% | 3.22% |
| Parameter Category | Scenes | 2021–2025 | 2026–2030 | 2031–2035 | 2036–2040 |
|---|---|---|---|---|---|
| Food | Baseline scenario | −2.44% | −1.94% | −1.44% | −0.94% |
| Low-carbon scenario | −2.54% | −2.04% | −1.54% | −1.04% | |
| Ultra-low-carbon scenario | −2.64% | −2.14% | −1.64% | −1.14% | |
| Clothing | Baseline scenario | −8.50% | −6.50% | −4.50% | −2.50% |
| Low-carbon scenario | −8.55% | −6.55% | −4.55% | −2.55% | |
| Ultra-low-carbon scenario | −8.60% | −6.60% | −4.60% | −2.60% | |
| Household Equipment Supplies | Baseline scenario | −2.62% | −2.12% | −1.62% | −1.12% |
| Low-carbon scenario | −2.72% | −2.22% | −1.72% | −1.22% | |
| Ultra-low-carbon scenario | −2.82% | −2.32% | −1.82% | −1.32% | |
| Cultural, Educational, and Entertainment | Baseline scenario | 2.31% | 1.81% | 1.31% | 0.81% |
| Low-carbon scenario | 2.11% | 1.61% | 1.11% | 0.61% | |
| Ultra-low-carbon scenario | 1.96% | 1.46% | 0.96% | 0.46% | |
| Health care | Baseline scenario | −1.04% | −0.84% | −0.64% | −0.44% |
| Low-carbon scenario | −1.07% | −0.87% | −0.67% | −0.47% | |
| Ultra-low-carbon scenario | −1.10% | −0.90% | −0.70% | −0.50% | |
| Living | Baseline scenario | 1.54% | −0.11% | −0.41% | −0.71% |
| Low-carbon scenario | 1.34% | −0.31% | −0.61% | −0.91% | |
| Ultra-low-carbon scenario | 1.29% | −0.36% | −0.66% | −0.96% | |
| Traffic communication | Baseline scenario | 2.15% | 0.45% | −0.55% | −0.85% |
| Low-carbon scenario | 2.00% | 0.30% | −0.70% | −1.00% | |
| Ultra-low-carbon scenario | 1.90% | 0.20% | −0.80% | −1.10% | |
| Other miscellaneous items | Baseline scenario | 10.61% | 6.31% | 2.65% | 0.16% |
| Low-carbon scenario | 8.61% | 5.31% | 1.85% | 0.15% | |
| Ultra-low-carbon scenario | 7.61% | 4.81% | 1.65% | 0.14% |
| Departments | Compile Good Statistical Systems | Compile Poor Statistical Systems | ||
|---|---|---|---|---|
| Investigation | Extrapolation | Investigation | Extrapolation | |
| Main activities’ electricity and heat production | Below 1% | 3–5% | 1–2% | 5–10% |
| Business, institutions, residents’ burning | 3–5% | 5–10% | 10–15% | 15–25% |
| Industrial combustion (energy-intensive industry) | 2–3% | 3–5% | 2–3% | 5–10% |
| Industrial combustion (other) | 3–5% | 5–10% | 10–15% | 15–20% |
| Biomass in small sources | 10–30% | 20–40% | 30–60% | 60–100% |
| Energy Type | The Uncertainty of Average Low Heat | The Uncertainty of Unit Carbon Content Carbon | The Uncertainty of Oxidation Rate | The Uncertainty of the Carbon Emission Coefficient |
|---|---|---|---|---|
| Raw coal | 1% | 3.1% | 2% | 3.82% |
| Other coal washing | 5% | 7.3% | 6% | 10.69% |
| Briquette coal | 5% | 5.0% | 6% | 9.27% |
| Coke oven gas | 1% | 4.6% | 1% | 4.81% |
| Blast furnace gas | 4% | 1.5% | 1% | 4.39% |
| Other gas | 1% | 1.5% | 1% | 2.06% |
| Gasoline | 1% | 1.5% | 2% | 2.69% |
| Kerosene | 1% | 2.0% | 2% | 3.00% |
| Diesel fuel | 1% | 1.5% | 2% | 2.69% |
| Liquefied petroleum gas | 3% | 1% | 2% | 3.38% |
| Natural gas | 1% | 3.6% | 1% | 3.87% |
Disclaimer/Publisher’s Note: The statements, opinions and data contained in all publications are solely those of the individual author(s) and contributor(s) and not of MDPI and/or the editor(s). MDPI and/or the editor(s) disclaim responsibility for any injury to people or property resulting from any ideas, methods, instructions or products referred to in the content. |
© 2024 by the authors. Licensee MDPI, Basel, Switzerland. This article is an open access article distributed under the terms and conditions of the Creative Commons Attribution (CC BY) license (https://creativecommons.org/licenses/by/4.0/).
Share and Cite
Zhang, C.; Yang, W.; Wang, R.; Zheng, W.; Guo, L. Research on Carbon Emissions and Influencing Factors of Residents’ Lives in Hebei Province. Sustainability 2024, 16, 6770. https://doi.org/10.3390/su16166770
Zhang C, Yang W, Wang R, Zheng W, Guo L. Research on Carbon Emissions and Influencing Factors of Residents’ Lives in Hebei Province. Sustainability. 2024; 16(16):6770. https://doi.org/10.3390/su16166770
Chicago/Turabian StyleZhang, Cuiling, Weihua Yang, Ruyan Wang, Wen Zheng, and Liying Guo. 2024. "Research on Carbon Emissions and Influencing Factors of Residents’ Lives in Hebei Province" Sustainability 16, no. 16: 6770. https://doi.org/10.3390/su16166770
APA StyleZhang, C., Yang, W., Wang, R., Zheng, W., & Guo, L. (2024). Research on Carbon Emissions and Influencing Factors of Residents’ Lives in Hebei Province. Sustainability, 16(16), 6770. https://doi.org/10.3390/su16166770